crystal city metrorail station access study
TRANSCRIPT

CRYSTAL CITY METRORAIL STATION ACCESS STUDY
Eisenhower Ave
King Street
Braddock Road
Ronald Reagan WashingtonNational Airport
Pentagon City
Pentagon
Cryst
al City
Van Dorn Street
BLUE LINE Alexandria
Alexa
ndria
Arlington County
Fairfax County
YELLOW L
INE
Anacost
ia R
iver
Eisenhower Ave
King Street
Braddock Road
Ronald Reagan WashingtonNational Airport
Pentagon City
Pentagon
Cryst
al City
Van Dorn Street
BLUE LINE Alexandria
Alexa
ndria
Arlington County
Fairfax County
YELLOW L
INE
Anacost
ia R
iver
Prepared for Arlington County, Virginia by
Washington Metropolitan Area Transit Authority Department of Capital Projects Management
June 2002

CRYSTAL CITY METRORAIL STATION ACCESS STUDY
i
Contents Introduction ......................................................................................................................1
Objective................................................................................................................................. 1
Existing Conditions..........................................................................................................1 Transportation Facilities.......................................................................................................... 1 Bus Service ............................................................................................................................ 4 Station-Area Problems............................................................................................................ 4 Other Studies.......................................................................................................................... 4 Traffic and Pedestrian Studies................................................................................................ 4 Customer Survey.................................................................................................................... 6 Customer Patterns.................................................................................................................. 7
Development Forecast...................................................................................................10 Development Sites ............................................................................................................... 10 Metrorail Customer Forecast ................................................................................................ 10
Planned Station-Area Improvements ...........................................................................13 Community Involvement................................................................................................14 Station-Area Recommendations...................................................................................14
Station Entrance Identification .............................................................................................. 14 Pedestrian Facilities ............................................................................................................. 14 Bicycle Facilities ................................................................................................................... 15
Potential New Station Entrances ..................................................................................15 Proposed Entry..................................................................................................................... 17 Alternate Entry...................................................................................................................... 18
Internal Station Improvements......................................................................................19
Note: The report has been prepared to demonstrate the feasibility of the concepts presented. The concept is subject to further refinement and may be revised during future planning and/or engineering design phases of the project. The environmental planning process may include one or more of these alternatives along with others prior to any decision regarding implementation of a specific plan, which will be subject to professional engineering design principles.
Figures Figure 1: Aerial Photograph of Station Vicinity............................................................................ 1 Figure 2: Schematic Diagram of Station Vicinity ......................................................................... 2 Figure 3: Customer Entries and Exits in 30-minute Intervals ...................................................... 3 Figure 4: Extent of Crystal City Underground.............................................................................. 3 Figure 5: Summary of Pedestrian and Bicycle Count Results..................................................... 5 Figure 6: Survey Card................................................................................................................. 6 Figure 7: Mapped Origins of Morning Peak Hour Walking Trips ................................................. 8 Figure 8: Mapped Origins of Evening Peak Hour Walking Trips ................................................. 9 Figure 9: Existing Bus Waiting Area.......................................................................................... 13 Figure 10: Proposed New Bus Waiting Area............................................................................. 13 Figure 11: Sidewalk on the South Side of 18th Street East of Clark Place ................................ 13 Figure 12: Existing Station Entrance Landscaping.................................................................... 14 Figure 13: 18th Street Pedestrian Route Under Route 1 Overpass ........................................... 14 Figure 14: Existing Walking Route North of Escalators............................................................. 14 Figure 15: Existing Bicycle Parking........................................................................................... 15 Figure 16: Potential New Entrance Locations ........................................................................... 16 Figure 17: Site of Proposed Entry Escalatorway....................................................................... 17 Figure 18: Site of Alternate Entry Escalatorway........................................................................ 18 Figure 19: Potential Interior Crystal City Station Improvements................................................ 19 Figure 20: Street-Level Plan View of Proposed Improvements................................................. 20 Figure 21: Elevation View of Proposed Improvements ............................................................. 21
Tables Table 1: Results of 24-Hour Directional Traffic Volume Counts.................................................. 4 Table 2: Peak-Hour Turning Movement Counts and Levels of Service....................................... 5 Table 3: Counts of Pedestrians and Bicyclists ............................................................................ 5 Table 4: Respondents’ Transportation Modes ............................................................................ 7 Table 5: Respondents’ Trip Purposes......................................................................................... 7 Table 6: Origins of Morning Peak Hour Walking Trips ................................................................ 8 Table 7: Origins of Evening Peak Hour Walking Trips ................................................................ 9 Table 8: Customer Entries, 2001 and 2020 .............................................................................. 10 Table 9: 2020 Development Forecast for Crystal City Station Area .......................................... 11 Table 10: Net Change in Pedestrian Station Entries Attributable to New Development............ 12 Table 11: Predicted 2020 Pedestrian Customer Station Entries ............................................... 12 Table 12: Forecast of Station Entries in 2020 ........................................................................... 17 Table 13: Cost Estimate for Proposed Entry............................................................................. 18

CRYSTAL CITY METRORAIL STATION ACCESS STUDY
1
Introduction
Crystal City is a high-density, multi-use neighborhood in southeast Arlington County, Virginia. It is located between the Pentagon and Ronald Reagan Washington National Airport, just minutes from Washington, D.C. Its proximity to these major centers of activity makes its location desirable for residents and businesses. Crystal City is home to over 12,000 residents and swells with over 50,000 employees on weekdays. The Crystal City Metrorail station serves Blue and Yellow Line trains on the Metrorail system operated by the Washington Metropolitan Area Transit Authority (WMATA). Figure 1 is an aerial photograph of the station area; a schematic diagram of the station area is shown in Figure 2.
Objective
The Metrorail Station Access Study was conducted for WMATA and Arlington County, with a goal of generally maximizing the attractiveness of Metrorail to the Crystal City area. The study objective was to identify and evaluate specific station and area improvements to improve convenience and safety in accessing the station for customers of all modes. The access improvements proposed in the study include additional station entrances and mezzanines, improved traffic conditions on adjacent streets, and improved connections between Metrobus and Metrorail.
Existing Conditions
Transportation Facilities
Jefferson Davis Highway (U.S. Route 1), a north-south highway, passes through Crystal City on its way between Interstate 395 on the north and the City of Alexandria on the south. In addition to Jefferson Davis Highway, Crystal City’s street network consists primarily of a one-way pair of streets, Crystal Drive for northbound traffic and Clark Street for southbound traffic. Several east-west cross streets connect these one-way streets. The area’s streets are generally sufficient to accommodate existing traffic volumes. The use of one-way streets helps minimize conflicts at intersections and smooth traffic flow.
Figure 1: Aerial photograph of Crystal City Metrorail Station vicinity
15TH ST
18TH ST
12TH ST
FER
N S
T
EA
DS
ST
CR
YS
TA
L D
R
INTERSTATE 395
JEF
FE
RS
ON
DA
VIS
HW
Y
ARMY NAVY DR
HA
YE
S S
T
15TH ST
18TH ST
12TH ST
FER
N S
T
EA
DS
ST
CR
YS
TA
L D
R
INTERSTATE 395
JEF
FE
RS
ON
DA
VIS
HW
Y
ARMY NAVY DR
HA
YE
S S
T
15TH ST
18TH ST
12TH ST
FER
N S
T
EA
DS
ST
CR
YS
TA
L D
R
INTERSTATE 395
JEF
FE
RS
ON
DA
VIS
HW
Y
ARMY NAVY DR
HA
YE
S S
T
15TH ST
18TH ST
12TH ST
FER
N S
T
EA
DS
ST
CR
YS
TA
L D
R
INTERSTATE 395
JEF
FE
RS
ON
DA
VIS
HW
Y
ARMY NAVY DR
HA
YE
S S
T
Crystal City
Pentagon City
Crystal City
Pentagon City
Crystal City
Pentagon City
Crystal City
Pentagon City

CRYSTAL CITY METRORAIL STATION ACCESS STUDY
2
Figure 2: Schematic diagram of Crystal City Metrorail Station and vicinity

CRYSTAL CITY METRORAIL STATION ACCESS STUDY
3
However, the street network can be confusing to some drivers, especially those unfamiliar with the area. Crystal City boasts a high transit mode share and large number of transit customers. The Metrorail station entrance is centrally located in the area, conveniently near many large residential, office, and retail centers. In 2001, an average of 28,000 customers entered or exited the Crystal City Metrorail station each weekday, making it the 12th busiest of the 83 stations in the Metrorail system by customer volume. Figure 3 shows customer entries and exits at the Crystal City station in half-hour increments. A distinctive element of Crystal City is its network of underground pedestrian walkways, the Crystal City Underground, that connect most major buildings in the Crystal City core. The walkways connect 12th Street on the north with 23rd Street on the south, a distance of nearly three-fourths of a mile. Walkways also connect the Crystal Gateway Marriott, west of the Jefferson Davis Highway, and Crystal Park, east of Crystal Drive. The Underground intersects the existing Metrorail station entrance, allowing Metrorail customers to access much of Crystal City in a climate-controlled environment. The Underground significantly enhances access to the existing station entrance. A diagram showing the limits of the Underground is presented in Figure 4.
Figure 3: Crystal City Station customer entries and exits in 30-minute intervals
0
200
400
600
800
1000
1200
1400
5:00
a.m
.
6:00
a.m
.
7:00
a.m
.
8:00
a.m
.
9:00
a.m
.
10:0
0 a.
m.
11:0
0 a.
m.
12:0
0 p.
m.
1:00
p.m
.
2:00
p.m
.
3:00
p.m
.
4:00
p.m
.
5:00
p.m
.
6:00
p.m
.
7:00
p.m
.
8:00
p.m
.
9:00
p.m
.
10:0
0 p.
m.
11:0
0 p.
m.
Time of day
Pas
sen
ger
s p
er 3
0-m
inu
te p
erio
d Station EntriesStation Exits
Source: WMATA, Faregate data, September 26, 2001
Figure 4: Extent of Crystal City Underground
Source: crystalcity.com

CRYSTAL CITY METRORAIL STATION ACCESS STUDY
4
Bus Service
Most buses serve the station from Clark Place north of 18th Street, underneath the Crystal Square 5 office building. The station is served by four Metrobus lines, a Fairfax Connector line, two Omniride lines, Arlington Transit (ART) buses, and several private shuttles. Crystal City is also a stop on the Virginia Railway Express (VRE) commuter rail lines to both Manassas and Fredericksburg.
Station-Area Problems
Unfortunately, the Underground is not fully accessible for disabled pedestrians. The Metrorail station’s mezzanine-to-street elevator does not stop at the Underground level. Customers who are unable to use the station escalator must take the elevator to street level, where they are subject to weather conditions and conflict with vehicles en route to their final destination. The Underground is an excellent pedestrian facility, but street-level pedestrian amenities are not as friendly, important for customers whose destinations are not served by the Underground. Crosswalks are long because of the wide streets, sidewalks are narrow in several locations, and the walking route along 18th Street under Jefferson Davis Highway is unappealing for pedestrians. Bicycle parking facilities are also substandard. The Metrorail station entrance is not as convenient for customers transferring from VRE as it could be. These customers must walk as far west as Clark Place in order to enter the station, even though the platform extends as far east as Crystal Drive. Customers unfamiliar with the area may have difficulty locating the Metrorail station entrance. The escalators are obscured from view by landscaping and there is little signing to help direct customers to either the escalators or the elevator.
Traffic and Pedestrian Studies
As part of the study, vehicle and pedestrian travel patterns were documented through several different types of studies. Table 1 summarizes the results of 24-hour directional traffic volume counts in the vicinity of the station.
Table 1: Results of 24-hour directional traffic volume counts
Number of vehicles during peak hour
8:00 – 9:00 a.m. 5:00 – 6:00 p.m.
Number of vehicles per day
Study location EB WB Total EB WB Total EB WB Total
18th St. east of Eads St. 537 89 626 208 220 428 4,382 1,882 6,624
18th St. west of Crystal Dr.
1,110 NA 1,110 456 NA 456 9,508 NA 9,508
15th St. east of Clark St.
628 174 802 1,276 78 1,354 11,876 1,559 13,435
NB SB Total NB SB Total NB SB Total
Eads St. south of 18th Street 566 550 1,116 586 790 1,376 8,830 10,349 19,179
Clark Pl. south of 18th St.
36 118 154 68 128 196 785 1,777 2,562
Clark Pl. north of 18th St.
NA 601 601 NA 337 337 NA 5,933 5,933
Crystal Dr. north of 18th St.
1,086 NA 1,086 1,702 NA 1,702 17,042 NA 17,042
Clark St. south of 15th St.
NA 175 175 NA 308 308 NA 3,887 3,887
Source: Traffic studies conducted by CTC, May 2001

CRYSTAL CITY METRORAIL STATION ACCESS STUDY
5
Table 2 summarizes the results of peak-period manual turning-movement counts at three nearby intersections, and shows the results of detailed capacity analysis conducted at these intersections, following procedures outlined in the Highway Capacity Manual. The analysis showed that traffic conditions are good during both morning and afternoon peak periods. Table 3 presents the results of counts of pedestrians and bicyclists conducted near the station; Figure 5 summarizes some of the data in Table 3. The existence of the Underground greatly
limits conflicts between pedestrians, bicycles, and vehicles, but as shown in Table 3, there is a high volume of pedestrians using street-level pedestrian facilities as well. By far the single intersection with the most pedestrian activity is Clark Place and 18th Street, which serves over 800 pedestrians per hour during the evening peak.
Table 3: Counts of pedestrians and bicyclists near the Crystal City Metrorail Station
Proceeding toward Metrorail escalators Proceeding away from
Metrorail escalators
Customer Pattern Morning peak hour
Evening peak hour
Morning peak hour
Evening peak hour
Pedestrians crossing Clark Pl. and 18th St. 74 712
314 111
Pedestrians using the Mount Vernon Connector Multi-Use Path
11 28
9 37
Bicyclists using the Mount Vernon Connector Multi-Use Path
15 16
8 25
Customers transferring between Metrorail and Metrobus
23 1
10 15
Customers transferring between Metrorail and ART buses
9 4
53 7
Customers transferring between Metrorail and private shuttles
19 25
11 22
Source: Traffic studies conducted by CTC, May 2001
Table 2: Number of peak-hour vehicles making each traffic movement at three station-area intersections; levels of service
Morning peak hour Evening peak hour
Northbound Southbound Eastbound Westbound Northbound Southbound Eastbound Westbound
Level of service
Intersection L T R L T R L T R L T R L T R L T R L T R L T R AM PM
18th St. and Eads St. 81 398 65 75 317 22 82 361 271 26 8 14 188 414 36 49 351 30 53 100 250 33 43 17 B B
18th St. and Clark Pl. NA NA 30 555 NA 37 NA 434 103 NA NA NA NA NA 82 180 NA 102 NA 126 75 NA NA NA A A
18th St. and Crystal Dr. NA 721 9 NA NA NA 330 6 NA NA NA NA NA 1,078 3 NA NA NA 557 34 NA NA NA NA B B
Source: Traffic studies conducted by CTC, May 2001
Figure 5: Summary of pedestrian and bicycle count results (AM/PM)

CRYSTAL CITY METRORAIL STATION ACCESS STUDY
Customer Survey
In an effort to learn about customers’ travel patterns, a customer survey was conducted at the Crys l City station on September 26, 2001. All customers entering the station that day from 6:30 o 8:30 a.m. and 4:00 to 6:00 p.m. were offered a survey card, which asked several que ions about customers’ trips to the station. The survey card is shown in Figure 6. The surv y posed questions about mode of travel to the station, trip purpose, and origin of the trip to the ation. Cus mers exiting the station were not surveyed; it was assumed that customers entering the stat n during the morning peak would likely exit the station during the evening peak, and vice-vers . The urvey was conducted about two weeks after the events of September 11, 2001. Tourist traff was much lower than usual on the date of the survey; however, the main focus of the surv y was on commuters, and faregate data indicates that commuter traffic had returned to typi l levels by September 26. Of c stomers who received survey cards in the morning, 461 filled out and returned the cards, a 13 p rcent sample of the total morning peak station volume of 3,420 customers. The response rate sults in a confidence interval of 5 percentage points at the 95 percent confidence level. Bas on the results of the survey, one can be 95 percent confident that the percentages from the orning survey are within 5 percentage points of their true values. The morning peak surv y’s level of confidence is sufficient for analysis. Of c stomers who received survey cards in the evening, 821 filled out and returned the cards. Abo 6,740 customers enter the station during the evening peak period, so the evening survey gen ated a response rate of 12 percent. At the 95 percent confidence level, the confidence inte al from the evening survey is 4 percent. One can be 95 percent confident that the perc ntages from the evening survey are within 4 percentage points of their true values. Again, the ening peak survey’s confidence level is sufficient for analysis.
Figure 6: Survey card distributed to customers entering the Crystal City Metrorail Station
ARLINGTON METRO STATION SURVEY
Please take a few moments to help plan for your transit needs by completing this survey and dropping it in any mailbox. No postage is required. Thank you. A. How did you get to the Metrorail station where you received this card?
1 VRE 2 Walk 3 Shuttle bus 4 Bicycle 5 Tour bus 6 Taxi 7 ART bus 8 Metrobus (Route: _____) 9 Fairfax Connector (Route: ____)
10 Dropped off by someone 11 Drove a car and parked 12 Rode with someone who parked
B. What is the purpose of your Metrorail trip today?
1 Traveling to work 2 Traveling home from work 3 Job-related business 4 Shopping or meal 5 School 6 Personal trip 7 Sightseeing or recreation
C. Where did you start your trip to the Metrorail station today?
Address
OR Street & block no.
OR Nearest intersection OR Building name
ta t
stest
toioa
sice
ca
ue reedme
uuterrveev
6

CRYSTAL CITY METRORAIL STATION ACCESS STUDY
7
Customer Patterns
The data-collection efforts revealed numerous patterns about customers’ trips to and from the station. The first question on the survey asked customers about the mode of transportation they used to arrive at the station. In both the morning and evening periods, walking is the dominant mode, accounting for 63 percent of morning peak trips and 75 percent of evening peak trips. The large volume of pedestrians would normally raise concerns about interactions with vehicles, but about two-thirds of pedestrians use the underground walkways, vastly reducing conflicts with vehicles.
Notably, 11 percent of morning-peak customers arrive via VRE. VRE transfer customers generally walk from the VRE station to the Metrorail station, a distance of approximately one-eighth mile. Customers can opt to use the Underground for part of this walk. Despite the large number of bus routes that serve the station, few Metrorail customers use a bus as part of their trips: seven percent in the morning peak and ten percent in the evening peak. Four percent of respondents in the morning peak and seven percent in the evening peak indicated that they drove to the station and parked. Crystal City is not an ideal commuter park-and-ride location, but there is some public parking in garages near the station. Complete results of the first survey question are summarized in Table 4. The second question on the survey asked about customers’ trip purpose. Here, a clear differentiation exists between morning and evening periods. In the morning period, 90 percent of respondents were traveling to work, with other trip purposes garnering negligible responses. As expected, most evening-peak customers, 74 percent, were traveling home from work, but an additional 20 percent were destined for work. Commute trips to and from work account for over 90 percent of customer traffic in both peak periods. Table 5 displays complete results of this question.
Table 4: Respondents’ transportation modes. (Rounding may affect sums.)
Morning Peak Evening Peak
Transportation Mode Percent of
respondents Number of customers*
Percent of respondents
Number of customers*
Virginia Rail Express 11% 371 0% 49
Walk 63% 2,145 75% 5,083
Shuttle Bus 1% 22 3% 123
Bicycle 1% 22 0% 16
Taxi 0% 7 0% 0
ART bus 0% 7 1% 41
Metrobus 6% 215 3% 214
Fairfax Connector 0% 15 4% 156
Dropped off by someone 7% 230 3% 123
Drove and parked 4% 148 7% 468
Rode with someone who parked 2% 59 0% 16
No response 7% 178 8% 452
Total 100% 3,421 100% 6,742
* Calculated by applying the survey results to the total number of customers entering the station during morning (5:30 to 9:30 a.m.) and evening (3:00 to 7:00 p.m.) peak periods.
Table 5: Respondents’ trip purposes. (Rounding may affect sums.)
Morning Peak Evening Peak
Trip Purpose Percent of
respondents Number of customers*
Percent of respondents
Number of customers*
Traveling to work 90% 3,087 20% 1,339
Traveling home from work 0% 7 74% 4,985
School 2% 74 1% 66
Job-related business 6% 208 3% 197
Shopping or meal 0% 0 1% 66
Personal trip 0% 15 1% 57
Sightseeing or recreation 1% 22 0% 16
No response 0% 7 0% 16
Total 100% 3,421 100% 6,742
* Calculated by applying the survey results to the total number of customers entering the station during morning (5:30 to 9:30 a.m.) and evening (3:00 to 7:00 p.m.) peak periods.

CRYSTAL CITY METRORAIL STATION ACCESS STUDY
8
Finally, the third question on the survey asked customers where they began their trips to the Metrorail station. Customers were given the option to respond with a specific street address, a street and block number, the nearest intersection, or a building name. Although results are available to this question from all respondents, respondents who walk to the station are particularly important for planning pedestrian improvements. In the morning peak period, when most customers entering the station are area residents enroute to work, 269 respondents (63 percent) indicated that they walk to the station. Figure 7 shows in map form the origins of these pedestrian customers’ trips to the station. The trips are summarized by distance and direction in Table 6. Analyzing the results by distance shows that over 95 percent of pedestrians walk less than a half-mile to reach the Metrorail station. From a directional standpoint, the results show that the majority of customers arrive from the north of the station, fewer from the south and west, and virtually none from the east.
Table 6: Origins of Morning Peak Walking Trips. Pedestrians whose morning-peak trips to the station originate from each of the zones shown in Figure 7. (Rounding may affect sums.)
Percent of respondents Number of customers* Distance from station North South East West Total North South East West Total
0 to 1/8 mile 7% 3% 0% 1% 11% 144 56 0 32 231
1/8 to 1/4 mile 0% 18% 0% 19% 37% 0 391 0 399 789
1/4 to 3/8 mile 35% 0% 0% 3% 38% 757 0 0 56 813
3/8 to 1/2 mile 6% 0% 0% 4% 10% 120 8 0 80 207
1/2 to 5/8 mile 0% 0% 0% 0% 0% 0 0 0 8 8
5/8 to 3/4 mile 0% 0% 0% 0% 0% 0 0 0 0 0
3/4 to 7/8 mile 0% 0% 0% 1% 1% 0 0 0 24 24
7/8 to 1 mile 0% 0% 0% 0% 0% 0 0 0 0 0
1 to 1-1/8 miles 0% 0% 0% 0% 0% 0 0 0 0 0
Over 1-1/8 miles 0% 3% 0% 0% 3% 8 56 8 0 72
Total 48% 24% 0% 28% 100% 1,029 510 8 598 2,145 * Calculated by applying the survey results to the number of customers who walk to the station during the morning peak period (5:30 to 9:30 a.m.), as determined in Table 4. Note: Anomalous data may be the result of inaccurate information provided on survey cards or imprecise geolocation of respondents who provided only the location of the nearest intersection to their trip origin.
Figure 7: Origins of morning-peak pedestrian trips to the Crystal City Station
Sources: Arlington County, Census Bureau

CRYSTAL CITY METRORAIL STATION ACCESS STUDY
9
In the evening peak period, when most customers entering the station are area employees enroute home from work, 509 survey respondents indicated that they walk to the station. Figure 8 shows in map form the origins of these customers’ trips to the station, and their trips are summarized by distance and direction in Table 7. In the evening peak, over 75 percent of customers walk less than a half-mile to reach the station, slightly less than the morning peak. Directional distribution is similar to the morning peak, but in the evening peak, nearly half of all customers arrive from the south of the station. Customers arriving from the north and south remain much more prevalent than those from the east and west. Data from non-pedestrian customers was analyzed for both morning and evening peak periods, but no significant pattern of trip origins was found.
Table 7: Origins of Evening Peak Walking Trips. Pedestrians whose morning-peak trips to the station originate from each of the zones shown in Figure 8. (Rounding may affect sums.)
Percent of respondents Number of customers* Distance from station North South East West Total North South East West Total
0 to 1/8 mile 9% 17% 9% 3% 38% 479 879 449 140 1,947
1/8 to 1/4 mile 0% 13% 0% 1% 14% 10 649 0 40 699
1/4 to 3/8 mile 7% 11% 0% 0% 19% 369 559 0 20 949
3/8 to 1/2 mile 5% 0% 0% 0% 5% 240 10 0 0 250
1/2 to 5/8 mile 2% 0% 0% 0% 3% 110 20 0 0 130
5/8 to 3/4 mile 1% 0% 0% 0% 1% 40 0 0 0 40
3/4 to 7/8 mile 0% 0% 0% 0% 0% 0 0 0 0 0
7/8 to 1 mile 0% 0% 0% 0% 0% 0 0 0 0 0
1 to 1-1/8 miles 3% 3% 2% 4% 13% 160 150 110 220 639
Over 1-1/8 miles 4% 2% 1% 2% 8% 190 80 70 90 429
Total 31% 46% 12% 10% 100% 1,597 2,347 629 509 5,083 * Calculated by applying the survey results to the number of customers who walk to the station during the morning peak period (5:30 to 9:30 a.m.), as determined in Table 4. Note: Anomalous data may be the result of inaccurate information provided on survey cards or imprecise geolocation of respondents who provided only the location of the nearest intersection to their trip origin.
Figure 8: Origins of evening-peak pedestrian trips to the Crystal City Station
Sources: Arlington County, Census Bureau

CRYSTAL CITY METRORAIL STATION ACCESS STUDY
10
Development Forecast
Development Sites
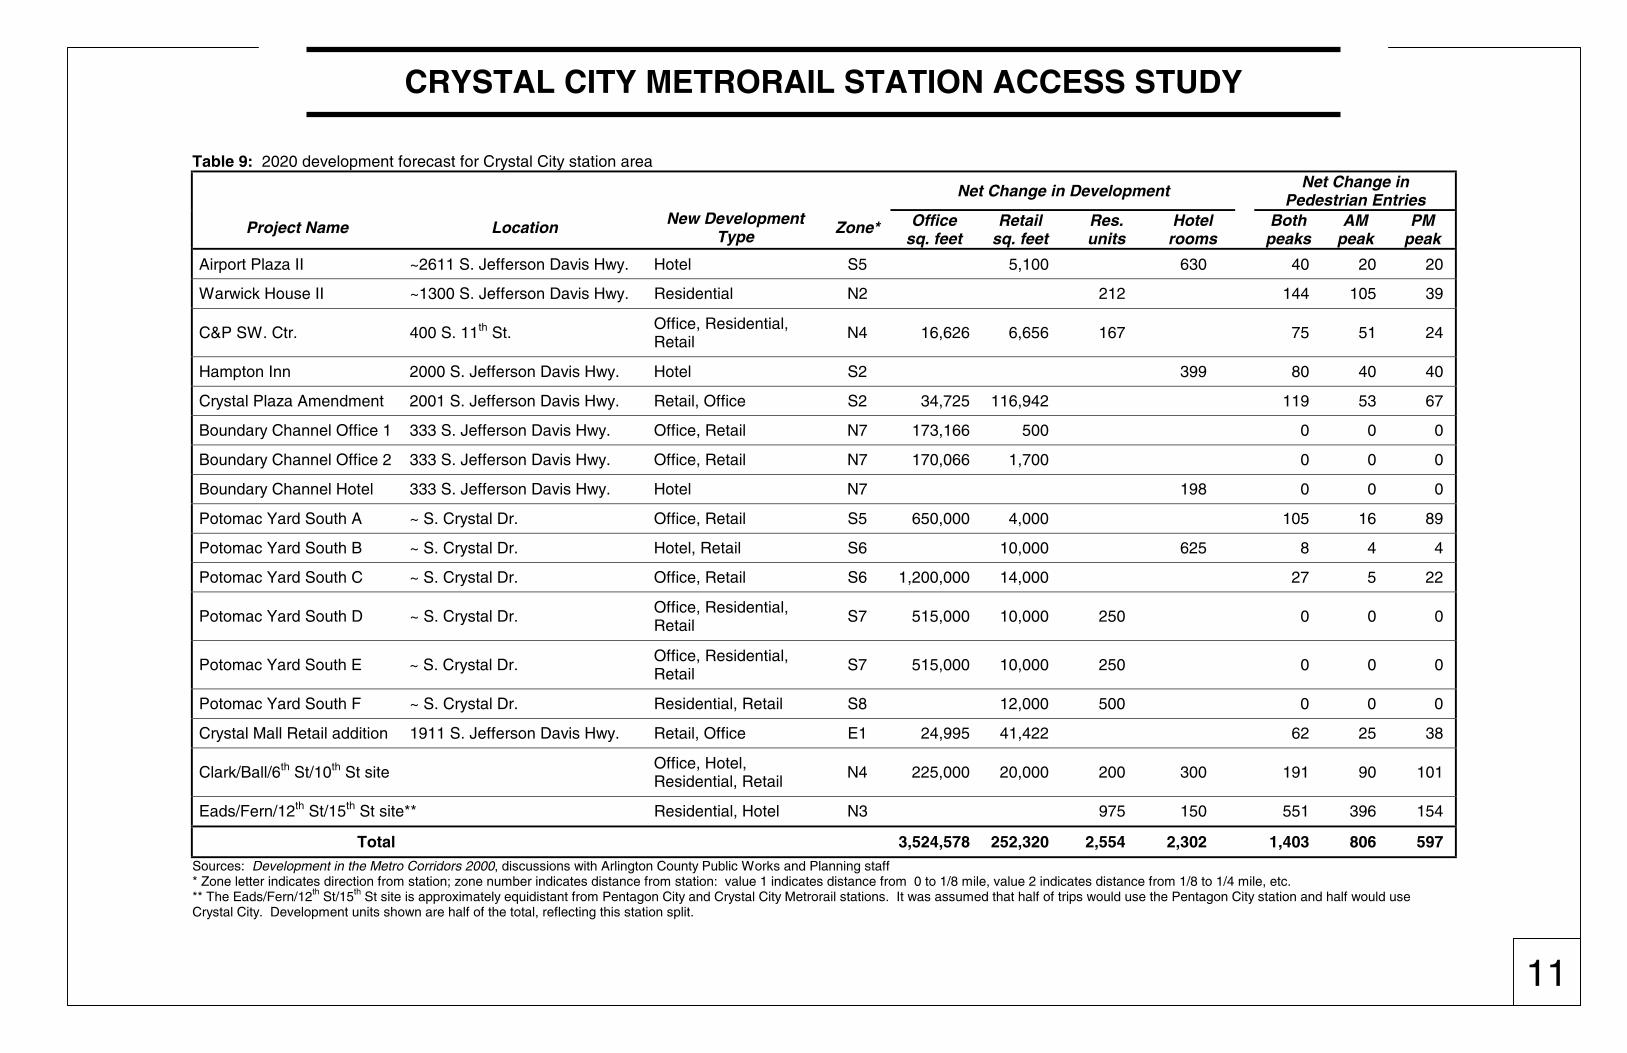
The Crystal City neighborhood features a mix of uses in a community of over 6,000 residential units, 5,000 hotel rooms, 800,000 square feet of retail space, and 10 million square feet of office space. The central location and convenient multi-modal transportation options create the potential for growth in the area. Growth in Metrorail ridership by 2020 will depend largely on development changes in the immediate vicinity of the station. Development in the Metro Corridors 2000, a report published by the Arlington County Department of Community Planning, Housing and Development, was utilized to determine the existing development on the parcels near the Crystal City station. The report also provided specific information about new development planned for the area. Longer-term development forecasts, including parcels not listed in Development in the Metro Corridors, were prepared based on discussions with staff from the Arlington County Departments of Public Works and Community Planning, Housing, and Development. Table 9 summarizes the specific development assumptions for parcels where development is likely to occur prior to 2020. Future Metrorail trips were projected according to these development assumptions.
Metrorail Customer Forecast
WMATA recently conducted a Core Capacity Study (CCS) to evaluate the capacity at key Metrorail stations, including Crystal City. The study shows that Metrorail volume at Crystal City will reach about 18,500 entries per weekday by the year 2020, a 42 percent increase over 2001 volumes. However, the CCS did not account for the possibility of light-rail transit (LRT) or bus rapid transit (BRT) service in the vicinity of the station. Preliminary calculations provided by the Virginia Department of Rail and Public Transportation (VDRPT) show that by the year 2020, approximately 7,400 customers per weekday would enter LRT or BRT vehicles at Crystal City and an equal number would exit at Crystal City. WMATA projects that approximately 34 percent
of these customers would transfer to or from Metrorail, accounting for approximately 2,500 transfer customers per weekday to Metrorail and an additional 2,500 transfer customers from Metrorail to LRT or BRT vehicles. Customers transferring from VRE to Metrorail are also forecast to increase. VRE provided a forecast of the number of passengers transferring from VRE to Metrorail at Crystal City. The number of transfers in the morning peak hour is expected to increase from 1,500 per day in 2001 to approximately 2,300 per day in 2010, the only year for which data is available. Table 8 presents existing and future customer volume forecasts for the year 2020, which are the sum of CCS projections and the LRT forecast. These volumes represent total station patronage, but it is also important to separately evaluate the growth in pedestrian customers. Generally, the route used by non-pedestrian customers to reach the station entrance is relatively insensitive to minor changes in the location of the entrance. For example, if a customer is being dropped off at the station entrance, it makes little difference whether the station entrance is moved one block closer to the customer’s trip origin: the customer’s time savings is very small. In contrast, pedestrians travel much slower than other modes, and shortening a pedestrian customer’s walk by one block is a significant improvement that can save several minutes of the customer’s time. Two sources of information were used to forecast the numbers of Metrorail customers who would walk from future developments. One was the results of the survey in the current study; the other was Development Related Ridership Survey II, a 1989 WMATA study that estimated transit mode share based on a larger sample of Metrorail customers. The recent survey data collected for this report were used to relate present customers to existing buildings. For each 1/8-mile distance from the station, a ratio of peak-period customers per 1,000 square feet of building size was developed. The ratios were generally similar to those produced by the 1989 survey. For each 1/8-mile distance, a ratio to be used in the study was determined by drawing a best-fitting line between the means of the ratios calculated from the two surveys. The final ratio would produce an estimate of additional customers from new developments, given assumptions about the sizes of the developments drawn from Development in the Metro Corridors 2000. Direction from the station was also considered. At the Crystal City station, the Underground is available to the north and south of the station; as a result, more customers are likely to walk to the Metrorail station than the ratio suggests from the north and south. Directional factors were likewise assigned for each of the four cardinal directions.
Table 8: Customer entries and exits, 2001 and 2020
Entering Customers
2001 2020*
Percent Increase
AM Peak period (5:30 – 9:30 a.m.) 3,600 5,400 50%
PM Peak period (3:00 – 7:00 p.m.) 6,700 10,200 52%
Daily 14,000 21,000 50%
* 2020 customer forecasts include 2,500 daily customer entries attributable to LRT transfer customers. Sources: CCS, WMATA faregate data, VDRPT LRT/BRT forecast
CRYSTAL CITY METRORAIL STATION ACCESS STUDY
11
Table 9: 2020 development forecast for Crystal City station area
Net Change in Development Net Change in Pedestrian Entries
Project Name
Location
New Development Type
Zone* Office sq. feet
Retail sq. feet
Res. units
Hotel rooms
Both peaks
AM peak
PM peak
Airport Plaza II ~2611 S. Jefferson Davis Hwy. Hotel S5 5,100 630 40 20 20
Warwick House II ~1300 S. Jefferson Davis Hwy. Residential N2 212 144 105 39
C&P SW. Ctr. 400 S. 11th St. Office, Residential, Retail
N4 16,626 6,656 167 75 51 24
Hampton Inn 2000 S. Jefferson Davis Hwy. Hotel S2 399 80 40 40
Crystal Plaza Amendment 2001 S. Jefferson Davis Hwy. Retail, Office S2 34,725 116,942 119 53 67
Boundary Channel Office 1 333 S. Jefferson Davis Hwy. Office, Retail N7 173,166 500 0 0 0
Boundary Channel Office 2 333 S. Jefferson Davis Hwy. Office, Retail N7 170,066 1,700 0 0 0
Boundary Channel Hotel 333 S. Jefferson Davis Hwy. Hotel N7 198 0 0 0
Potomac Yard South A ~ S. Crystal Dr. Office, Retail S5 650,000 4,000 105 16 89
Potomac Yard South B ~ S. Crystal Dr. Hotel, Retail S6 10,000 625 8 4 4
Potomac Yard South C ~ S. Crystal Dr. Office, Retail S6 1,200,000 14,000 27 5 22
Potomac Yard South D ~ S. Crystal Dr. Office, Residential, Retail
S7 515,000 10,000 250 0 0 0
Potomac Yard South E ~ S. Crystal Dr. Office, Residential, Retail
S7 515,000 10,000 250 0 0 0
Potomac Yard South F ~ S. Crystal Dr. Residential, Retail S8 12,000 500 0 0 0
Crystal Mall Retail addition 1911 S. Jefferson Davis Hwy. Retail, Office E1 24,995 41,422 62 25 38
Clark/Ball/6th St/10th St site Office, Hotel, Residential, Retail
N4 225,000 20,000 200 300 191 90 101
Eads/Fern/12th St/15th St site** Residential, Hotel N3 975 150 551 396 154
Total 3,524,578 252,320 2,554 2,302 1,403 806 597 Sources: Development in the Metro Corridors 2000, discussions with Arlington County Public Works and Planning staff * Zone letter indicates direction from station; zone number indicates distance from station: value 1 indicates distance from 0 to 1/8 mile, value 2 indicates distance from 1/8 to 1/4 mile, etc. ** The Eads/Fern/12th St/15th St site is approximately equidistant from Pentagon City and Crystal City Metrorail stations. It was assumed that half of trips would use the Pentagon City station and half would use Crystal City. Development units shown are half of the total, reflecting this station split.

CRYSTAL CITY METRORAIL STATION ACCESS STUDY
12
The methodology produced a single value for pedestrian customers approaching the station from each new development during the four-hour morning peak period and the four-hour evening peak period combined. These values were allocated to the morning versus evening peak periods using ratios from ITE’s Trip Generation, 6th edition. Specifically, 85 percent of trips generated by office developments were assumed to enter the station during the evening peak period, while only 15 percent of these trips were assumed to enter during the morning peak period. Likewise, 73 percent of residential trips were assumed to enter the station during the morning peak period, and the remaining 27 percent were assumed to enter during the evening peak period. Trips from retail and hotel land uses were assumed to be equally split between morning and evening peak periods. The final columns of Table 9 indicate the number of new pedestrian Metrorail customers forecast to enter the Crystal City station during morning and evening peak periods for each new development. Table 10 aggregates the values from these two columns by 1/8-mile distance away from the station and by direction from the station. The distance and direction intervals in Tables 10 and 11 correspond to the intervals used in Figures 7 and 8. Table 11 shows the total number of pedestrian customer entries expected in the year 2020. These values were computed by adding current pedestrian flows (Tables 6 and 7) to pedestrian flows generated by new development (Table 10). The forecast calls for an increase of about 800 pedestrian trips entering the station during the morning peak period, about 37 percent more pedestrian trips than in 2001. In the evening peak period, about 600 pedestrian trips entering the station will be generated by new development, an increase of about 12 percent over existing pedestrian trips. Much of the new development in the Crystal City area is farther than a comfortable walking distance away from the Metrorail station entrance—nearly one mile in the case of both the Potomac Yard and Boundary Channel developments. At this distance, virtually no Metrorail customers would be expected to walk to the station entrance; instead, these customers would likely be dropped off, either by a private automobile or by public transit such as ART bus or future LRT service. Nearly 90 percent of new pedestrian trips are attributable to new development within a half mile of the station. New development is concentrated primarily to the north and south of the station. Development in these two compass directions accounts for 95 percent of new pedestrian trips. The Potomac River lies east of the station, limiting development potential, and west of the station lies low-density residential neighborhoods unlikely to change in character. The proximity of the Pentagon City Metrorail Station further limits Crystal City’s customer volume from the northwest.
Table 11: Predicted 2020 pedestrian customer station entries
Morning peak-period entries Evening peak-period entries Distance from station North South East West Total North South East West Total
0 to 1/8 mile 143 56 25 32 256 479 879 487 140 1,985
1/8 to 1/4 mile 105 484 0 399 987 49 756 0 40 845
1/4 to 3/8 mile 1,153 0 0 56 1,209 523 559 0 20 1,103
3/8 to 1/2 mile 261 8 0 80 348 365 10 0 0 375
1/2 to 5/8 mile 0 36 0 8 44 110 129 0 0 239
5/8 to 3/4 mile 0 9 0 0 9 40 26 0 0 66
3/4 to 7/8 mile 0 0 0 24 24 0 0 0 0 0
7/8 to 1 mile 0 0 0 0 0 0 0 0 0 0
1 to 1-1/8 miles 0 0 0 0 0 160 150 110 220 639
Over 1-1/8 miles 8 56 8 0 72 190 80 70 90 429
Total 1,670 648 33 598 2,949 1,916 2,589 667 509 5,681 Increase from
2001 62% 27% 313% 0% 38% 20% 10% 6% 0% 11%
Source: Sum of existing trips (Tables 6 and 7) and new trips (Table 10). Notes: 1. Negative numbers were set to zero without adjusting marginal sums. 2. Anomalous data may be the result of inaccurate information provided on survey cards or imprecise geolocation of respondents who provided only the location of the nearest intersection to their trip origin.
Table 10: Net change in pedestrian station entries attributable to 2020 development
Morning peak-period entries Evening peak-period entries Distance from station North South East West Total North South East West Total
0 to 1/8 mile 0 0 25 0 25 0 0 38 0 38
1/8 to 1/4 mile 105 93 0 0 198 39 107 0 0 146
1/4 to 3/8 mile 396 0 0 0 396 154 0 0 0 154
3/8 to 1/2 mile 141 0 0 0 141 125 0 0 0 125
1/2 to 5/8 mile 0 36 0 0 36 0 109 0 0 109
5/8 to 3/4 mile 0 9 0 0 9 0 26 0 0 26
Over 3/4 mile 0 0 0 0 0 0 0 0 0 0
Total 642 138 25 0 805 318 242 38 0 598 Source: Aggregated data from Table 9.

CRYSTAL CITY METRORAIL STATION ACCESS STUDY
Planned Station-Area Improvements
Some improvements that would enhance station acce are already planned to be built by other parties.
The Charles E. Smith Realty Companies are planning to improve the existing bus waiting area, which is beneath the Crystal Square Five office building north of the Metrorail station entrance. Figure 9 shows the existing bus waiting area; Figure 10 shows a similar view of a rendering of the proposed changes. The improvements include the following: • The west curb on Clark Place will be shifted, narrowing the street and widening the sidewalk
by 3 to 4 feet. The change will increase the space available to pedestrians waiting for buses. The new sidewalk will extend beyond the existing columns, increasing pedestrians’ visibility of approaching buses and other traffic.
• The amount and quality of lighting will be improved, making the area underneath the building inviting and approachable during hours of darkness.
• Four new shelters will be constructed between existing columns to improve waiting conditions at the four bus stops. The shelters will be of higher quality than standard shelters.
• High-quality finishes will be installed throughout the waiting area, including granite and stainless steel accents.
Arlington County has authorized WMATA to begin a project to install a uniquely designed
Figure 9: Existing bus waiting area, loo north
Figure 10: Proposed new bus waiting area
ss
king
13
canopy over the existing escalator entrance that will connect to the bus facility. The Charles E. Smith Companies have committed to converting 18th Street and Crystal Drive from one-way to two-way operation. This plan has been approved in concept by the Arlington County Board, but detailed site plans have not yet been prepared, and the project is not currently scheduled for construction. The project will also widen the sidewalk on the south side of 18th Street east of Clark Place (Figure 11).
Figure 11: Sidewalk on the south side of 18th Street east of Clark Place, looking east
, looking north

CRYSTAL CITY METRORAIL STATION ACCESS STUDY
Community Involvement
Meetings were held with residents surrounding the Metrorail station to allow the community to be involved in the planning process. A meeting was held on June 5, 2001 to solicit suggestions for station-area improvements from residents. On April 18, 2002, recommended station improvements were presented to residents and further comments were solicited.
Station-Area Recommendations
Station Entrance Identification
Customers unfamiliar with Crystal City may find it difficult to locate the existing escalator and elevator entrances to the station. Dense landscaping near the escalators (Figure 12) obscures customers’ views of the escalators from the street. The elevator is not in view of the escalators, and can be difficult to locate. The planned escalator canopy will help customers locate the escalator entrance, but street-level directional signing to these entrances could also be improved. The density of the landscaping also creates concealed spaces, which can be a security concern. The landscaping could be redesigned to promote both conspicuity of the station entrance and security. It would be convenient to make these changes as part of the harles E. Smith companies’ project to reconfigure the Crystal City roadway netw rk.
Pedestrian Facilities
A comment from a station customer indicated that the walking route underneath the Jefferson Davis Highway overpass is of poor quality. The sidewalk facilities are of sufficient width, but the area is not inviting to pedestrians (Figure 13). Lighting is provided only by fixtures mounted on the bridge structure, designed to provide lighting for vehicles. The quality of this walking route could be improved by incorporating pedestrian-scale amenities, such as post-mounted pedestrian-level lighting and street furniture. The walking path linking the bus stops with the Metrorail escalators is on an indirect route. Many customers walk along the north side of the escalators along a narrow section of pavement (Figure 14) not intended for use as a sidewalk, as a short-cut. The route should be improved with a wider sidewalk and the planned walkway canopy.
Figure 12: Existing station entrance landscaping, looking north
Figure 13: 18th Street Pedestrian Route under Route 1 Overpass, looking west
Figure 14: Existing walking route north of escalators, looking east
Co
14

CRYSTAL CITY METRORAIL STATION ACCESS STUDY
15
Bicycle Facilities
Few customers travel by bicycle to the station, according to the customer survey. However, the non-WMATA-owned bicycle storage facilities near the station are limited, and enhancing these facilities may encourage additional bicycle traffic. A comment from a station customer supported improved bicycle facilities. The only bicycle parking provided at the station is a single bicycle rack located north of the station escalators (Figure 15). The rack’s capacity is limited, and its design is obsolete, potentially damaging bicycle wheels. Additional bicycle storage facilities could be added to the station area in the same vicinity as the existing bicycle rack, increasing both the quality and quantity of bicycle parking. WMATA-owned bicycle racks and lockers cannot be installed at the Crystal City station because there is insufficient WMATA property near the station entrance. WMATA policy does not permit WMATA-owned bicycle lockers and racks to be installed on non-WMATA property. For such facilities to be installed near the station entrance, property owners and/or local jurisdictions would need to install and maintain the facilities. WMATA estimates that current demand for bicycle storage at the Crystal City station would warrant bicycle lockers with a capacity of 20 bicycles and bicycle racks with a capacity of 40 bicycles.
Potential New Station Entrances
The existing station entrance is situated near the west end of the station platform, minimizing redundant walking distance for customers approaching the station from the west. Customers approaching from the north and south are well served by the existing Underground access to the station. The only customers who could benefit from additional ways to enter the station are customers approaching the station from the east. Two possible locations for new entrances to the station, east of the existing entrance, were identified. Figure 16 presents the two entry alternatives, the “Proposed Entry” and the “Alternate Entry”. Each proposed new entrance is discussed in further detail beginning on page 17.
The new entrance alternatives would provide additional accessibility for customers arriving from the east, as well as customers transferring to Metrorail from VRE. Before entering the station, these customers currently must walk as far west as the west end of the station platform, incurring significant redundant walking distance. The new entrances would eliminate the redundant walking distance, shortening customers’ walking trips by over 500 feet. Customers approaching the station at street level currently must ascend a grade when walking west on 18th Street toward the station entrance. The new entry alternatives would eliminate the need to make this redundant ascent. The Core Capacity Study (CCS) does not indicate that an additional entrance is required for capacity purposes by the year 2025, that study’s design year. However, the study projects that the current entrance will be at marginal capacity based on peak half-hour loadings, assuming all six escalators are functioning and that “crowded conditions” are acceptable to most customers. If a single escalator drops out of service, the capacity is dramatically reduced and the level of service drops well below an acceptable level during peak travel times. Several other factors were not considered by the CCS. A proposed BRT or LRT system would add significant numbers of transfer riders to the station. As VRE continues to expand, further increases in ridership are likely. If institutional barriers are overcome, there is the potential for MARC service from Maryland to provide direct service to Crystal City. These events, singly or in combination, would cause patronage to increase more than envisioned in the CCS ridership models. These increases in ridership would place further demands on the vertical circulation within the station. A new entrance, although not directly indicated by the CCS, could help provide surplus capacity to account for these additional factors. The station is the 12th busiest in the system from a ridership standpoint, but it has only one surface entrance, the only station at this level of ridership without at least two surface entries to accommodate and distribute customer loads. Forecasting future rail patronage is an inexact science. Once an additional entry is provided, induced ridership beyond the forecast levels is likely, further reinforcing the benefits of adding a second surface area to this station. With the continual expansion of Metrorail in the next 20 years, the development of LRT systems in Arlington County, and the service increases likely for VRE, the ridership forecasts for Crystal City have substantial opportunities to be greater than stated in the CCS. A second surface entry and expanded vertical circulation to and from the platform will result in a more customer-friendly environment for current and future customers of this station.
Figure 15: Existing bicycle parking, looking northwest

CRYSTAL CITY METRORAIL STATION ACCESS STUDY
16
Figure 16: Potential new entrance locations for the Crystal City Metrorail station

CRYSTAL CITY METRORAIL STATION ACCESS STUDY
17
Proposed Entry
The Proposed Entry features a new bank of three escalators on the northwest corner of 18th Street and Crystal Drive (Figure 17), connected via a new pedestrian tunnel to the station’s existing mezzanine. An entrance to the mezzanine on the south side of the station would be constructed as part of this entry option. The Proposed Entry also features two elevators that would connect the street level with the mezzanine level. The new elevators would be north of 18th Street and slightly further west than the escalatorway. The new escalatorway would be almost due east of the existing escalators, at a distance of approximately 550 feet. The Proposed Entry’s location would be a convenience to pedestrian customers approaching the station from the east, but it would not offer a benefit to pedestrians approaching from any other direction. The existing entrance’s connection to the Crystal City Underground provides ideal service to customers approaching from the north and south. The Proposed Entry would also serve VRE transfer customers particularly well. The customer survey showed that approximately 11 percent of morning-peak Metrorail customers are transferring from VRE, meaning that approximately 350 customers make this transfer. These customers’ walking distance could be shortened by constructing the Proposed Entry, helping to encourage VRE-to-Metrorail transfer customers. The Proposed Entry is also nearer to the Mount Vernon Connector Multi-Use Path than the existing entrance, shortening the walking distance for the few pedestrian customers who use that path. Bicycle customers may also benefit from the shorter distance if bicycle storage facilities are provided near the Proposed Entry. In conjunction with the planned roadway improvements, the Charles E. Smith Companies are planning to change the character of Crystal Drive, converting it to a “Main Street” environment. Ground-floor retail establishments will be added, increasing the demand for pedestrian activity in
the area. The Proposed Entry would serve this planned pedestrian center well. In order to better serve pedestrian customers approaching the station from either the VRE station or the Mount Vernon Connector Multi-Use Path, a crosswalk should be installed on the north leg of the intersection of Crystal Drive and 18th Street if the Proposed Entry is installed. The Proposed Entry would likely attract additional Metrorail customers from the east, but there is not a large base of development east of the station. Because of the shortened walking distance, the Proposed Entry would be expected to generate approximately 80 new pedestrian customers during the evening peak period and 110 new daily pedestrian trips. Table 12 presents customer forecasts for the Proposed Entry if constructed. Pedestrian customers whose trips originate east of the station would likely use the new entrance, but all other pedestrians are likely to continue to use the existing entrance because of its convenient access to the Underground. The red lines in Figure 16 indicate potential alignments for light rail service in Crystal City. These plans are in their early stages, but the current LRT alignments include service on either Clark Place or Eads Street. The existing escalators are well-positioned to capture LRT transfer customers from either of these alignments, so the Proposed Entry would not be a benefit to LRT transfer customers. Table 12 assigns all LRT transfer customers to the existing entry. There is more uncertainty in the forecast of the number of customers using other modes who would shift to the new entrance, in part because the Crystal City street configurations are likely to change prior to 2020. As a general assignment, half of customers using other modes were assumed to shift to the new entrance.
Table 12: Forecast of station entries in 2020 No new entrance
constructed Proposed Entry constructed
Customers using existing entry
Customers using existing entry
Customers using new entry
AM Peak Period 5,400 4,400 1,000
PM Peak Period 10,200 7,800 2,500
Daily 21,000 16,600 4,500
Figure 17: Site of Proposed Entry escalatorway, looking northeast

CRYSTAL CITY METRORAIL STATION ACCESS STUDY
18
Table 12 forecasts 4,500 weekday customer entries for the Proposed Entry if constructed. The entry would serve a similar number of customer exits, for a total annual customer volume of approximately 2 million. Bus transfer customers may benefit from the Proposed Entry. If Crystal Drive and Clark Street remain a one-way pair, Metrorail station entrances near each of these streets would simplify bus operations. Buses would not need to circulate to the existing station entrance; if it were more convenient, buses could stop on Crystal Drive near the Proposed Entry. Other dropped-off customers may achieve similar benefits. The approximate cost of the Proposed Entry is detailed in Table 13.
Alternate Entry
The Alternate Entry features a new bank of three escalators on the southwest corner of 18th Street and Crystal Drive (Figure 18). Much like the Proposed Entry, the Alternate Entry would provide access to the station via a tunnel, connecting with the mezzanine at the same point as the Proposed Entry. The primary challenge of the Alternate Entry is integrating its escalator bank with the existing and planned site development. The location of the Alternate Entry’s escalator bank is currently planned for redevelopment, and at various phases of planning, the Alternate Entry has not been compatible with development considered for the site. Constructing the Alternate Entry would require careful cooperation with the redevelopment plans. The Alternate Entry also conflicts with an underground cooling tower facility, greatly complicating the possibility of installing both a bank of escalators and a passageway. Many of the advantages of the Proposed Entry would apply to the Alternate Entry as well, since the escalator banks are relatively near each other. The Alternate Entry would benefit customers approaching from south of 18th Street because they would not have to cross that street. However, this location would be less attractive than the Proposed Entry to VRE customers, who approach the station from the Mount Vernon Connection Multi-Use Path north of 18th Street. The Alternate Entry would be expected to attract new customers at approximately the same rate as the Proposed Entry, given their proximity. However, because of the Alternate Entry’s constructibility difficulties, it is not recommended for further consideration.
Table 13: Order of magnitude cost estimate for Proposed Entry
Element Approximate Cost (FY 2002 dollars)
Entry features: escalators, street elevators, passageway $13,000,000
Mezzanine extension, internal station improvements $5,000,000
Planning, design, construction management, agency costs, and contingencies
$10,000,000
Total Cost $28,000,000 Note: Excludes right-of-way costs and new street-to-mezzanine elevators described on page 19.
Figure 18: Site of Alternate Entry escalatorway, looking southeast

CRYSTAL CITY METRORAIL STATION ACCESS STUDY
19
Internal Station Improvements
Improvements to the interior of the station area would be necessary if either new entrance were constructed. Figure 19 displays a mezzanine-level plan view of several internal changes that would be consistent with either new entrance. Each proposed improvement is discussed in detail below. The cost of these improvements is included in Table 13, with an exception noted below. • Rearranged faregate arrays would be required to accommodate the entrance to the
mezzanine from the south. The reconfigured faregates would have a secondary benefit of increasing capacity.
• New platform-to-mezzanine elevators would be added for both the north and south
platforms, providing two elevators for each platform. The additional elevators would significantly reduce the chances that an out-of-service elevator would prevent customers with disabilities from using the station.
• The west end of the mezzanine would be extended, and stairs between mezzanine and
platform would be added for both north and south platforms. New stairways would help provide vertical circulation, especially when one or more escalators are out of service. In addition, the stairways would increase capacity, which could be beneficial during peak periods.
• In order to provide better elevator service to the station, a bank of two new street-to-
mezzanine elevators is proposed. The new elevators are shown in a street-level plan view in Figure 20 and an elevation view in Figure 21. The elevators are situated in such a way that they could stop at the Underground level, shortening disabled customers’ trips to that level. These elevators are not included in the cost estimate in Table 13, for two reasons. First, construction would be contingent on disabled-accessible retrofits to the Underground entrances, which would need to be made by the owners of the Underground. Second, space for the elevators at street level would be contingent on integrating the elevators within the site plan for the Crystal Square Five structure. Space for the elevators would also need to be coordinated at Underground level; consideration would need to be given to the likely displacement of retail facilities.
The internal station improvements would provide an additional access point to the Underground. The rearranged faregates would allow people to enter through the new entrance and pass through the station. They could then proceed out of the station via the existing entrance or connect to the Underground.
Figure 19: Potential interior Crystal City Station improvements

CRYSTAL CITY METRORAIL STATION ACCESS STUDY
20
Figure 20: Street-level plan view of proposed street-to-mezzanine elevators and pedestrian and bicycle facilities

CRYSTAL CITY METRORAIL STATION ACCESS STUDY
21
Figure 21: Elevation view of proposed street-to-mezzanine elevators and pedestrian facilities