cse 330: numerical methods. regression analysis gives information on the relationship between a...
TRANSCRIPT

Lecture 10Regression Analysis
For Slides Thanks toDr. S. M. Lutful KabirVisiting Professor, BRAC University& Professor, BUET
CSE 330: Numerical Methods

What is regression analysis?
Regression analysis gives information on the relationship between a response (dependent) variable and one or more predictor (independent) variables
The goal of regression analysis is to express the response variable as a function of the predictor variables
The goodness of fit and the accuracy of conclusion depend on the data used
Hence non-representative or improperly compiled data result in poor fits and conclusions
2
(s) t (m/s) )(tv
Prof. S. M. Lutful Kabir, BRAC University 3
A Regression Model
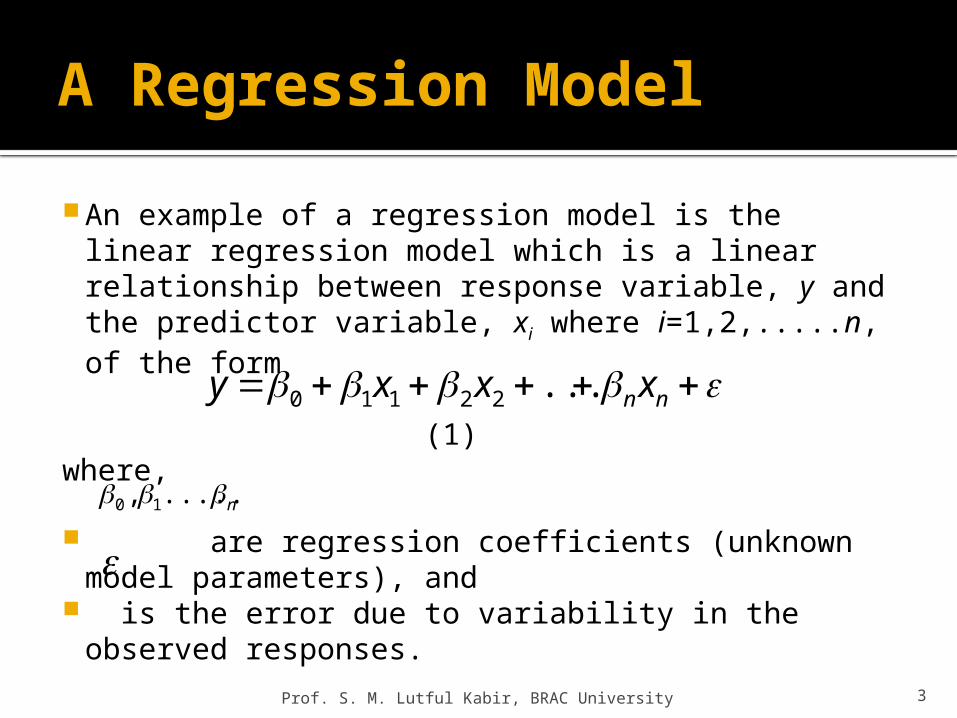
An example of a regression model is the linear regression model which is a linear relationship between response variable, y and the predictor variable, xi where i=1,2,.....n, of the form
(1)where, are regression coefficients (unknown model
parameters), and is the error due to variability in the observed
responses.
n ......., 10
nn xxxy ...22110

Prof. S. M. Lutful Kabir, BRAC University 4
Example 1
In the transformation of raw or uncooked potato to cooked potato, heat is applied for some specific time.
One might postulate that the amount of untransformed portion of the starch (y) inside the potato is a linear function of time (t) and temperature (θ) of cooking. This is represented as
The linear regression refers to finding the unknown parameters, β1 and β2 which are simple linear multipliers of the predictor variable.
210 ty

Prof. S. M. Lutful Kabir, BRAC University 5
Uses of Regression Analysis
Three uses for regression analysis are for model specification parameter estimation prediction

Prof. S. M. Lutful Kabir, BRAC University 6
Model specification
Accurate prediction and model specification require that all relevant variables be accounted for in
the data the prediction equation be defined in the
correct functional form for all predictor variables.

Prof. S. M. Lutful Kabir, BRAC University 7
Parameter Estimation
Parameter estimation is the most difficult to perform because not only is the model required to be correctly specified, the prediction must also be accurate and the data should allow for good estimation
For example, multi-linear regression creates a problem and requires that some variables may not be used
Thus, limitations of data and inability to measure all predictor variables relevant in a study restrict the use of prediction equations

Prediction
Regression analysis equations are designed only to make predictions.
Good predictions will not be possible if the model is not correctly specified and accuracy of the parameter not ensured.
Prof. S. M. Lutful Kabir, BRAC University 8

Considerations for Effective Use of Regression Analysis
For effective use of regression analysis, one should
investigate the data collection process, discover any limitations in data collected restrict conclusions accordingly
Prof. S. M. Lutful Kabir, BRAC University 9
Prof. S. M. Lutful Kabir, BRAC University 10
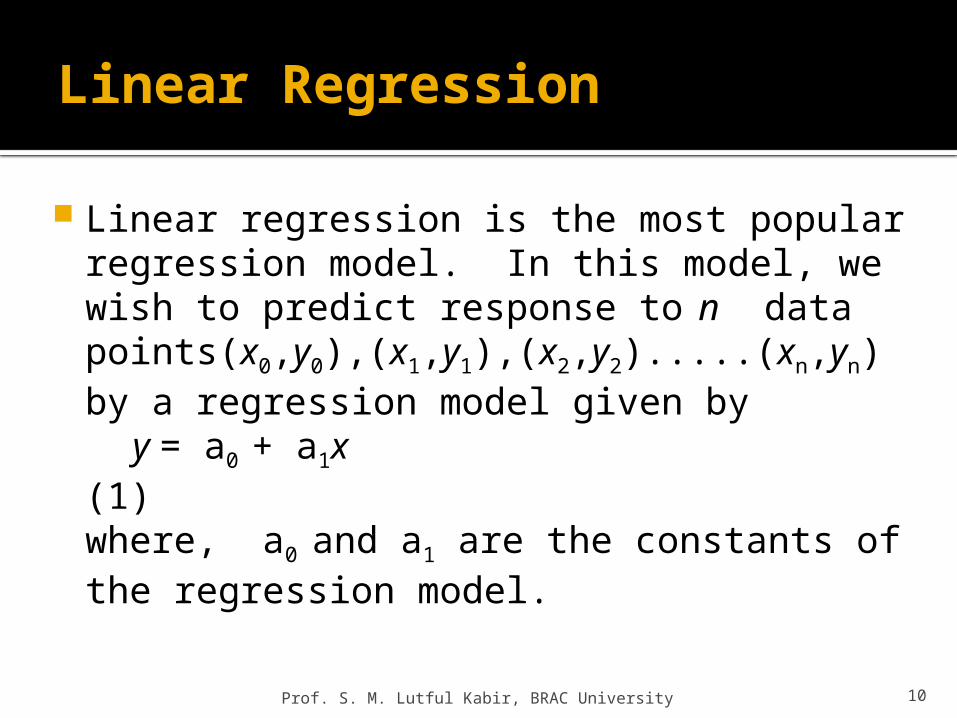
Linear Regression
Linear regression is the most popular regression model. In this model, we wish to predict response to n data points(x0,y0),(x1,y1),(x2,y2).....(xn,yn)by a regression model given by
y = a0 + a1x (1)where, a0 and a1 are the constants of the regression model.

11
Measure of Goodness of Fit
A measure of goodness of fit, that is, how well predicts the response variable is the magnitude of the residual at each of the data points. (2)
Ideally, if all the residuals are zero, one may have found an equation in which all the points lie on the model.
Thus, minimization of the residual is an objective of obtaining regression coefficients.
The most popular method to minimize the residual is the least squares methods, where the estimates of the constants of the models are chosen such that the sum of the squared residuals is minimized, that is minimize
Prof. S. M. Lutful Kabir, BRAC University
)( 10 iii xaayE
i
n
iiE
1
2

Prof. S. M. Lutful Kabir, BRAC University 12
Minimization of the Error
Let us use the least squares criterion where we minimize
(3)
where, Sr is called the sum of the square of the residuals.
Differentiating Equation (3) with respect to a0
and a1 we get (4)
(5)
2
110
1
22
n
iii
n
ii xaayER
0121
100
2
n
iii xaay
a
R
021
101
2
n
iiii xxaay
a
R

Prof. S. M. Lutful Kabir, BRAC University 13
Minimization of the Error (continued)
Using equation (4) and (5), we get
(6)
(7)
Noting that
(8)
(9)
01 1
11
0
n
i
n
ii
n
ii xaay
01 1
21
10
n
i
n
ii
n
iiii xaxaxy
00001
0 ... naaaaan
i
n
ii
n
ii yxana
1110
n
iii
n
ii
n
ii yxxaxa
11
21
10
Prof. S. M. Lutful Kabir, BRAC University 14
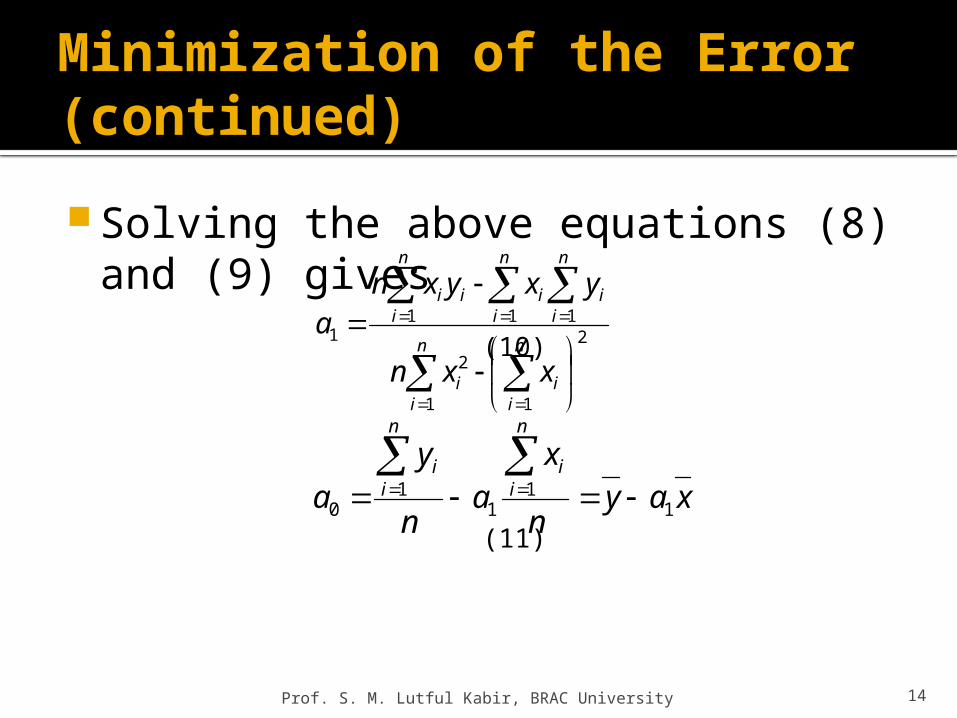
Minimization of the Error (continued)
Solving the above equations (8) and (9) gives
(10)
(11)
2
11
2
1111
n
ii
n
ii
n
ii
n
ii
n
iii
xxn
yxyxna
xayn
xa
n
ya
n
ii
n
ii
11
11
0

Prof. S. M. Lutful Kabir, BRAC University 15
Example 2
The torque T needed to turn the torsional spring of a mousetrap through an angle, θ is given below
Find the constants and of the regression model
Angle θ, Radians Torque, T
0.698132 0.1882240.959931 0.2091381.134464 0.2300521.570796 0.2509651.919862 0.313707
T mN
21 kkT

Prof. S. M. Lutful Kabir, BRAC University 16
Tabulation of data for calculation of needed summations
i θ T θ2 Tθ
Radians N-m radians N-m
1 0.698132 0.188224
2 0.959931 0.209138
3 1.134464 0.230052
4 1.570796 0.250965
5 1.919862 0.313707
6.2831 1.1921 8.8491 1.5896
T 2T mN 2 mN 11087388.4 11031405.1 11021468.9 11000758.2 11060986.2 11094215.3 11002274.6
5
1i
5
1i

17
The values of constants
=9.6091 X 10⁻² N-m/rad k1 = 1.1767 X 10⁻¹ N-m
=2.3842 X 10⁻² N-m
=9.6091 X 10⁻² N-m/rad
25
1
5
1
2
5
1
5
1
5
12
ii
ii
ii
ii
iii
n
TTnk
n
TT i
i
5
1_
ni
i
5
1_

Prof. S. M. Lutful Kabir, BRAC University 18
Linear regression of torque vs. angle data
Prof. S. M. Lutful Kabir, BRAC University 19
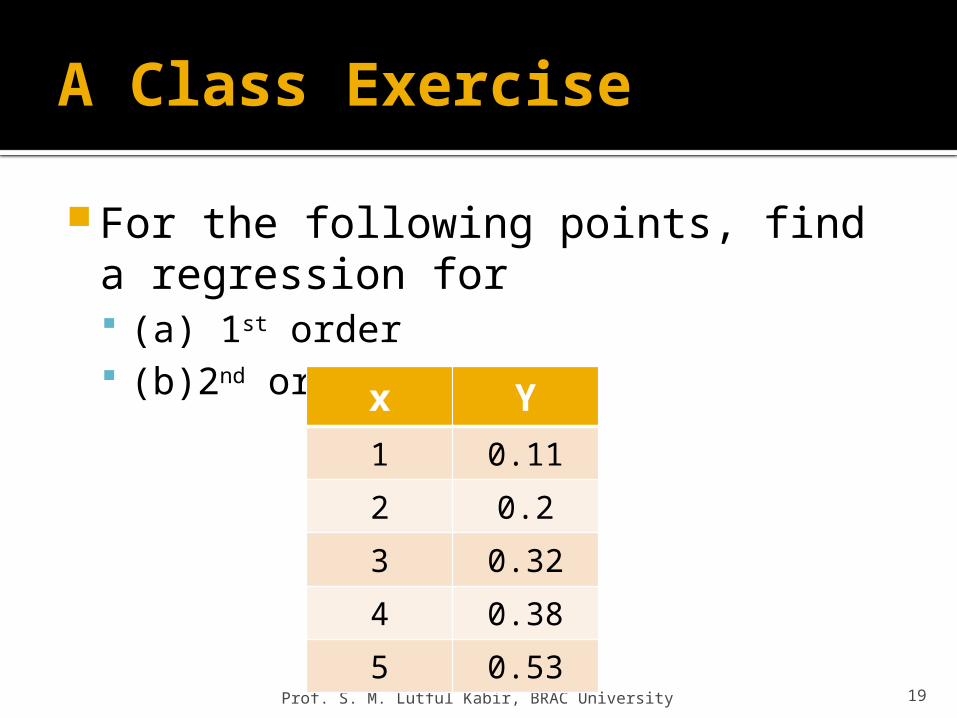
A Class Exercise
For the following points, find a regression for (a) 1st order (b)2nd order x Y
1 0.11
2 0.2
3 0.32
4 0.38
5 0.53

Prof. S. M. Lutful Kabir, BRAC University 20
Least Square Fitting - Polynomial
Generalizing from a stright line (i.e. First degree polynomial) to a kth degree polynomial
y=a0+a1x+a2x2+a3x3+.....+akxk
The residual is given by
n
i
kikiii xaxaxaayR
1
22210
2 )].......([

21
Least Square Fitting – Polynomial (continued) The partial derivatives are:
n
i
ki
kiki
k
n
i
mi
kiki
m
n
ii
kiki
n
i
kiki
xxaxaaya
R
xxaxaaya
R
xxaxaaya
R
xaxaaya
R
110
2
110
2
110
1
2
110
0
2
0)]......([2
...........
0)]......([2
..........
0)]......([2
0)]......([2

Prof. S. M. Lutful Kabir, BRAC University 22
In matrix form
n
i
ki
n
i
ki
n
i
ki
n
i
ki
n
ii
n
ii
n
i
ki
n
ii
xxx
xxx
xxn
1
2
1
1
1
1
1
1
2
1
11
.........
...
...
...........
.............
n
ii
ki
n
iii
n
ii
yx
yx
y
1
1
1
...
...
ka
a
a
..
..1
0
[C] [A] [B]

23
Flow chart for formation of [C] matrix
Prof. S. M. Lutful Kabir, BRAC University
i = 1
j = 1
c(i,j) = 0.0
m= 1
c(i,j) = c(i,j)+x(m)^(i-1+j-1)
m = m+1
m : n
j= j + 1
i= i + 1
j : k+1
i : k+1
<
<
<>
>
>

Prof. S. M. Lutful Kabir, BRAC University 24
Flow chart for formation of [B] matrix
Class exercise

Prof. S. M. Lutful Kabir, BRAC University 25
Program
% Regression Analysis % k-> order of polynomial% n-> number of points clear all clc k=1; n=5; x=[0.6981, 0.9600, 1.1345, 1.5708,
1.9199]; y=[0.1882, 0.2091, 0.2301, 0.2510,
0.3137];

Prof. S. M. Lutful Kabir, BRAC University 26
Program (continued)
% Determination of [C] matrixfor i=1:k+1
for j=1:k+1 c(i,j)=0.0; for m=1:n c(i,j) = c(i,j) + x(m)^(i-1+j-1); end end end
c % Inversion of [C] matrix ci=inv(c); ci

Prof. S. M. Lutful Kabir, BRAC University 27
Program (continued)
% Determination of [B] matrixfor i=1:k+1 b(i)=0.0; for m=1:n b(i)=b(i)
+y(m)*x(m)^(i-1); end endb
% Determination of [A] matrixfor i=1:k+1
a(i)=0.0; for j=1:k+1
a(i)=a(i)+ci(i,j)*b(j);
end end a

Prof. S. M. Lutful Kabir, BRAC University 28
Thanks