csu multi-purpose stadium
TRANSCRIPT

March 21, 2016
CSU
Multi-Purpose Stadium
Update

Tonight’s Agenda• 5:30 pm - Meeting called to order
• Public Comment (up to 30 minutes)
• Construction Updates (10 minutes)
Fred Haberecht, Assistant Director of Facilities Management and Campus Planner, CSU
Cass Beitler, Assistant Director of Construction and Project Management, CSU
Doug Wilson, Project Manager, ICON Venue Group
• Video “Hard Hat Tour”
• Whitcomb Gateway and Sewer Line Replacement (30 minutes)
Fred Haberecht, Assistant Director of Facilities Management and Campus Planner, CSU
• Lighting and Sound (45 minutes) – ICON Venture Group
Stadium Sports Lighting Environmental Impact Study - Corey Berhost, Senior Associate, ME
Engineers
Stadium Environmental Noise Analysis – Tom Falgien, Senior Associate, WJHW
• Discussion and agenda items for next meeting
• 7:30 pm – Meeting Adjournment

Construction Updates

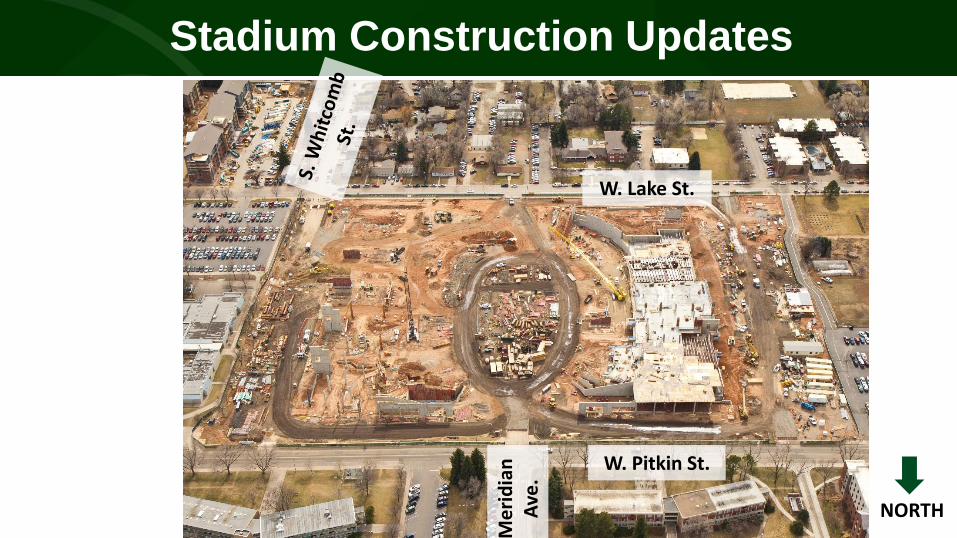
Stadium Construction Updates
• Progress To Date
• Anticipated Progress to Next SAG Meeting
• Current Challenges

Stadium Construction Updates
NORTH

Stadium Construction Updates
W. Pitkin St.
W. Lake St.
Me
rid
ian
Ave
.
NORTH

Stadium Construction Updates
Meridian Ave.
NORTH
Stadium Construction Updates
W. Pitkin St.
W. Lake St.
Me
rid
ian
A
ve.
NORTH

Stadium Construction Updates
Meridian Ave.
Whitcomb St.
NORTH

Stadium Construction Updates
NORTH
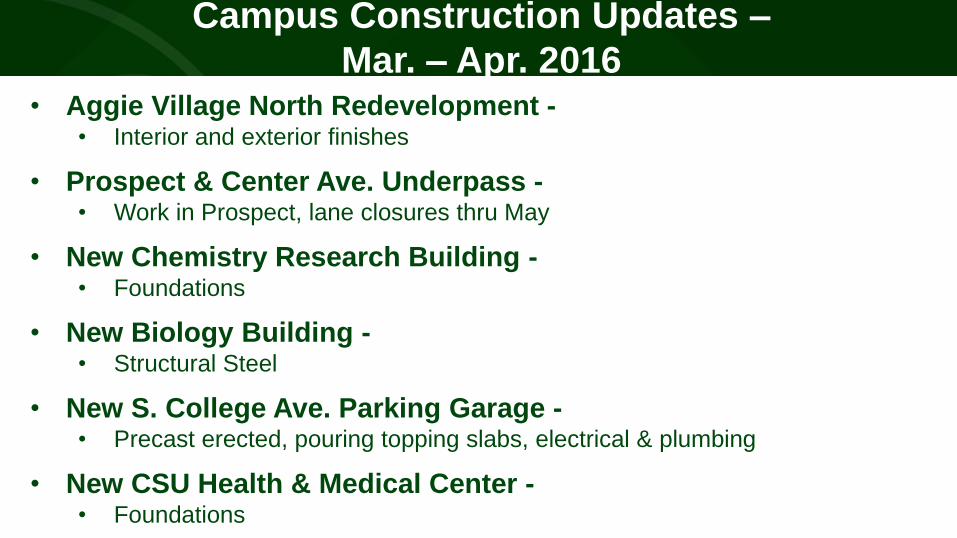
Campus Construction Updates –
Mar. – Apr. 2016• Aggie Village North Redevelopment -
• Interior and exterior finishes
• Prospect & Center Ave. Underpass -• Work in Prospect, lane closures thru May
• New Chemistry Research Building -• Foundations
• New Biology Building -• Structural Steel
• New S. College Ave. Parking Garage -• Precast erected, pouring topping slabs, electrical & plumbing
• New CSU Health & Medical Center -• Foundations

“Hard Hat Tour” Video

Whitcomb Gateway and
Sewer Line Replacement
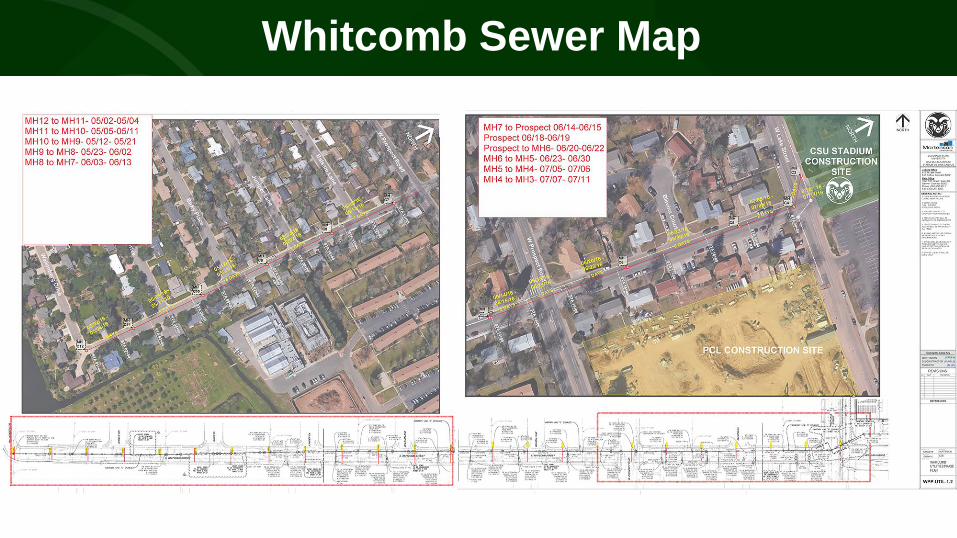
Whitcomb Sewer Map

Whitcomb Sewer FAQ’s

Whitcomb Gateway & Streetscape

Stadium Sports Lighting
Environmental Impact Study
FIELD LIGHTING ANALYSIS
Colorado State UniversityMulti-Purpose Stadium
Sports Lighting Environmental Impact Study

FIELD LIGHTING ANALYSIS
Field Lighting Analysis Overview
Focus is on identifying the physical effects that lighting may have on the surrounding neighborhood
Lighting Guidelines require: • No event shall any light element associated with the stadium
adversely impact the operation of motor vehicles on area roadways. • Spill light levels shall not adversely impact residential community.
Goal is to limit spill illumination to the surrounding neighborhoods to 5 foot-candles approximately 200 feet from the stadium’s perimeter and to limit glare to a threshold value rating of 40 GR at motor intersections around the stadium.

Terms & Units
Lighting Language
Foot-candle (FC) – Unit used to define illumination. 1 foot-candle is equal to 1-lumen falling on an area of 1-square foot.
Light Source Horizontal Illuminance Range (FC)
Full Moon to Twilight 0.01 0.10
Typical City Parking Lot 1.0 2.0
Street Lighting .25 1.0
Office/Classroom 40 70
Collegiate Stadium 125 200
Sunny Day 3,000 5,000
FIELD LIGHTING ANALYSIS
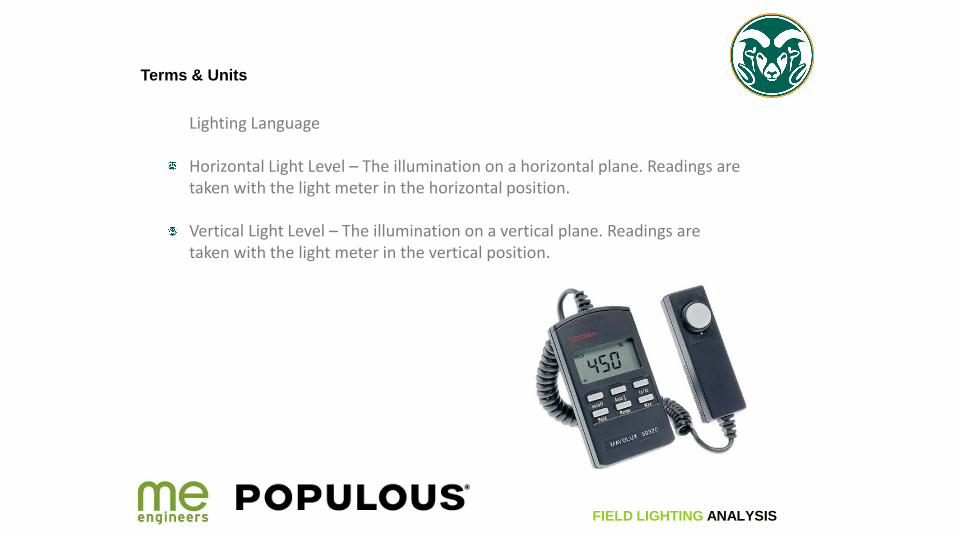
Terms & Units
Lighting Language
Horizontal Light Level – The illumination on a horizontal plane. Readings are taken with the light meter in the horizontal position.
Vertical Light Level – The illumination on a vertical plane. Readings are taken with the light meter in the vertical position.
FIELD LIGHTING ANALYSIS

Terms & Units
Lighting Language
Spill light – For the purpose of this report spill light can be defined as the illumination that is produced by a light source or light sources at a point or surface on which the light is not intended or desirable.
Glare – The discomfort or impairment of vision experienced when the image is excessively bright compared to the general surroundings.
Glare Rating –The glare rating is based on a scale of 0-100 with 100% being disabling glare and 0% being “not noticeable” glare.
Glare Rating GR
90 Unbearable
80
70 Disturbing
60
50Just
Admissible
40
30 Noticeable
20
10 Unnoticeable
FIELD LIGHTING ANALYSIS

Design Criteria
The proposed spill light and glare rating for this project shall be:Spill lighting shall not exceed 5 FC.
Glare Rating shall not exceed 40 at motor intersections around the stadium.
Both spill and glare shall be less than the existing Hughes Stadium impact to the environment.
FIELD LIGHTING ANALYSIS

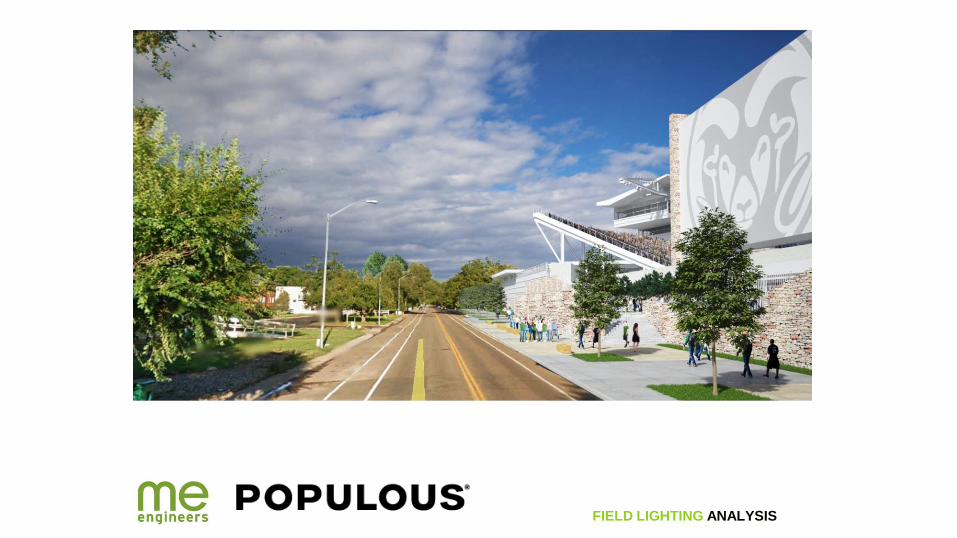
Site Location & Lighting Design
The sports lighting design for the new stadium will be similar to other new collegiate facilities.
Illumination on the playing field shall be approximately 200FC horizontal with state-of-the-art light fixtures.
Field with beam efficiency of 50% or greater; compared to existing facilities with beam efficiency of less than 30%.
FIELD LIGHTING ANALYSIS

Lighting Design Techniques
Shielding and Spill Mitigation
FIELD LIGHTING ANALYSIS

Lighting Design Techniques
Aiming arrays vs. Flood Lighting
FIELD LIGHTING ANALYSIS
Array Flood

Site Lighting Receptor Map
FIELD LIGHTING ANALYSIS

Site Lighting Analysis Map
FIELD LIGHTING ANALYSIS

Field Observations & Measurements
Light Receptor No.2
Existing Lighting Conditions:
Measured Conditions:
• Vertical Illuminance = 0.45 fc
• Horizontal Illuminance = 0.60 fc
Calculated Field Lighting Contribution:
• Vertical Illuminance = 0.0 fc
• Horizontal Illuminance = 0.0 fc
Day Time Photo Night Time Photo
Rendering
FIELD LIGHTING ANALYSIS

Field Observations & Measurements
Light Receptor No.6
Existing Lighting Conditions:
Measured Conditions:
• Vertical Illuminance = 0.02 fc
• Horizontal Illuminance = 0.11 fc
Calculated Field Lighting Contribution:
• Vertical Illuminance = 0.14 fc
• Horizontal Illuminance = 0.02 fc
Day Time Photo Night Time Photo
Rendering
FIELD LIGHTING ANALYSIS

FIELD LIGHTING ANALYSIS

Field Observations & Measurements
Light Receptor
No.14
Existing Lighting Conditions:
Measured Conditions:
• Vertical Illuminance = 0.30 fc
• Horizontal Illuminance = 0.25 fc
Calculated Field Lighting Contribution:
• Vertical Illuminance = 4.24 fc
• Horizontal Illuminance = 3.36 fc
Day Time Photo Night Time Photo
Rendering
FIELD LIGHTING ANALYSIS

FIELD LIGHTING ANALYSIS
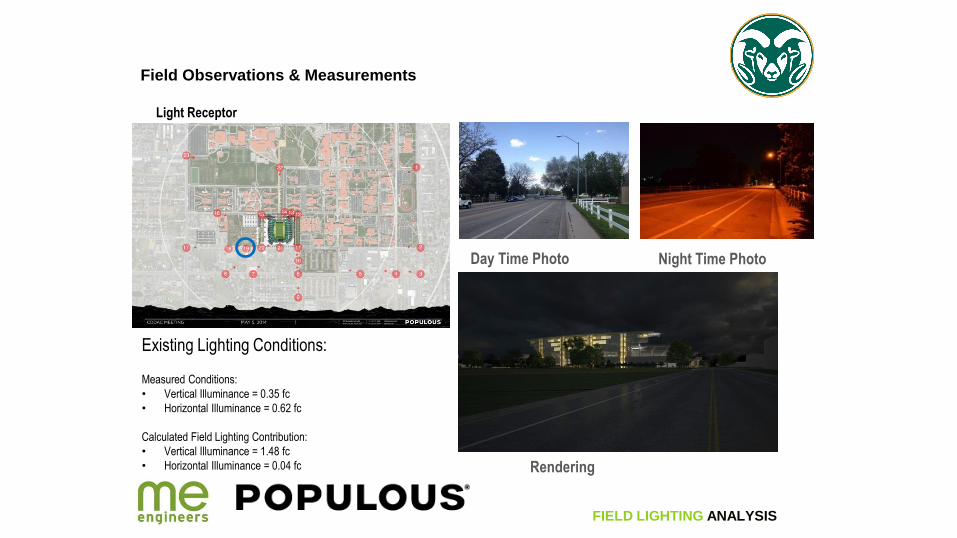
Field Observations & Measurements
Light Receptor
No.19
Existing Lighting Conditions:
Measured Conditions:
• Vertical Illuminance = 0.35 fc
• Horizontal Illuminance = 0.62 fc
Calculated Field Lighting Contribution:
• Vertical Illuminance = 1.48 fc
• Horizontal Illuminance = 0.04 fc
Day Time Photo Night Time Photo
Rendering
FIELD LIGHTING ANALYSIS
FIELD LIGHTING ANALYSIS

Field Observations & Measurements
Light Receptor
No.21
Existing Lighting Conditions:
Measured Conditions:
• Vertical Illuminance = 0.15 fc
• Horizontal Illuminance = 0.47 fc
Calculated Field Lighting Contribution:
• Vertical Illuminance = 0.60 fc
• Horizontal Illuminance = 0.39 fc
Day Time Photo Night Time Photo
Rendering
FIELD LIGHTING ANALYSIS

Field Observations & Measurements
Light Receptor
No.22
Existing Lighting Conditions:
Measured Conditions:
• Vertical Illuminance = 0.15 fc
• Horizontal Illuminance = 0.47 fc
Calculated Field Lighting Contribution:
• Vertical Illuminance = 0.60 fc
• Horizontal Illuminance = 0.04 fc
Day Time Photo Night Time Photo
Rendering
FIELD LIGHTING ANALYSIS

Lighting Analysis Summary
FIELD LIGHTING ANALYSIS
Based upon current conditions at the existing stadium, comparable collegiate stadiums and calculated results of the new sports lighting, ME Engineers has concluded that the environmental impact of the sports lighting will not be a significant source of spill or glare to the surrounding neighborhoods.
• Arrayed aiming strategy• Incorporation of new technology into the sports lighting fixtures• Architectural screening on the sides by the building skin and will aid in
shielding those houses nearest to the stadium from direct views of the sports lighting.

Stadium Environmental Noise Analysis

Sound System Community Impact Overview
• Predict loudspeaker sound levels in the surrounding community and provide comparison to local noise ordinance and other relevant design metrics
• Discuss potential sound mitigation techniques including loudspeaker and building design
• Goal is to minimize sound propagation to the surrounding community so as to minimize sound impact on residential properties

Definitions
• Sound Power Level – total sound energy created by a sound source; measured in decibels (dB)
• Sound Pressure Level – rapid pressure fluctuations which the ear interprets as sound; measured in decibels (dB)
• Decibel (dB) – measure of sound pressure or sound power levels; calculated as a logarithmic ratio to a base sound pressure/power (often, the threshold of hearing)

Definitions
• dBA – A-weighted sound pressure level; closely related to the human hearing sensitivity to various sound frequencies
Sound Source dBA
Average Home Interior 50-55
Talking, 3 ft 60-65
Commercial Aircraft Cabin 70-75
Vacuum cleaner 85-90
Lawnmower 95-105

Definitions
• Leq – Equivalent Continuous Sound Level – single sound level value equivalent to the same energy as fluctuating sound levels over a period of time, can be considered a type of “average” sound level
• Ldn (or DNL) – Day-Night Equivalent Sound Level – 24-hour equivalent sound level; uses a 10 dB penalty during nighttime hours (8:00 pm to 7:00 am per City of Ft. Collins ordinance)

Common Sound Problems at Collegiate Stadiums
• Sound system carries intelligible information, rhythmic content, etc.
• Operates a greater percentage and, on average, louder than the crowd
• Sound Levels within the seating Bowl – typically 85-100+ dBA

Design and Sound Mitigation
• Stadium Design & Sound Propagationo “Shadow Zone”
o Orientation of Stadium/Sound System
• Distributed System vs. End Zone Cluster (e.g. Hughes Stadium)
• Sound System Levelso Peak vs. Average
o Impulsive vs. Continuous
• Stage Location

Environmental Noise Analysis
Predictive assessment of stadium sound levels
• SoundPlan Modeling Software
• Modeling Assumptions/Inputso Location, quantity, and directional characteristics of sound sources
o 3D modeling of stadium structure
o Terrain and Weather Conditions
o Sound Level in Stadium – 95 dBA at spectator seating
Environmental Noise Analysis
Other Stadium Sound
• Crowd
• Marching Band
• Celebratory Cannon
Not included in the sound assessment

Results
• Projected Sound Levels during Sporting Events
70-75 dBA (peak) to the south
65 dBA or less (peak) to the east and west
65 dBA or less (average) to surrounding residential

Results: Peak/Maximum
SoundPlan Inputs
Peak Sound LevelDistributed SystemFootball game95 dBA max

Results: DNL (daily average)
SoundPlan Inputs
Day-Night Noise LevelDistributed SystemFootball game (daytime)
2 hrs – 85 dBA2 hrs – 95 dBA

Results
Projected Interior Noise Levels at Residences
• Average residential noise reduction assumed to be 22 dBA
• Interior noise levels (projected)o 50-53 dBA (peak) to the south
o 43 dBA (peak) or less to the east and west
o 43 dBA (average) or less to residential community

Sound Assessment Summary
• Sound levels generated by the sound system projected to be similar to or less than the existing Hughes Stadium community sound impact
• Distributed sound system design will minimize sound propagation to community
• Sound still audible in community
• Residential interior sound levels expected to be below ambient interior sound levels in most residential areas
QUESTIONS?

Discussion and Agenda Items
for Next SAG Meeting