curis.ku.dkcuris.ku.dk/ws/files/44067817/arctic_freshwater_biodiversity... · the conservation of...
TRANSCRIPT
u n i ve r s i t y o f co pe n h ag e n
Københavns Universitet
Arctic freshwater biodiversity monitoring plan
Culp, J.M.; Goedkoop, W.; Lento, J.; Christoffersen, Kirsten Seestern; Frenzel, S.;Guðbergsson, G.; Liljaniemi, P.; Sandøy, S.; Svoboda, M.; Brittain, J.; Hammar, J.; Jacobsen,Dean; Jones, B.; Juilet, C.; Kahlert, M.; Kidd, K.; Luiker, E.; Olafsson, J.; Power, M.; Rautio,M.; Ritcey, A.; Striegl, R.; Svenning, M.; Sweetman, J.; Whitman, M.
Publication date:2012
Document VersionPublisher's PDF, also known as Version of record
Citation for published version (APA):Culp, J. M., Goedkoop, W., Lento, J., Christoffersen, K. S., Frenzel, S., Guðbergsson, G., ... Whitman, M.(2012). Arctic freshwater biodiversity monitoring plan. CAFF Monitoring Series Report, No. 7
Download date: 13. Jul. 2018

CAFF Monitoring Series Report No. 7December 2012
Arctic FreshwAter Biodiversity Monitoring PlAnFreshwater Expert Monitoring Group, Circumpolar Biodiversity Monitoring Program
ARCTIC COUNCIL

The Conservation of Arctic Flora and Fauna (CAFF) is a Working Group of the Arctic Council.
CAFF Designated Agencies:
• Directorate for Nature Management, Trondheim, Norway
• Environment Canada, Ottawa, Canada
• Faroese Museum of Natural History, Tórshavn, Faroe Islands (Kingdom of Denmark)
• Finnish Ministry of the Environment, Helsinki, Finland
• Icelandic Institute of Natural History, Reykjavik, Iceland
• The Ministry of Domestic Affairs, Nature and Environment, Greenland
• Russian Federation Ministry of Natural Resources, Moscow, Russia
• Swedish Environmental Protection Agency, Stockholm, Sweden
• United States Department of the Interior, Fish and Wildlife Service, Anchorage, Alaska
CAFF Permanent Participant Organizations:
• Aleut International Association (AIA)
• Arctic Athabaskan Council (AAC)
• Gwich’in Council International (GCI)
• Inuit Circumpolar Council (ICC) – Greenland, Alaska and Canada
• Russian Indigenous Peoples of the North (RAIPON)
• Saami Council
This publication should be cited as: J.M. Culp, W. Goedkoop, J. Lento, K.S. Christoffersen, S. Frenzel, G. Guðbergsson, P. Liljaniemi, S. Sandøy, M. Svoboda, J. Brittain, J. Hammar, D. Jacobsen, B. Jones, C. Juillet, M. Kahlert, K. Kidd, E. Luiker, J. Olafsson, M. Power, M. Rautio, A. Ritcey, R. Striegl, M. Svenning, J. Sweetman, M. Whitman. 2012. The Arctic Freshwater Biodiversity Monitoring Plan. CAFF International Secretariat, CAFF Monitoring Series Report Nr. 7. CAFF International Secretariat. Akureyri, Iceland. ISBN 978-9935-431-19-6
Cover photo: Arctic lake: Oksana Perkins/Shutterstock.com
For more information please contact:CAFF International SecretariatBorgir, Nordurslod600 Akureyri, IcelandPhone: +354 462-3350Fax: +354 462-3390Email: [email protected]: www.caff.is
CAFF Designated Area
AuthorsJoseph CulpWillem GoedkoopJennifer LentoKirsten ChristoffersenSteve FrenzelGuðni GuðbergssonPetri LiljaniemiSteinar SandøyMichael SvobodaJohn BrittainJohan HammarDean JacobsenBenjamin JonesCedric JuilletMaria KahlertKaren KiddEric LuikerJon OlafssonMichael PowerMilla RautioAllison RitceyRobert StrieglMartin SvenningJon SweetmanMatthew Whitman
Layout and editing:Courtney Price

AcknowledgementsThis work was developed by Arctic freshwater experts from Canada, Denmark, Finland, Iceland, Norway, Russia, Sweden and the USA at workshops in Uppsala, Sweden (2010) and Fredericton, Canada (2011). The document was improved by valuable, constructive criticism of an earlier draft from Patricia Chambers (Canada), Jaakko Erkinaro (Finland), Mike Gill (CBMP), Richard Johnson (Sweden), Sandy Milner (UK), and Jim Reist (Canada). Staff of the Conservation of Arctic Flora and Fauna Office provided advice to the Freshwater Expert Monitoring Group during development of the plan. Workshops were funded by the Canadian Rivers Institute, Environment Canada and the Swedish Environmental Protection Agency. Travel funding was provided by the institutions of all authors and the CBMP. PDF support to J. Lento was granted by the Canadian Rivers Institute (University of New Brunswick) and Environment Canada. World Physical Map layer presented in Appendix D created by the U.S. National Park Service and made available by ESRI (http://www.arcgis.com/home/item.html?id=c4ec722a1cd34cf0a23904aadf8923a0).
The Freshwater Expert Monitoring Group at their Fredericton workshop to develop the Arctic Freshwater Biodiversity Monitoring Plan. Photo: The Circumpolar Biodiversity Monitoring Program
4
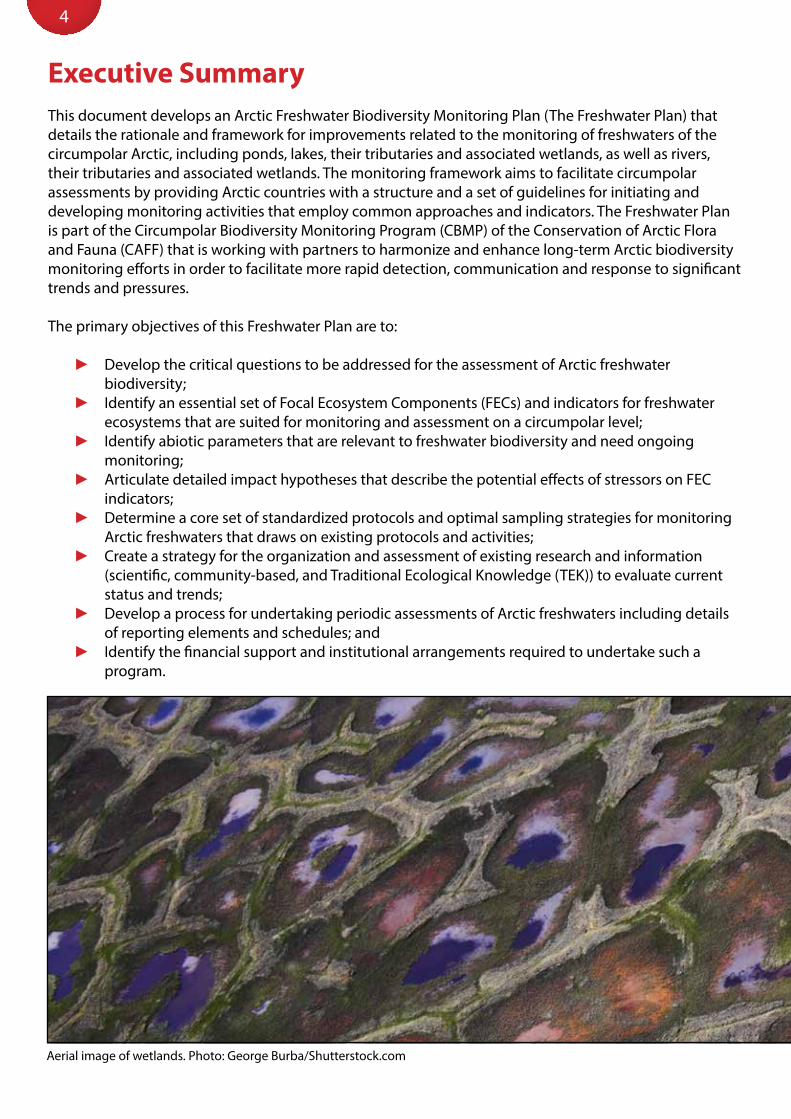
Executive SummaryThis document develops an Arctic Freshwater Biodiversity Monitoring Plan (The Freshwater Plan) that details the rationale and framework for improvements related to the monitoring of freshwaters of the circumpolar Arctic, including ponds, lakes, their tributaries and associated wetlands, as well as rivers, their tributaries and associated wetlands. The monitoring framework aims to facilitate circumpolar assessments by providing Arctic countries with a structure and a set of guidelines for initiating and developing monitoring activities that employ common approaches and indicators. The Freshwater Plan is part of the Circumpolar Biodiversity Monitoring Program (CBMP) of the Conservation of Arctic Flora and Fauna (CAFF) that is working with partners to harmonize and enhance long-term Arctic biodiversity monitoring efforts in order to facilitate more rapid detection, communication and response to significant trends and pressures.
The primary objectives of this Freshwater Plan are to:
► Develop the critical questions to be addressed for the assessment of Arctic freshwater biodiversity;
► Identify an essential set of Focal Ecosystem Components (FECs) and indicators for freshwater ecosystems that are suited for monitoring and assessment on a circumpolar level;
► Identify abiotic parameters that are relevant to freshwater biodiversity and need ongoing monitoring;
► Articulate detailed impact hypotheses that describe the potential effects of stressors on FEC indicators;
► Determine a core set of standardized protocols and optimal sampling strategies for monitoring Arctic freshwaters that draws on existing protocols and activities;
► Create a strategy for the organization and assessment of existing research and information (scientific, community-based, and Traditional Ecological Knowledge (TEK)) to evaluate current status and trends;
► Develop a process for undertaking periodic assessments of Arctic freshwaters including details of reporting elements and schedules; and
► Identify the financial support and institutional arrangements required to undertake such a program.
Aerial image of wetlands. Photo: George Burba/Shutterstock.com

5ARCTIC FRESHWATER BIODIVERSITY MONITORING PLAN
The Freshwater Plan establishes the framework by which national Freshwater Expert Networks (FENs) and the CBMP Freshwater Steering Group (CBMP-FSG) can cooperate to accumulate existing and new biodiversity data for the purpose of undertaking circumpolar freshwater assessments. Abiotic components that strongly affect biotic components, processes, or services will be considered during the planning and resultant interpretation phase. The first status and trends assessment will evaluate existing data, and will occur over the period 2013-2016, while subsequent assessments will make use of data from continuing monitoring activity. The Arctic regions considered include those areas covered by the Arctic Biodiversity Assessment (ABA) and CAFF boundaries, whichever is more inclusive for a particular area. In addition, the sub-region division developed for the ABA was adopted as an appropriate means of sub-dividing Arctic freshwaters. This schema divides the Arctic into three sub-regions: high Arctic, low Arctic and sub-Arctic. Delineation of sub-regions is based on a set of several biogeographical features like vegetation types, including the northern limit of the timber and treeline, duration of the biologically productive season and mean annual temperature.
The Freshwater Plan identifies a set of criteria for the selection of preferable monitoring sites, namely, (1)sites with high-quality and long-term data sets, (2) biodiversity hotspots, i.e., areas with high species richness or unique species composition (e.g., rare species) and high conservation value, (3) medium to small river catchments and lakes to ensure effective sampling effort and representative species collection, and (4) sites of high significance to local communities.
Additional variables for consideration during the selection of sites may include water source (e.g., glacial vs. non-glacial water bodies), presence or absence of fish, and geomorphic characteristics (e.g., mean stream width, mean lake depth).

6
The Working Process
Development of the Freshwater Plan is based on a framework document and work undertaken during workshops held in Uppsala, Sweden and in Fredericton, New Brunswick, Canada. Both workshops included freshwater experts with a broad range of expertise as well as Freshwater Expert Monitoring Group leads for each nation. These workshops identified important elements, i.e., stressors, FECs, parameters and indicators, to be incorporated into a pan-Arctic Freshwater Plan. FECs are defined as biotic or abiotic elements, such as taxa or key abiotic processes, which are ecologically pivotal, charismatic and/or sensitive to changes in biodiversity. Each of the FECs and indicators was given a rank of high, medium or low based on importance to ecosystem function and sensitivity to stressors, sampling feasibility, and data availability. Data for some FECs may not be available in existing Arctic monitoring databases, and an initial assessment of Arctic freshwater biodiversity status is expected to focus upon the most commonly monitored FECs, namely fish, benthic invertebrates, zooplankton, phytoplankton or benthic algae, and most abiotic FECs. After the initial assessment, this list should be adjusted based on the availability of data collected through ongoing monitoring programs of the Arctic countries.
Fifteen environmental and anthropogenic stressor types were identified as most likely having a strong impact on the FECs. These are listed below (not in order of importance):
Atmospheric Deposition of Short and Long Range Contaminants: Addition of toxic stress to Arctic freshwater ecosystems resulting in contaminant exposure and biomagnification.
Atmospheric Deposition of SOx and NOx (acidification): Direct modification of water chemistry including decreased pH and calcium, and increased release of aluminum.
Thermal Regime Change: Increasing Arctic temperatures that modify ice regimes and cumulative thermal degree days in lakes and streams.
Hydrological Regime Change: Shifts in the seasonal pattern of precipitation and ice cover and the resultant changes to freshwater habitat and seasonal disturbance.
Sediment Regime Change: Permafrost degradation and change in the hydrologic regime that increases the intensity, magnitude and frequency of disturbance of freshwater habitat through increased turbidity and shifts towards finer substrate composition.
Wind Regime Change: Shifts in wind force changes snow deposition and water circulation in lakes resulting in habitat modification.
UV Radiation Regime Change: Increased exposure to UV radiation in shallow habitats of clear lakes and streams.
Increased Nutrient Loading: Permafrost degradation and changes in hydrologic regime that lead to higher input of organic matter and inorganic nutrients to aquatic systems.
Shift in Nutrient and Contaminant Levels Due to Biotic Vectors: Refers to the role that increased or decreased population abundance of migratory species can have in determining the deposition of nutrients and contaminants to aquatic ecosystems.
Fisheries Over-Harvesting: Refers to shifts in mortality, demographic characteristics, reduced competition or loss of prey resources that result from unsustainable harvesting of fish stocks by humans.

7ARCTIC FRESHWATER BIODIVERSITY MONITORING PLAN
Resource Exploration and Exploitation: All stages and forms of resource extraction (e.g., hydrocarbon extraction, metal mining, water withdrawal) and their associated impacts such as wastewater discharge, spills, habitat disturbance and flow regime disturbance.
Transportation and Utility Corridors: Increase in various types of human transportation corridors including roads, power lines and associated features such as culverts that can affect environmental conditions including flow, nutrient and sediment regimes, and connectivity.
Flow Alteration: Modification of flow regimes and habitat fragmentation through the construction of dams used for hydropower generation or stabilization of water supply.
Increased Agricultural Activity: Refers to the effects on aquatic habitats that result from various agricultural activities such as farming and animal grazing.
Introduction of Alien Genetic Types: Modification of composition and native genetic structure of aquatic biota through the introduction of new genotypes or invasive species (e.g., for culturing).
The mechanistic link between an environmental or anthropogenic stressor and the FECs was identified through “Impact Hypotheses”, i.e., predictive statements that outline the potential ways in which selected stressors (see above) might impact the structural or functional FECs. Information on available freshwater data for FECs was also summarized, and will be the basis for the first assessment of freshwaters in the Arctic. At the workshops, conceptual models of expected stressor-induced change to freshwater biodiversity and production were also developed for several types of stressors. These include effects of rising mean water temperature, nutrient enrichment, and catchment resource development on biodiversity and ecosystem function.
Assessment and Reporting
The Freshwater Plan presents a list of priority parameters and indicators for assessing biodiversity in Arctic freshwater systems based on the (1) sensitivity to environmental or anthropogenic stressors, (2) scientific validity and relevance, (3) sustainability and relevance in a monitoring capacity, (4) availability of targets and thresholds, and (5) practicality/feasibility. Parameters and indicators that met these criteria were listed for each FEC. This suite of parameters and indicators will be used for the assessment of the state of Arctic freshwater biodiversity. The Freshwater Plan also outlines biotic and abiotic sampling approaches for lakes and rivers that are recommended for a long-term monitoring program. These sampling approaches were designed to establish high-quality, long-term data that can be used to detect the impact of stressors on freshwater diversity, and include general protocols describing strategies for site selection, sample collection and processing.
The Freshwater Plan identifies four important aspects of a sound sampling strategy for a coordinated pan-Arctic monitoring program. These are (1) sampling of the full range of habitats (e.g., littoral and pelagic zones in lakes, riffles and pools in rivers) that are important for the overall structure of the ecosystem and the function of the food web, (2) using fixed, sentinel sampling stations and protocols, (3) prioritizing an intensive and continuous program running at fewer well-chosen sites to evaluate temporal trends, and (4) developing a network of abiotic and biotic measures from a range of lakes and rivers across the pan-Arctic. A data management framework for the Freshwater P is also proposed.
The analytical approach proposed for the assessment of data and other information collected through the Freshwater Plan is divided into two phases. The first (start-up) phase will rely on existing monitoring data and traditional knowledge. In this phase, the contemporary status of freshwater biodiversity will be assessed using data from 1945 to present, while historical conditions will be assessed using available data from the pre-industrial period and paleolimnological records. The evaluation of contemporary status and historical trends of Arctic freshwaters will be included in an initial State of Arctic Freshwater

8
Biodiversity report in 2016. The second phase of analysis will involve the future assessment of change in Arctic freshwaters through the evaluation of coordinated biomonitoring data driven by the Freshwater Plan. This and subsequent analyses will assess the change in biodiversity and important supporting variables of Arctic lakes and rivers and will be summarized in subsequent State of Arctic Freshwater Biodiversity reports that will be completed on a regular basis. In this stage, the collection of data and analysis of status and trends will be completed by national Freshwater Expert Networks (FENs) established in each country. Analytical procedures and approaches will be designed and recommended by the Freshwater Steering Group (CBMP-FSG) to maintain continuity and data quality among the networks.
These tools include:
► Biomonitoring indicators and metrics, including indicator species and biodiversity metrics; ► Estimates of biological change through proxy measurements such as changes in temperature
and hydrological regimes and land use; ► Multivariate analysis of community structure and associated environmental gradients; ► Time-series analysis of biological and physico-chemical trends.
Power analysis will be used to determine whether additional data are required to detect biologically significant trends.
Activities related to the Freshwater Plan will be summarized in reports that will include results of the analysis of data collected through the Freshwater Plan, as well as information on the creation, development, and assessment of aspects of the plan. The audiences for this information range from policy-makers to local community residents, and as such, several types of reporting will be necessary. An initial State of Arctic Freshwater Biodiversity Report (to be completed in 2016) will provide the baseline assessment of the state of freshwater systems in the Arctic, and will act as a reference in time for the expected ecological change in Arctic freshwaters beyond 2016. This assessment will build upon information from the Arctic Biodiversity Assessment. Regular assessment reports will evaluate changes beyond the baseline conditions established in this initial report.
Lastly, the Freshwater Plan presents the plan for implementation and administration, including the governance structure, timelines, and budget. In addition to international bodies of the Arctic Council, other groups involved in the implementation of the Freshwater Plan will include national, sub-national and local jurisdictions across the Arctic that already undertake biodiversity monitoring. Implementation and program review incorporates the CBMP’s network-of-networks approach and aims to provide value-added information on the state of Arctic freshwaters that is useful for national and other reporting needs. Ultimately, it will be the responsibility of each Arctic country to implement the Freshwater Plan in order for the program to succeed. Northern Swedish shoreline. Photo: Andreas Gradin/Shutterstock

9ARCTIC FRESHWATER BIODIVERSITY MONITORING PLAN
Table of ContentsAcknowledgements .................................................................................................... 3
Executive Summary .................................................................................................... 4
1. Introduction and Background .............................................................................131.1 Introduction ............................................................................................................................................................... 14
1.1.1 Overview of Arctic freshwater monitoring........................................................................................ 141.1.2 Document structure ................................................................................................................................. 15
1.2 Background on the Arctic Freshwater Biodiversity Monitoring Plan .................................................... 161.2.1 CBMP ecosystem-based and network of networks approach .................................................. 161.2.2 Development of the Arctic Freshwater Biodiversity Monitoring Plan .................................... 161.2.3 Objectives of the Freshwater Integrated Monitoring Plan .......................................................... 19
1.3 Important Concepts and Terminology ............................................................................................................. 191.3.1 Definition of biodiversity ......................................................................................................................... 191.3.2 Water body classification ......................................................................................................................... 201.3.3 Terminology.................................................................................................................................................. 21
1.4 Freshwater Assessment Process and Broad Questions to be Addressed ............................................. 211.5 Linkages and Relevance to Other Programs and Activities ...................................................................... 22
2. Arctic Biogeography and Freshwater Areas .......................................................232.1 Criteria Used to Select Water bodies for Monitoring ................................................................................... 24
3. Conceptual Scenarios of Arctic Freshwater Ecosystems ....................................27
4. Selecting Focal Ecosystem Components, Parameters, and Indicators .............334.1 Process for Identifying and Selecting Focal Ecosystem Components, Parameters, and Indicators 34
4.1.1 Background paper and workshop process ....................................................................................... 344.1.2 Scoping process .......................................................................................................................................... 344.1.3 Criteria for Selecting Parameters and Indicators ............................................................................ 35
5. Coordinated Monitoring: Focal Ecosystem Components, Stressors, Impact Hypotheses, and Indicators .....................................................................................36
5.1 Focal Ecosystem Components............................................................................................................................. 375.2 Environmental and Human Activity Stressors ............................................................................................... 385.3 Impact Hypotheses for Lakes and Rivers ......................................................................................................... 385.4 Indicators for Lakes and Rivers ............................................................................................................................ 42
6. Sampling Approach and Recommended Protocols ...........................................446.1 Introduction ............................................................................................................................................................... 45
6.1.1 Basic monitoring program ...................................................................................................................... 456.1.2 Overall sampling strategy ....................................................................................................................... 466.1.3 Sampling sites.............................................................................................................................................. 47
6.2 Lake Monitoring Approach .................................................................................................................................. 476.2.1 Recommendations for general sampling approach ...................................................................... 516.2.1.1 Supporting variables ...................................................................................................................................................................526.2.2 Biotic FECs ..................................................................................................................................................... 526.2.2.1 Plankton ...........................................................................................................................................................................................526.2.2.2 Benthos .............................................................................................................................................................................................526.2.2.3 Fish .....................................................................................................................................................................................................53

10
6.2.2.4 Macrophytes ...................................................................................................................................................................................546.2.2.5 Aquatic birds ...................................................................................................................................................................................546.2.3 Abiotic FECs ................................................................................................................................................. 556.2.3.1 Water temperature regime ........................................................................................................................................................556.2.3.2 Hydrological and ice regimes ...................................................................................................................................................556.2.3.3 Water quality ...................................................................................................................................................................................566.2.3.4 Climatic regime ..............................................................................................................................................................................566.2.3.5 Permafrost and active layer .......................................................................................................................................................56
6.3 River Monitoring Approach .................................................................................................................................. 576.3.1 Recommendations for general sampling approach ...................................................................... 596.3.1.1 Supporting variables ...................................................................................................................................................................596.3.2 Biotic FECs ..................................................................................................................................................... 596.3.2.1 Benthic algae ..................................................................................................................................................................................596.3.2.2 Benthic macroinvertebrates ......................................................................................................................................................606.3.2.3 Fish .....................................................................................................................................................................................................616.3.2.4 Riparian vegetation ......................................................................................................................................................................626.3.3 Abiotic FECs .................................................................................................................................................. 626.3.3.1 Water temperature regime ........................................................................................................................................................626.3.3.2 Hydrologic and ice regimes .......................................................................................................................................................636.3.3.3 Water quality ...................................................................................................................................................................................636.3.3.4 Climatic regime ..............................................................................................................................................................................636.3.3.5 Permafrost and active layer .......................................................................................................................................................63
7. Data Management Framework ............................................................................647.1 Data Management Objectives for the CBMP ................................................................................................. 657.2 Purpose of Data Management ............................................................................................................................ 657.3 Coordinated Data Management and Access: the CBMP Web-based Data Portal (www.abds.is) 667.4 Data Storage, Policy and Standards .................................................................................................................. 68
8. Data, Samples, and Information Analysis ..........................................................698.1 Introduction ............................................................................................................................................................... 708.2 Basis for Analysis ....................................................................................................................................................... 70
8.2.1 Start-up phase (2013 -2016) ................................................................................................................... 708.2.1.1 Contemporary status (1945 to present) ................................................................................................................................718.2.1.2 Historical conditions ..................................................................................................................................................................718.2.2 Second phase (Beyond 2016) ................................................................................................................ 728.2.2.1 Future conditions (Present to 100 years from now) .........................................................................................................72
8.3 Analytical Approach ................................................................................................................................................ 72
9. Reporting ...............................................................................................................739.1 Audiences ................................................................................................................................................................... 749.2 Types and Timing of Reporting ........................................................................................................................... 749.3 Reporting Results ..................................................................................................................................................... 76
9.3.1 State of Arctic Freshwater Biodiversity Report ......................................................................................................................769.3.2 Status of indicators ..........................................................................................................................................................................769.3.3 Program review .................................................................................................................................................................................769.3.4 Scientific publications .....................................................................................................................................................................779.3.5 Performance reports and work plans ........................................................................................................................................779.3.6 Summaries and other communications material .................................................................................................................77
10. Freshwater Implementation and Administration ............................................7810.1 Governing Structure ............................................................................................................................................. 7910.2 Program Review ..................................................................................................................................................... 8010.3 Implementation Schedule and Budget ......................................................................................................... 81

11ARCTIC FRESHWATER BIODIVERSITY MONITORING PLAN
11. Literature Cited ...................................................................................................85
12. Glossary of Acronyms .........................................................................................90
Appendix A. Terms of Reference ..............................................................................92I. Introduction ................................................................................................................................................................... 93II. CBMP Freshwater Steering Group Goals ............................................................................................................ 93III. Administration ............................................................................................................................................................ 94
A. Membership....................................................................................................................................................... 94B. Leadership .......................................................................................................................................................... 94C. Coordination ..................................................................................................................................................... 95D. Work plan ............................................................................................................................................................ 95E. Decision-making ............................................................................................................................................... 95F. Expenses .............................................................................................................................................................. 95
IV. National Freshwater Expert Networks ............................................................................................................... 95
Appendix B. Detailed Justification of FECs for Initial and Future Monitoring .....96
Appendix C. Monitoring Protocol Details ............................................................103C.1 Three-tier approach ..............................................................................................................................................104C.2 Lake Monitoring Protocols ................................................................................................................................104
C.2.1 Biotic FECs ...................................................................................................................................................104C.2.1.1 Plankton ........................................................................................................................................................................................ 104C.2.1.2 Benthos ......................................................................................................................................................................................... 105C.2.1.3 Fish .................................................................................................................................................................................................. 107C.2.1.4 Macrophytes ................................................................................................................................................................................ 109C.2.1.5 Aquatic birds ............................................................................................................................................................................... 109C.2.2 Abiotic FECs ..............................................................................................................................................110C.2.2.1 Water temperature regime ..................................................................................................................................................... 110C.2.2.2 Hydrologic and ice regimes ................................................................................................................................................... 110C.2.2.3 Water quality ............................................................................................................................................................................... 111C.2.2.4 Climatic regime .......................................................................................................................................................................... 112C.2.2.5 Permafrost and active layer .................................................................................................................................................... 113
C.3 River Monitoring Protocols.................................................................................................................................114C.3.1 Biotic FECs ...................................................................................................................................................114C.3.1.1 Benthic algae ............................................................................................................................................................................... 114C.3.1.2 Benthic macroinvertebrates .................................................................................................................................................. 115C.3.1.3 Fish .................................................................................................................................................................................................. 116C.3.1.4 Riparian vegetation ................................................................................................................................................................... 119C.3.2 Abiotic FECs ...............................................................................................................................................119C.3.2.1 Water temperature regime ..................................................................................................................................................... 119C.3.2.2 Hydrologic and ice regimes ................................................................................................................................................... 119C.3.2.3 Water quality ............................................................................................................................................................................... 120C.3.2.4 Climatic regime .......................................................................................................................................................................... 121C.3.2.5 Permafrost and active layer .................................................................................................................................................... 121
C.4 Additional Methods for Sampling and Analyzing FECs in Lakes and Rivers ....................................122C.4.1 Stable isotope analysis of food web structure ..............................................................................122C.4.2 Remote sensing ........................................................................................................................................123
Appendix D. Current and Historical Sampling Coverage Maps by FEC ..............125
Appendix E. Data Storage, Policy and Standards Details ...................................147I. Data Storage ................................................................................................................................................................148II. Data Policy 148
12
B. Intellectual property rights .........................................................................................................................148C. Data sharing and access ..............................................................................................................................149D. Data release code .........................................................................................................................................149E. Data use restrictions ......................................................................................................................................149F. Acknowledgements .......................................................................................................................................150
III. Data and Metadata Standards ............................................................................................................................150
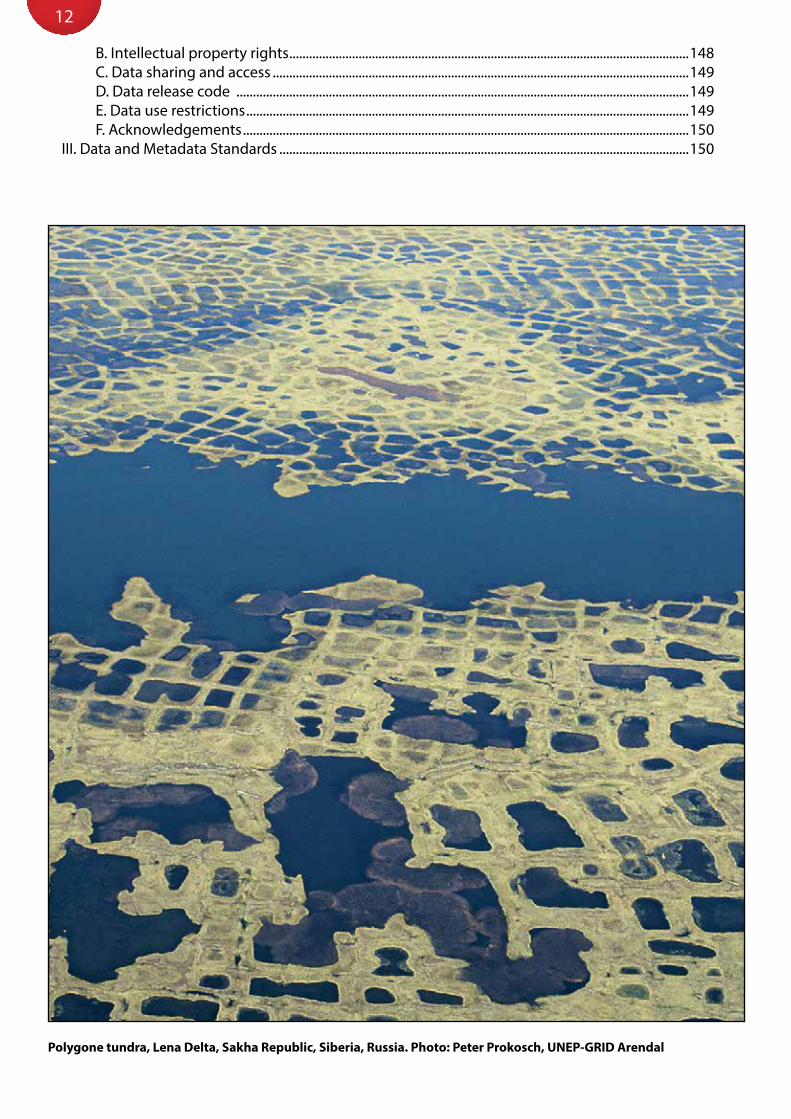
Polygone tundra, Lena Delta, Sakha Republic, Siberia, Russia. Photo: Peter Prokosch, UNEP-GRID Arendal

Arctic Biodiversity Trends 201013
1. Introduction and Background

14
1.1 Introduction
1.1.1 Overview of Arctic freshwater monitoring
Maintaining healthy Arctic ecosystems is a global imperative as the Arctic plays a critical role in the Earth’s physical, chemical and biological systems. These ecosystems are also of fundamental economic, cultural and spiritual importance to Arctic residents, many of whom maintain close connection to the land (e.g., harvesting food). To meet these challenges, the Circumpolar Biodiversity Monitoring Program (CBMP) of the Conservation of Arctic Flora and Fauna (CAFF) is working with partners to harmonize and enhance long-term Arctic biodiversity monitoring efforts to facilitate more rapid detection, communication and response to significant environmental pressures.
Arctic freshwater ecosystems, here defined as rivers, streams, lakes, ponds, and their associated wetlands (see Section 1.3), are under increasing threat from stressors including climate change, contaminants, introduced species, increased UV radiation exposure, and resource development (e.g., Hammar 1989; Reist et al. 2006a, c). Climate change, for example, is predicted to cause direct and indirect effects to these systems and the biodiversity they support, including the fish used by Northerners. Changes in the physical and chemical properties of freshwater systems will result in modifications to water temperature and ice cover regimes, thawing permafrost, hydrological processes and water balance (Prowse et al. 2006a, b; Christoffersen et al. 2008). Other transformations in biodiversity will be related to the impact of growing competition from southern species expanding northwards (Reist et al. 2006b). These stressors are expected to produce changes to freshwater fisheries around the Arctic and modify aquatic plant, invertebrate and vertebrate distributions. Ecosystem services to humans also will be affected through various impacts such as changes in fisheries harvest, drinking water source, and disposal of municipal waste.
Alaskan lake. Photo: no_use_for_a_name/Shutterstock.com

15ARCTIC FRESHWATER BIODIVERSITY MONITORING PLAN
Despite the growing pressures to freshwater biodiversity noted previously in the Arctic Climate Impact Assessment (Wrona et al. 2006a, c), freshwater monitoring efforts in the Arctic are very limited, largely uncoordinated and lack the ability to detect, understand and respond to biodiversity trends at the circumpolar scale (Culp et al. 2011a). Because of the Arctic’s size and its diversity of freshwater habitats, the qualitative and quantitative detection of shifts in biodiversity is extremely challenging. This task demands a rigorous, integrated ecosystem-based approach that identifies circumpolar Arctic trends in biodiversity, indicates the underlying causes of these trends, and has the ability to detect change within a reasonable time frame. Such a strategic approach must be developed over time with the cooperation of various stakeholders, including the northern communities, policy makers and the science community. Indeed, an initial coordination of sampling efforts and assessment of the current state of Arctic freshwaters is required to provide a foundation upon which a long-term monitoring approach can be built. Towards this end, the CBMP facilitates an integrated, ecosystem-based monitoring approach through the convening of expert groups for the major themes of Arctic Freshwater, Marine, Coastal, and Terrestrial. These groups function as a forum for scientists, community experts and managers to promote, facilitate, and coordinate pan-Arctic research and monitoring activities. The monitoring plans they produce provide a framework for improved and cost-effective monitoring designed to have a greater ability to detect and understand significant trends in Arctic biodiversity.
1.1.2 Document structure
This document develops an Arctic Freshwater Biodiversity Monitoring Plan (The Freshwater Plan) that details the rationale and framework for improvements related to monitoring the freshwaters of the circumpolar Arctic. This monitoring framework aims to facilitate circumpolar assessments by providing a structure and a set of guidelines for initiating and further developing monitoring activities that employ common approaches and indicators. The Freshwater Plan will be developed and improved further as it is implemented and as sequential assessments with specific terms of reference and objectives are completed.
The Freshwater Plan adheres to the guidelines developed by the World Bank for the design and implementation of biodiversity monitoring programs (World Bank 1998). The World Bank report outlines the primary requirements for a successful biodiversity and monitoring plan, namely that it have clear statements regarding the: (1) questions and objectives to be addressed; (2) suite of chosen indicators; (3) frequency of and responsibility for monitoring; (4) frequency of and parties responsible for assessments; (5) list of training and financial support required to complete the program; (6) intended audience for the assessments; (7) linkage between assessments and management decisions; (8) decision points at which action must be taken to address negative trends; and (9) costs and funding sources for the various activities.
The remainder of this chapter outlines the background on the Freshwater Plan and its development, including program design and objectives, important concepts and terminology, the assessment process and questions it will address, and linkages to other international programs. Chapter 2 discusses focal Arctic regions for assessment and the criteria used to select freshwater bodies to be monitored. General conceptual models for lake and river ecosystems are developed in Chapter 3 to help identify biotic and abiotic elements to be monitored for status and trend assessments. A central component of the development of the Freshwater Plan was the identification of Focal Ecosystem Components (FECs) and indicators (see section 1.3); this scoping process is described in Chapter 4. Chapter 5 details the identified FECs and indicators, and lists stressors that could affect them. Chapter 5 also includes detailed hypotheses of potential impacts on FECs. Sampling strategy and design for lakes and rivers is discussed in Chapter 6, data management is reviewed in Chapter 7, suggested analytical approaches for data assessment are outlined in Chapter 8, and the various reporting elements are described in Chapter 9. Finally, the institutional arrangements and determination of who is responsible for implementing and sustaining future monitoring and assessment is presented in Chapter 10.

16
1.2 Background on the Arctic Freshwater Biodiversity Monitoring Plan
1.2.1 CBMP ecosystem-based and network of networks approach
The ecosystem approach applied by the CBMP is part of the Convention on Biological Diversity (CBD) framework, which strategically integrates the management of land, water and living resources to promote conservation and sustainable use of resources. Ecosystem integrity is investigated through scientific methodologies aimed at assessing levels of biological organization that include essential ecosystem processes and functions, and interactions among organisms and their environment. Notably, humans are considered an integral component of ecosystems.
Central to applying the ecosystem approach is the formation of Expert Monitoring Groups (EMGs) and the development of monitoring frameworks designed for each ecosystem theme identified by the CBMP, namely the Freshwater, Terrestrial, Marine, and Coastal monitoring components (Fig. 1). Each EMG produces monitoring frameworks and methodologies that provide the details for integrating, managing and analyzing existing and new data. This data assessment process will produce new knowledge on the state of Arctic biodiversity and aid stakeholders, including northern communities, scientists and policy makers.
An assumption of the CBMP conceptual model is that each EMG incorporates a Network of Networks approach that links multiple monitoring frameworks within and among the Arctic countries to the overarching Integrated Monitoring Plan. Moreover, links to extra Arctic networks (including and beyond Arctic boundaries) will also be made to provide more scope and understanding. Ultimately, EMG outputs will be amalgamated by the CBMP to identify important linkages among the ecosystem components and to determine whether these linkages have implications for Arctic freshwater biodiversity. Efforts will be made to incorporate existing monitoring networks and to foster interaction with other Arctic Council programs such as the Arctic Monitoring Assessment Program (AMAP).
As noted by Mackinson (2001) and Gofman (2010), and also discussed in the Arctic Marine Biodiversity Monitoring Plan (Gill et al. 2011), Arctic residents can and do play an important role in the evaluation of Arctic biodiversity through contributions to standard scientific monitoring procedures as citizen-scientists and through the provision of Traditional Ecological Knowledge (TEK). A vital aspect of this contribution is the increased capacity that Arctic residents contribute so monitoring programs can be expanded to additional sites and seasons. Thus, the ecosystem-based, network-of-network approach will facilitate contributions to the Freshwater Plan by circum-Arctic Indigenous peoples and residents. This will help strengthen the infrastructure of the Freshwater Plan and ensure that the program is relevant and responsive to local concerns.
1.2.2 Development of the Arctic Freshwater Biodiversity Monitoring Plan
The CBMP established the Freshwater Expert Monitoring Group (Freshwater EMG) in January 2010 to develop a framework for an integrated, ecosystem-based approach for monitoring Arctic freshwater biodiversity. This framework, or Freshwater Plan, was created during two workshops attended by freshwater experts from the Arctic countries. The first workshop in Uppsala, Sweden identified important elements (stressors, FECs, parameters and indicators) to be incorporated into a pan-Arctic Freshwater monitoring plan. Linkages between environmental or anthropogenic stressors and FECs were described as impact hypotheses (Culp et al. 2011b). A second workshop in Fredericton, Canada refined the lists of FECs, parameters and indices, and produced lists of priority freshwater elements and a draft Freshwater Plan.
The Freshwater EMG based its work on the principle that the Freshwater Plan should aid Arctic countries in developing monitoring plans to inventory existing Arctic biodiversity monitoring activities. These data would form the basis for status and trend assessments of Arctic freshwaters. The Freshwater Plan should

17ARCTIC FRESHWATER BIODIVERSITY MONITORING PLAN
Figure 1. Relationship of Expert Monitoring Groups to the Circumpolar Biodiversity Monitoring Program of the Conservation of Arctic Flora and Fauna.

18
also facilitate the coordination and harmonization of freshwater biodiversity monitoring activities among circumpolar Arctic countries. Additionally, the Freshwater Plan would improve ongoing communication among and between scientists, community experts, managers and disciplines both inside and outside the Arctic.
Group consensus within the Freshwater EMG determined that status and trend assessments would best be produced by a CBMP Freshwater Steering Group (see Chapter 10 for program details) charged with coordinating the rollup of monitoring information from all Arctic countries into circumpolar assessments. A Freshwater Expert Network (FEN) for each country would be responsible for providing national status and trend information to the CBMP Freshwater Steering Group for periodic assessments. These circumpolar assessments would also inform the public, as well as policy- and decision-makers (local to the international level), on the state of Arctic freshwaters. Furthermore, the assessments would provide a forum for incorporating ongoing scientific input and Traditional Ecological Knowledge (TEK) into existing monitoring programs.
Thus, working with the national FENs, the CBMP Freshwater Steering Group would provide information on status and trends in Arctic biodiversity to the Arctic Council and its working groups, other CBMP EMGs, the international scientific community, global monitoring and assessment networks and conventions (e.g. Global Earth Observation – Biodiversity Observing Network, the Convention on Biological Diversity (see CBD COP 10 Decision X/III) and the Biodiversity Indicators Partnership), and where appropriate, to national assessments (Fig. 2). The national FENs and the CBMP Freshwater Steering Group will identify gaps in monitoring coverage, promote improved communication and linkages among Arctic researchers and monitoring groups, and contribute to the identification of scientific questions.
Figure 2. Flow diagram and framework illustrating the various CBMP freshwater outputs and linkages to Arctic Council assessments, other working groups and CBMP EMGs, the scientific community, and national programs.
Arctic Council
CAFF
CBMP
National Assessments
Other Working Groups(e.g., AMAP)
Other EMGs
Other Assessments(e.g., ABA)
CBMP Freshwater Outputs
1. Integrated Monitoring Plan1. Periodic pan-Arctic status/trends reports1. Information other assessments, EMGs WGs1. Input into national programs
internal reporting
integrated WG Monitoring
Journal Articles

19ARCTIC FRESHWATER BIODIVERSITY MONITORING PLAN
1.2.3 Objectives of the Freshwater Integrated Monitoring Plan
The Freshwater Plan provides Arctic countries with a common framework and approach for developing monitoring activities and circumpolar freshwater assessments. A basic premise applied by the Freshwater EMG is that the Freshwater Plan will continue to be developed and improved through time. The primary objectives of this Freshwater Plan are to:
► Develop the questions to be addressed by an assessment of Arctic freshwater biodiversity; ► Identify an essential set of FECs and indicators for freshwater ecosystems that are suited for
monitoring and assessment on a circumpolar level; ► Identify abiotic parameters that are relevant to freshwater biodiversity and need ongoing
monitoring; ► Articulate detailed impact hypotheses that describe the potential effects of stressors on FEC
indicators; ► Identify a core set of standardized protocols and optimal sampling strategies for monitoring
Arctic freshwaters that draws on existing protocols and activities; ► Create a strategy for the organization of existing research and information (scientific,
community-based, and TEK) to evaluate current status and trends; ► Develop a process for undertaking periodic assessments of Arctic freshwaters including details
of reporting elements and schedules; and ► Identify the financial support and institutional arrangements required to undertake such a
program.
1.3 Important Concepts and Terminology
1.3.1 Definition of biodiversity
In keeping with the protocol used by the Marine EMG (Gill et al. 2011), the Freshwater EMG adopted the definition of biodiversity forwarded by the Convention on Biological Diversity (CBD). In Article 2 of the CBD, biodiversity is described as “the variability among living organisms from all sources including, among other things, terrestrial, marine and other aquatic ecosystems and the ecological complexes of which they are a part; this includes diversity within species, between species and of ecosystems.” Under this definition, biodiversity includes components at the genetic, species and ecosystem levels in freshwaters of the circumpolar Arctic. The Freshwater EMG emphasized the need to monitor many elements of ecosystems including, for example, populations, community structure, ecosystem processes and function, as well components of the abiotic environment.
Human activities impose stressors that are anticipated to change Arctic freshwater biodiversity. Heino et al. (2009) provide a useful conceptual framework for relating anthropogenic influences to biodiversity loss that is applied here to help structure questions addressed by the Freshwater Plan (Fig. 3). As detailed in Chapters 3 and 5, climatic change through increased water temperature and altered hydrologic regimes has the potential to modify aquatic biodiversity at multiple spatial scales. In addition, various human activities, such as resource development, land-use change, and the resultant increased human population growth in the Arctic, are expected to directly affect freshwater biodiversity. The Freshwater EMG monitoring framework provides improved understanding of the basic relationships between Arctic freshwater biodiversity and the stressors that are predicted to produce ecosystem change, thus addressing a primary recommendation of the Arctic Climate Impact Assessment (Wrona et al. 2006d).

20
Figure 3. Diagram illustrating the relationships among climate change and other important anthropogenic influences such as changes in land use and the effects on biodiversity of Arctic freshwaters. Adapted from Heino et. al. (2009) and Kappelle et al. (1999).
1.3.2 Water body classification
The Freshwater Plan provides a framework for monitoring freshwater systems including ponds, lakes, their tributaries and associated wetlands, as well as rivers, their tributaries and associated wetlands. Following expert discussion, the Freshwater EMG chose to consider wetlands as extensions of lake and river habitats following previous decisions and definitions of the Ramsar Convention (Ramsar Convention Secretariat 2011). Abiotic and biotic components and processes that occur within wetlands and that directly influence lentic and lotic water bodies (e.g., terrestrial-aquatic linkages, such as the storing of contaminants in wetland soils and their release into adjacent water bodies with flooding events) will be included in status assessments. Wetlands not directly associated with lentic and lotic water bodies will be a component included in the Arctic Terrestrial Biodiversity Monitoring Plan.
There are no universal technical definitions to distinguish between streams and rivers, or ponds and lakes, for the purpose of classifying water bodies, although differentiation is generally based on water body size. Classification of running waters is predominantly by means of stream order, which uses size and position within the drainage network to classify the smallest streams (1st order) to the largest rivers (approximately 12th order). The Freshwater Plan was designed to facilitate inclusion of streams and rivers across the entire range of stream orders found in the Arctic, to the extent that monitoring activities
Biodiversity Change
Climate Regime Human Activity
Arctic Freshwater Biodiversity
Changes to:Ecosystems and habitat characteristics
Species composition and richnessGeographic distribution of species
Atmospheric increase in greenhouse gases
Global changes in temperature and precipitation
Increased temperature
Permafrost degradation
Altered hydrologic pattern
Land use changes
Resource development
Increased population siz
e

21ARCTIC FRESHWATER BIODIVERSITY MONITORING PLAN
remain feasible.
The international Ramsar wetland convention uses 8 ha (~80,000 m2) as the upper size limit for a pond, but limnologists have not adopted this convention. Consequently, there are regional or country-specific definitions of standing water bodies between 1 m2 and 50,000 m2 in area (i.e., up to ~5 ha). Other criteria including the light regime (transparency to the bottom) and duration of the water-filled period have been suggested as part of the definition (see Rautio et al. 2011). In the CBMP context, we have agreed to keep a pragmatic definition that conflicts minimally with existing country-based definitions. A pond in the pan-Arctic region means a body of water, whether man-made or natural, of approx. 5-10,000 m2 (0.5-1 ha) and with an average depth (for the ice-free period) of 1-2 m, meaning that light can penetrate to the bottom during summer and that the water column freezes solid during winter. Thus, lakes in the CBMP context are defined as water bodies that exceed the above criteria.
1.3.3 Terminology
The following are definitions of frequently used terms (many of which were adapted from Gill et al. 2011) that are used throughout the Freshwater Plan:
► Focal Ecosystem Components (FECs) are biotic or abiotic elements, such as taxa or abiotic processes, which are ecologically pivotal, charismatic or sensitive to changes in biodiversity;
► A parameter is a measure used to describe the state of a particular component of an ecosystem (sometimes referred to as a variable);
► An indicator is a parameter, or suite of parameters, used to report on the state of an ecosystem or a component of that ecosystem that can be expressed either quantitatively or qualitatively; and
► An index (indices) is an aggregation or syntheses of indicators used to provide an overall perspective on a trend or change over time. Indices are intended to make identifying patterns easier by facilitating expression of relative rates of change.
► Impact Hypotheses are statements that outline the potential ways in which selected stressors might impact the structural or functional FECs.
1.4 Freshwater Assessment Process and Broad Questions to be Addressed
The Freshwater Plan establishes the framework by which the national Freshwater Expert Networks and the CBMP Freshwater Steering Group can accumulate existing and new data for the purpose of undertaking circumpolar freshwater assessments. The framework will facilitate an initial assessment of the status of Arctic freshwater biodiversity and subsequent assessment of trends. Steps in this process include (see Chapter 10 and Table 12 for the full schedule):
1. Establishment of Freshwater Steering Group and national FENs;2. Collection of existing monitoring data, including historical data where these are available;3. Assessment of historical and contemporary monitoring data for the initial State of Arctic
Freshwater Biodiversity report;4. Coordination of continued monitoring within each national FEN, and application of the
sampling approach recommended in Freshwater Plan;5. Ongoing assessment of trends in monitoring data and creation of State of Arctic Freshwater
Biodiversity reports; and6. Periodic and ongoing program reviews to assess program effectiveness.
The first status and trends assessment will evaluate existing data, and occur between 2013-2016, while subsequent assessments will make use of data from continuing and new monitoring activities. Assessments will focus on the biotic components, processes, and services of lentic and lotic water bodies including ponds, lakes, their tributaries and associated wetlands, as well as rivers, their tributaries and associated wetlands. Abiotic components that strongly affect biotic components, processes, or services

22
will be considered during the planning and resultant interpretation phase. In some instances, changes in abiotic variables may be used as proxies to estimate shifts in biodiversity (e.g., loss of shallow water habitat). The spatial area of interest for these assessments will include freshwaters of the high, low and sub-Arctic north of the treeline. This area incorporates the geographical boundaries identified by CAFF and the Arctic Biodiversity Assessment (see Chapter 2 for more details). More southerly water bodies entering or draining into this prescribed area may also be considered to increase data coverage for assessments (e.g., use of alpine regions as a proxy for higher latitudes).
Over the long-term, the assessments should address the following overarching questions:
1. What is the current status of freshwater biodiversity in the Arctic?2. Can biodiversity and ecological status in the Arctic be measured with simple variables and
indicators, and if so, what suite of variables should be measured?3. Are alpha and beta biodiversity changing, and if so, are they increasing or declining, and are
species moving or disappearing?4. What are the primary environmental and anthropogenic stressors causing the observed changes
in biodiversity?5. Are boundaries of the Arctic and sub-Arctic ecosystems shifting?
The above questions are highly ambitious because articulation of overarching questions is a basic requirement of such large, integrated programs. The details of how each question is to be addressed will be developed in the specific terms of reference and objectives for future assessments.
1.5 Linkages and Relevance to Other Programs and Activities
Outputs of a coordinated monitoring approach for Arctic freshwater ecosystems will serve a number of mandates at various scales (see Figs. 1 and 2). The resulting information, as much as possible, will be provided at a local scale to serve decision-making. This will be achieved partly through local-scale, community-based monitoring approaches as discussed above, but also through interpolation and modeling techniques to provide information that residents of the Arctic can use to make effective adaptation decisions.
The outputs will also be of direct value to national and regional governments and departments who have a mandate for monitoring and reporting on the status of Arctic freshwater ecosystems. Optimal sampling schemes and standardized, integrated approaches to monitoring will allow regional and national governments to better understand trends and the mechanisms driving those trends. Only through a structured and collaborative effort can a government or department gain the ability to detect and understand trends experienced in their region, and therefore, effectively respond to those trends. Additional international linkages will include the Group on Earth Observations Biodiversity Observation Network (GEO-BON) Freshwater Working Group as well as the Convention on Biological Diversity (CBD), to contribute to the status and trends information that the CBMP will deliver to meet 2020 CBD targets. The Arctic Council will also be a direct beneficiary of the outputs of this collaborative effort. The outputs of the pan-Arctic freshwater monitoring and assessment process will help populate Arctic Council assessments and raise issues facing Arctic freshwater ecosystems that require a coordinated pan-Arctic or even global response.
In conclusion, while most Arctic biodiversity monitoring networks are national or regional in scope, there is substantive added value in establishing circumpolar connections among monitoring networks. The development of a pan-Arctic, long-term freshwater biodiversity monitoring plan will facilitate circumpolar connections between national and regional research and monitoring networks, thereby greatly increasing the power to detect and attribute change for a reduced cost compared to multiple, uncoordinated approaches.

2. Arctic Biogeography and Freshwater Areas

24
The Arctic represents a vast array of freshwater habitats that differ in many environmental attributes such as temperature and ice regimes, hydrological processes, catchment size, and geology. These differences create substantial challenges for the development of monitoring design, sampling protocols and data analyses. To reduce the range of catchment types to be assessed and to improve effectiveness of the monitoring plan, the Freshwater EMG made the decision to divide the Arctic into sub-regions with clearly defined and relatively uniform biogeographical characteristics. This approach permits more meaningful spatial comparisons across the Arctic and will provide a framework by which status and trends can be reported.
Several biogeographical delineations have been developed for the Arctic and its sub-regions, including the Circumpolar Arctic Vegetation Map (CAVM Team 2003), boundaries of the AMAP and CAFF Arctic Council programs, and the demarcations used by CAFF’s Arctic Biodiversity Assessment (ABA), among others. In some cases, the delineation of geographic boundaries and Arctic sub-regions has been completed on the basis of scientific interpretation (for example, of vegetation patterns), while other boundaries do not include sub-regions and have been set by political discussion (e.g., the CAFF boundary). To incorporate aspects of both these forms of boundary delineation without being exclusionary, the Arctic regions considered in this program will include those areas covered by the ABA and CAFF boundaries (Fig. 4), whichever is more inclusive for a particular area. In addition, the sub-region division developed for the ABA was determined to be an appropriate and feasible means of sub-dividing Arctic freshwaters for the Freshwater Plan. This schema divides the Arctic into three sub-regions: high Arctic, low Arctic and sub-Arctic (Fig. 4). Delineation of sub-regions is based on several biogeographical features adopted from the division of vegetation types, including the northern limit of the timber and treeline, duration of the biologically productive season and mean annual temperature. Ecological characteristics such as productivity and sensitivity to environmental change will likely be similar within sub-regions, allowing for comparison of different water bodies within the region with the aim of reducing variation and increasing statistical power of status and trend assessments. Moreover, the regional classification of Arctic freshwaters facilitates a spatially extensive sampling plan, with representation of all areas of the Arctic.
The study area was further expanded to include alpine regions that may be ecologically similar to the Arctic despite being outside of the spatial boundaries defining the Arctic. Only alpine areas that are spatially continuous with Arctic regions (e.g., areas of southern Norway and Sweden) will be included to highlight the physical connection between these areas that allows for northward dispersal. Other discontinuous alpine areas may be considered for inclusion on a site-by-site basis if approved through discussion with the CBMP Freshwater Steering Group. However, lower latitude, discontinuous alpine areas are generally excluded from the Freshwater Plan.
2.1 Criteria Used to Select Water bodies for Monitoring
The individual characteristics of lakes and rivers can differ strongly on a sub-regional level. As ecological condition is in part driven by hydromorphology and physicochemistry, this sub-regional variation can lead to a wide range of ecological responses to anthropogenic impacts. This creates a need to decrease the variation by setting guidelines for the selection of monitoring sites. A goal of the Freshwater Plan is to develop a monitoring network that provides clear guidance for the selection of representative sets of lakes and rivers to be monitored, such that these freshwater ecosystems characterize dominant biodiversity patterns at the sub-regional level.
One way to characterize the ecological diversity among sites is to classify water bodies by morphological and physicochemical characteristics. Parameters contributing to the different classifications of water body types could include size, flow conditions, temperature, alkalinity and humic content. The EU Water Framework Directive uses such a type-specific management of water bodies. European countries have defined a number of specific river and lake types covering the whole range of lake and river variability.
25ARCTIC FRESHWATER BIODIVERSITY MONITORING PLAN
This typification system could also be adopted in the Freshwater Plan and could help in the assessment of environmental status. However, such a classification would require analysis of the full range of hydromorphological and physicochemical conditions across the pan-Arctic region, and is not possible prior to an initial assessment of Arctic freshwater systems.
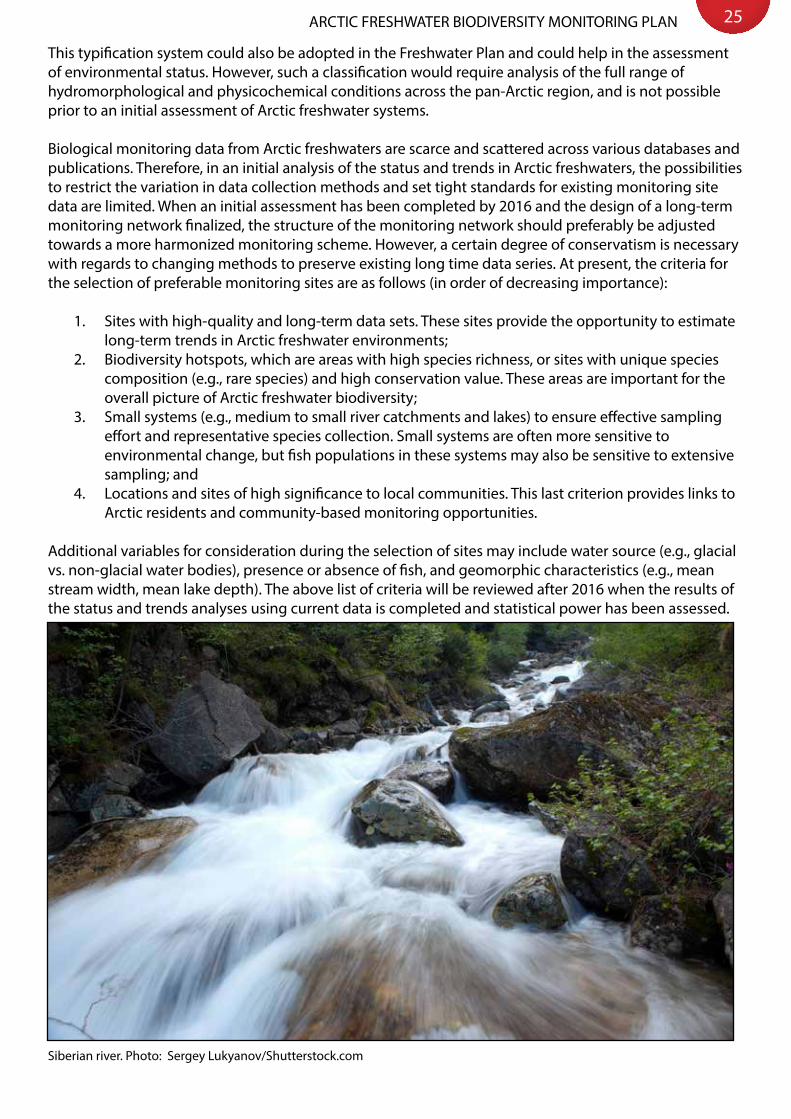
Biological monitoring data from Arctic freshwaters are scarce and scattered across various databases and publications. Therefore, in an initial analysis of the status and trends in Arctic freshwaters, the possibilities to restrict the variation in data collection methods and set tight standards for existing monitoring site data are limited. When an initial assessment has been completed by 2016 and the design of a long-term monitoring network finalized, the structure of the monitoring network should preferably be adjusted towards a more harmonized monitoring scheme. However, a certain degree of conservatism is necessary with regards to changing methods to preserve existing long time data series. At present, the criteria for the selection of preferable monitoring sites are as follows (in order of decreasing importance):
1. Sites with high-quality and long-term data sets. These sites provide the opportunity to estimate long-term trends in Arctic freshwater environments;
2. Biodiversity hotspots, which are areas with high species richness, or sites with unique species composition (e.g., rare species) and high conservation value. These areas are important for the overall picture of Arctic freshwater biodiversity;
3. Small systems (e.g., medium to small river catchments and lakes) to ensure effective sampling effort and representative species collection. Small systems are often more sensitive to environmental change, but fish populations in these systems may also be sensitive to extensive sampling; and
4. Locations and sites of high significance to local communities. This last criterion provides links to Arctic residents and community-based monitoring opportunities.
Additional variables for consideration during the selection of sites may include water source (e.g., glacial vs. non-glacial water bodies), presence or absence of fish, and geomorphic characteristics (e.g., mean stream width, mean lake depth). The above list of criteria will be reviewed after 2016 when the results of the status and trends analyses using current data is completed and statistical power has been assessed.
Siberian river. Photo: Sergey Lukyanov/Shutterstock.com

26
Figure 4. Arctic freshwater boundaries from the Arctic Council’s Arctic Biodiversity Assessment developed by CAFF, showing the three sub-regions of the Arctic, namely the high (dark purple), low (purple) and sub-Arctic (light purple), and the CAFF boundary (grey line).

3. Conceptual Scenarios of Arctic Freshwater Ecosystems

28
General conceptual models for freshwater ecosystems were developed to identify the impacts that potential changes to Arctic ecosystems could have on lake and river biodiversity, production and functioning. The cumulative effects of these changes are dependent on individual catchment characteristics, including the geology, topography and rate of human-induced pressures. Cumulative effects and their magnitude may vary in time and space, with considerable uncertainty associated with predicting the long-term ecosystem responses to human impact. Despite the local/regional variation of cumulative effects imposed by multiple environmental and anthropogenic stressors, the development of conceptual models can be a useful tool to aid in the selection of Focal Ecosystem Components (FECs; see section 1.3.3) for the detection and prediction of changes and trends in Arctic freshwater biodiversity.
To explore how Arctic freshwater communities may respond to ecosystem changes, it is necessary to understand the structure and function of these communities at reference condition, i.e., in the absence of or at very low levels of impact (e.g., generic food webs in Fig. 5). At the food web base are autotrophs and detritus that are food sources for consumers at higher trophic levels. Autotrophs are primary producers and may be represented by periphyton or macrophytes in rivers or lakes, and by lake phytoplankton. Detritus may be composed of terrestrial plant litter and other decaying material/organisms. Herbivores and detritivores are the primary consumers of the system; these groups may include benthic macroinvertebrates and fish in rivers or lakes, and lake zooplankton. Predators may represent several levels of consumers within a system, including the secondary consumers that eat detritivores and/or herbivores and the tertiary consumers that eat secondary consumers (e.g., piscivorous fish). Predators include benthic macroinvertebrates and fish in rivers or lakes, and additionally zooplankton in lakes. Predators may also include terrestrial and avian predators that feed in rivers and lakes. In extreme Arctic conditions, freshwater communities may be dominated by specialist species adapted to cold conditions (i.e., cold-stenothermal species), and this may result in a more simplified food web. For example, there may be fewer trophic levels of consumers due to a lack of piscivorous fish. These initial food web conditions have implications for changes that may occur with the introduction of environmental or anthropogenic stressors.
Figure 5. A generic food web diagram for a lake or river, indicating the basic trophic levels (boxes) and energy flow (arrows) between those levels. See text for further explanation of each trophic level.
Predators
Terrestrial Litter Detritus
Microbes
Detritivores
Autotrophs
Herbivores
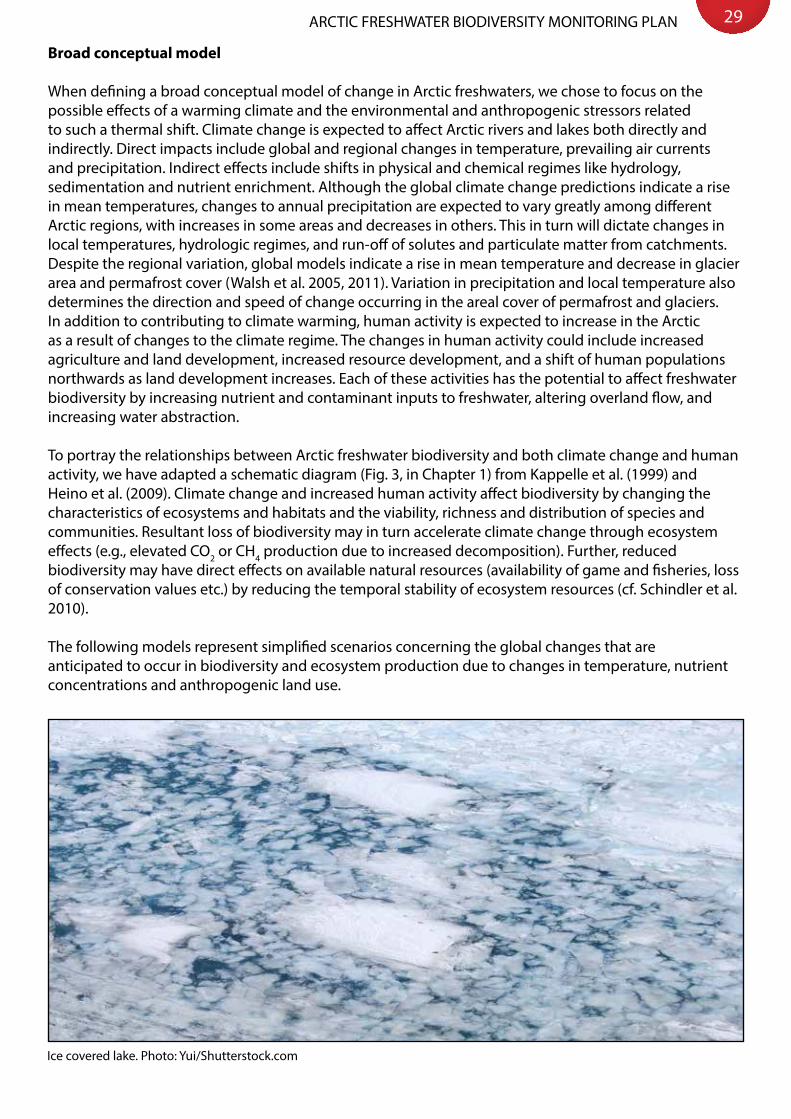
29ARCTIC FRESHWATER BIODIVERSITY MONITORING PLAN
Broad conceptual model
When defining a broad conceptual model of change in Arctic freshwaters, we chose to focus on the possible effects of a warming climate and the environmental and anthropogenic stressors related to such a thermal shift. Climate change is expected to affect Arctic rivers and lakes both directly and indirectly. Direct impacts include global and regional changes in temperature, prevailing air currents and precipitation. Indirect effects include shifts in physical and chemical regimes like hydrology, sedimentation and nutrient enrichment. Although the global climate change predictions indicate a rise in mean temperatures, changes to annual precipitation are expected to vary greatly among different Arctic regions, with increases in some areas and decreases in others. This in turn will dictate changes in local temperatures, hydrologic regimes, and run-off of solutes and particulate matter from catchments. Despite the regional variation, global models indicate a rise in mean temperature and decrease in glacier area and permafrost cover (Walsh et al. 2005, 2011). Variation in precipitation and local temperature also determines the direction and speed of change occurring in the areal cover of permafrost and glaciers. In addition to contributing to climate warming, human activity is expected to increase in the Arctic as a result of changes to the climate regime. The changes in human activity could include increased agriculture and land development, increased resource development, and a shift of human populations northwards as land development increases. Each of these activities has the potential to affect freshwater biodiversity by increasing nutrient and contaminant inputs to freshwater, altering overland flow, and increasing water abstraction.
To portray the relationships between Arctic freshwater biodiversity and both climate change and human activity, we have adapted a schematic diagram (Fig. 3, in Chapter 1) from Kappelle et al. (1999) and Heino et al. (2009). Climate change and increased human activity affect biodiversity by changing the characteristics of ecosystems and habitats and the viability, richness and distribution of species and communities. Resultant loss of biodiversity may in turn accelerate climate change through ecosystem effects (e.g., elevated CO2 or CH4 production due to increased decomposition). Further, reduced biodiversity may have direct effects on available natural resources (availability of game and fisheries, loss of conservation values etc.) by reducing the temporal stability of ecosystem resources (cf. Schindler et al. 2010).
The following models represent simplified scenarios concerning the global changes that are anticipated to occur in biodiversity and ecosystem production due to changes in temperature, nutrient concentrations and anthropogenic land use.
Ice covered lake. Photo: Yui/Shutterstock.com

30
Temperature Change
The northward movement of eurythermic species will affect biodiversity at all scales from species composition within rivers, lakes and ponds (alpha biodiversity) through to changes in regional faunal assemblages (gamma biodiversity), with the overall adjustment depending on the relative rates of gain and loss in eurythermic and stenothermic species (Vincent et al. 2011). For example, a rapid increase in the abundances of eurythermic species and a slow loss of stenotherms will produce a pulsed increase in gamma biodiversity that eventually settles at a new equilibrium dominated by eurythermal species (Fig. 6a). In contrast, a more moderate dispersal rate by eurythermal species coupled with the rapid loss of stenotherms will produce a pulsed decrease in gamma biodiversity that will also eventually settle at a new equilibrium dominated by eurythermal species (Fig. 6b). An equilibrium dominated by eurythermal species is reached more rapidly through a rapid increase in eurytherms coupled with a rapid decrease in stenotherms (Fig. 6c). In contrast, a slow increase in eurytherms coupled with a slow decrease in stenotherms will lead to a slow increase in gamma biodiversity that eventually will settle at a new equilibrium dominated by eurytherms (Fig. 6d). The actual changes in species diversity will, therefore, depend critically on the relative rates of change in eurythermal and stenothermic species, with the responses pictured in Figure 6 representing expected possible types of responses. Where dispersal routes do not exist (e.g., isolated high Arctic or high-altitude systems), the climate-driven loss of stenotherms may not be compensated by eurythermic species invasion and an overall decline in gamma biodiversity is expected. The effect is expected to predominate more among vertebrates whose dispersal patterns rely on habitat connectivity. Avian range expansion associated with climate warming, however, may lead to increased invertebrate diversity at local (alpha) and regional (gamma) scales via facilitation.
Figure 6. The hypothesized effects of rising mean water temperature on biodiversity (as total species number) of Arctic freshwater ecosystems. The dynamic flux observed in gamma biodiversity will depend critically on the relative rates of the change in species number of eurytherms and stenotherms from the baseline. A pulsed increase in gamma biodiversity (a) results from the combination of high eurythermal invasion and establishment and low stenothermic loss with increasing water temperature. A pulsed decrease in gamma biodiversity (b) results from the combination of low eurythermal invasion and establishment and high stenothermic loss. Rapid increases (c) and slow increases (d) in species diversity occur, respectively, with high eurythermal invasion and establishment coupled with high stenothermic loss or low eurythermal invasion and establishment and low stenothermic loss as temperatures increase.
A B
C D

31ARCTIC FRESHWATER BIODIVERSITY MONITORING PLAN
Nutrient enrichment
The production of biomass is usually quite low in Arctic waters (with some exceptions) due to extreme conditions and low levels of available nutrients. Melting of glaciers and loss of permafrost cover due to a rise in mean air temperature is likely to increase the run-off of solutes (including nutrients) and suspended solids from catchment area. Moreover, changes in sea bird and migratory bird populations and nesting sites with warming may lead to additional nutrient inputs into river and lake systems. Increased nutrient loading will enhance the primary production in freshwater ecosystems and consequently elevate the production in higher levels of the food web as well (Wrona et al. 2006b, Wrona et al. 2006d) (Fig. 7). Although the total production of biomass is increased, the species specialized in exploiting scarce food resources will be lost and replaced by more generalist species.
Figure 7. Anticipated effects of increased erosion and nutrient leaching through loss of permafrost and/or glacial melt on biomass production in Arctic freshwaters. See text for further explanation.
Red knots, a migratory shorebird, Norway. Photo: Peter Prokosch

32
Catchment resource development
Intense human impact on catchments results in reduction of freshwater biological production and biodiversity. Despite developments in the conservation and protection of water, catchment resource development such as mining and heavy industry is likely to cause impairment of water quality and environmental status at least at the local scale. Production and biodiversity may increase in the early stages of development (i.e., with an increase in nutrients and shifts to more impact-tolerant taxa). However, as development progresses, production and biodiversity are ultimately reduced as the ecosystem’s tolerance threshold for increased erosion and loading of nutrients and contaminants is exceeded (Fig. 8). Production and biodiversity can also be reduced, for example, due to loss of littoral flora and fauna, restricted species migration, and oligotrophication (hydropower) or excessive harvesting pressures on natural resources (fisheries).
The conceptual models for temperature changes, nutrient enrichment and catchment resource development indicate that the impacts of climate change and increased human activity will differ by trophic level (i.e., primary producers or consumers) and taxonomic group. Although increased species richness or production may appear to be a net benefit of a warming climate, this increase comes at a loss of specialized species, many of which may not be found outside these Arctic regions. To fully capture the impacts of changes to Arctic freshwater ecosystems, the conceptual models indicate that a monitoring plan must incorporate measures of biodiversity and biomass across multiple species and trophic levels.
Figure 8. Anticipated impact of intense natural resources exploitation on biomass production in Arctic freshwaters.
Old oil rig in the Pechora Delta, Russa. Photo: Peter Prokosch

4. Selecting Focal Ecosystem Components, Parameters, and Indicators

34
4.1 Process for Identifying and Selecting Focal Ecosystem Components, Parameters, and Indicators
4.1.1 Background paper and workshop process
The Freshwater Plan is founded on ideas forwarded in a framework document (Culp et al. 2011a) and work undertaken during two workshops. An inaugural workshop was conducted in Uppsala, Sweden in November 2010 (Culp et al. 2011b), with a follow-up workshop held in Fredericton, New Brunswick, Canada in October 2011. In addition to the Freshwater EMG Steering Group members, both workshops included freshwater experts with a broad range of expertise, and contributors from all participating countries.
In the first workshop, participants identified the important elements (stressors, FECs, parameters and indicators) of a pan-Arctic Freshwater monitoring plan. Each of the FECs and indicators was given a rank of high, medium or low based on importance to ecosystem function and sensitivity to stressors, sampling feasibility, and data availability. The mechanistic link between environmental or anthropogenic stressors and FECs was identified through “Impact Hypotheses” (Culp et al. 2011b). These statements outline the potential ways that various stressors might impact structural and functional aspects of biotic communities. Information on available freshwater data for the focal elements was also summarized during this workshop, and will be an important basis for the first assessment of Arctic freshwaters. Information on existing data will also help in selecting future monitoring sites.
During the second workshop, participants refined the lists of FECs, parameters and indices to produce lists of freshwater elements to be considered for monitoring and assessment. This workshop was primarily focused on developing a draft Freshwater Plan to be reviewed and completed by the Freshwater EMG Steering Group.
4.1.2 Scoping process
The Freshwater Plan was developed by applying the scoping process piloted by the Marine EMG. This process, which was intended to identify the important elements of Arctic freshwater systems, used an ecosystem-based, adaptive management approach, after the concept of Adaptive Environmental Assessment and Management (see details in Gill et al. 2011). This approach allowed workshop participants to focus on issues relevant to Arctic freshwaters, and use those issues to determine the best monitoring approach.
During the scoping process, participants were divided into lake and river breakout groups, and each group suggested a wide variety of potential FECs (see Section 1.3.3) for lakes and rivers. To work towards a final subset of FECs, the initial list was qualified in terms of importance, feasibility, and availability of data (see Culp et al. 2011b for full details of rankings and their justification). Importance referred to whether the FEC was sensitive to environmental and anthropogenic stressors, and therefore likely to contribute to assessing stressor effects. Feasibility described the logistical difficulty and cost associated with measuring the FEC (e.g., sample collection and processing). Finally, the availability of data was a means for identifying gaps in spatial and temporal coverage within and among countries, and indicated whether there were sufficient data for use in a monitoring context. During the second workshop, these FECs were further ranked in terms of immediate importance for an initial assessment of Arctic freshwater condition and long-term importance for future monitoring efforts. This technique identified those FECs that may be important for assessing the ecological effects of environmental and anthropogenic stressors, but that may not have been feasible to include in existing monitoring programs (see Tables 14-17 in Appendix B for the complete list of rankings and their justification). Those FECs that were ranked as highly important for either immediate assessment or future monitoring were included in the final FEC list.

35ARCTIC FRESHWATER BIODIVERSITY MONITORING PLAN
The identification of FECs focused discussions on environmental and anthropogenic stressors (e.g., climate change, contaminants, change in natural temperature regime, etc.) that have a primary influence on basic biotic components, processes or ecosystem services. A critical part of this process was the development of impact hypotheses (see Section 1.3.3), as these predictive statements outline a cause-effect framework regarding how these stressors are expected to affect FECs. Hypothesis development facilitated the choice of variables that should be monitored as components of indices and/or metrics.
This process resulted in:
► Clear monitoring objectives; ► FECs that are ecologically pivotal or sensitive to changes in biodiversity; ► Impact hypothesis statements regarding the relationship among important stressors and
ecosystem responses; and ► Recommended variables for use in monitoring and as assessment indicators.
The Freshwater EMG developed separate lists of FECs and indicators for lakes and rivers. The lists contained many of the same elements, but reflected the differences in these ecosystems.
4.1.3 Criteria for Selecting Parameters and Indicators
Through expert consultation during the workshops, the Freshwater EMG developed a list of parameters and indicators for assessing biodiversity in Arctic freshwater systems. The initial list of parameters and indicators was created using a set of criteria that built on those used by the Marine EMG (Gill et al. 2011), including:
► Sensitivity to environmental or anthropogenic stressors;
► Scientific validity and relevance;
► Sustainability and relevance in a monitoring capacity;
► Availability of targets and thresholds; and
► Practicality
Parameters and indicators that met these criteria were listed for each FEC. As with the FECs, the initial list of parameters and indicators was qualified in terms of importance and feasibility (see Culp et al. 2011b). Importance referred to whether the parameter or indicator was likely to contribute to assessing the effects of environmental and anthropogenic stressors, and if it was important to incorporate into a monitoring plan. Feasibility described the logistical difficulty and cost associated with measuring the parameter. A final list of parameters and indicators was developed based on their ranked importance and feasibility for monitoring.
The final parameters and indicators were chosen for their widespread applicability across the pan-Arctic region and the feasibility of their incorporation into Arctic freshwater monitoring. This suite of priority parameters and indicators will be used for the assessment of the state of Arctic freshwater biodiversity, and should be considered during the development of any future Arctic freshwater monitoring programs.
Lake on a mountain. Photo: My Good Images/Shutterstock.com
5. Coordinated Monitoring: Focal Ecosystem Components, Stressors, Impact Hypotheses, and Indicators

37ARCTIC FRESHWATER BIODIVERSITY MONITORING PLAN
The Freshwater Plan provides a recommended suite of FECs and indicators for monitoring the status and trends in biodiversity of Arctic lakes and rivers. An initial assessment will be undertaken during 2013-2016 with subsequent assessments every 5 years to correspond with the Marine Steering Group reporting cycle (see Chapters 9 and 10). This chapter describes the recommended FECs and indicators to be incorporated into the initial 2013-2016 assessment for lakes and rivers, as well as probable environmental and anthropogenic stressors that can lead to biodiversity change. Detailed impact hypotheses are described, with this suite of predictive statements outlining the potential influence of climate change and human activity on basic biotic components, processes or ecosystem services. The development of detailed terms of reference and objectives statements for future assessments is beyond the scope of this document, as these will need to be produced during implementation of the Freshwater Plan.
5.1 Focal Ecosystem Components
From the list of potential FECs produced during the first workshop (Culp et al. 2011b), expert consensus determined the FECs listed in Table 1 to be practical measures of stress in Arctic freshwater ecosystems. The chosen FECs are central to the functioning of an ecosystem and sensitive to potential stressors (further details justifying the inclusion of FECs are provided in Appendix B). Reporting on the status and trends in freshwater biodiversity will center on indicators of FEC condition as the impact hypotheses are evaluated. Data for some FECs may not be available in existing Arctic monitoring databases, and the initial assessment may need to consider a reduced FEC list that is based on data availability. Thus, the first assessment is expected to focus upon the most commonly monitored FECs from Table 1, namely fish, benthic invertebrates, zooplankton, phytoplankton or benthic algae, and most abiotic FECs. After 2016 this list should be adjusted based on the availability of data collected through ongoing monitoring programs of the Arctic countries. Information on medium and low priority FECs for lakes and rivers (not listed in Table 1) is included in Appendix B, as these FECs may be useful for application at regional scales, or in future versions of the Freshwater Plan.
Table 1. Biotic and Abiotic Focal Ecosystem Components (FEC) selected for inclusion in Arctic freshwater monitoring and assessments.
Focal Ecosystem Component Applicable Ecosystems
Biotic
Fish Lakes and rivers
Benthic invertebrates Lakes and rivers
Zooplankton Lakes
Benthic algae Lakes and rivers
Phytoplankton Lakes
Macrophytes Lakes
Riparian vegetation Rivers
Aquatic birds Lakes
Abiotic
Water temperature regime Lakes and rivers
Hydrologic and ice regimes Lakes and rivers
Water quality Lakes and rivers
Climatic regime Lakes and rivers
Permafrost Lakes and rivers

38
5.2 Environmental and Human Activity Stressors
The 15 stressors listed below were identified as most likely to have substantial influence on the FECs listed in Table 1 (the order of the list does not indicate the order of importance of the stressors). A brief description of each environmental and anthropogenic stressor follows, with recognition that location-specific influence of any stressor will vary as a function of the intensity of its environmental signal or its tendency to interact with other stressors. From this list, impact hypotheses were outlined to describe the effects of each stressor on the priority FECs (section 5.3).
1. Atmospheric Deposition of Short and Long Range Contaminants: Addition of toxic stress to Arctic freshwater ecosystems resulting in contaminant exposure and biomagnification.
2. Atmospheric Deposition of SOx and NOx (acidification): Direct modification of water chemistry including decreased pH and calcium and increased release of aluminum.
3. Thermal Regime Change: Increasing Arctic temperatures that modify ice regimes and cumulative thermal degree days in lakes and streams.
4. Hydrological Regime Change: Shifts in the seasonal pattern of precipitation and ice cover and the resultant changes to freshwater habitat and seasonal disturbance.
5. Sediment Regime Change: Permafrost degradation and change in the hydrologic regime that increases the intensity, magnitude and frequency of disturbance of freshwater habitat through increased turbidity and shifts towards finer substrate composition.
6. Wind Regime Change: Shifts in wind force changes snow deposition and water circulation in lakes resulting in habitat modification.
7. UV Radiation Regime Change: Increased exposure to UV radiation in shallow habitats of clear lakes and streams.
8. Increased Nutrient Loading: Permafrost degradation and changes in hydrologic regime that lead to higher input of organic matter and inorganic nutrients to aquatic systems.
9. Shift in Nutrient and Contaminant Levels Due to Biotic Vectors: The role that increased or decreased population abundance of migratory species can have in determining the deposition of nutrients and contaminants to aquatic ecosystems.
10. Fisheries Over-Harvesting: Changes in mortality, demographic characteristics, reduced competition or loss of prey resources that result from unsustainable harvesting of fish stocks by humans.
11. Resource Exploration and Exploitation: All stages and forms of resource extraction (e.g., hydrocarbon extraction, metal mining, water withdrawal) and their associated impacts such as wastewater discharge, spills, habitat disturbance and flow regime disturbance.
12. Transportation and Utility Corridors: Increase in various types of human transportation corridors including roads, powerlines and associated features such as culverts that can affect environmental conditions including flow, nutrient and sediment regimes, and connectivity.
13. Flow Alteration: Modification of flow regimes and habitat fragmentation through the construction of dams used for hydropower generation or stabilization of water supply.
14. Increased Agricultural Activity: The effects on aquatic habitats that result from various agricultural activities such as farming and animal grazing.
15. Introduction of Alien Genetic Types: Modification of composition and native genetic structure of aquatic biota through the introduction of new genotypes or invasive species (e.g., for culturing).
5.3 Impact Hypotheses for Lakes and Rivers
The expected response relationships of priority FECs to the stressors were divided into impacts from environmental or regional human activity stressors (Tables 2 and 3; Culp et al. 2011b). Conceptual models for specific responses of selected FECs may be derived from these prediction statements, and may apply to several FECs. For example, permafrost degradation is expected to result in increased sediment loads and turbidity of lakes (i.e., Sediment Regime Change), thus negatively affecting the light climate of lakes (Table 2). Decreased light penetration is predicted to negatively affect algal biomass and photosynthesis
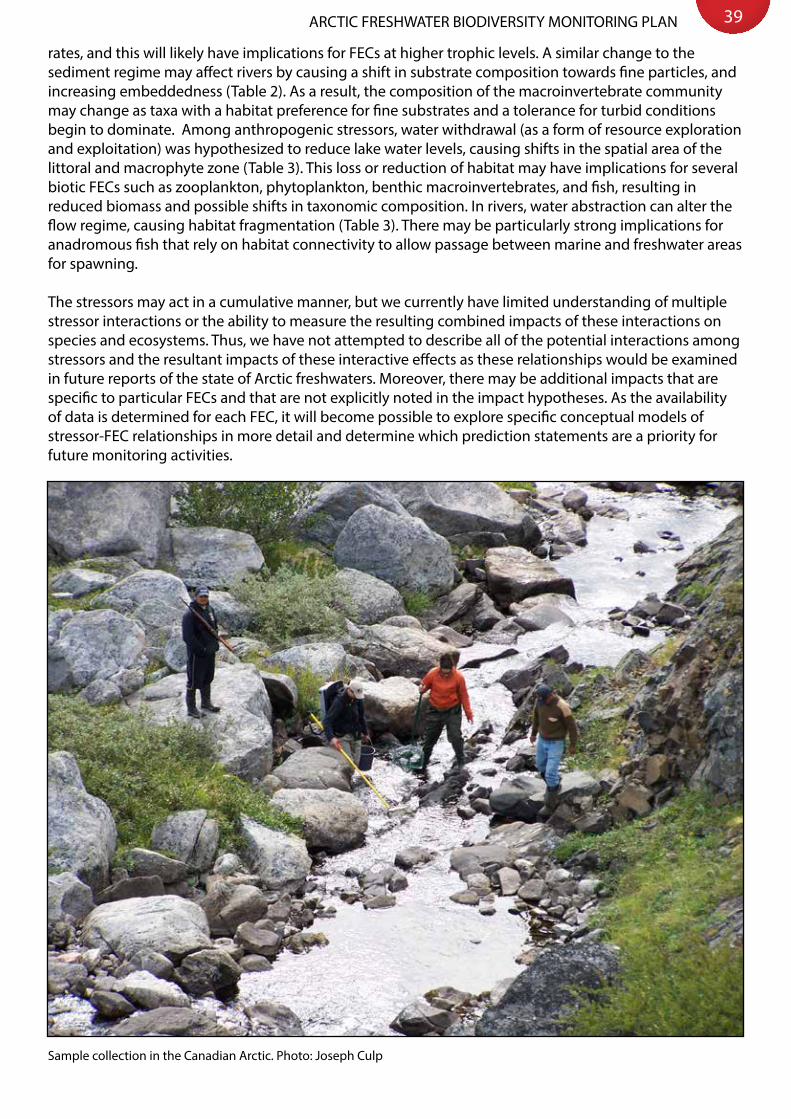
39ARCTIC FRESHWATER BIODIVERSITY MONITORING PLAN
rates, and this will likely have implications for FECs at higher trophic levels. A similar change to the sediment regime may affect rivers by causing a shift in substrate composition towards fine particles, and increasing embeddedness (Table 2). As a result, the composition of the macroinvertebrate community may change as taxa with a habitat preference for fine substrates and a tolerance for turbid conditions begin to dominate. Among anthropogenic stressors, water withdrawal (as a form of resource exploration and exploitation) was hypothesized to reduce lake water levels, causing shifts in the spatial area of the littoral and macrophyte zone (Table 3). This loss or reduction of habitat may have implications for several biotic FECs such as zooplankton, phytoplankton, benthic macroinvertebrates, and fish, resulting in reduced biomass and possible shifts in taxonomic composition. In rivers, water abstraction can alter the flow regime, causing habitat fragmentation (Table 3). There may be particularly strong implications for anadromous fish that rely on habitat connectivity to allow passage between marine and freshwater areas for spawning.
The stressors may act in a cumulative manner, but we currently have limited understanding of multiple stressor interactions or the ability to measure the resulting combined impacts of these interactions on species and ecosystems. Thus, we have not attempted to describe all of the potential interactions among stressors and the resultant impacts of these interactive effects as these relationships would be examined in future reports of the state of Arctic freshwaters. Moreover, there may be additional impacts that are specific to particular FECs and that are not explicitly noted in the impact hypotheses. As the availability of data is determined for each FEC, it will become possible to explore specific conceptual models of stressor-FEC relationships in more detail and determine which prediction statements are a priority for future monitoring activities.
Sample collection in the Canadian Arctic. Photo: Joseph Culp

40
Tabl
e 2.
Lis
t of e
nviro
nmen
tal s
tres
sors
and
impa
ct h
ypot
hese
s an
d ex
pect
ed re
spon
se re
latio
nshi
ps o
f foc
al e
cosy
stem
com
pone
nts
of la
kes
and
river
s.
Stre
ssor
Exam
ple
impa
cts
Atm
osph
eric
dep
ositi
on o
f sho
rt
and
long
rang
e co
ntam
inan
tsLa
ke a
nd R
iver
: Alte
ratio
n of
wat
er c
hem
istr
y
incr
ease
d up
take
and
bio
mag
nific
atio
n
toxi
c st
ress
at h
igh
trop
hic
leve
ls a
nd h
uman
exp
osur
e,
sele
ctio
n fo
r con
tam
inan
t tol
eran
t tax
a
Atm
osph
eric
dep
ositi
on o
f SO
x an
d N
Ox (a
cidi
ficat
ion)
Lake
and
Riv
er: A
ltera
tion
of w
ater
che
mis
try
(dec
reas
ed p
H a
nd c
alci
um, r
elea
sed
alum
inum
) in
crea
sed
upta
ke o
f alu
min
um, t
oxic
str
ess,
loss
of
calc
ium
-dep
ende
nt ta
xa
shi
ft in
com
mun
ity s
truc
ture
and
pro
duct
ivity
Ther
mal
regi
me
chan
ge
Lake
and
Riv
er: I
ncre
ased
wat
er te
mpe
ratu
re
[Lak
e on
ly: s
trat
ifica
tion
(diu
rnal
ther
moc
lines
)]
cha
nges
in p
hoto
synt
hesi
s/re
spira
tion
bala
nce;
sh
ifts
in c
arbo
n so
urce
s, si
nks,
and
avai
labi
lity;
cha
nges
in s
edim
ent-
wat
er in
tera
ctio
ns
cha
nges
in p
heno
logy
, foo
d av
aila
bilit
y an
d qu
ality
, bi
omas
s an
d de
com
posi
tion
mas
s, de
crea
ses
in c
old
sten
othe
rms
(alg
ae, b
enth
ic m
acro
inve
rteb
rate
s, fis
h), r
ange
alte
ratio
n fo
r col
d-in
tole
rant
taxa
incr
ease
d co
mpe
titio
n, p
reda
tion,
par
asite
s, an
d di
seas
es fr
om g
eogr
aphi
c ra
nge
chan
ges
shi
ft in
com
mun
ity c
ompo
sitio
n an
d fu
nctio
nal
dive
rsity
, cha
nge
in p
rodu
ctiv
ity
Hyd
rolo
gica
l reg
ime
chan
ge
Lake
: Cha
nges
in p
reci
pita
tion,
sno
wpa
ck q
uant
ity, i
ce o
n/ic
e off
in
crea
sed/
decr
ease
d la
ke le
vels
, alte
red
runo
ff an
d te
rres
tria
l org
anic
mat
ter
inpu
ts, i
ncre
ased
The
rmok
arst
pro
cess
es (l
ake
loss
or f
orm
atio
n)
cha
nge
in h
abita
t (e.
g., c
hang
e in
ava
ilabi
lity
of o
verw
inte
ring
habi
tat,
shift
in
litt
oral
zon
e an
d m
acro
phyt
e zo
ne),
incr
ease
d nu
trie
nt a
vaila
bilit
y, c
hang
e in
ligh
t reg
ime
s
hift
in c
omm
unity
com
posi
tion
and
func
tiona
l di
vers
ity, c
hang
e in
pro
duct
ivity
Rive
r: Ch
ange
s in
pre
cipi
tatio
n, s
now
pack
qua
ntity
, ice
on/
ice
off
incr
ease
d/de
crea
sed
flood
mag
nitu
de, s
hift
bet
wee
n th
erm
odyn
amic
and
dy
nam
ic b
reak
up, a
ltere
d co
nnec
tanc
e
cha
nge
in fr
eque
ncy
of b
ed d
istu
rban
ce
alte
red
habi
tat t
hrou
gh c
hang
e in
med
ian
part
icle
siz
e
shi
ft
in c
omm
unity
com
posi
tion
and
func
tiona
l div
ersi
ty, c
hang
e in
pro
duct
ivity
Lake
and
Riv
er: C
hang
es in
sno
wpa
ck s
truc
ture
and
qua
ntity
on
lake
/riv
er ic
e
alte
red
ther
mal
regi
me
thro
ugh
chan
ge in
insu
latio
n an
d lig
ht
regi
me
alte
red
habi
tat t
hrou
gh c
hang
e in
ligh
t pen
etra
tion
and
ice
thic
knes
s
shi
ft in
com
mun
ity c
ompo
sitio
n an
d fu
nctio
nal d
iver
sity
, cha
nge
in p
rodu
ctiv
ity
Sedi
men
t reg
ime
chan
ge
Lake
: Inc
reas
ed tu
rbid
ity
dec
reas
ed li
ght
cha
nges
in p
hoto
synt
hesi
s/re
spira
tion
bala
nce
shi
ft in
com
mun
ity c
ompo
sitio
n an
d fu
nctio
nal
dive
rsity
, cha
nge
in p
rodu
ctiv
ity R
iver
: Inc
reas
ed tu
rbid
ity, s
hift
in s
ubst
rate
com
posi
tion
tow
ards
fine
par
ticle
s, in
crea
sed
embe
dded
ness
decr
ease
d lig
ht, l
oss
of s
ubst
rate
div
ersi
ty, s
hift
s in
hab
itat a
nd d
elta
sed
imen
tatio
n pr
oces
ses
cha
nges
in p
hoto
synt
hesi
s/re
spira
tion
bala
nce
sh
ift in
com
mun
ity c
ompo
sitio
n an
d fu
nctio
nal d
iver
sity
, cha
nge
in p
rodu
ctiv
ity
Incr
ease
d nu
trie
nt lo
adin
g
Lake
: Nut
rient
enr
ichm
ent
incr
ease
d nu
trie
nt a
vaila
bilit
y an
d de
crea
sed
light
c
hang
es in
food
ava
ilabi
lity
and
qual
ity
shift
in re
lativ
e im
port
ance
of b
enth
ic a
nd p
elag
ic p
roce
sses
, mic
robi
al fo
od w
eb c
hang
es, s
hift
in c
omm
unity
com
posi
tion
and
func
tiona
l div
ersi
ty, c
hang
e in
pr
oduc
tivity
Rive
r: N
utrie
nt e
nric
hmen
t in
crea
sed
prim
ary
prod
ucer
abu
ndan
ce
shi
ft in
com
mun
ity c
ompo
sitio
n an
d fu
nctio
nal d
iver
sity
, cha
nge
in
prod
uctiv
ity
Shift
in n
utrie
nt a
nd c
onta
min
ant
leve
ls d
ue to
bio
tic v
ecto
rs
Lake
and
Riv
er: I
ncre
ased
pop
ulat
ions
of b
iota
(e.g
., m
igra
tory
bird
s, sa
lmon
) a
ltere
d de
posi
tion
of n
utrie
nts
and
cont
amin
ants
to w
ater
n
utrie
nt
enric
hmen
t and
alte
ratio
n of
wat
er c
hem
istr
y
incr
ease
d pr
imar
y pr
oduc
er a
bund
ance
, inc
reas
ed u
ptak
e an
d bi
omag
nific
atio
n of
con
tam
inan
ts
s
hift
in c
omm
unity
com
posi
tion
and
func
tiona
l div
ersi
ty, c
hang
e in
pro
duct
ivity
, tox
ic s
tres
s at
hig
h tr
ophi
c le
vels
and
hum
an e
xpos
ure,
sel
ectio
n fo
r con
tam
inan
t tol
eran
t tax
a
Shift
in U
V ra
diat
ion
Lake
: Inc
reas
ed U
V
incr
ease
in re
activ
e ox
ygen
spe
cies
re
duce
d U
V-se
nsiti
ve s
peci
es a
nd in
crea
sed
UV-
tole
rant
spe
cies
s
hift
in s
peci
es
com
posi
tion
and
inte
ract
ions
(spe
cific
to s
mal
l, sh
allo
w, a
nd c
lear
lake
s)
Shift
in w
ind
actio
nLa
ke: I
ncre
ase/
decr
ease
in w
ind
forc
e
cha
nge
in s
now
form
atio
n pa
tter
n (e
.g. i
ce o
n/off
, per
iod
of ic
e co
ver)
, inc
reas
ed/d
ecre
ased
wat
er
circ
ulat
ion
cha
nge
in h
abita
t and
hab
itat a
cces
sibi
lity,
lake
mix
ing,
ther
mal
regi
me,
str
atifi
catio
n
shi
ft in
com
mun
ity s
truc
ture
and
prim
ary
prod
uctiv
ity

41ARCTIC FRESHWATER BIODIVERSITY MONITORING PLAN
Tabl
e 3.
Lis
t of r
egio
nal h
uman
act
ivity
str
esso
rs a
nd im
pact
hyp
othe
ses
desc
ribin
g ex
pect
ed re
spon
se re
latio
nshi
ps o
f foc
al e
cosy
stem
com
pone
nts
of la
kes.
Stre
ssor
Exam
ple
impa
cts
Fish
erie
s ov
er-h
arve
stin
g La
ke a
nd R
iver
: Alte
rs p
opul
atio
n st
ruct
ure/
abun
danc
e
pot
entia
l for
trop
hic
casc
ades
s
hift
s in
com
mun
ity c
ompo
sitio
n an
d ag
e/si
ze s
truc
ture
, se
lect
ion
agai
nst f
ast-
grow
ing
geno
type
s in
har
vest
ed p
opul
atio
ns
Reso
urce
exp
lora
tion/
ex
ploi
tatio
n (e
.g.,
hydr
ocar
bon
extr
actio
n, m
etal
min
ing,
wat
er
with
draw
al)
Lake
: Mun
icip
al d
isch
arge
n
utrie
nt e
nric
hmen
t/eu
trop
hica
tion
incr
ease
d nu
trie
nt a
vaila
bilit
y an
d de
crea
sed
light
c
hang
es in
food
ava
ilabi
lity
and
qual
ity
shi
ft in
rela
tive
impo
rtan
ce o
f ben
thic
and
pel
agic
pro
cess
es, m
icro
bial
food
web
cha
nges
, shi
ft in
com
mun
ity c
ompo
sitio
n an
d fu
nctio
nal d
iver
sity
, cha
nge
in p
rodu
ctiv
ityRi
ver:
Mun
icip
al d
isch
arge
nut
rient
enr
ichm
ent
incr
ease
d al
gal a
bund
ance
s
hift
in c
omm
unity
com
posi
tion
and
func
tiona
l div
ersi
ty, c
hang
e in
pro
duct
ivity
Lake
: Wat
er a
bstr
actio
n
redu
ced
wat
er le
vels
c
hang
e in
hab
itat (
e.g.
, shi
ft in
litt
oral
zon
e an
d m
acro
phyt
e zo
ne)
shi
ft in
com
mun
ity
com
posi
tion
and
func
tiona
l div
ersi
ty, c
hang
e in
pro
duct
ivity
Rive
r: W
ater
abs
trac
tion
alte
red
flow
regi
me
hab
itat f
ragm
enta
tion
(and
oxy
gen
stre
ss)
shi
ft in
com
mun
ity c
ompo
sitio
n an
d fu
nctio
nal
dive
rsity
, cha
nge
in p
rodu
ctiv
ity
Lake
and
Riv
er: I
ncre
ase
in c
onta
min
ants
(inc
ludi
ng a
ccid
enta
l spi
lls)
alte
ratio
n of
wat
er c
hem
istr
y
incr
ease
d up
take
and
bio
mag
nific
atio
n
to
xic
stre
ss a
t hig
h tr
ophi
c le
vels
and
hum
an e
xpos
ure,
sel
ectio
n fo
r con
tam
inan
t tol
eran
t tax
a
Lake
and
Riv
er: S
alin
izat
ion
alte
ratio
n of
wat
er c
hem
istr
y an
d ad
jace
nt la
nd a
reas
(inc
ludi
ng ri
ver fl
oodp
lain
s)
shift
s in
com
mun
ity
com
posi
tion,
sel
ectio
n fo
r sal
ine-
tole
rant
taxa
Tran
spor
tatio
n an
d ut
ility
co
rrid
ors
Lake
and
Riv
er: A
ltere
d ov
erla
nd fl
ow re
gim
e
incr
ease
in tu
rbid
ity/s
edim
enta
tion/
cont
amin
ants
(e.g
., sa
lt, o
il)
alte
red
habi
tats
(pot
entia
l de
grad
atio
n of
spa
wni
ng h
abita
ts),
loss
of d
iver
sity
and
spe
cies
com
posi
tion,
sel
ectio
n fo
r con
tam
inan
t tol
eran
t tax
a
Lake
and
Riv
er: I
ncre
ased
acc
ess
to fo
rmer
ly in
acce
ssib
le a
reas
in
crea
sed
harv
estin
g an
d in
trod
uctio
n of
alie
n sp
ecie
s
alte
red
popu
latio
n st
ruct
ure/
abun
danc
e
pot
entia
l for
trop
hic
casc
ades
shift
s in
com
mun
ity c
ompo
sitio
n an
d sh
ift in
age
/siz
e st
ruct
ure
Rive
r: H
abita
t fra
gmen
tatio
n
decr
ease
d co
nnec
tivity
obst
ruct
ion
for m
igra
tory
fish
, shi
ft in
com
mun
ity c
ompo
sitio
n an
d fu
nctio
nal
dive
rsity
, cha
nge
in p
rodu
ctiv
ity
Flow
alte
ratio
n (e
.g.,
hydr
opow
er, d
ams)
Lake
: Hab
itat a
ltera
tion
alte
red
lake
leve
ls
chan
ge in
hab
itat (
e.g.
, shi
ft in
litt
oral
zon
e an
d m
acro
phyt
e zo
ne)
shi
ft in
com
mun
ity
com
posi
tion
and
func
tiona
l div
ersi
ty, c
hang
e in
pro
duct
ivity
Rive
r: H
abita
t fra
gmen
tatio
n
dec
reas
ed c
onne
ctiv
ity
obs
truc
tion
for m
igra
tory
fish
, shi
ft in
com
mun
ity c
ompo
sitio
n an
d fu
nctio
nal d
iver
sity
, ch
ange
in p
rodu
ctiv
ity
Lake
: Cha
nge
in th
erm
al/h
ydro
logi
cal r
egim
e (d
ams)
in
crea
sed/
decr
ease
d la
ke le
vels
c
hang
e in
hab
itat (
e.g.
, shi
ft in
litt
oral
zon
e an
d m
acro
phyt
e zo
ne)
shi
ft in
com
mun
ity c
ompo
sitio
n an
d fu
nctio
nal d
iver
sity
, cha
nge
in p
rodu
ctiv
ityRi
ver:
Chan
ge in
ther
mal
/ hy
drol
ogic
al re
gim
e (d
ams)
c
hang
e in
hab
itat (
e.g.
, sed
imen
tatio
n) d
owns
trea
m (a
nd u
pstr
eam
- ch
ange
from
lotic
to
lent
ic s
yste
m)
shi
ft in
com
mun
ity c
ompo
sitio
n an
d fu
nctio
nal d
iver
sity
, cha
nge
in p
rodu
ctiv
ity, i
ncre
ased
mor
talit
y ra
tes
in fi
sh (t
urbi
nes)
Lake
and
Riv
er: C
hang
e in
wet
land
hyd
rolo
gica
l reg
ime
Alte
ratio
n of
hab
itat f
or m
igra
ting
spec
ies
Alte
ratio
n of
spe
cies
mig
ratio
n pa
thw
ays
and
disp
ersa
l p
oten
tial f
or tr
ophi
c ca
scad
es
shi
fts
in c
omm
unity
com
posi
tion
and
age/
size
str
uctu
re
Incr
ease
d ag
ricul
tura
l act
ivity
(e
.g.,
graz
ing
dom
estic
ani
mal
s)
Lake
and
Riv
er: N
utrie
nt e
nric
hmen
t, in
crea
sed
eros
ion,
(bot
h in
orga
nic
and
orga
nic
mat
eria
ls),
chan
ge in
sub
stra
te d
iver
sity
/com
posi
tion
alte
red
alga
l and
mos
s ab
unda
nce
cha
nges
in p
hoto
synt
hesi
s/re
spira
tion
bala
nce
shi
ft in
com
mun
ity c
ompo
sitio
n an
d fu
nctio
nal d
iver
sity
, cha
nge
in
prod
uctiv
ity
Intr
oduc
tion
of a
lien
gene
tic
type
s (e
.g.,
cultu
red
orga
nism
s an
d in
vasi
ve s
peci
es)
Lake
and
Riv
er: I
nter
actio
n w
ith n
ativ
e bi
ota,
repl
acem
ent a
nd a
ltere
d ge
netic
str
uctu
re
alte
red
food
web
s, ge
netic
mak
eup
and
fitne
ss
shi
ft in
co
mm
unity
com
posi
tion
and
func
tiona
l div
ersi
ty, c
hang
e in
pro
duct
ivity

42
5.4 Indicators for Lakes and RiversA list of biotic and abiotic parameters and indicators that have potential for monitoring and detecting change in FECs of Arctic lakes and rivers was also developed (Culp et al. 2011b). Parameters and their associated indicators were listed separately for each biotic and abiotic FEC (Tables 4 and 5). The biotic parameters led to the estimation of indicators of structural, functional, and phenological changes. The indicators of structural changes in FECs include taxon richness, diversity, and evenness, but also the presence of new taxa. Functional indicators include feeding groups and ecological traits of taxa. Phenological indicators quantify, for example, changes in the timing of emergence in insect populations, and changes in the size/age structure of fish populations. Abiotic indicators focused on aspects of the abiotic environment that might be important for biotic FECs, such as cumulative degree days and shifts in discharge and the ice regime. Note that the data in the tables do not reflect any order of priority.
Table 4. List of monitored parameters for each biotic Focal Ecosystem Component and the indicators/indices that can be derived from those parameters for lake and river ecosystems.
FECs Monitored Parameter Indicators/Indices
Benthic algae and phytoplankton
Number of individuals or biomass of each taxon
Community indices (e.g., abundance and density, taxonomic richness, diversity and dominance, biomass and numbers of keystone taxa, tolerance indices)
Numbers of red-listed (threatened) and rare taxa
Distribution and range (e.g., latitudinal and altitudinal)
Biomass (including chlorophyll a and biovolume)
Bulk algal biomass
Size structure of entire population or of keystone taxon
Fish, benthic macro- invertebrates and zooplankton
Number of individuals or biomass of each taxon
Community indices (e.g., abundance and density, taxonomic richness, diversity and dominance, biomass and numbers of keystone taxa, ecological traits, tolerance indices)
Numbers of red-listed (threatened) and rare taxa
Distribution and range (e.g., latitudinal and altitudinal, residency/anadromy for fish)
Genotypes and alleles (fish) Genetic diversity
Biomass (including biovolume, length, and body weight; gonad weight in fish)
Size structure of entire population or of keystone taxon
Fecundity (for fish; e.g., gonadal-somatic index)
Age of individuals Age structure of entire population or of a keystone taxon; growth rates (size at age or age at length (fish), or life cycle stage at length (benthic macroinvertebrates)) and age at maturity (age combined with biomass)
Timing of important life history events
Migratory phenology
Emergence timing
Reproductive timing (for fish; e.g., reproductive development rate, reproductive periodicity)
Body burden of contaminants in fish
Concentrations of contaminants in fish tissues above consumption guidelines or above environmental thresholds for sub-lethal or lethal effects
Macrophytes and riparian vegetation
Areal cover or number of individuals of each taxon (as feasible)
Community indices (e.g., abundance and density, taxonomic richness, diversity, and dominance, numbers of keystone taxa)
Numbers of red-listed (threatened) and rare taxa
Distribution and range (e.g., latitudinal and altitudinal)
Aquatic birds
Number of individuals of each taxon
Community indices (e.g., abundance and density, taxonomic richness, diversity, and dominance, numbers of keystone taxa)
Numbers of red-listed (threatened) and rare taxa
Distribution and range (e.g., latitudinal and altitudinal)
Age (immature/adult) and sex of individuals
Age structure of entire population or of a keystone taxon; number of young/breeding pairs
Timing of important life history events
Migratory phenology

43ARCTIC FRESHWATER BIODIVERSITY MONITORING PLAN
Table 5. List of monitored parameters for each abiotic Focal Ecosystem Component and the indicators/indices that can be derived from those parameters for lake and river ecosystems.
Abiotic FECs Monitored Parameter Indicators/Indices
Water temperature regime
• Water temperature (surface/profile temperatures in lakes)
• Degree days• Threshold temperatures• Stratification pattern (lake)• Proxy dates for ice on/ice off (river)
Hydrological and ice regimes
• Surface water level• Discharge (river or inflow/outflow of lake)• Ice on/off, thickness• Light transmission (lake)
• Change in timing of hydrological events (e.g., nival/ice regime)
• Flood frequency/ duration• Growing season (length and timing)• Percent bottomfast ice and transparent ice • Water balance (lake)• Residence time (lake)• Change in period of half flow (river)
Water quality
• Water chemistry (e.g., nutrients, trace metals, DOC, colour, pH, alkalinity, heavy metals, salinity, persistent organic pollutants, turbidity, total suspended solids (TSS), total dissolved solids (TDS), river bed load)
• Secchi depth (lake)• Dissolved oxygen
• Chemical variables (e.g., nutrients, trace metals)
• Water clarity, photic zone depth (lake)• Import/export (of organic material,
sediment, heat energy, etc. in river; calculated with hydrologic regime)
Climatic regime
• Air temperature• Precipitation (amount and type) and
relative humidity• Wind speed/direction• Solar radiation (UV, PAR)
• Degree days• Threshold temperatures• Surface water level (lake) or discharge
(river) (modeled from precipitation)• UV/PAR attenuation (lake)• Energy inputs (river)
Permafrost• Active layer depth• Temperature• Slump area
• Change in active layer depth• Temperature change• Percent slumping
Arctic grayling. Photo: Pi-Lens/Shutterstock.com

6. Sampling Approach and Recommended Protocols

45ARCTIC FRESHWATER BIODIVERSITY MONITORING PLAN
6.1 Introduction
This chapter outlines the biotic and abiotic sampling approaches for lakes and rivers that are recommended for a long-term monitoring program (for full details on sampling protocols, see Appendix C). A common and feasible sampling approach that includes protocols and field and laboratory guidelines for comparable standardized sampling and analysis is required for the success of a pan-Arctic monitoring program. Because Arctic countries have existing protocols established by national or regional authorities, the methods outlined here were based on existing protocols wherever possible. Such a foundation allows for the harmonization of diverse programs with minimal methodological changes, and will facilitate the comparison of historical and new monitoring data.
It is equally important to define the types of locations and habitats that should be sampled and the spatial and temporal coverage that is necessary to develop a strong and cost-effective monitoring program. General guidelines are provided within this chapter, however, more specific details about the selection of monitoring sites and sampling frequencies will follow from trend assessments upon implementation of the Freshwater Plan. During the start-up phase (2013-2016), incorporation of common sampling approaches and designs will focus on the existing freshwater abiotic and biotic monitoring programs of the Arctic countries. Concurrently, approaches used in non-Arctic regions, including community-based citizen science, will be considered for inclusion after 2016. Monitoring handbooks will be developed to assist implementation of the plan and ensure suitable and comparable measures across the Arctic. Finally, the sampling of wetlands associated with lakes and rivers should follow the protocols set out by the Ramsar Convention on Wetlands (details and protocols can be found at www.ramsar.org).
6.1.1 Basic monitoring program
The pan-Arctic freshwater monitoring program must provide a comprehensive sampling plan that can be used for cross-regional comparisons of priority FECs and indicators, but that can feasibly be incorporated into current monitoring activities. To accomplish this goal, a basic monitoring plan was created to describe the optimal sampling design. The plan outlines the FECs that should be included in a monitoring program and provides details on recommended protocols for sampling each FEC. Three levels are used to distinguish recommended protocols based on their intensity and feasibility for inclusion in a monitoring program (for full details, see Appendix C). Level 1 protocols indicate the minimal sampling requirements to describe the FEC or indicator, and should be included in a basic monitoring program. The Level 2 protocols describe the sampling requirements for additional indicators or describe more advanced sampling techniques for the basic indicators, while Level 3 protocols are generally more advanced and may only be feasible for a few monitoring programs. Measuring samples from Canadian Arctic. Photo: Joseph Culp
46
6.1.2 Overall sampling strategy
Long-term monitoring programs should include sampling of the whole range of biotic and abiotic FECs in lakes and rivers where possible to establish datasets that can be used to detect the impacts of a wide range of stressors. However, hydrology, water chemistry, algae, zooplankton and macroinvertebrates, in particular, will reflect changes over shorter time periods (months) than longer-lived and less-abundant organisms like fishes, and as such, should be sampled more frequently in monitoring programs. In addition, hydrology, water chemistry and lower-trophic-level organisms are all highly interdependent, so it is recommended to make many of these measurements at the same time, as this will allow for a better interpretation of spatio-temporal trends.
The most important aspects of a coordinated pan-Arctic monitoring program are:
► Sampling the full range of habitats (e.g., littoral and pelagic zones in lakes, riffles and pools in rivers) that are important for the overall structure of the ecosystem and the function of the food web. For lake systems, this may require sampling of both water column and benthic communities, as both habitats are important for the overall structure of the ecosystem, and are involved in the function of the food web.
► Using fixed sentinel sampling stations and protocols. ► Prioritizing an intensive and continuous program running at fewer well-chosen sites to evaluate
temporal trends, rather than one that samples more sites less frequently to just evaluate spatial trends.
► Developing a network of abiotic and biotic measures from a diversity of lakes and rivers across the pan-Arctic.
Abiotic data should be collected at multiple spatial scales if possible, and biotic data should encompass multiple ecosystem levels. Examples at various ecosystem levels include the following, which are not exhaustive or mutually exclusive:
► Community level: occurrence, composition, relative abundance and size spectra of species present, diversity/richness indices and trophic indices
► Species level: distribution (geographical, ecological, and temporal), population structure, life history patterns, and phenologies
► Population level: abundance, biomass, distributions of key parameters (age, size), survival, growth, reproductive potential, phenologies (such as matches/mismatches to critical events, e.g., anadromy)
► Individual level: habitat use, diets, developmental anomalies, growth (may not be as valuable as other levels in a spatially broad monitoring program but is specifically useful for characterizing variation within a group (i.e., population) of interest).
To compare habitats and communities across regions, pan-Arctic monitoring efforts should be standardized as far as possible in terms of gear, species, season, habitat types, sampling methods, and analytical protocols. Multi-disciplinary sampling programs that collect data for a range of biotic and abiotic FECs provide a cost-efficient way to maximize monitoring activities in Arctic rivers. Specific standardized protocols for each biotic and abiotic FEC will be outlined in the following sections. General information collected at a sampling site should include:
► Geographical description of the area(s) and station(s) ► Number of stations and their habitat type ► Number of field sub-samples taken ► Type and size of sampler(s) used ► Mesh size(s) of sampler and sample reduction or laboratory sorting sieves (invertebrates) ► Date of sampling trip(s)

47ARCTIC FRESHWATER BIODIVERSITY MONITORING PLAN
While it is important to include the complete suite of FECs in a monitoring program, this may not be possible in remote areas where access is limited (e.g., no road access). Moreover, sampling protocols may need to be modified to account for logistical constraints. In these cases, efforts should be made to maximize sampling within the limitations imposed by the inaccessibility of the sampling area.
6.1.3 Sampling sites
The selection of lakes and rivers to sample should be based on:
► Existing long term data or sporadic data sets of good quality, including data from existing research stations and infrastructure
► Coverage of all countries ► Coverage of all 3 sub-regions (sub-, low and high Arctic) ► Coverage of major water body types (ponds, lakes, springs, streams, rivers, and associated
wetlands) ► Lowland and highland areas ► Coverage of different types of catchments (e.g. differing in terms of size, geology, and other
characteristics) ► Lakes with fish (open and land-locked) and fishless lakes; rivers with migratory fish, rivers with
non-migratory fish, and rivers without fish ► Suitability for remote sensing purposes
6.2 Lake Monitoring Approach
The majority of lakes on Earth lie in the Northern Hemisphere at higher latitudes. More than 60 percent of the world’s lakes are found in Canada, but Finland is also known for its many lakes (i.e., The Land of the Thousand Lakes), as are the coastal areas of Greenland that are not covered by icecaps. In the pan-Arctic area within the CAFF boundary, there are 121,187 lakes according to the recent estimate in the Global Lakes and Wetlands Database (Fig. 9) (Lehner and Döll 2004). However, this number should be viewed as a minimum estimate since 10 ha was the smallest lake size included in the database and subsequent validation of the database revealed that only lakes on the order of 100 ha and larger were confidently resolved. Further, the accuracy of this database varies by region with the largest underestimates in lakes being found in the Scandinavian countries (Lehner and Döll 2004). Nonetheless, extraction of lakes from this global dataset allows for general comparisons of the number of lakes and area of lakes occurring throughout our focus region.
An assessment of limnicity (lake area per land area) shows Canada to have the largest lake area coverage, followed by Sweden, Finland, and the United States, with Russia, Norway, and Iceland all having a limnicity below 2% within the CAFF boundary (Table 6). Table 7 provides examples of lakes that have been included in previous monitoring activities in each country, and that should be considered for inclusion in future monitoring.
Identifying the appropriate sampling frequency involves balancing the costs of data collection and analysis against the need for collecting comprehensive, high-quality data. Sampling at a higher frequency provides more information and higher statistical power, but the costs are greater. The objective is to make the sampling interval long enough to minimize sampling costs, but short enough to ensure short-term variability is adequately understood (MacDonald et al. 2009). Sampling should attempt to target all biological components and supportive chemical variables in the lake ecosystem that can be expected to respond to the identified major pressures; however, the frequency of the sampling schedule should differ among the different trophic levels to optimize man-power and other economical resources. Stressor-specific conceptual models may be constructed to justify the inclusion of biotic and abiotic variables in sampling.

48
Figure 9. Distribution of lakes within the CAFF boundary. Data from Lehner and Döll (2004).
Table 6. Lake number, lake area, land area by country and percentage of lake area of land area within the CAFF boundary. Data from: Global Lakes and Wetlands Database (Lehner and Döll 2004).
Country Lake number Lake area (km2) Land area (km2) Percentage of land area
Canada 82642 468431 5352594 8.8
Finland 495 3657 77452 4.7
Greenland 2937 9790 2144424 0.5
Iceland 493 1462 102243 1.4
Norway 1002 2881 153207 1.9
Russia 25986 100582 5423992 1.9
Sweden 879 6403 105016 6.1
United States 6753 29166 609149 4.1
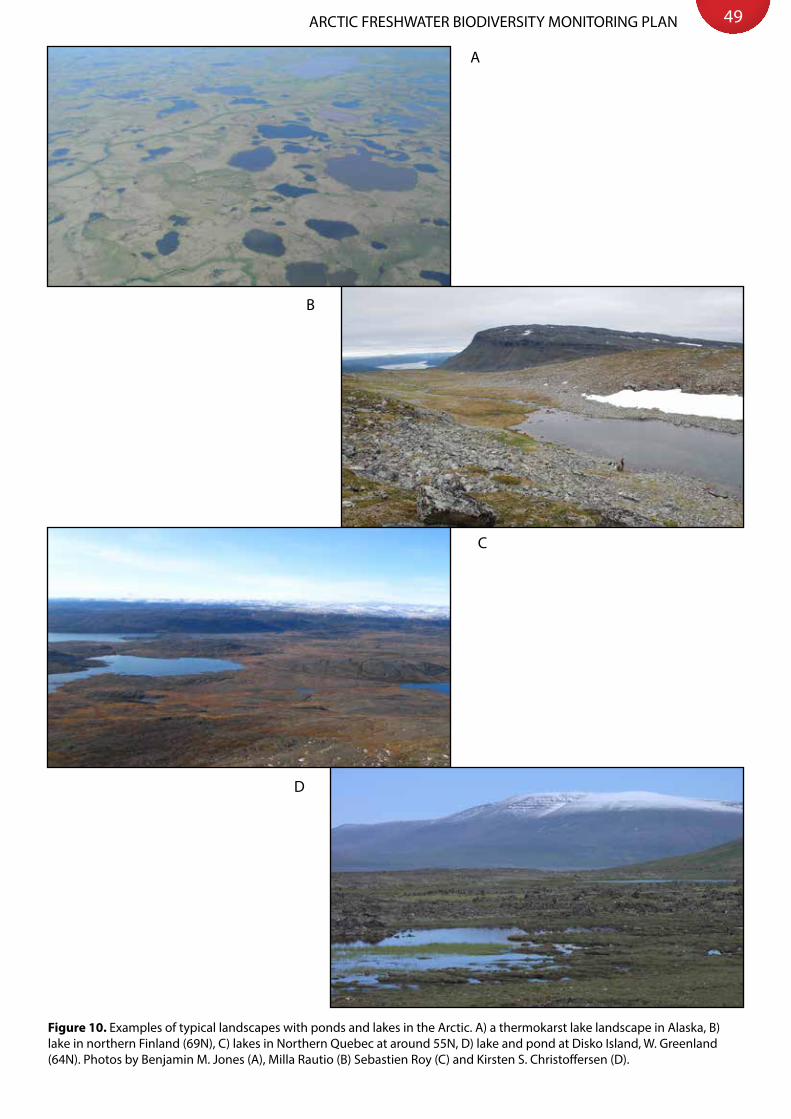
49ARCTIC FRESHWATER BIODIVERSITY MONITORING PLAN
Figure 10. Examples of typical landscapes with ponds and lakes in the Arctic. A) a thermokarst lake landscape in Alaska, B) lake in northern Finland (69N), C) lakes in Northern Quebec at around 55N, D) lake and pond at Disko Island, W. Greenland (64N). Photos by Benjamin M. Jones (A), Milla Rautio (B) Sebastien Roy (C) and Kirsten S. Christoffersen (D).
A
D
C
B

50
Table 7. List of known potential sampling stations that could be used in the CBMP-Freshwater Monitoring Plan. It should be noted that this is only a suggestion based on present knowledge. See the references for source.
Region Name of lake/pond Latitude Data series(start year)
Canada
Lake Hazen, Ellesmere Island, Nunavut 81N ~20+ years
Char Lake, Ellesmere Island 74N ~1970s
Old Crow Flats, Yukon Territory (~50 lakes) 68N 5 years (2007)
Wapusk National Park, Manitoba (30 lakes) 58N 4 years (2008)
Mackenzie Delta Lakes 68N ~25 years
Great Whale River region, Hudson bay 55N ~10 years
Greenland
Zackenberg. NE Greenland (2 lakes annually, 19 lakes every 5th year)
74N 15 years (1997)
Kobbefjord , W Greenland (2 lakes) 64N 7 years (2005)
Disko, W Greenland (2 lakes) 69N 3 years (2000)
Iceland
Lake Ellidavatn 64N 22 years (1988)
Lake Myvatn 65N 33-110 years (1900)
Lake Mjoavatn 64N 20 years (1988)
Veidivotn 64N 25 years (1985)
Scandinavia & Svalbard
Norway:
Lake Nervatn (Salangen lake system) 68N 70+ years (1940)
Takvatnet 69N 30+ years (1979)
River Pasvik lake system 69N 20+ years (1990)
Norway/Svalbard (2 lakes):
Lake Linné 78N 40 years (1935)
Lake Diset 79N 38 years (1974)
Sweden:
66-68N 17-24 years (1988/1995)
Lake Latnajaure
Lake Abiskojaure
Lake Valkeajärvi
Lake Jutsajaure
Lake Pahajärvi
Lake Båtkåjaure
Lake Njalakjaure
Lake Louvvajaure
Finland (4 lakes) 68N-69N 16-46 years
Russia To be updated upon implementation
United States
Toolik Lake 68N 36 years (1975)
Toolik LTER 68N 36+ years
Fish Creek Lakes (6 lakes) 70N 2 years (2010)
Teshekpuk Lake 70N 5 years (2006)
Schrader/Peters Lakes 69N Sporadic (1960)
Barrow Ponds 71N 41 years (1971)

51ARCTIC FRESHWATER BIODIVERSITY MONITORING PLAN
6.2.1 Recommendations for general sampling approach
Section 6.2 provides an overview of the general sampling approach for lakes. Full details on sampling protocols for lakes can be found in Appendix C.
Periodic thermal stratification can occur in Arctic lakes provided there is adequate depth, but this is more common in low- and sub-Arctic than in high-Arctic systems. Stratification affects both water column chemistry and species distributions. Sampling at only one depth or only in the epilimnion may be problematic due to a loss of information for indicators such as algal biomass, which is very variable among depths and often at a maximum in transparent Arctic lakes below the thermocline. As stratification is expected to change, the recommendation is to monitor the integrated water column for biotic variables, combining samples from the epi- and hypolimnion. For abiotic variables that are expected to differ within the water column, such as water chemistry, fixed-depth sampling may be necessary. During non-stratified conditions, however, a surface water sample may provide a good estimate of whole-water-column chemistry.
The sampling location should cover the deepest part of the lake if known or alternatively at a mid-lake position. Both water column abiotic and biotic samples are recommended to be collected from the total integrated water column, with the exception of variables such as dissolved oxygen that require depth-specific monitoring at one or more depths. An integrated water sample is composed of samples from every meter for shallow lakes or at discrete depths (e.g. 0, 5, 10, 15, 20 m) from deeper lakes. Discrete samples should be pooled to make one integrated sample. The total volume of the composite sample should be a minimum of 25 liters, which may be mixed and sub-sampled if transportation limits sample volume. In this way the information of, for example, total algal biomass can be captured in more reliable way than from samples at only a few depths.
Because the thermocline often marks a transition in many variables (nutrients, chlorophyll a, zooplankton, fish), care must be taken to identify such gradients and to collect samples at a higher resolution if possible. Changes in stratification should, however, be monitored with thermistors. Water from different depths should be well mixed, divided into smaller volumes and processed according to protocols for each parameter, e.g., zooplankton should be concentrated with a 50 µm sieve and preserved (e.g., with ethanol) to obtain a concentrated sample.
Major sampling effort should be during the season of maximum biomass and diversity, which usually is in late summer or after the autumn overturn (if stratification was present). However, an ideal sampling strategy would also include occasions earlier during the open water season and once in winter, during the maximum ice thickness. Some of the problems with stratification can also be solved by timing sampling to occur in late summer when thermal stratification has broken down. The recommended frequency of sampling differs across variables, and is specified in the protocols for each FEC. Sampling zoobenthos in Lake Apmeljaure, Sweden, Photo: Erik Goedkoop
52
6.2.1.1 Supporting variables
An initial description of lake type, morphometry, size and catchment characteristics is important for enhancing the characterization of lake systems and for understanding biotic and abiotic differences in FECs among and across regions. These attributes, which can be derived from Geographic Information System (GIS) data, are considered to be static and re-sampling through a monitoring program is generally not necessary. Depth is also a crucial factor for estimating a number of environmental conditions such as whether or not the water column freezes solid and has the potential to overwinter fish populations, whether light can penetrate to the bottom (during summer) and the potential for partial or complete water column mixing. It is necessary to include depth for one or more locations of each dominant lake type.
Data collection should follow the general guidelines:
► Measurements of lake surface area, shoreline length, bathymetry, catchment area, slope, elevation, surface geology, permafrost extent, land cover and vegetation cover in the catchment derived from global GIS datasets.
► If feasible, similar measurements could be based upon regional or local datasets to improve accuracy.
6.2.2 Biotic FECs
6.2.2.1 PlanktonThe water column biota can be surprisingly abundant and diverse despite the low productivity of Arctic lakes. Although a number of growth strategies allow microbes as well as phyto- and zooplankton to proliferate, these organisms are sensitive to changes in the environment and will respond rapidly to climate changes. Sampling of water column biota should be carried out following international standards with regard to choice of mesh size of nets and analytic procedures. In general:
► Sampling will occur annually, with primary data collection in late summer as a minimum to sample the system at a period of higher productivity and to match historical sampling. If financial resources allow, additional sampling could occur several times during the ice-free season and once in the winter when ice thickness is at maximum (April-May).
► Samples are preserved with 3% acid Lugol’s solution or 70% non-denatured ethanol for genetic analysis.
6.2.2.2 BenthosSubstantial light reaching the bottom in most Arctic water bodies means that primary production is possible both in the water column and at the bottom down to relatively large depths. The benthos, primarily benthic diatoms, often contribute to a large fraction of the total autotrophic productivity and biomass of these ecosystems, with increasing dominance towards the North. However, the spatial differences in primary production and biomass within a lake may be substantial and this should be taken into account in sampling. Benthic invertebrate communities are also well-developed and abundant in Arctic lakes. The lake littoral areas in the Arctic provide similar habitats for benthos to those of rivers. The oxygen supply is rich and the detritus accumulation from terrestrial sources is insignificant. Many riverine benthic insects may be found in lake littorals in the area. In the Arctic, insect larvae (especially Chironomidae) constitute most of the macro-benthic fauna, and may provide the best monitoring/assessment tool, although oligochaete worms, snails, mites, and turbellarians can also be quantitatively important.
Benthic algae for taxonomic analysis are commonly collected from submersed stones in the littoral zone of lakes or in rivers. Ideally samples are collected from at least 5–10 submersed stones of cobble- or larger size. If stones are lacking at the site, core samples can be collected from soft substrates.

53ARCTIC FRESHWATER BIODIVERSITY MONITORING PLAN
Littoral samples of macroinvertebrates are commonly collected using kick-sampling methodology, in which the bottom substratum at 0.5–1 m water depth is disturbed by foot movements and suspended material is collected with a D-frame or rectangular hand net with a mesh size of 0.5 mm. In lake littoral habitats, the disturbed suspended material, including invertebrates, is collected by active movements of the hand net (kick-and-sweep method). Kick samples are primarily designed for stony substrata in streams/rivers, but do also work relatively well on finer substrates and in lake littoral habitats.
Profundal macroinvertebrates are sampled using grab or core samplers (models vary nationally and between research institutes). Samples are taken from sites with suitable soft substrates (mud, fine sand etc.). Profundal samplers have fixed sample surface areas, so they give quantitative estimates of macroinvertebrate abundance. Samples are sieved using a sieve with approximately 0.5 mm mesh.
The sampling approach for benthos should follow these guidelines:
► Sampling of benthic communities should occur annually. Benthic algal and invertebrate community surveys should be completed during the most ecologically relevant season, generally when biological diversity is highest. For many Arctic lakes this means August/September or one month before ice cover, when the majority of taxa will be present and the biomass is highest. To reduce costs and increase “data value”, sampling should be linked with other programs (zooplankton, water chemistry etc.). The use of a common field protocol describing sampling depths, bottom substrata, etc. is recommended.
► To ensure adequate spatial placement of samples, benthic algae should ideally be collected from a known area of all major types of bottom material (sand, pebbles and stones) ranging from the shallow littoral (0.5 m) to the deepest point of the lake (when possible), with multiple samples collected along this depth gradient. However, in continuous monitoring this sampling design may be too expensive, and sampling should minimally be conducted by collecting benthic algae from the littoral zone. Invertebrates should be collected using individual area or time-limited collections of benthic invertebrates (e.g., one grab, core, cylinder, quadrat, kick- or U-net sample).
► Field sieving of invertebrates should be done wherever possible, immediately after sample retrieval and before preservation, as many organisms become fragile and brittle after preservation. The general recommendation for nets and sieves for the collection of macroinvertebrates is a mesh size of 500 μm. Although smaller mesh sizes can be used (e.g., 250 μm) to increase sampling of smaller invertebrates, many monitoring programs opt for 500 μm mesh to reduce the costs associated with laboratory processing (i.e., sorting and identification time).
6.2.2.3 FishThe fish communities of Arctic, sub-Arctic and northern Alpine lake systems in North America, Europe and Asia are dominated by salmonid fish, including the genera Salvelinus, Salmo, Onchorhynchus, Thymallus and Coregonus, all comprising anadromous life-history forms, thus exploiting both lakes and rivers. Salmonids reproduce in freshwater, but whereas Pacific and Atlantic salmon and brown trout may spend several winters in saltwater, arctic char, grayling, whitefish and cisco overwinter in freshwater. Other taxa using northern lake systems include smelt, eel, burbot, sculpin, northern pike and stickleback. Land-locked/resident piscivorous and anadromous salmonids may grow very large and have thus historically been harvested by traditional and more modern gear designed for catching large fish. These fish are also of major importance to the subsistence fisheries of northern peoples, anglers, and to local tourism entrepreneurs.
High Arctic freshwaters are more or less synonymous with very low biodiversity and often contain only one freshwater species (i.e., Arctic char (Salvelinus alpinus)). This species may inhabit estuaries and rivers in the summer, while overwintering in lakes for more than 10 months a year. Fish abundance in high Arctic areas may be low, particularly the abundance of larger fish, suggesting that lethal sampling has

54
to be limited. Even though production is low, total fish biomass may be high because of high mean age. For open systems that include salmonids, two strategies are present - anadromy or residency - where the frequency/amount of anadromy may vary tremendously among lakes, as well as within lakes among years. In lakes where fish have no access to the sea, i.e., land-locked systems, cannibalism among larger fish is common. In both open and closed systems the catchability of large fish (anadromous fish and/or cannibals) is high and they are vulnerable to being depleted even for scientific sampling.
The diversity of fish communities of most lakes forms gradients, with sub-populations occupying different habitats and through different periods. Different size and age groups may occupy different regions or depths of a lake in different seasons, while certain sections of running water (outlets) may be used for reproduction, with most salmonids spawning in late autumn, and graylings and smelts spawning in spring. The habitat segregation among and between species, possible species’ morphotypes, size and age groups should determine the best sampling approach. For example, monitoring of anadromous arctic char re-entering lakes for overwintering might best be conducted through the operation of a counting fence or traps at lake inflows or subsistence fishing statistics.
General sampling should follow the guidelines:
► Standardization of species, gear, season, and habitat types to be monitored is required to allow for inter-regional comparison of results. Net sampling should be conducted in late summer in up to three habitats: littoral, profundal and pelagic zones.
► Sampling of fish populations should preferably be done on an annual scale, but can be done in intervals of 3 or 5 years, in long lived slow growing populations, for example.
► Resident and landlocked fish, as well as juveniles, have to be sampled in the lake by use of multiple-mesh-size gill netting of different habitats (littoral, profundal and pelagic zone) and by electrofishing for juvenile fish in the shallowest areas (littoral zone).
► Fish may additionally be sampled in the outlets of the lake to gauge movements and estimate population size of ascending fish prior to overwintering.
6.2.2.4 MacrophytesSubmerged, rooted floating-leaved, free-floating, and emergent vascular plants are all important for the overall ecology of a lake and pond. The species distribution and abundance of vascular macrophytes reflect nutrient changes, hydrological regime shifts and climatic variability (e.g., temperature and light). Exotic species may be introduced through bird migration, wind or most likely human activities.Macrophytes are most important in sub-Arctic regions in shallow systems with soft bottoms. Their role in most Arctic lakes as habitat for other biota (zooplankton, fish, etc.) is probably limited. However, with projected landscape changes and higher terrestrial and aquatic production, the amount of organic matter in all Arctic lakes is predicted to increase. This will provide more rooting ground for macrophytes and may increase their importance in Arctic lakes. Thus, their monitoring over time may document important shifts in biodiversity.
The macrophyte distribution and coverage should be sampled every few years (e.g., 3-5) along transects covering the entire water body. The number of transects can be regulated to match the level of resources available for sampling.
6.2.2.5 Aquatic birdsBirds make use of the aquatic habitat for feeding, breeding and protection from predators in small lakes and wetlands, and their presence contributes to nutrient enrichment (through feces and feathers). The accumulation of remains from the bird colonies (i.e., feathers and fecal droppings) can provide a substantial input of nutrients to the near-lake areas that are in direct contact with the water body itself. Thus, even fairly small bird assemblages may enrich the oligotrophic freshwater ecosystems. Since abundance and diversity of migrant bird species are likely to change with climate change and be affected by human activity, monitoring of these bird parameters will be important.

55ARCTIC FRESHWATER BIODIVERSITY MONITORING PLAN
Figure 11. Four years of temperature data for Teshekpuk Lake, northern Alaska, showing that both summer and winter periods may vary between years. Source: Benjamin M Jones, U.S. University of Alaska Fairbanks, unpublished data.
Where feasible, the sampling approach could include as a minimum the number of birds and their time of presence every few years (e.g., 3-5). The amount of historical data can be extensive, and community-based monitoring can provide an exceptional opportunity to establish continuous monitoring of bird populations via citizen science activities. Another possibility for remote areas is to establish an automatic photo-based monitoring system that requires annual visits to download data.
6.2.3 Abiotic FECs
6.2.3.1 Water temperature regimeWater temperature directly impacts biological activity and chemical reactions. Lake thermal regimes are dependent upon geographic location, climate conditions and hydrological characteristics and further dependent upon individual lake characteristics such as surface area, depth, volume, direct surroundings, and optical properties. These data can be obtained by manual measurements, thermistor and data logger measurements, or with remotely sensed imagery (surface).
6.2.3.2 Hydrological and ice regimesThe hydrological regime of Arctic and sub-Arctic lakes is highly sensitive to climatic changes. Higher evaporation rates can lead to gradual drying out of lakes. Increased precipitation can result in increased erosion of shorelines, leading to rapid drainage. In thermokarst areas, thawing permafrost can also lead to rapid drainage from increased groundwater outflow and slumping of shorelines. Hydrological processes will likely have large impacts on the biodiversity of lakes and ponds, and as a consequence, it is recommended that hydroecological monitoring be incorporated into the monitoring plan.
Hydrological sampling in lakes should include measurement of lake levels and surface area. In addition, water isotope tracers (δ18O– δ 2H isotopes) can be used to assess hydrological processes controlling lake water balances. This can provide insights into the hydrological processes that influence lake water balances and explain patterns in biodiversity of lakes (Edwards et al. 2004, Turner et al. 2010, Yi et al. 2008).

56
The timing of lake ice phenological events (break-up and freeze-up) and trends in winter ice growth are important indicators of changes in climate and potential shifts in lake ecosystems. The conditions of the ice (e.g., black ice vs. milky ice) as well as the accumulation of snow on top of the ice are important for the light transmission during the ice cover period. Ice on/ off timing and ice growth data can be obtained by direct observation or with remotely sensed imagery on an annual basis. There is the potential for community-based monitoring programs to be developed to collect data on aspects of the lake ice regime.
6.2.3.3 Water qualityWater chemistry parameters are often key variables controlling the distribution of organisms in lakes, and are needed to interpret monitoring results of biota. Recommended water chemistry parameters to include in a pan-Arctic monitoring program include total phosphorus (TP), total nitrogen (TN), dissolved organic carbon (DOC), colored dissolved organic matter (CDOM), pH, alkalinity, conductivity, major ions (Ca, Mg, Na, K, SO4, Cl), total suspended solids (TSS) and dissolved oxygen.
On site measurements of water column chemistry using handheld probes, or by collecting a subsurface water sample from an outlet point or from the shore should be done a number of times over the ice-free season. If possible, winter sampling can be included at some sites as the length of winter periods and temperature fluctuations may vary among years (Fig. 11), potentially affecting some water quality variables. Sampling for water chemistry parameters should be paired to coincide with biological sampling trips.
6.2.3.4 Climatic regimeSince climate is the overriding environmental factor affecting most bio-geochemistry processes it is pivotal for the understanding of the structure and functioning of the freshwater ecosystems to be able to describe the dynamics of climatic parameters. The most important variables are incoming light, temperature, wind and precipitation.
6.2.3.5 Permafrost and active layerPermafrost is ground that remains below 0°C for two years or more, and it impacts the hydrology, geomorphology, and ecology of northern high latitude regions. Changes in the active layer (i.e., top soil layer that thaws and refreezes annually) thickness and thawing can impact lake systems by altering soil storage capacity, flow paths and surface drainage, and can lead to catastrophic drainage and/or enlargement of lakes. Thaw slumping along lake margins has been shown to impact water chemistry and water quality. Monitoring should include measurement of permafrost extent and active layer depth carried out by field surveys or remote sensing techniques.
Northern Canada. Photo: Christopher Kolaczan/Shutterstock.com

57ARCTIC FRESHWATER BIODIVERSITY MONITORING PLAN
6.3 River Monitoring Approach
Lotic waterbodies are found throughout the pan-Arctic region, ranging in size from small headwater streams to among the largest rivers in the world. The largest rivers of the Arctic include the Mackenzie River in Canada, the Yukon River in Canada and Alaska, and the Kolyma, Lena, Yenisey, Ob, Pechora, and Severnya Dvina Rivers in Russia (Fig. 12).
The Lena, Yenisey, and Ob Rivers in Russia are three of the largest rivers in the world. Together, the catchments of the 6 largest rivers in the Russian Arctic cover approximately two-thirds of the Eurasian Arctic region (Peterson et al. 2002). In contrast, much of the eastern Canadian Arctic is made up of smaller river systems and catchments. Due to this diversity, it is necessary to include a range of catchment sizes and stream orders in a pan-Arctic river monitoring program.
Table 8 lists some of the potential river sampling stations for each country, based on past monitoring activities and availability of data. In many cases, these sites are large rivers or more accessible river systems. Thus, although one focus of a pan-Arctic program should be to continue monitoring these systems, emphasis should also be placed on ensuring that the plan incorporates a range of river sizes and types.
Figure 12. Catchment area of the Arctic Ocean, showing the annual discharge (cubic kilometers) of major rivers (Source: CAFFs Arctic Flora & Fauna – 2001. CAFF map number 21: http://library.arcticportal.org/1347/)

58
Table 8. List of known potential sampling stations that could be used in the CBMP-Freshwater Monitoring Plan. It should be noted that this is only suggestion based on the present knowledge.
REGION NAME of river LATITUDE DATA series (start year)
Canada
Northern Québec (Makivik Corp.) 58N
Varied, depending on FEC
Mackenzie River (DFO, Environment Canada) – potential site: lacking temporal aspect and spatial connectivity 55N – 70N
Torngats National Park rivers 58N
Nain, Labrador (DFO) 58N
Rivers/streams within National Park network 58N – 81N
Greenland
Zackenberg. NE Greenland (1 river) 74N
Disko, W Greenland (1 river) 69N
Narsaq, S. Greenland (1 river) 61N
Kangerlussuaq, W. Greenland 67N
IcelandLaxa River 65N
River Vesturdalsa 65N
Scandinavia & Svalbard
Norway (Finnmark: 4 rivers including River Tana; Troms: 1 river)
Norway/Svalbard (2 rivers)70N (Finnmark) 100 years (1912)
Sweden:
65N-68N
(Chemistry)
Abiskojokki (national) 1982
Akkarjåkkå (national) 1995
Alep Uttjajåkkå (national) 1997
Kitkiöjoki (national) 2007
Muddusälven (national) 1984
Sangisälven (national) 1995
Viepsajåkkå (national) 2007
Bergmyrbäcken (national) 1995
Vapstälven (national) 2007
Torne River (national) 1969
Ylinen Kihlankijoki (regional) 1995
Rokån (regional) 1995
Hartijoki (regional) 2010
Finland (4 rivers) 67N-69N 39-49 years (1963)
Russia 6 largest rivers 60 years (1936; hydrology)
United States
Colville River 10 years (2002)
Kuparuk River 41 years (1971)
Fish Creek (National Petroleum Reserve—Alaska) 3 years (2009)
Wulik River 28 years (1984)
Sagivanariktok River 30 years (1982)
Putuligayuk River 42 years (1970)
Yukon River 37 years (1975)
Meade River 7 years (2005)
Kobuk River 36 years (1976)

59ARCTIC FRESHWATER BIODIVERSITY MONITORING PLAN
6.3.1 Recommendations for general sampling approach
Section 6.3 provides an overview of the general sampling approach for rivers. Full details on sampling protocols for rivers can be found in Appendix C.
River sampling should focus on sites that are already being used for national monitoring or research programs in each country/region (see Table 8, Appendix D). Additional sites may be determined by defining gaps in the existing stream monitoring programs in the pan-Arctic countries/regions such as in high-Arctic Canada and Russia. An initial selection of available (and manageable) sites that include data records for the biotic and abiotic FECs, combined with a first assessment of the spatial and temporal coverage of data for the FECs will make analysis possibilities and shortcomings visible, and will also enable a first overview of the additional data and stations required for future assessments.
Stream order (size) and river types, e.g., glacial/non-glacial should be considered when selecting new monitoring sites. Ideally, a comprehensive pan-Arctic monitoring plan should include sites from a range of stream orders and all possible river types (e.g., fed by glacier, snowmelt, spring, etc.). Focus areas may differ depending on the stressor that is considered most important in a particular region (e.g., climate change, pollution, habitat destruction, harvesting, alien species, etc.).
Within a chosen river, the reach that is selected for sampling should be composed of habitat types typical for that river system to ensure a representative sample of biota is collected. For fish sampling, the study sites should either be representative for the whole stream or should be good reproduction sites for particular fish taxa of special interest. Sampling locations should preferably correspond to recording sites for abiotic variables (e.g. weather stations, gauging stations) to maximize data collection.
6.3.1.1 Supporting variablesThe size of rivers and their catchments are important for understanding biotic and abiotic differences in FECs among and across regions. These data are derived from global, regional, and local GIS datasets. As these variables are considered to be static, resampling through a monitoring program is generally not necessary. However, initial description of these supporting variables is necessary to enhance characterization of lake systems.
Stream order and catchment characteristics such as slope, elevation, surficial geology, and groundcover may have a large impact on biotic and abiotic processes within rivers, and may determine a number of conditions such as whether the water column freezes solid. If possible, water source should be determined for the stream or river in question, as the source may contribute to flow (in)stability and thermal (in)stability.
Data collection should follow the general guidelines:
► Measurements of stream order, catchment area, slope, elevation, surface geology, permafrost extent, land cover and vegetation cover in the catchment derived from GIS datasets.
► If feasible, similar measurements as above could be based upon regional or local datasets to improve accuracy, as well as the determination of water source.
6.3.2 Biotic FECs
6.3.2.1 Benthic algaeThe benthic algal community is taxonomically rich, forms the base of the aquatic food web and has been shown to respond to changes in water quality. It is relatively simple to add benthic algal sampling to a monitoring program, as sample collection and processing are uncomplicated, processing costs are relatively low and benthic algae are ubiquitous. In addition, there are established protocols for sampling and analyzing diatoms and chlorophyll a in several countries. To enable the comparison of benthic algal

60
samples throughout the Arctic, and at the same time to ensure that both biodiversity and biomass/biovolume are captured even with restricted resources, sampling must follow the general guidelines:
► Taxonomic identification of samples is essential for the assessment of change in community indices.
► Samples should be collected from the top of rocks/stones if available, as this is the focal substrate in most existing protocols. If rocks or stones are not present, core samples can be collected from soft substrates. Soft substrate sampling methods should be noted as comparability between streams may be affected.
► Sampling should occur annually, with primary data collection in late summer or early fall to fit peak abundance and diversity, and to be consistent with historical sampling.
If and when additional resources are available, sampling may be extended to a multi-habitat protocol including macroalgae, because this approach best characterizes the benthic algae in the reach.
6.3.2.2 Benthic macroinvertebratesStream macroinvertebrates are widely used for biomonitoring (e.g., Hering et al. 2006, Reynoldson et al. 2007, Rosenberg and Resh 1993). Most stream macroinvertebrate taxa have a relatively short life cycle which makes them suitable for detecting environmental impacts such as acidification, climate change and hydromorphological modifications. On the other hand, their life cycle is sufficiently long so that their presence reveals information about environmental conditions during some time prior to sampling. They are also important food organisms for fish. Depending on their ecology, life history and the presence of predators such as fish, aquatic insect habitat use and occurrence in the river may vary over time. Non-insect taxa are permanent inhabitants of the aquatic environment, having limited powers of dispersal compared to the insects that have an aerial adult stage in their life history. Currently, macroinvertebrates are monitored in numerous lotic systems in the Arctic region and in some cases long term data are available from these monitoring programs.
Dipterous insects are frequently the most abundant invertebrate group in Arctic streams, especially in the high Arctic (e.g., Brittain et al. 2009), where the predominant taxa are often within the family Chironomidae and Simuliidae (e.g., Friberg et al. 2001, Gislason et al. 2001, Lods-Crozet et al. 2001, Milner 1994). In the low Arctic and the sub-Arctic, as well as in the more continental regions at higher latitudes, EPT taxa (Ephemeroptera, Plecoptera, and Trichoptera), as well as other taxa such as gammarids, oligochaetes and molluscs can be abundant (Brittain et al. 2001, 2009, Castella et al. 2001, Milner et al. 2001, 2005). The EPT taxa in particular are an important component of the evaluation of impacts, as
Sampling benthos via kick net, Torngat National Park in northern Laborador, Canada. Photo: Daryl Halliwell

61ARCTIC FRESHWATER BIODIVERSITY MONITORING PLAN
the response of single genera or species to environmental impacts is often documented and can be developed into appropriate metrics (e.g., Fjellheim and Raddum 1990, Hering et al. 2004). The sampling approach must ensure that representatives from all major taxonomic groups are collected from each site, regardless of whether the site is dominated by Diptera or has abundant EPT taxa or other organisms such as gammarids and molluscs. Benthic macroinvertebrate sampling in the Arctic should follow these guidelines:
► Sampling equipment should use a standard mesh size of 500 μm for the collection of macroinvertebrates as this is commonly used in established monitoring programs.
► Sampling frequency should be once during the ice free period, ideally late in this season. This timing of sampling will avoid spring floods and will increase the chances of collecting insects at later instars, at least in the high Arctic. In addition, it is recommended that sampling is completed earlier in the season in the low- and the sub-Arctic to record early emerging taxa of insects.
6.3.2.3 FishRiver systems in the Arctic, sub-Arctic and northern Alpine regions of North America, Europe and Asia are dominated by salmonid fish. Other taxa utilizing northern rivers include smelts, eels, burbot, northern pike and sticklebacks. Many of the diadromous fish populations have historically been harvested outside river mouths, and along northern coasts. Land-locked char and other lake and river resident salmonids without access to the sea are also of major importance to subsistence fisheries by northern people and to recreational fishermen (anglers).
The sampling approach for fish in Arctic rivers must take into account the variability in diversity, age, and size structure within different habitats. The diversity of fish communities of many northern rivers form gradients with allopatric populations occupying the upper headwaters, and more complex multispecies communities found in the lower, coastal waters. In addition, latitudinal gradients of fish diversity are reflected by the very low biodiversity of high-Arctic rivers, which commonly contain only one fish taxon, the Arctic char. Fish abundance in high-Arctic rivers may also be low, with the proportion of larger fish being a critical structural component, indicating that lethal removal has to be highly limited for larger fish. In addition to a thermal gradient and inter-specific interactions, depth and velocity also determine fish diversity and abundance, and different size and age groups may occupy different parts of the river during different seasons. Depending on the availability of financial resources, monitoring of anadromous fish re-entering large rivers in late summer and early autumn would best be conducted through operation of counting fence or traps in river mouths or from subsistence fishing with reliable catch statistics. Upstream sections of smaller
Sockeye salmon, Russia. Photo: Maksimilian/Shutterstock.com

62
streams are best monitored by use of electrofishing, benthic experimental gillnets designed for use in streams, seine-nets, fyke trap nets and counting fences, although not all of these methods have been utilized in Arctic running waters.
Monitoring of fish communities in Arctic rivers should target areas where background information is available and areas where change is expected. In addition, the socio-economic importance of the fish community/populations should be used as a criterion. For example, monitoring data from the northern and southern limits of the Arctic char species complex could be analyzed to detect major shifts in species range and distribution. In addition, demographic and phenological shifts in anadromous fish assemblages may be evident through subsistence fisheries activities in major Arctic rivers. When available, the statistics from commercial harvests of anadromous arctic char, Atlantic and Pacific salmon, brown trout and whitefish from individual rivers or restricted coastal regions should be collected and used, especially when such datasets are geographically unique, long-term and of high quality, such as in northern Labrador in Canada. For long-term monitoring purposes, however, use of non-lethal methods such as counting fences in large rivers, and electrofishing and seining smaller wadeable streams is ideal. For electrofishing and seining, the sampling approach should follow the guidelines:
► Sampling efforts must be standardized by effort or area to allow cross-regional comparisons of data.
► Mesh size of dip nets or seine nets should be small enough to enable the collection of young-of-year fish.
► The timing of sampling should be linked to an understanding of the life history of the target species. In ideal circumstances, sampling should be carried out towards the end of the season when juveniles are of a sufficiently large size to be caught by electrofishing. Subsequent sampling should be carried out at the same time of the year, and under similar flow conditions. All electrofishing should be done in daylight hours. Sampling with seine nets can be done during all hours, but is considered more successful when done during twilight and dark hours.
6.3.2.4 Riparian vegetationRiparian vegetation physically stabilizes banks and acts as a chemical filter for rivers. In Arctic regions below the treeline, shade provided by canopy cover affects water temperature and UV levels in the river, influencing the density and species composition of benthic algae, benthic macroinvertebrates, and fish. A rough estimation of riparian vegetation is currently included as part of the biomonitoring protocol for several regions (e.g., EA 2003, NVV 2006, Reynoldson et al. 2007); however, a more standardized quantification of vegetation and canopy cover is recommended as part of the pan-Arctic monitoring plan. The sampling of riparian vegetation should occur at all sites where fish, benthic macroinvertebrates, and/or benthic algae are sampled, and should follow the general guidelines:
► Riparian vegetation estimates should be made along the entire length of the reach when possible, or at 10 regularly spaced intervals for large river systems;
► For the area immediately bordering the river (0-5 m from river banks), riparian vegetation and ground cover should be classified (taxonomic identification is recommended) and % cover should be estimated;
► A general classification of riparian vegetation and ground cover for the area 0-30 m from the river banks is recommended, with quantification of % cover if time permits.
6.3.3 Abiotic FECs
6.3.3.1 Water temperature regimeWater temperature influences community structure and function, and changes to the water temperature regime can be used as an indicator of climate change and variability. Spot measurements of water temperature and degree days provide baseline data to characterize a site, but continuous data from loggers are essential for quantifying the water temperature regime within a system.

63ARCTIC FRESHWATER BIODIVERSITY MONITORING PLAN
6.3.3.2 Hydrologic and ice regimesThe hydrologic regime is a primary environmental factor that defines the physico-chemical template of Arctic rivers. Thus, hydrological data (discharge or water level) are required to quantify the natural variability in discharge. Where possible, hydrological sample sites should be co-located on streams and rivers having established water discharge monitoring stations and should ideally be monitored during the entire ice-free season. Although ice on/off timing is also an important aspect of the hydrologic regime in Arctic rivers, these data can be estimated from discharge and water temperature data if necessary.
6.3.3.3 Water qualityWater chemistry parameters are often variables controlling the distribution of organisms and can reflect changes in activities within a contributing catchment. Snowmelt or rainfall runoff samples may have significantly different chemical characteristics than base flow samples. The primary objective of the water quality sampling should be to describe the base flow conditions.
Recommended water chemistry parameters to include in a pan-Arctic monitoring program include total dissolved phosphorus (TDP), total unfiltered phosphorus (TP), total nitrogen (TN), nitrate (NO3), dissolved organic carbon (DOC), colored dissolved organic matter (CDOM; often regulates transparency of both visible light and potentially damaging UV radiation), pH, alkalinity, conductivity, major ions (Ca, Mg, Na, K, SO4, Cl), total suspended solids (TSS) and dissolved oxygen.
Sampling for water chemistry parameters should be paired to coincide with biological sampling trips, typically during base flow conditions.
6.3.3.4 Climatic regimeClimate is a major factor of bio-geochemical processes and is therefore pivotal for the understanding of the structure and functioning of the freshwater ecosystems. Climate variables also provide a useful proxy measure for water temperature when those data are not available. If no continuous water temperature data are available, it is possible to use topographic information paired with air temperature data from metrological stations as close to the sampling site as possible.
6.3.3.5 Permafrost and active layerAs previously described for lakes in Section 6.2.3.5, changes in active layer thickness and thawing of permafrost can impact river systems by altering soil storage capacity, flow paths and surface drainage, and can lead to catastrophic drainage and/or enlargement of lakes. Thaw slumping along river margins has been shown to impact water chemistry and water quality (Kokelj et al. 2009). Monitoring should include measurement of permafrost extent and active layer depth carried out by field surveys or remote sensing techniques.

Arctic Biodiversity Trends 201064
7. Data Management Framework

65ARCTIC FRESHWATER BIODIVERSITY MONITORING PLAN
7.1 Data Management Objectives for the CBMP
CAFF’s CBMP data management objectives are focused on the art of the possible—developing data-management systems that facilitate improved access to existing and current biodiversity data and integration of these data among disciplines, while maintaining the data holders’ ownership and control of the data. The CBMP aims to create a publicly accessible, efficient, and transparent platform for collecting and disseminating information on the status and trends in Arctic biodiversity. In essence, the primary objective is to create linkages to data where it already resides. However, in instances where this is too onerous, CBMP aims to provide alternative data management structures to host the data for partners. This objective will be instrumental in achieving the Program’s mandate to report on trends in a timely and compelling manner so as to enable effective policy responses.
It is expected that each country would still be responsible for supporting data management (e.g., QA/QC of data and compilation of existing national datasets) and providing data from their individual monitoring networks (i.e., the data holders). In contrast, the CBMP will focus efforts on building the mechanisms to access and integrate these data across countries and networks, as well as promoting a common, standardized data-management approach among the countries. For this approach to be successful, it is imperative that appropriate national and sub-national datasets are identified (metadatabases) and made available (interoperable linkages) to the CBMP.
Biodiversity data sources and formats vary widely across the Arctic. Thus, it will be challenging to access, aggregate, and depict the immense, widely-distributed, and diverse amount of this freshwater biodiversity data from the many contributors involved in this monitoring. A related challenge is to integrate and correlate this information with other relevant data (e.g., physical, chemical, etc.) to better understand the possible causes driving biodiversity trends at various scales (regional to global). Furthermore, it is critical to deliver this information in effective and flexible reporting formats to facilitate decision-making at a variety of scales from local to international. Meeting these challenges will significantly improve policy and management decisions through better and timelier access to current, accurate, and integrated information on biodiversity trends and their underlying causes at multiple scales.
In some cases, especially for the higher trophic levels, biodiversity data and relevant abiotic data layers are already available and can be integrated into the CBMP’s Data Portal system (www.abds.is). However, the task of aggregating, managing, and integrating data for the lower trophic levels is arduous, and it may be some time before such information can be accessed readily via the CBMP Data Portal. The establishment of national Freshwater Expert Networks (FEN) as defined in Section 10.1, and support from each nation and the CAFF Data Manager will facilitate this process through the adoption of common data and metadata standards and the development of common database structures.
The following sections provide an overview of the data-management framework to be used for managing the outputs of the CBMP-Freshwater Plan. Such a framework is essential to ensure effective, consistent, and long-term management of the data resulting from coordinated monitoring activities.
7.2 Purpose of Data Management
Effective and efficient data management is fundamental to the success of the CBMP and its monitoring plans. A measure of success will be the ability to effectively connect individual partners, networks, and indicator-development efforts into a coordinated data-management effort that facilitates data access and effectively communicates Arctic biodiversity status and trends to a wide range of audiences and stakeholders. Executed correctly, data management can fulfill the following functions:
► Quality Assurance: ensures that the source data sets and indicator development methodologies are optimal and that data integrity is maintained throughout processing;
66
► Consistency: encourages the use of common standards and consistent reference frames and base data sets across parameters and networks;
► Efficiency: reduces duplicate efforts by sharing data, methodologies, analysis, and experience; ► Sustainability: ensures archiving capability and ongoing indicator production; ► Enhanced Communications: produces and distributes information through integrated web-
based services, making indicator methodologies accessible and providing source metadata; ► Improved Linkages: ensures complementarities between various networks and partnerships
and with other related international initiatives, other indicator processes (national, regional, and global), and global assessment processes (e.g., the Global Biodiversity Outlook and Millennium Ecosystem Assessment); and
► Enhanced Credibility: provides transparency with respect to methodologies, data sets, and processes.
Implementation of the Freshwater Plan will rely on participation from many partners. An efficient and user-friendly metadata and data management system will facilitate this collaboration, providing multiple benefits as outlined above. It will offer unique opportunities for monitoring networks to exchange data, draw comparisons between data sets, and correlate biodiversity data with data derived from other networks, using a common, web-based platform. A roadmap for data management, the CBMP Data Management Strategy (Zöckler 2010 unpublished), has been developed to guide the management and access of metadata and data among the CBMP networks.
7.3 Coordinated Data Management and Access: the CBMP Web-based Data Portal (www.abds.is)
While a large amount of freshwater biodiversity information is produced by various networks in diverse formats, much of it is inaccessible, not reported, or in user-unfriendly formats. New, web-based data management tools and new computational techniques have provided an opportunity for innovative approaches for the data management and integration that is critical for a complex, international initiative such as the CBMP.
CAFF’s CBMP has developed a state-of-the-art data portal (www.abds.is), which is a simple, web-based and geo-referenced information network that accesses and displays information on a common platform to encourage data sharing over the Internet. The data portal represents a distributed data management structure where data holders and publishers retain ownership, control, and responsibility for their data. Such a system provides access to immediate and remotely distributed information on the location of Arctic biological resources, population sizes, trends, and other indicators, including relevant abiotic information. As well as providing a point for Arctic biodiversity information, the data portal provides a simple approach for experts to share information through the web and allows for the integration and analysis of multiple data sets.
The CBMP’s data portal requires the establishment of a series of data nodes, with each data node representing a data type or discipline (e.g., caribou, shorebirds). Each data node will be established and supported nationally, most likely through connections to the FEN that will be established in each country (see Chapter 10 for details). The CAFF Data Manager will interact with the national nodes to ensure inter-operability and data aggregation and will provide overall maintenance and management of the resulting pan-Arctic aggregated data. Where appropriate, the CBMP will establish web-based data-entry interface systems (web services) tailored to each data node/discipline, allowing researchers in each country to enter their data on an annual or semi-annual basis (depending on the frequency of data collection) via the Internet. This information will be aggregated, automatically populating a database established at an organization of the national FEN’s choosing. The FEN leads will have overall administrative privileges (password-controlled) to view, maintain, and edit the database. Each expert within a discipline group will have access (via a password) to enter and maintain their own data. Each FEN will be responsible for defining and implementing the analytical approaches to generating the indicators. The CBMP will work

67ARCTIC FRESHWATER BIODIVERSITY MONITORING PLAN
with each FEN to establish analytical outputs, via the Data Portal, tailor-made for the data collected and housed at the data node. Priority indicator data will be managed via the web portal whereas other dataset compilations can be directly archived at the CAFF Secretariat or through an agreement with an existing data center.
Users (e.g., scientists, decision-makers, and the public) will have password-controlled access to the data outputs via the CBMP Data Portal. Users will be able to perform set analyses (defined by each FEN) on the Portal, which will immediately access the most current data at the data node (using XML Internet language) and display the output of the queried analysis. Much of the initial work in the implementation phase of the CBMP-Freshwater Plan will involve aggregating existing data sets to create pan-Arctic data layers. The life cycle of the data, from collection to presentation, is shown in Fig. 13.
The CBMP Data Portal will be flexible, password driven, and customizable to serve a diversity of clients (Fig. 14). The general public will have access to broad indicators and general information on Arctic biodiversity data trends. National and sub-national governments as well as the national FENs will have the opportunity to customize the Portal for their own purposes (e.g., display only the geographic scope of relevance to them). Both governments and FENs will have the authority to choose which data layers are publicly available. In addition, they will have a password-controlled domain to allow the inclusion of other data layers that are not publically accessible (e.g., unpublished data or draft reports).
This model of operation allows for user involvement at a variety of stages and can accommodate a large number of participants. The aim is to facilitate complete access to the collective knowledge, analysis, and presentation tools available from the many participants and stakeholders both within and outside the Arctic community.
The web-based portal will serve two purposes for the CBMP. First, it will provide access to geo-referenced information from within partner networks, as well as providing a common platform with multiple entry points for controlled data access, integration, harmonization, and delivery. Secondly, it will enable a wide range of user groups to explore trends, synthesize data, and produce reports with relative ease. The web-based data portal will generate indicators representing status and trend analyses, which in turn will be reported by the CBMP through a variety of means. These could include turnkey web-based reports and status and trends reports at multi-year intervals.
Figure 13. A simplified overview of the steps involved in accessing, integrating, analyzing, and presenting biodiversity information via an interoperable web-based data portal and an indication of the responsibilities at each step.
Collection Aggregation Analysis and Synthesis
Presentation
Monitoring Networks and Nations
Freshwater Expert Networks
Freshwater Expert Networks and Portal
Data Portal

68
Development of this distributed system will necessitate the adoption and use of existing and widely accepted standards for data storage and query protocols, along with high-quality and standardized metadata and web servers (spatial and tabular). The metadata will be housed on an existing meta-database system (Polar Data Catalogue) allowing for simple and efficient access to a large and constantly updated, web-based, searchable, geo-referenced metadata system. The Arctic freshwater monitoring identified as core to the implementation of the Freshwater Plan will be input into this meta-database.
Geo-referencing will be critical to the successful integration of disparate data sets. Resolving the different spatial recording schemes used between the various data nodes and data holders—as well as the ranges of data volumes and bandwidth—will be challenges to overcome. Techniques will be devised to convert data into a standard format for integration. These technical issues will be addressed during the implementation phase.
7.4 Data Storage, Policy and Standards
A decentralized data storage system is proposed for the CBMP web portal because it offers a solution to concerns over data ownership and copyright. Through this system, the storage, responsibility for and ownership of the data will always remain with the data collector, publisher and/or holder. Although the data are decentralized, access to and depiction of the data is unified, allowing for multiple integrations for the user.
CAFF’s CBMP encourages data providers to comply with the Conservation Commons and IPY Data Policy on the delivery of free biodiversity data to the public (see Appendix E for details on both these policies). The web portal will allow for organized and restricted access to data where necessary. Compliance with accepted data policies and provision of data to the CBMP Data Portal system will result in password access being provided to the data layers found on the Data Portal. This incentive-driven approach should encourage scientists and others to contribute their data to the Portal as it will result in their access to other data layers relevant to them. Depending on the project and publication circumstances, the CBMP suggests a delay of two to four years before information is released to the public, according to data type and project history.
In order for the various networks involved in implementing the CBMP-Freshwater Plan to collaborate, input, and share data and metadata, common data and metadata standards should be followed. CAFF’s CBMP has chosen the Federal Geographic Data Committee (FGDC) standard to ensure compatibility with many global and regional programs that have adopted this standard. Freely available software allows users to apply these metadata conveniently and post them online with the clearinghouses (e.g., Polar Data Catalogue). Because data that lack metadata can be virtually unusable, both are crucial requirements and thus requested by funding agencies and the data initiatives cited here.
Figure 14. Illustration depicting the Data Portal concept and how clients can utilize the system to meet their specific needs.

8. Data, Samples, and Information Analysis

70
8.1 Introduction
This chapter provides an overview of the analytical approach proposed for the assessment of data and other information collected through the Freshwater Plan. Each assessment will have its own terms of reference that identifies specific analysis goals, objectives, and approaches in more detail. In general, the analysis will focus on the FECs and indicators identified in Chapter 5, as these biotic variables were determined to be important to freshwater ecosystem structure and function. Biomonitoring data will be analyzed to evaluate spatial and temporal trends in Arctic freshwater biodiversity. In particular, the analysis will address the questions described in section 1.4 of the FreshwaterPlan. Analysis of biomonitoring data will also enable testing of the impact hypotheses outlined in Chapter 5 and lead to recommendations for managers and decision makers. These assessments may be completed at multiple spatial scales to address questions and test impact hypotheses at national, regional (e.g., Nordic), and pan-Arctic levels. Moreover, data collection will include historical and contemporary data in addition to future data collection to allow temporal analysis of biodiversity trends.
The Freshwater Plan assessments will be divided into two phases. The first (start-up phase) will rely on existing monitoring data from Arctic freshwater systems, and will be used to establish baseline conditions for inclusion in an initial State of Arctic Freshwater Biodiversity report in 2016. Data collection will be the responsibility of each member country. Where possible, sites will need to be classified as reference or impacted prior to analysis. Contemporary and historical biotic and abiotic data will be evaluated to determine the current status of the priority FECs and indicators and assess historical trends. These analyses will help answer questions about the state of Arctic freshwater biodiversity, and will establish the baseline for future assessments of change in these systems. Data quality assurance and quality control through statistical data screening tools will be an essential part of the data collection process in the initial analysis stage, and will be conducted by each member country.
The second phase of analysis will involve the future assessment of change in Arctic freshwaters through the evaluation of coordinated biomonitoring data from the FreshwaterPlan. This analysis of changing status and trends will be summarized in subsequent State of Arctic Freshwater Biodiversity reports that will be completed on a regular basis (see Chapter 9 for more details on reporting). In this stage, the collection of data and analysis of status and trends will be completed by the national FENs (see Chapter 10 for more details on the design of these networks). However, analytical procedures and approaches will be designed and recommended by the CBMP FSG to maintain continuity and data quality among the networks.
8.2 Basis for Analysis
8.2.1 Start-up phase (2013 -2016)
The start-up phase of analysis will be used to gather metadata and perform an initial assessment of biodiversity in Arctic freshwater systems. The outcome of this phase will be the 2016 State of Arctic Freshwater Biodiversity report. Data for this assessment will include both contemporary monitoring data and historical data collected from each Arctic nation. Where possible, temporal assessments may be completed by comparing historical and contemporary data, and by relating temporal changes to the impact hypotheses. It is emphasized that the start-up phase will include data that would not be expected to be collected in on-going monitoring programs, such as paleolimnological or historical data.
Determination of the current status of freshwater diversity in the Arctic, whether biodiversity is changing, or if regional boundaries (e.g., sub-Arctic) are shifting will probably best be addressed using a stratified sampling design combined with time-series analysis. It is emphasized that these assessments will require a clear design for selecting sites along gradients where change is expected. Recent approaches to metacommunity dynamics will also need to be incorporated into these analyses (Logue et al. 2011). By including reference and impact sites, future assessments will be able to associate

71ARCTIC FRESHWATER BIODIVERSITY MONITORING PLAN
changes in biodiversity with environmental and anthropogenic stressors. Assessment of whether biodiversity status and trends can be measured by simple variables and indicators will require specific assessments undertaken by national FENs and summarized by the CBMP Freshwater Steering Group.
8.2.1.1 Contemporary status (1945 to present)For the purpose of the Freshwater Plan, contemporary status is defined as the conditions from 1945 to the present (i.e., post-Second World War). In the start-up phase, existing data from this time period will be used to establish the spatial extent of data coverage and evaluate the status of FECs through the analysis of indicators. Comparison with historical data will provide an assessment of status changes and trends that have occurred leading to the present day. Data from the contemporary period will also be used as the baseline with which future monitoring data will be compared to evaluate changing status and trends in the second phase of analysis.
Collection of metadata will reveal the full extent of the spatial and temporal gaps in contemporary monitoring data that were indicated by Culp et al. (2011b). Specifically, in reference to the monitoring site selection criteria in Chapter 2, the metadata will indicate:
► The FECs for which there are monitoring data; ► The number of sites for which there are sufficient data for analysis; ► Geographical coverage of the sites, including the number of countries for which data exist in
each Arctic subregion; ► Types of sites (e.g., large lakes, small ponds, large rivers, headwater streams, etc.); ► Temporal coverage (including where there are repeated measurements in time, and the
coverage of those data).
8.2.1.2 Historical conditions
From 1850 to 1945 (post-Industrial)
Historical metadata from the post-Industrial period (1850-1945) will be less widely available than contemporary data, and therefore will not allow temporal analysis of all FECs and sampling sites. In addition, these data may be semi-quantitative in nature, and may be largely observational for some regions, making statistical analysis of trends difficult. However, these data can still provide a useful, albeit somewhat limited, picture of the historical status of biodiversity in Arctic freshwater systems. Collection of metadata for this time period will reveal the extent to which historical comparison with contemporary data are possible. In particular, these data will indicate:
► The parameters for which there are monitoring data, potentially including biodiversity, food web structure, temperature/inorganic nutrients, and ice/snow;
► The number of sites and geographical coverage of sites for which there are sufficient data for analysis;
► Temporal coverage (including where there are repeated measurements in time, and the coverage of those data).
Paleolimnological Records (pre-Industrial; ~10000 yrs back in time)
Historical metadata from paleolimnological records will be used to evaluate pre-Industrial historical trends. Because of the nature of paleolimnological analysis, records will only be available for a very limited selection of the FECs. In addition, as paleolimnological studies are most often a part of research programs rather than coordinated monitoring programs, data may not be available across the entire spatial range of interest. However, paleolimnological data allow a more extensive temporal analysis than post-Industrial or contemporary data, and can provide a strong assessment of long-term temporal trends for those sites and FECs for which data exist.

72
Metadata collected from paleolimnological records will indicate:
► The parameters for which there are data, potentially including biodiversity, community structure (diatoms and chironomids, fish scales), temperature, pH, TP, and organic carbon;
► The number of sites and geographical coverage of sites for which there are sufficient data for analysis.
8.2.2 Second phase (Beyond 2016)
The second phase of analysis will use data from future monitoring activities to complete periodic status assessments of Arctic freshwater systems.
8.2.2.1 Future conditions (Present to 100 years from now)
Analysis of future conditions will make use of data collected through the coordinated monitoring activities recommended by the Freshwater Plan. Following the monitoring protocols set out in the plan, data for each FEC should be available over an extensive spatial area, building on the monitoring sites that were used to establish contemporary status. Coordinated monitoring activities will allow for a more detailed, specific, and continuous analysis of status and trends in biodiversity. Data collected through future monitoring activities will be compared with the contemporary status to evaluate temporal trends and identify any changes to indicator status. This assessment of trends will be further used to test the impact hypotheses and make recommendations to managers and decision makers.
8.3 Analytical Approach
Assessments will use contemporary and historical data to detect temporal and spatial patterns in Arctic freshwater biodiversity. Where possible, this analysis will be supplemented by associations with local and traditional knowledge, although the CBMP-FSG will need to develop an approach for including such information in status and trend assessments. In addition, the assessments will address the impact hypotheses (Chapter 5) that link changes in biodiversity with human activities and environmental change.
Assessment of biological and environmental data will utilize the following analysis tools:
► Biomonitoring indicators and metrics, including indicator species and biodiversity metrics (see Chapter 5 for a preliminary list);
► Estimates of biological change through proxy measurements such as changes in temperature and hydrological regimes and land use;
► Multivariate analysis of community structure and associated environmental gradients; ► Time-series analysis of biological and physico-chemical trends.
The spatial and temporal analysis of trends in Arctic freshwaters will be reviewed and refined during the analysis process to ensure that the most appropriate techniques and parameters have been employed. In particular, power analysis will be used to determine whether additional data are required to detect biologically significant trends.

Arctic Biodiversity Trends 201073
9. Reporting
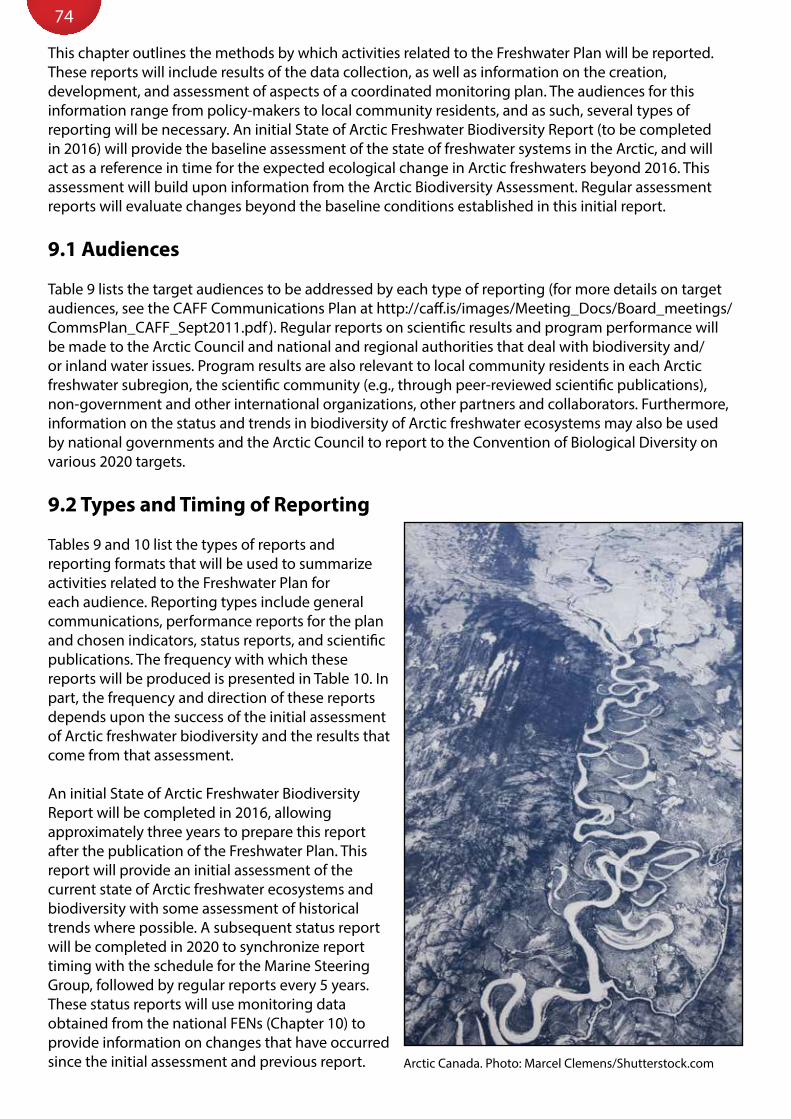
74
This chapter outlines the methods by which activities related to the Freshwater Plan will be reported. These reports will include results of the data collection, as well as information on the creation, development, and assessment of aspects of a coordinated monitoring plan. The audiences for this information range from policy-makers to local community residents, and as such, several types of reporting will be necessary. An initial State of Arctic Freshwater Biodiversity Report (to be completed in 2016) will provide the baseline assessment of the state of freshwater systems in the Arctic, and will act as a reference in time for the expected ecological change in Arctic freshwaters beyond 2016. This assessment will build upon information from the Arctic Biodiversity Assessment. Regular assessment reports will evaluate changes beyond the baseline conditions established in this initial report.
9.1 Audiences
Table 9 lists the target audiences to be addressed by each type of reporting (for more details on target audiences, see the CAFF Communications Plan at http://caff.is/images/Meeting_Docs/Board_meetings/CommsPlan_CAFF_Sept2011.pdf). Regular reports on scientific results and program performance will be made to the Arctic Council and national and regional authorities that deal with biodiversity and/or inland water issues. Program results are also relevant to local community residents in each Arctic freshwater subregion, the scientific community (e.g., through peer-reviewed scientific publications), non-government and other international organizations, other partners and collaborators. Furthermore, information on the status and trends in biodiversity of Arctic freshwater ecosystems may also be used by national governments and the Arctic Council to report to the Convention of Biological Diversity on various 2020 targets.
9.2 Types and Timing of Reporting
Tables 9 and 10 list the types of reports and reporting formats that will be used to summarize activities related to the Freshwater Plan for each audience. Reporting types include general communications, performance reports for the plan and chosen indicators, status reports, and scientific publications. The frequency with which these reports will be produced is presented in Table 10. In part, the frequency and direction of these reports depends upon the success of the initial assessment of Arctic freshwater biodiversity and the results that come from that assessment.
An initial State of Arctic Freshwater Biodiversity Report will be completed in 2016, allowing approximately three years to prepare this report after the publication of the Freshwater Plan. This report will provide an initial assessment of the current state of Arctic freshwater ecosystems and biodiversity with some assessment of historical trends where possible. A subsequent status report will be completed in 2020 to synchronize report timing with the schedule for the Marine Steering Group, followed by regular reports every 5 years. These status reports will use monitoring data obtained from the national FENs (Chapter 10) to provide information on changes that have occurred since the initial assessment and previous report. Arctic Canada. Photo: Marcel Clemens/Shutterstock.com

75ARCTIC FRESHWATER BIODIVERSITY MONITORING PLAN
Tabl
e 9.
Ove
rvie
w o
f the
type
of r
epor
ts th
at w
ill b
e as
soci
ated
with
the
Fres
hwat
er P
lan
and
the
targ
et a
udie
nce
for e
ach
repo
rt ty
pe.
Prim
ary
Targ
et A
udie
nce
Type
of R
epor
t
Stat
e of
Arc
tic
Fres
hwat
er
Biod
iver
sity
Rep
ort,
incl
udin
g st
atus
re
port
s
Stat
us o
f se
lect
ed
indi
cato
rs
Revi
ew o
f ind
icat
or
perf
orm
ance
, sel
ecti
on
of a
ddit
iona
l par
amet
ers,
ne
w te
chni
ques
, sam
plin
g ap
proa
ches
, dat
a m
anag
emen
t app
roac
h,
anal
ysis
and
repo
rtin
g
Scie
ntifi
c ou
tput
as
scie
ntifi
c pu
blic
atio
ns,
eith
er b
y di
scip
line
or m
ulti
disc
iplin
ary,
by
Arc
tic
Fres
hwat
er
subr
egio
n an
d ac
ross
the
Arc
tic
Perf
orm
ance
re
port
s an
d w
ork
plan
s
Vari
ous
sum
mar
ies
and
othe
r co
mm
unic
atio
ns
mat
eria
l
Arc
tic C
ounc
ilX
XX
X
Nat
iona
l and
Reg
iona
l Aut
horit
ies
XX
XX
Loca
l Com
mun
ities
XX
X
Scie
ntifi
c Co
mm
unity
XX
Oth
er In
tern
atio
nal O
rgan
izat
ions
XX
X
Part
ners
and
Col
labo
rato
rsX
XX
XX
NG
Os
and
the
publ
icX
X X
Tabl
e 10
. The
tim
ing
and
freq
uenc
y w
ith w
hich
eac
h ty
pe o
f rep
ort w
ill b
e pr
oduc
ed.
Type
of R
epor
ting
Tim
ing/
Freq
uenc
y
Perf
orm
ance
repo
rts
and
wor
k pl
ans
Ann
ually
, sta
rtin
g w
ith a
wor
k pl
an in
201
3
Scie
ntifi
c ou
tput
as
scie
ntifi
c pu
blic
atio
ns, e
ither
by
disc
iplin
e or
mul
tidis
cipl
inar
y, b
y A
rctic
Fre
shw
ater
sub
regi
on a
nd a
cros
s th
e A
rctic
Ong
oing
beg
inni
ng in
201
3
Vario
us s
umm
arie
s an
d ot
her c
omm
unic
atio
ns m
ater
ial
Ong
oing
, sta
rtin
g in
201
4
Stat
us o
f sel
ecte
d in
dica
tors
Bi-a
nnua
lly, s
tart
ing
in 2
016
Stat
e of
Arc
tic F
resh
wat
er B
iodi
vers
ity R
epor
t, in
clud
ing
stat
us re
port
s20
16, 2
020,
and
sub
sequ
ently
eve
ry 5
yea
rs
Revi
ew o
f ind
icat
or p
erfo
rman
ce, s
elec
tion
of a
dditi
onal
par
amet
ers,
new
tech
niqu
es,
sam
plin
g ap
proa
ches
, dat
a m
anag
emen
t app
roac
h, a
naly
sis
and
repo
rtin
g20
16, 2
020,
and
sub
sequ
ently
eve
ry 5
yea
rs

76
9.3 Reporting Results
9.3.1 State of Arctic Freshwater Biodiversity Report
The initial State of Arctic Freshwater Biodiversity Report is scheduled to be produced in 2016. The objectives and terms of reference for the initial report will be developed during 2013-2015. It is anticipated that the document may include several of the points listed below:
1. In addition to the criteria used to select freshwater ecosystems for monitoring assessment (Section 2.1), further characterization of systems could follow a typology such as that used in the EU Water Framework Directive (European Parliament and Council of the European Union 2000). This typology, which divides lakes and rivers by size, depth (lakes), and the alkalinity of waters, could be supplemented by information on specific Arctic water body types (e.g., thermokarst systems, permanently frozen lakes). This approach could aid spatial comparisons of freshwater biodiversity but may be limited to specific regional application given the lack of this type of water body data for many regions across the Arctic;
2. The assessment will include statements on the indicator status of as many biotic and abiotic FECs as is feasible. An outcome of this exercise will be the ability to update the focal areas for sampling identified in Chapter 2. This revised list of focal monitoring areas may allow the identification of habitats or regions with high freshwater biodiversity. These areas of rich biodiversity could help identify habitat types of particular conservation value;
3. Where possible, reference conditions should be defined within and among the different freshwater subregions (i.e., high, low, and sub-Arctic). This aspect of the assessment will likely be limited to regional case studies given the limited amounts of data upon which the 2016 report will be based; and
4. An effort will be made to evaluate temporal trends in the status of the biotic and abiotic FECs for the limited locations where there is sufficient historical data to undertake this assessment.
The results will be analyzed statistically to detect changes in the biodiversity and the physical and chemical status of Arctic freshwaters. The report will also provide an analysis of the variability of the various FECs and the statistical power to detect trends in the dataset. Results will be presented as distribution maps, and graphs showing spatial and temporal trends for FECs and monitoring areas. Additional reports are scheduled for 2020 and subsequently every 5 years, and will reevaluate the status of biotic and abiotic FECs by analyzing any changes in indicators from the contemporary status established in the previous reports.
9.3.2 Status of indicators
The status of selected indicators for biotic FECs (see Chapter 5) will be updated bi-annually and published on the CBMP’s Data Portal (see Chapter 7).
9.3.3 Program review
Internal review and independent external review will be used to evaluate and adjust the monitoring program periodically. Internal review will occur in 2016, 2020 and subsequently every 5 years, and will involve the evaluation of chosen parameters and indicators, sampling methods, data management, and analysis and reporting. The results of this review will be used to update the Freshwater Plan and make any necessary adjustments to the outlined methodology. Every 10 years beginning in 2020, there will be an additional independent external review of the program. The review process, although intended to assess the performance of the program and identify any shortcomings, should be conservative to provide statistically sound long-term measurements, and would ideally add to rather than remove aspects of the program.

77ARCTIC FRESHWATER BIODIVERSITY MONITORING PLAN
9.3.4 Scientific publications
Scientific publications will be used to share the results of the status reports with the scientific community. Additional scientific publications are also expected to follow from the status assessments, and may be specific to a particular FEC or sampling region, or may be multidisciplinary and/or multiregional in scope. These articles are intended to address the links between changes to the biotic and abiotic FECs and possible driving mechanisms at a broader or more detailed scale than may be possible with the status reports.
9.3.5 Performance reports and work plans
Performance reports and work plans will be submitted to the Arctic Council through CAFF-CBMP on an annual basis. The performance reports will detail the steps that have been made to implement the plan in the previous year, and will outline the progress in managing the program. The work plans will outline the work that is anticipated to be completed during the following year, the budget for that work, and the deliverables. This process will begin with the submission of a work plan in 2013 following the publication of the Freshwater Plan.
9.3.6 Summaries and other communications material
Summaries and non-technical communication material will be prepared for local community residents, partners and collaborators, and non-scientific international organizations to make the results of the status assessments and updates accessible to the general public. The CBMP will also use its existing communications network and media (e.g., newsletter, media releases, websites, etc.) to provide regular information on progress and results to these audiences.
Red Phalarope, Lena Delta, Russia. Photo: Peter Prokosch

10. Freshwater Implementation and Administration

79ARCTIC FRESHWATER BIODIVERSITY MONITORING PLAN
Implementation of the Freshwater Plan requires a governing structure and process for program review that will ensure this monitoring effort is relatively simple, cost-effective and addresses the questions posed in Section 1.4. In addition to international bodies of the Arctic Council, other groups involved in the implementation of the Freshwater Plan will include national, sub-national and local jurisdictions across the Arctic that already undertake biodiversity monitoring. The implementation and review structure described below incorporates the CBMP’s network-of-networks approach and aims to provide value-added information on the state of Arctic freshwaters that is useful for national and other reporting needs (Fig. 1). Ultimately, it will be the responsibility of each Arctic country to implement the Freshwater Plan in order for the program to succeed.
10.1 Governing Structure
CAFF will establish a CBMP Freshwater Steering Group (CBMP-FSG) to implement, coordinate and track progress of work undertaken in response to the Freshwater Plan, and to oversee the activity of the eight national Freshwater Expert Networks (FENs) (Fig. 15; Appendix A). Composition of the CBMP-FSG will include one representative and an alternate from each Arctic nation (i.e., Canada, Denmark-Greenland-Faroes, Finland, Iceland, Norway, Russia, Sweden, and the United States of America). The CBMP-FSG will be directed by co-leads drawn from these Arctic nation representatives. Permanent Participants may participate depending on their capacity and interest, and may appoint two members to the CBMP-FSG. Other relevant Arctic Council working groups (e.g., AMAP) may appoint one member each to the CBMP-FSG.
Each national CBMP-FSG representative will be responsible for (1) facilitating implementation of the monitoring plan within their own nation; (2) building strong and ongoing connections with the relevant agencies, institutes and experts within their countries by coordinating and providing direction to their national FEN members; (3) gathering information and reporting on the implementation status of the plan within their respective nation to the CBMP-FSG; and (4) contributing to reporting to the CBMP and CAFF. As a group, the CBMP-FSG will be responsible for setting the overall course of the evolving monitoring program, providing ongoing program oversight and adjusting the implementation approach as necessary. The CBMP-FSG will be responsible for reporting on the status of the monitoring plan to CAFF and the CBMP Office. A number of value-added services will be provided to the CBMP-FSG by the CBMP Office. These services include the establishment of a common web portal and web-based data nodes, communication products and other reporting tools (Gill et al. 2011; Chapter 7).
It is the responsibility of each country representative to the CBMP-FSG to identify national experts to be included in their FEN. Each national FEN will include the expertise required to assess the status and trends of the FECs and indicators identified in Chapter 5. In addition, they will be responsible for (1) identifying, aggregating, analyzing, and reporting on existing datasets to contribute to indicators and assessments; (2) reporting on the implementation status of the monitoring program to the CBMP-FSG; and (3) suggesting adjustments to the parameters, indicators and sampling schemes if needed. Each member country will benefit from the formation of its FEN as network activities will contribute to domestic reporting mandates and needs. The CBMP-FSG may facilitate coordination and cooperation among the various FENs as needed.
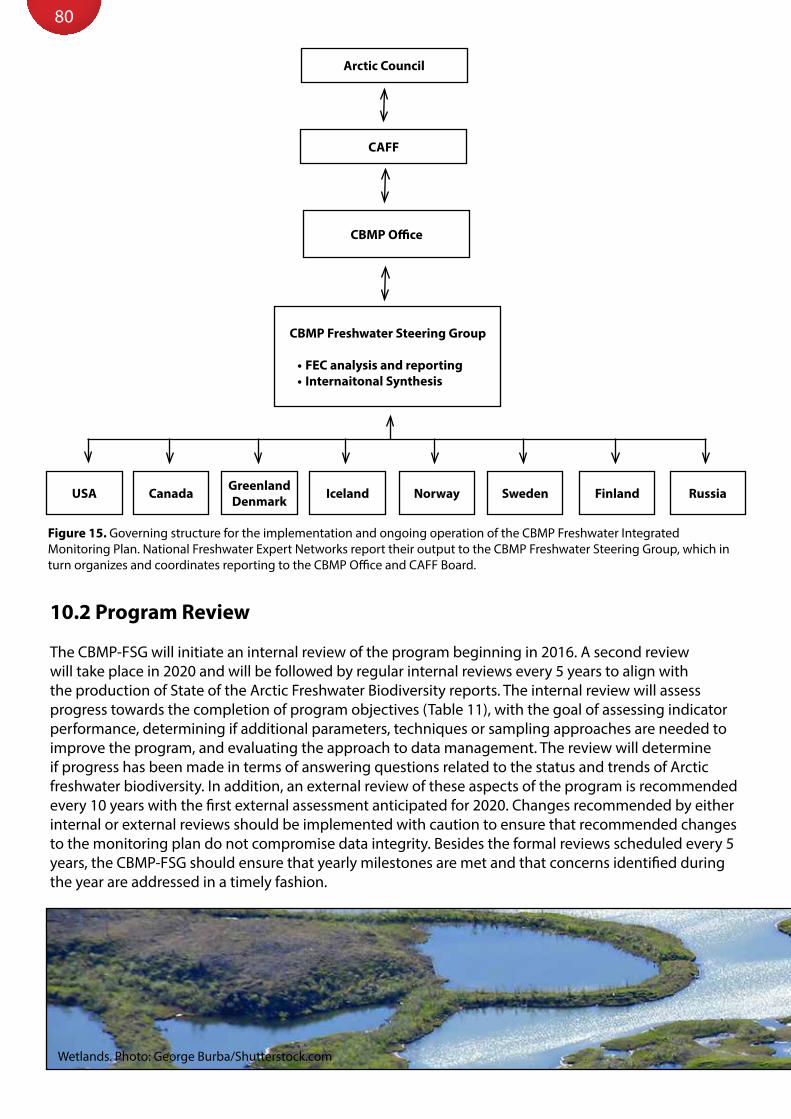
80
Figure 15. Governing structure for the implementation and ongoing operation of the CBMP Freshwater Integrated Monitoring Plan. National Freshwater Expert Networks report their output to the CBMP Freshwater Steering Group, which in turn organizes and coordinates reporting to the CBMP Office and CAFF Board.
Arctic Council
CAFF
CBMP Office
CBMP Freshwater Steering Group
•FEC analysis and reporting•Internaitonal Synthesis
USA RussiaFinlandSwedenNorwayIcelandGreenlandDenmarkCanada
10.2 Program Review
The CBMP-FSG will initiate an internal review of the program beginning in 2016. A second review will take place in 2020 and will be followed by regular internal reviews every 5 years to align with the production of State of the Arctic Freshwater Biodiversity reports. The internal review will assess progress towards the completion of program objectives (Table 11), with the goal of assessing indicator performance, determining if additional parameters, techniques or sampling approaches are needed to improve the program, and evaluating the approach to data management. The review will determine if progress has been made in terms of answering questions related to the status and trends of Arctic freshwater biodiversity. In addition, an external review of these aspects of the program is recommended every 10 years with the first external assessment anticipated for 2020. Changes recommended by either internal or external reviews should be implemented with caution to ensure that recommended changes to the monitoring plan do not compromise data integrity. Besides the formal reviews scheduled every 5 years, the CBMP-FSG should ensure that yearly milestones are met and that concerns identified during the year are addressed in a timely fashion.
Wetlands. Photo: George Burba/Shutterstock.com

81ARCTIC FRESHWATER BIODIVERSITY MONITORING PLAN
Table 11. Program objectives and performance measures of the Freshwater Plan to be assessed every 6 years beginning in 2016.
Objective Performance Measure(s)
Identify an essential set of indicators for freshwater ecosystems that are suited for measurement and implementation on a circumpolar level.
Common indicators in use in three or more countries by 2016.
Identify abiotic parameters that are relevant to freshwater biodiversity and require ongoing monitoring.
Relevant abiotic networks identified, and linkages made between common biotic indicators and abiotic data (2013-2016).
Identify standardized protocols and optimal sampling strategies for Freshwater Plan monitoring.
Arctic-based monitoring networks adopt sampling approaches (2013-2016).
Create a strategy for the use and organization of existing research and operational monitoring capacity and information (scientific, community-based, and TEK).
Identify monitoring groups and accumulate available data for use in reports on the state of Arctic freshwaters (2013-2016).
Establish and promote effective communication and linkages among Arctic freshwater researchers and monitoring groups.
Utilization of CBMP web portal and web-based data nodes for CBMP-FSG reporting and communication outputs (2013-2016).
Address current gaps in monitoring coverage (elemental, spatial and temporal).
Identification of data gaps and solutions to broaden monitoring coverage (2016).
Respond to identified science questions and user needs. Indicators developed and reported in state of Arctic freshwaters report (2016).
10.3 Implementation Schedule and Budget
Table 12 lists the major milestones involved with the implementation of the Freshwater Plan. The CBMP-FSG should use these as guidelines for outlining their annual work plans. These milestones include the initial publishing of the plan, the activation of the governing structure and establishment of the data portal, the collection and analysis of existing monitoring data and establishment of coordinated monitoring, production of reports, and program review. A number of activities and deliverables are associated with each milestone, and the start year for each activity or first year in which the deliverable will be produced is indicated to provide a timeline for this implementation plan.
The budget for the implementation of the Freshwater Plan reflects the estimated costs for assessing status and trends in Arctic freshwater biodiversity (Table 13). These estimates do not include current and planned expenditures by each country to conduct their own Arctic freshwater biodiversity monitoring. Similarly, costs for coordinating and holding in-country meetings with FEN members have not been included because of the large differences in cost anticipated among the countries. For an annual average investment of $35-65K USD per country in 2013 and $65-125K USD per country per year in 2014-2016, the value of current national monitoring efforts can be increased through a more coordinated, pan-Arctic approach. The budget for 2017 and beyond will be developed at a later date when activities and deliverables for ongoing assessment have been established. Even with an improved, harmonized approach, critical gaps in our monitoring coverage will still remain and new resources will be needed to address these gaps. Also, it is critical to acknowledge the ongoing need to sustain the monitoring activities that the Freshwater Plan aims to harmonize.
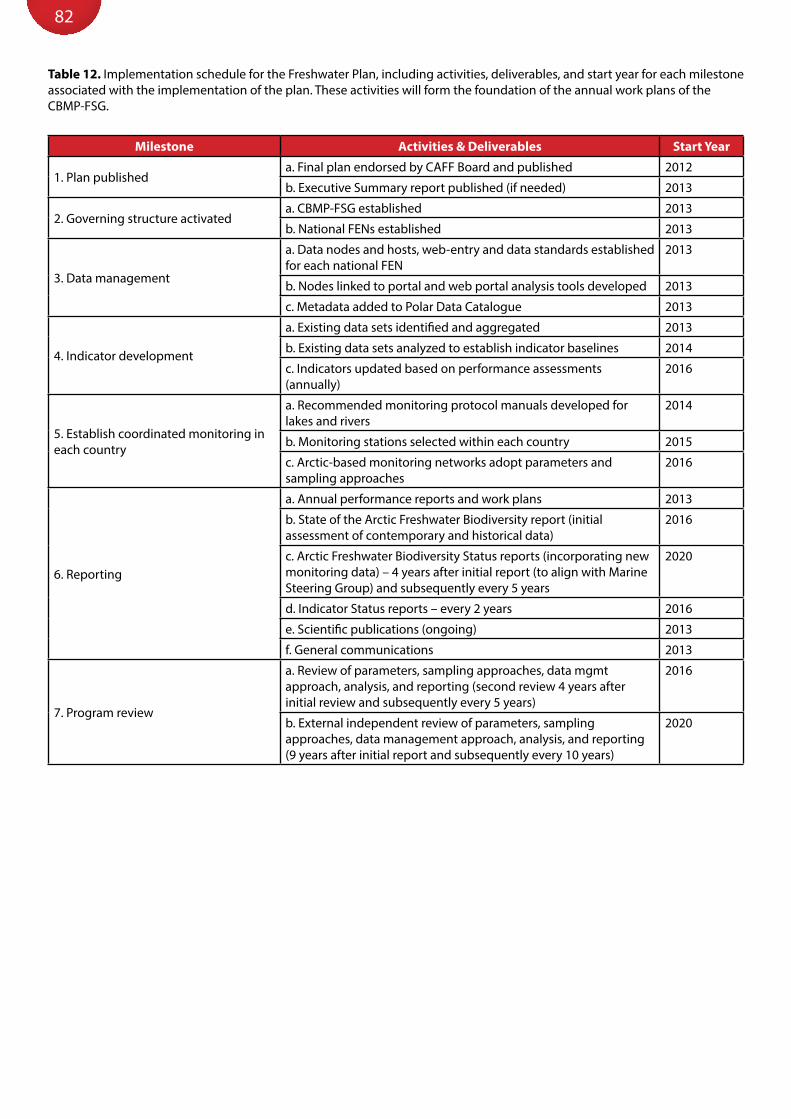
82
Table 12. Implementation schedule for the Freshwater Plan, including activities, deliverables, and start year for each milestone associated with the implementation of the plan. These activities will form the foundation of the annual work plans of the CBMP-FSG.
Milestone Activities & Deliverables Start Year
1. Plan publisheda. Final plan endorsed by CAFF Board and published 2012
b. Executive Summary report published (if needed) 2013
2. Governing structure activateda. CBMP-FSG established 2013
b. National FENs established 2013
3. Data management
a. Data nodes and hosts, web-entry and data standards established for each national FEN
2013
b. Nodes linked to portal and web portal analysis tools developed 2013
c. Metadata added to Polar Data Catalogue 2013
4. Indicator development
a. Existing data sets identified and aggregated 2013
b. Existing data sets analyzed to establish indicator baselines 2014
c. Indicators updated based on performance assessments (annually)
2016
5. Establish coordinated monitoring in each country
a. Recommended monitoring protocol manuals developed for lakes and rivers
2014
b. Monitoring stations selected within each country 2015
c. Arctic-based monitoring networks adopt parameters and sampling approaches
2016
6. Reporting
a. Annual performance reports and work plans 2013
b. State of the Arctic Freshwater Biodiversity report (initial assessment of contemporary and historical data)
2016
c. Arctic Freshwater Biodiversity Status reports (incorporating new monitoring data) – 4 years after initial report (to align with Marine Steering Group) and subsequently every 5 years
2020
d. Indicator Status reports – every 2 years 2016
e. Scientific publications (ongoing) 2013
f. General communications 2013
7. Program review
a. Review of parameters, sampling approaches, data mgmt approach, analysis, and reporting (second review 4 years after initial review and subsequently every 5 years)
2016
b. External independent review of parameters, sampling approaches, data management approach, analysis, and reporting (9 years after initial report and subsequently every 10 years)
2020

83ARCTIC FRESHWATER BIODIVERSITY MONITORING PLAN
Tabl
e 13
. The
ope
ratin
g bu
dget
for t
he im
plem
enta
tion
of th
e Fr
eshw
ater
Pla
n, o
utlin
ing
estim
ated
cos
ts fo
r the
act
iviti
es a
nd d
eliv
erab
les,
and
the
resp
onsi
bilit
y fo
r eac
h co
st. N
ote:
th
e co
sts
outli
ned
in th
e ta
ble
are
focu
sed
on n
ew e
ffort
s to
har
mon
ize
fres
hwat
er b
iodi
vers
ity m
onito
ring,
dat
a m
anag
emen
t and
repo
rtin
g. T
hey
do n
ot re
flect
the
actu
al o
ngoi
ng
mon
itorin
g co
sts.
Mile
ston
eA
ctiv
itie
s &
Del
iver
able
sTo
tal C
ost (
USD
)Co
st D
etai
lsRe
spon
sibi
lity
1. G
over
ning
and
op
erat
iona
l str
uctu
re
activ
ated
a. 2
013
Inau
gura
l mee
ting
of C
BMP-
FSG
b. A
nnua
l mee
ting
of C
BMP-
FSG
50K
(10
peop
le a
t 5K
each
) plu
s 5K
ven
ue c
osts
per
yea
rM
eetin
g co
sts
(tra
vel s
uppo
rt fo
r CBM
P-FS
G m
embe
rs a
nd v
enue
cos
ts) a
nd
conf
eren
ce c
all c
osts
Arc
tic n
atio
ns fo
r tr
avel
sup
port
for
thei
r mem
bers
. Lea
d FS
G c
ount
ry fo
r ve
nue
cost
s.
2. D
ata
man
agem
ent
stru
ctur
es e
stab
lishe
d
a. D
ata
node
s an
d ho
sts,
web
-ent
ry in
terf
aces
, and
da
ta s
tand
ards
est
ablis
hed
2013
: 30K
(dat
a no
de
esta
blis
hmen
t)20
14 o
nwar
ds: 1
0K p
er y
ear (
data
no
de m
anag
emen
t)
Web
-ent
ry in
terf
ace
and
web
-bas
ed
data
base
s an
d no
des
and
data
ent
ry
man
uals
est
ablis
hed
CAFF
CBM
P O
ffice
b. D
ata
node
s lin
ked
to w
eb p
orta
l and
ana
lytic
al
tool
s de
velo
ped
2013
onw
ards
: 20K
(web
por
tal
mai
nten
ance
) D
ata
Port
al li
nked
to d
ata
node
s vi
a XM
L,
and
cann
ed a
naly
sis
tool
s de
velo
ped
CAFF
CBM
P O
ffice
c. M
etad
ata
adde
d to
Pol
ar D
ata
Cata
logu
e20
13 o
nwar
ds: 0
K (in
-kin
d su
ppor
t fro
m P
DC
and
CAFF
Dat
a M
anag
er)
Met
adat
a en
try
by U
nive
rsity
of L
aval
an
d CA
FF D
ata
Man
ager
free
of c
harg
eCA
FF C
BMP
Offi
ce
3. In
dica
tor
deve
lopm
ent
a. Id
entifi
catio
n of
exi
stin
g da
ta s
ets
and
hist
oric
al
data
, col
lect
ion
of m
etad
ata,
and
spa
tial a
sses
smen
t of
dat
a co
vera
ge fo
r nat
iona
l rep
ort (
Proj
ect 1
)
2013
-201
4: 3
0-60
K pe
r cou
ntry
Cost
s fo
r 1 p
erso
n fo
r 3-6
mon
ths
per
coun
try
(dep
endi
ng o
n co
untr
y).
Arc
tic n
atio
ns
b. A
ggre
gatio
n of
exi
stin
g da
ta, n
atio
nal a
nd re
gion
al
data
set c
ompi
latio
ns, Q
A/Q
C, d
ata
agre
emen
ts, a
nd
form
attin
g (P
roje
ct 2
)
2014
-201
5: 3
0-60
K pe
r yea
r per
co
untr
yCo
sts
will
var
y de
pend
ing
on s
tate
of
natio
nal d
atas
ets.
Cost
s fo
r 1 p
erso
n fo
r 3-6
mon
ths
per y
ear p
er c
ount
ry
(dep
endi
ng o
n co
untr
y).
Arc
tic n
atio
ns
c. A
naly
sis
of in
dica
tor b
asel
ine
stat
us fo
r eac
h na
tion,
su
mm
ariz
ed in
nat
iona
l rep
ort (
Proj
ect 3
)20
15-2
016:
30-
60K
per y
ear p
er
coun
try
Cost
s fo
r 1 p
erso
n fo
r 3-6
mon
ths
per y
ear p
er c
ount
ry (d
epen
ding
on
coun
try)
.
Arc
tic n
atio
ns
d. D
atas
et c
ompi
latio
ns a
rchi
ved
Min
imal
cos
t (10
K).
CAFF
Dat
a m
anag
er s
taff
time.
All
data
sets
com
pile
d an
d us
ed to
be
arch
ived
at C
AFF
Sec
reta
riat.
CAFF
Sec
reta
riat
e. A
ccum
ulat
ion
of li
nks
to n
atio
nal/
regi
onal
pr
otoc
ols,
iden
tifica
tion
of in
terc
alib
ratio
n ne
eds,
and
defin
ition
of i
ndic
ator
com
paris
on li
mits
(Pro
ject
4)
2014
-201
5: 3
0KCo
sts
for 1
per
son
for 3
mon
ths.
CBM
P-FS
G

Mile
ston
eA
ctiv
itie
s &
Del
iver
able
sTo
tal C
ost (
USD
)Co
st D
etai
lsRe
spon
sibi
lity
4. R
epor
ting
a. A
nnua
l per
form
ance
repo
rts
and
wor
k pl
ans
0K p
er y
ear s
tart
ing
in 2
014
Perf
orm
ance
repo
rt/w
ork-
plan
layo
ut
and
digi
tal p
ublic
atio
nCB
MP-
FSG
b. C
ompi
latio
n of
nat
iona
l rep
orts
to c
reat
e St
ate
of
Arc
tic F
resh
wat
er B
iodi
vers
ity R
epor
t50
K (1
0 pe
ople
at 5
K ea
ch) p
lus
5K v
enue
cos
ts p
er y
ear
Mee
ting
cost
s (t
rave
l sup
port
for C
BMP-
FSG
mem
bers
and
ven
ue c
osts
) and
co
nfer
ence
cal
l cos
ts
Arc
tic n
atio
ns fo
r tr
avel
sup
port
. Lea
d FS
G c
ount
ry fo
r ve
nue
cost
s.
5. P
rogr
am R
evie
w a
nd
adju
stm
ents
a. R
evie
w o
f par
amet
ers
and
sam
plin
g ap
proa
ches
.
b. In
depe
nden
t rev
iew
of d
ata
man
agem
ent
appr
oach
, ana
lysi
s, an
d re
port
ing
usin
g pe
rfor
man
ce
mea
sure
s
0K –
cos
ts re
flect
ed a
bove
30K
ever
y te
n ye
ars
star
ting
in
2016
Cont
ract
inde
pend
ent r
evie
w o
f M
onito
ring
Prog
ram
CBM
P-FS
G
CBM
P O
ffice
TOTA
LS
2013
: 35-
65K
per c
ount
ry20
14-2
016:
65-
125K
per
yea
r per
co
untr
y
Icel
and.
Pho
to: K
ári F
anna
r Lár
usso
n

11. Literature Cited

86
Appelberg, M. (ed.) 2000. Swedish standard methods for sampling freshwater fish with multi-mesh gillnets. Fiskeriverket Information 2000 1: 1-32.
Barbour, M.T., Gerritsen, J., Snyder, B.D., and Stribling, J.B. 1999. Rapid bioassessment protocols for use in streams and wadeable rivers: periphyton, benthic macroinvertebrates, and fish. Second edition. Technical Report 841-B-99-002, US Environmental Protection Agency, Washington, DC. Available from http://water.epa.gov/scitech/monitoring/rsl/bioassessment/index.cfm.
Bohlin, T., Hamrin, S., Heggberget, T.G., Rasmussen, G., and Saltveit, S.J. 1989. Electrofishing - Theory and practice with special emphasis on salmonids. Hydrobiologia 173: 9-43.
Borgstrøm, R., Museth, J., and Brittain, J.E. 2010. The brown trout (Salmo trutta) in the lake, Øvre Heimdalsvatn: long-term changes in population dynamics due to exploitation and the invasive species, European minnow (Phoxinus phoxinus). Hydrobiologia 642: 5-12.
Bradt, S. 2005. Integrated Lake Basin Management: Application of Remote Sensing for Lake Basin Management. Available from http://wldb.ilec.or.jp/ILBMTrainingMaterials/index.html.
British Standards Institution. 2003. Water quality. Sampling of fish with electricity. BS EN 14011:2003 (BS 6068-5.32:2003).
Brittain, J.E., Gíslason, G.M., Ponomarev, V.I., Bogen, J., Brørs, S., Jensen, A.J., Khokhlova, L.G., Kochanov, S.K., Kokovkin, A.V., Melvold, K., Ólafsson, J.S., Pettersson, L.-E., and Stenina, A.S. 2009. Arctic Rivers. In Rivers of Europe. Edited by K. Tockner, C.T. Robinson and U. Uehlinger. Academic Press, London.
Brittain, J.E., and Milner, A.M. 2001. Ecology of glacier-fed rivers: current status and concepts. Freshwater Biology 46: 1571-1578.
Brittain, J.E., Saltveit, S.J., Castella, E., Bogen, J., Bønsnes, T.E., Blakar, I., Bremnes, T., Haug, I., and Velle, G. 2001. The macroinvertebrate communities of two contrasting Norwegian glacial rivers in relation to environmental variables. Freshwater Biology 46: 1723-1736.
Castella, E., Adalsteinsson, H., Brittain, J.E., Gislason, G.M., Lehmann, A., Lencioni, V., Lods-Crozet, B., Maiolini, B., Milner, A.M., Olafsson, J.S., Saltveit, S.J., and Snook, D.L. 2001. Macrobenthic invertebrate richness and composition along a latitudinal gradient of European glacier-fed streams. Freshwater Biology 46: 1811-1831.
CAVM Team. 2003. Circumpolar Arctic Vegetation Map. (1:7,500,000 scale), Conservation of Arctic Flora and Fauna (CAFF) Map No. 1, U.S. Fish and Wildlife Service, Anchorage, Alaska.
Christoffersen, K. S., Amsinck, S. L., Landkildehus, F., Lauridsen, T. L., & Jeppesen, E. (2008). Lake flora and fauna in relation to Ice-melt, water temperature and chemistry at Zackenberg. In: High-arctic ecosystem dynamics in a changing climate. Ten years of monitoring and research at Zackenberg. Eds. H. Meltofte, Christensen, T. R., Elberling, B., M. C. Forchhammer & M. Rasch. Advances in Ecological Research, 40, Academic Press. pp. 371-390.
CEN. 2003. Water quality - Guidance standard for the routine sampling and pretreatment of benthic diatoms from rivers. EN 13946: 2003. Comité European de Normalisation, Geneva.
CEN. 2004. Water quality - Guidance standard for the identification, enumeration and interpretation of benthic diatom samples from running waters. EN 14407:2004. Comité European de Normalisation, Geneva.
Culp, J., Gantner, N., Gill, M., Reist, J., Wrona, F., and Sweetman, J. 2011a. Development of an Arctic Freshwater Biodiversity Monitoring Plan: Framework Document. Circumpolar Biodiversity Monitoring Programme, CAFF Monitoring Series Report No. 4, CAFF International Secretariat, Akureyri, Iceland.
Culp, J.M., Goedkoop, W., and Lento, J. 2011b. Report of the CBMP’s Freshwater Expert Monitoring Group Workshop: Uppsala, Sweden, November 22-25, 2010. CAFF Proceedings Series Report Nr. 6, CAFF International Secretariat, Akureyri, Iceland.
EA. 2003. River Habitat Survey in Britain and Ireland: Field Survey Guidance Manual. River Habitat Survey Manual: 2003 version, Environment Agency. Available from http://www.irpi.to.cnr.it/documenti/RHS%20manual%202003.PDF.
Edwards, T.W.D., Wolfe, B.B., Gibson, J.J., and Hammarlund, D. 2004. Use of water isotope tracers in high-latitude hydrology and paleohydrology. In Long-Term Environmental Change in Arctic and Antarctic Lakes. Edited by R. Pienitz, M.S.V. Douglas and J.P. Smol. Springer, Dordrecht. pp. 187-207.
European Parliament and Council of the European Union. 2000. A framework for Community action in the field of water policy. Directive 2000/60/EC. Official Journal L 327, 22.12.2000, p. 1. Available from

87ARCTIC FRESHWATER BIODIVERSITY MONITORING PLAN
http://eur-lex.europa.eu/LexUriServ/LexUriServ.do?uri=CONSLEG:2000L0060:20090625:EN:PDF.Fjellheim, A., and Raddum, G.G. 1990. Acid precipitation: biological monitoring of streams and lakes. The
Science of the Total Environment 96: 57-66.Friberg, N., Milner, A.M., Svendsen, L.M., Lindegaard, C., and Larsen, S.E. 2001. Macroinvertebrate stream
communities along regional and physico-chemical gradients in Western Greenland. Freshwater Biology 46: 1753-1764.
Gill, M.J., Crane, K., Hindrum, R., Arneberg, P., Bysveen, I., Denisenko, N.V., Gofman, V., Grant-Friedman, A., Gudmundsson, G., Hopcroft, R.R., Iken, K., Labansen, A., Liubina, O.S., Melnikov, E.A., Moore, S.E., Reist, J.D., Sirenko, B.I., Stow, J., Ugarte, F., Vongraven, D., and Watkins, J. 2011. Arcitc Marine Biodiversity Monitoring Plan (CBMP-MARINE PLAN). CAFF Monitoring Series Report No. 3, CAFF International Secretariat, Akureyri, Iceland.
Gislason, G.M., Adalsteinsson, H., Hansen, I., Olafsson, J.S., and Svavarsdottir, K. 2001. Longitudinal changes in macroinvertebrate assemblages along a glacial river system in central Iceland. Freshwater Biology 46: 1737-1751.
Gofman, V. 2010. Community-based Monitoring Handbook: Lessons from the Arctic. CAFF CBMP Report No. 21, CAFF International Secretariat, Akureyri, Iceland.
Hammar, J. 1989. Freshwater ecosystems of Polar regions: Vulnerable resources. Ambio 18: 6-22.Hammar, J., and Filipsson, O. 1985. Ecological testfishing with the Lundgren gillnets of multiple mesh size:
the Drottningholm technique modified for Newfoundland Arctic char populations. Report 62: 12-35, Institute of Freshwater Research, Drottningholm.
Heino, J., Virkkala, R., and Toivonen, H. 2009. Climate change and freshwater biodiversity: detected patterns, future trends and adaptations in northern regions. Biological Reviews 84: 39-54.
Hering, D., Johnson, R.K., Kramm, S., Schmutz, S., Szoszkiewicz, K., and Verdonschot, P.M. 2006. Assessment of European streams with diatoms, macrophytes, macroinvertebrates and fish: a comparative metric-based analysis of organism response to stress. Freshwater Biology 51: 1757-1785.
Hering, D., Moog, O., Sandin, L., and Verdonschot, P.F.M. 2004. Overview and application of the AQEM assessment system. Hydrobiologia 516: 1-20.
International Permafrost Association. 2008. Manual for Monitoring and Reporting Permafrost Measurements, Accessed from http://permafrost.gi.alaska.edu/sites/default/files/TSP_manual.pdf.
Kamler, J.F., and Pope, K.L. 2001. Nonlethal methods of examining fish stomach contents. Nebraska Cooperative Fish and Wildlife Research Unit – Staff Publications. Paper 55, Accessed from http://digitalcommons.unl.edu/ncfwrustaff/55.
Kapelle, M., Margret, M.-I., and Baas, P. 1999. Effects of climate change on biodiversity: a review and identification of key research areas. Biodiversity and Conservation 8: 1383-1397.
Kelly, M.G., Bennett, C., Coste, M., Delmas, F., Denys, L., Ector, L., Fauville, C., Ferreol, M., Golub, M., Jarlman, A., Kahlert, M., Lucey, J., Chathain, B.N., Pardo, I., Pfister, P., Picinska-Faltynowicz, J., Schranz, C., Tison, J., Dam, H.v., and Vilbaste, S. 2007. Central/Baltic GIG Phytobenthos Intercalibration Exercise. Available from http://circa.europa.eu/Public/irc/jrc/jrc_eewai/library?l=/intercalibration_2/lastest_committee/rivers/phytobenthosdoc/_EN_1.0_&a=d.
Kokelj, S.V., Zajdlik, B., and Thompson, M.S. 2009. The impacts of thawing permafrost on the chemistry of lakes across the subarctic boreal-tundra transition, Mackenzie Delta region, Canada. Permafrost and Periglacial Processes 20: 185-199.
Lehner, B., and Döll, P. 2004. Development and validation of a global database of lakes, reservoirs and wetlands. Journal of Hydrology 296: 1-22.
Lods-Crozet, B., Lencioni, V., Ólafsson, J.O., Snook, D.L., Velle, G., Brittain, J.E., Castella, E., and Rossaro, B. 2001. Chironomid (Diptera: Chironomidae) communities in six European glacier-fed streams. Freshwater Biology 46: 1791-1809.
Logue, J., Mouquet, N., Peter, H., Hillebrand, H., and The Metacommunity Working Group. 2011. Empirical approaches to metacommunities: a review and comparison with theory. Trends in Ecology and Evolution. 26: 482-491.
MacDonald, D.D., Clark, M.J.R., Whitfield, P.H., and Wong, M.P. 2009. Designing monitoring programs for water quality based on experience in Canada I. Theory and framework. Trends in Analytical Chemistry 28: 204-213.

88
Mackinson, S. 2001. Integrating local and scientific knowledge: an example in fisheries science. Environmental Management 27: 533-545.
Milner, A.M. 1994. Colonization and succession of invertebrate communities in a new stream in Glacier Bay National Park, Alaska. Freshwater Biology 32: 53-70.
Milner, A.M., Brittain, J.E., Castella, E., and Petts, G.E. 2001. Trends of macroinvertebrate community structure in glacier-fed rivers in relation to environmental conditions: a synthesis. Freshwater Biology 46: 1833-1847.
Milner, A.M., Oswood, M.W., and Munkittrick, K.R. 2005. Arctic Rivers. In Rivers of North America. Edited by A.C. Benke and C.E. Cushing. Elsevier Academic Press, London.
Moulton II, S.R., Kennen, J.G., Goldstein, R.M., and Hambrook, J.A. 2002. Revised protocols for sampling algal, invertebrate, and fish communities as part of the National Water-Quality Assessment Program. Open-File Report 02-150, U.S. Geological Survey, Reston, VA, USA. Available from http://water.usgs.gov/nawqa/protocols/OFR02-150/index.html.
NVV. 2006. Handledning för miljöövervakning: Undersökningstyp Lokalbeskrivning Version 1:6, Naturvårdsverket, Stockholm. Available from http://www.naturvardsverket.se/upload/02_tillstandet_i_miljon/Miljoovervakning/undersokn_typ/sotvatten/lokbesk.pdf.
Peterson, B.J., Holmes, R.M., McClelland, J.W., Vörösmarty, C.J., Lammers, R.B., Shiklomanov, A.I., Shiklomanov, I.A., and Rahmstorf, S. 2002. Increasing river discharge to the Arctic Ocean. Science 298: 2171-2173.
Prowse, T.D., Wrona, F.J., Reist, J.D., Gibson, J.J., Hobbie, J.E., Lévesque, L.M.J., and Vincent, W.F. 2006a. Climate change effects on hydroecology of Arctic freshwater ecosystems. Ambio 35: 347-358.
Prowse, T.D., Wrona, F.J., Reist, J.D., Hobbie, J.E., Lévesque, L.M.J., and Vincent, W.F. 2006b. General features of the Arctic relevant to climate change in freshwater ecosystems. Ambio 35: 330-338.
Ramsar Convention Secretariat. 2011. The Ramsar Convention Manual: a guide to the Convention on Wetlands (Ramsar, Iran, 1971), 5th ed. Ramsar Convention Secretariat, Gland, Switzerland.
Rantz, S.E., and others. 1983. Measurement and Computation of Streamflow Geological Survey Water-Supply Paper 2175, U.S. Geological Survey, Washington, D.C. Available from http://pubs.usgs.gov/wsp/wsp2175/.
Rautio, M., Dufresne, F., Laurion, I., Bonilla, S., Warwick S. V. and Christoffersen, K. S. (2011). Shallow freshwater ecosystems of the circumpolar Arctic. EcoScience 18: 204-222.
Reist, J.D., Wrona, F.J., Prowse, T.D., Dempson, J.B., Power, M., Köck, G., Carmichael, T.J., Sawatzky, C.D., Lehtonen, H., and Tallman, R.F. 2006a. Effects of climate change and UV radiation on fisheries of Arctic freshwater and anadromous species. Ambio 35: 402-410.
Reist, J.D., Wrona, F.J., Prowse, T.D., Power, M., Dempson, J.B., Beamish, R.J., King, J.R., Carmichael, T.J., and Sawatzky, C.D. 2006b. General effects of climate change on Arctic fishes and fish populations. Ambio 35: 370-380.
Reist, J.D., Wrona, F.J., Prowse, T.D., Power, M., Dempson, J.B., King, J.R., and Beamish, R.J. 2006c. An overview of effects of climate change on selected Arctic freshwater and anadromous fishes. Ambio 35: 381-387.
Reynoldson, T.B., Logan, C., Pascoe, T., and Thompson, S.P. 2007. CABIN Canadian Aquatic Biomonitoring Network invertebrate biomonitoring field and laboratory manual, Canada National Water Research Institute, Environment Canada. Available from http://www.ec.gc.ca/Publications/C183563B-CF3E-42E3-9A9E-F7CC856219E1%5CCABINFieldManual.pdf.
Rosenberg, D.M., and Resh, V.H. 1993. Freshwater Biomonitoring and Benthic Macroinvertebrates. Chapman & Hall, NY.
Schindler, D.E., Hilborn, R., Chasco,B., Boatright, C.P., Quinn,T.P., Rogers, L.A., and Webster, M.S. 2010. Population diversity and the portfolio effect in an exploited species. Nature 465:609-612.
Schneider, S., and Lindstrøm, E.-A. 2011. The periphyton index of trophic status PIT: A new eutrophication metric based on non-diatomaceous benthic algae in Nordic rivers. Hydrobiologia 665: 143-155.
Svenning, M.-A., Klemetsen, A., and Olsen, T. 2007. Habitat and food choice of Arctic charr in Linnévatn on Spitsbergen, Svalbard: the first year-round investigation in a High Arctic lake. Ecology of Freshwater Fish 16: 70-77.

89
Turner, K.W., Wolfe, B.B., and Edwards, T.W.D. 2010. Characterizing the role of hydrological processes on lake water balances in the Old Crow Flats, Yukon Territory, Canada, using water isotope tracers. Journal of Hydrology 386: 103-117.
USEPA. 2007. Survey of the Nation’s Lakes. Field Operations Manual. EPA 841-B07-004. U.S. Environmental Protection Agency, Washington, DC.
van de Bund, W. (ed.) 2009. Water Framework Directive Intercalibration. Joint Research Centre - Institute for Environment and Sustainability Report EUR 23838 EN/1, JRC European Commission, Luxembourg. Available from http://circa.europa.eu/Public/irc/jrc/jrc_eewai/library?l=/intercalibration_2/jrc51339-volumeriverpdf/_EN_1.0_&a=d.
Vannforvaltning i Norge. 2008. Begroingsalger som kvalitetselement i elver. Foreløpige verdier - 04.06.2008. Versjon 0 (Testversjon). Available from http://www.vannportalen.no/enkel.aspx?m=47482&amid=2104333.
Vincent, W.F., Callaghan, T.V., Dahl-Jensen, D., Johansson, M., Kovacs, K.M., Michel, C., Prowse, T.D., Reist, J.D., and Sharp, M. 2011. Ecological implications of changes in the Arctic cryosphere. Ambio 40: 87-91.
Walsh, J.E., Anisimov, O., Hagen, J.O.M., Jakobsson, T., Oerlemans, J., Prowse, T.D., Romanovsky V., et al. 2005. Cryosphere and Hydrology. In Arctic Climate Impact Assessment, Chapter 6. Cambridge University Press, Cambridge, UK.
Walsh, J.E., Overland, J. E., Groisman, P.Y., and Rudolf, B.. 2011. Ongoing climate change in the Arctic. Ambio 40: 6-16.
Wrona, F.J., Prowse, T.D., Reist, J.D., Hobbie, J.E., and Lévesque, L.M.J. 2006a. Effects of ultraviolet radiation and contaminant-related stressors on Arctic freshwater ecosystems. Ambio 35: 388-401.
Wrona, F.J., Prowse, T.D., Reist, J.D., Hobbie, J.E., Lévesque, L.M.J., and Vincent, W.F. 2006b. Climate change effects on aquatic biota, ecosystem structure and function. Ambio 35: 359-369.
Wrona, F.J., Prowse, T.D., Reist, J.D., Hobbie, J.E., Lévesque, L.M.J., and Vincent, W.F. 2006c. Climate impacts on Arctic freshwater ecosystems and fisheries: Background, rationale and approach of the Arctic Climate Impact Assessment (ACIA). Ambio 35: 326-329.
Wrona, F.J., Prowse, T.D., Reist, J.D., Hobbie, J.E., Lévesque, L.M.J., and Vincent, W.F. 2006d. Key findings, science gaps and policy recommendations. Ambio 35: 411-415.
Yi, Y., Brock, B.E., Falcone, M.D., Wolfe, B.B., and Edwards, T.W.D. 2008. A coupled isotope tracer method to characterize input water to lakes. Journal of Hydrology 350: 1-13.

12. Glossary of Acronyms

91ARCTIC FRESHWATER BIODIVERSITY MONITORING PLAN
ABA - Arctic Biodiversity Assessment
ADCP - Acoustic Doppler Current Profiler
ALISON - Alaska Lake Ice and Snow Observatory Network
AMAP - Arctic Monitoring Assessment Program
AVHRR - Advanced Very High Resolution Radiometer
ASTER - Advanced Spaceborne Thermal Emission and Reflection Radiometer
CAFF - Conservation of Arctic Flora and Fauna
CALM - Circum-polar Active Layer Monitoring
CAVM Team - Circumpolar Arctic Vegetation Map Team
CBD - Convention on Biological Diversity
CBMP - Circumpolar Biodiversity Monitoring Program
CBMP-FSG - CBMP Freshwater Steering Group
CDOM - Colored dissolved organic matter
DFO - Department of Fisheries and Oceans (Canada)
DOC - Dissolved organic carbon
EMG - Expert Monitoring Group
EPA - Environmental Protection Agency (USA)
EPT taxa - Ephemeroptera, Plecoptera, and Trichoptera taxa
EU - European Union
FEC - Focal Ecosystem Component
FEN - Freshwater Expert Network
FGDC - Federal Geographic Data Committee
Freshwater EMG - Freshwater Expert Monitoring Group
GBIF - Global Biological Information Facility
GCMD - Global Change Master Directory
GEO-BON - Group on Earth Observations Biodiversity Observation Network
GEOSS - Global Earth Observation System of Systems
GF/F - Glass filter fiber
GIS - Geographic Information System
HDPE - High-density polyethylene
HPLC - High-Performance Liquid Chromatography
IPY - International Polar Year
Marine EMG - Marine Expert Monitoring Group
MODIS - Moderate Resolution Imaging Spectroradiometer
NAWQA Program - National Water-Quality Assessment Program (USGS)
NBII - National Biological Information Infrastructure
NGO - Non-governmental organization
NOx - Nitrogen oxide
NTU - Nephelometric Turbidity Unit
OBIS - Ocean Biogeographic Information System
ORNIS - Ornithological Information System
PAR - Photosynthetically active radiation
PDC - Polar Data Catalogue
QA/QC - Quality assurance/quality control
SAR - Synthetic Aperture Radar
SOx - Sulphur oxide
TDS - Total dissolved solids
TEK - Traditional Ecological Knowledge
TN - Total nitrogen
TP - Total phosphorus
TSP - Thermal State of Permafrost
TSS - Total suspended solids
USD - United States dollars
USGS - United States Geological Survey
UV - Ultraviolet
WG - Working Group

Appendix A. Terms of Reference

93ARCTIC FRESHWATER BIODIVERSITY MONITORING PLAN
I. Introduction
The Conservation of Arctic Flora and Fauna (CAFF) working group of the Arctic Council has established the Circumpolar Biodiversity Monitoring Program (CBMP). Within the CBMP, the Freshwater Integrated Monitoring Plan (The Freshwater Plan) for the circumpolar Arctic is intended to provide a framework for the coordination of freshwater biodiversity monitoring and reporting efforts across the Arctic through the use of existing monitoring capacity and information. The overall goal of the framework described in the Freshwater Plan is to facilitate improvements in our ability to detect long-term change in the composition, structure, and function of Arctic freshwater ecosystems and to understand the causes of this change, as well as to develop reliable assessments of key elements of Arctic freshwater biodiversity.
The monitoring framework described in the Freshwater Plan integrates existing freshwater biodiversity monitoring activities, utilizing both empirical scientific and community-based monitoring approaches. The plan was developed and endorsed by eight Arctic nations (Canada, Denmark-Greenland-Faroes, Finland, Iceland, Norway, Russia, Sweden and the United States of America), and involves a great number of national, regional, Indigenous and academic organizations and agencies. Specifically, the Freshwater Plan is a framework that identifies the following outcomes:
► A prioritized suite of common biological parameters and indicators for monitoring Arctic freshwater ecosystems;
► Abiotic parameters that are relevant to freshwater biodiversity and that should be monitored; ► Optimal sampling approaches describing where, when and how the suite of parameters is to be
measured, and who is responsible for monitoring; ► Stressors that have the most important influences on freshwater biodiversity; data for these
stressors will be used to assess anthropogenic and natural causes of change; and ► A coordinated data management and reporting approach with specific timelines for indicator
updates and assessments.
The implementation of the Freshwater Plan will involve a number of jurisdictions (national, sub-national, and local) across the Arctic that are already engaged in freshwater biodiversity monitoring. After a period of implementation by the Arctic nations, involvement may be expanded to include non-Arctic nations that are engaged in freshwater research and monitoring in the Arctic.
The challenge for CAFF and the CBMP is to develop a simple, yet effective, structure that ensures effective implementation across Arctic nations, ongoing data integration, analysis and assessment, and regular review of the monitoring plan. Output from freshwater assessments is designed to provide useful information for governments and other decision-makers in the Arctic.
CAFF will establish a CBMP Freshwater Steering Group (CBMP-FSG) to coordinate and track the program, and to oversee the activity of the eight national Freshwater Expert Networks (FENs). Each national FEN will be responsible for networking and data analysis, interpretation, and reporting to the CBMP-FSG as described below in Section IV. This includes cooperation with existing networks and working groups.
II. CBMP Freshwater Steering Group Goals
The CBMP-FSG shall coordinate the overall implementation of the Freshwater Plan. More specifically the CBMP-FSG shall:
► Ensure effective communication among and between the implementing nations; ► Coordinate and provide direction to the national FENs; ► Facilitate input from the national FENs through the CBMP-FSG members from each country; ► Facilitate and track the implementation of the Freshwater Plan and provide reports and
information from the monitoring activities to the CAFF-CBMP Office.

94
III. Administration
A. Membership
The CBMP-FSG will be composed of one representative from each Arctic freshwater nation (Canada, Denmark-Greenland-Faroes, Finland, Iceland, Norway, Russia, Sweden, and the United States of America) appointed by the CAFF National Representative. Permanent Participants will be engaged depending on their capacity and interest, and may appoint two members to the CBMP-FSG. Other relevant Arctic Council working groups (e.g., AMAP) may appoint one member each to the CBMP-FSG. Each CBMP-FSG representative will be responsible for:
1. Facilitating monitoring plan implementation within their own nation;2. Building strong and ongoing connections with the relevant agencies, institutes and experts
within their countries by coordinating and providing direction to their national FEN members;3. Gathering information and reporting on the implementation status of the plan within their
respective nation to the CBMP-FSG; and4. Contributing to reporting to the CBMP and CAFF.
As a group, the CBMP-FSG will be responsible for setting the overall course of the evolving monitoring program, providing ongoing program oversight and adjusting the implementation approach as necessary. The CBMP-FSG will be responsible for reporting on the status of the monitoring plan to the CBMP Secretariat and CAFF Management Board.
CBMP-FSG representatives will be expected to serve a term of at least three years. Membership can be modified to add new members if deemed appropriate by the existing CBMP-FSG and sanctioned by the CAFF Management Board.
CBMP-FSG members are expected to attend an annual meeting to review the status of monitoring plan implementation, identify and resolve problems that have arisen and make adjustments to the Freshwater Plan as necessary. Members are also expected to attend quarterly conference calls to review implementation progress. The CBMP-FSG will call upon and meet directly with the Freshwater Expert Networks as needed for development of the program and reports on the state of Arctic freshwater biodiversity.
B. Leadership
The CBMP-FSG will be directed by co-leading countries. These co-leads will also be the representatives to the CBMP-FSG for their respective countries. Co-leads will each serve terms of at least two years1 , with the terms offsetting so that co-leads would not begin or end their appointments in the same year. This offset rotation will promote continuity in the operation of the CBMP-FSG.
The co-leading countries will be responsible for:
1. Convening, organizing and facilitating the annual CBMP-FSG meetings;2. Organizing and participating in quarterly conference calls;3. Communicating regularly with the CBMP office;4. Preparing and distributing materials prior to meetings;5. Completing appropriate records of meetings and results of workshops;6. Ensuring that meeting materials and records are provided to the CAFF Secretariat, CBMP office,
and all members within 30 days of completed meetings;7. Developing meeting agendas in consultation with other members; and
1. After the start-up phase (2013 to 2016) has concluded, the schedule and timeframe for chairing and leading the Freshwater Steering Group will be revisited.

95ARCTIC FRESHWATER BIODIVERSITY MONITORING PLAN
8. Working with CBMP-FSG members to produce the annual performance report and work plans for submission to the CBMP Office.
C. Coordination
The CBMP Secretariat Office will be responsible for ensuring coordination (connectivity and compatibility) between the CBMP-FSG and the implementation bodies for the other CBMP monitoring plans. This will be accomplished as needed, and could include, for example, participation on scheduled CBMP-FSG conference calls or conference calls between the CBMP Office and other steering groups (e.g., Marine, Terrestrial).
D. Work plan
The CBMP-FSG will function as an expert forum to coordinate the implementation of the relevant parts of the monitoring plan specific to the chosen parameters, sampling schemes, and indicators. It will work to further refine the parameters, indicators, and sampling protocols during the start-up phase of the plan from 2013-2016, and in the short-term, identify priority gaps, priority indicators, and existing datasets for aggregation, analysis, and reporting that can support these priority indicators.
E. Decision-making
Decision-making within the CBMP-FSG is by consensus of the designated official representatives.
F. Expenses
Each nation is responsible for their own travel coordination and expenses to attend the CBMP-FSG meetings. Lead countries will be responsible for hosting the quarterly conference calls and arranging annual meetings. The CBMP-FSG is encouraged to rotate the location of annual meetings among the member states to share the financial burden of annual meeting expenses. The CBMP-FSG may apply for external funding to support their activities, which are primarily travel, meeting expenses, and data compilation and analysis.
IV. National Freshwater Expert Networks
It is the responsibility of each country representative to the CBMP-FSG to identify national experts to be included in their Freshwater Expert Network (FEN). Although a nomination process is not required, membership in each FEN should be discussed among members of the CBMP-FSG and recorded to ensure adequate coverage of expertise for each Focal Ecosystem Component across all of the networks. Membership in the FENs will not be static, and will be subject to changes in member availability. Each FEN may include one Permanent Participant member. Each nation is responsible for funding its FEN’s activities.
Each FEN will be responsible for implementing the FSG work plan by:
► Identifying, aggregating, analyzing, and reporting on existing datasets to contribute to indicators and assessments;
► Reporting on the implementation status of the monitoring program to the CBMP-FSG; and ► Suggesting adjustments to the parameters, indicators and sampling schemes if needed. ► FENs should be encouraged to make use of existing information from specialist networks as
required. The CBMP-FSG may facilitate coordination and cooperation among the various FENs as needed.

Appendix B. Detailed Justification of FECs for
Initial and Future Monitoring
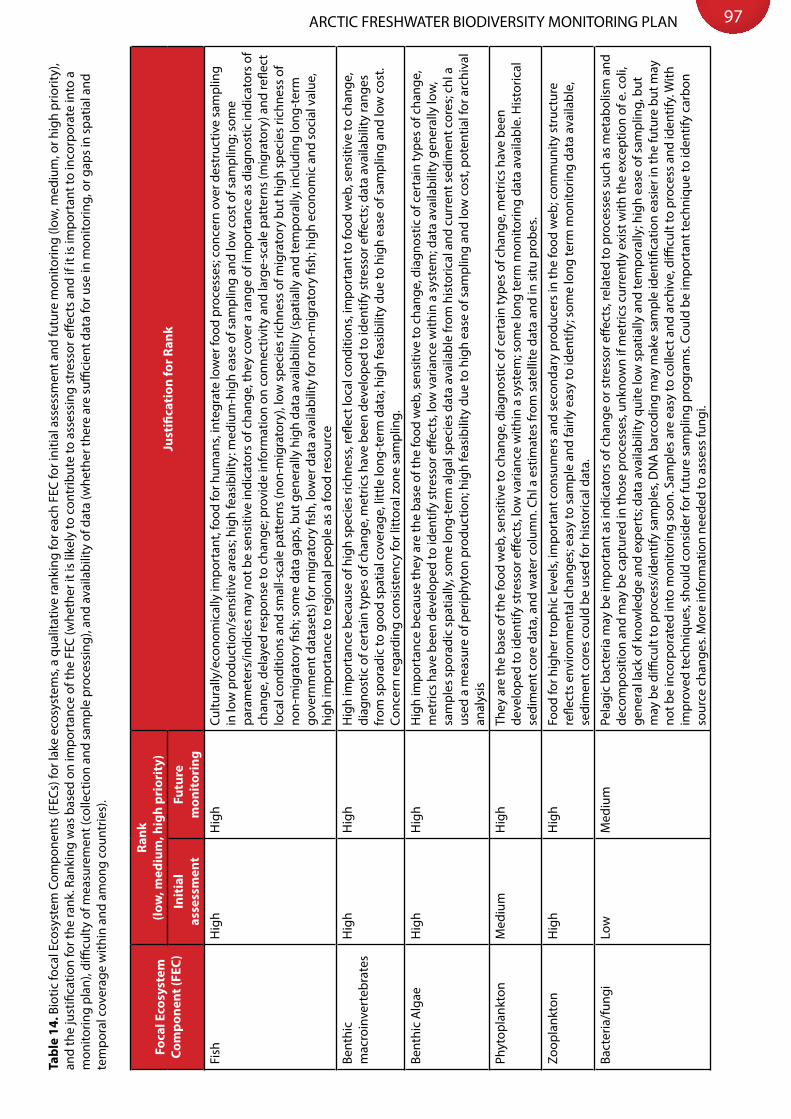
97ARCTIC FRESHWATER BIODIVERSITY MONITORING PLAN
Tabl
e 14
. Bio
tic fo
cal E
cosy
stem
Com
pone
nts
(FEC
s) fo
r lak
e ec
osys
tem
s, a
qual
itativ
e ra
nkin
g fo
r eac
h FE
C fo
r ini
tial a
sses
smen
t and
futu
re m
onito
ring
(low
, med
ium
, or h
igh
prio
rity)
, an
d th
e ju
stifi
catio
n fo
r the
rank
. Ran
king
was
bas
ed o
n im
port
ance
of t
he F
EC (w
heth
er it
is li
kely
to c
ontr
ibut
e to
ass
essi
ng s
tres
sor e
ffect
s an
d if
it is
impo
rtan
t to
inco
rpor
ate
into
a
mon
itorin
g pl
an),
diffi
culty
of m
easu
rem
ent (
colle
ctio
n an
d sa
mpl
e pr
oces
sing
), an
d av
aila
bilit
y of
dat
a (w
heth
er th
ere
are
suffi
cien
t dat
a fo
r use
in m
onito
ring,
or g
aps
in s
patia
l and
te
mpo
ral c
over
age
with
in a
nd a
mon
g co
untr
ies)
.
Foca
l Eco
syst
em
Com
pone
nt (F
EC)
Rank
(lo
w, m
ediu
m, h
igh
prio
rity
)Ju
stifi
cati
on fo
r Ran
kIn
itia
l as
sess
men
tFu
ture
m
onit
orin
g
Fish
Hig
hH
igh
Cultu
rally
/eco
nom
ical
ly im
port
ant,
food
for h
uman
s, in
tegr
ate
low
er fo
od p
roce
sses
; con
cern
ove
r des
truc
tive
sam
plin
g in
low
pro
duct
ion/
sens
itive
are
as; h
igh
feas
ibili
ty: m
ediu
m-h
igh
ease
of s
ampl
ing
and
low
cos
t of s
ampl
ing;
som
e pa
ram
eter
s/in
dice
s m
ay n
ot b
e se
nsiti
ve in
dica
tors
of c
hang
e, th
ey c
over
a ra
nge
of im
port
ance
as
diag
nost
ic in
dica
tors
of
chan
ge, d
elay
ed re
spon
se to
cha
nge;
pro
vide
info
rmat
ion
on c
onne
ctiv
ity a
nd la
rge-
scal
e pa
tter
ns (m
igra
tory
) and
refle
ct
loca
l con
ditio
ns a
nd s
mal
l-sca
le p
atte
rns
(non
-mig
rato
ry),
low
spe
cies
rich
ness
of m
igra
tory
but
hig
h sp
ecie
s ric
hnes
s of
no
n-m
igra
tory
fish
; som
e da
ta g
aps,
but g
ener
ally
hig
h da
ta a
vaila
bilit
y (s
patia
lly a
nd te
mpo
rally
, inc
ludi
ng lo
ng-t
erm
go
vern
men
t dat
aset
s) fo
r mig
rato
ry fi
sh, l
ower
dat
a av
aila
bilit
y fo
r non
-mig
rato
ry fi
sh; h
igh
econ
omic
and
soc
ial v
alue
, hi
gh im
port
ance
to re
gion
al p
eopl
e as
a fo
od re
sour
ce
Bent
hic
mac
roin
vert
ebra
tes
Hig
hH
igh
Hig
h im
port
ance
bec
ause
of h
igh
spec
ies
richn
ess,
refle
ct lo
cal c
ondi
tions
, im
port
ant t
o fo
od w
eb, s
ensi
tive
to c
hang
e,
diag
nost
ic o
f cer
tain
type
s of
cha
nge,
met
rics
have
bee
n de
velo
ped
to id
entif
y st
ress
or e
ffect
s; d
ata
avai
labi
lity
rang
es
from
spo
radi
c to
goo
d sp
atia
l cov
erag
e, li
ttle
long
-ter
m d
ata;
hig
h fe
asib
ility
due
to h
igh
ease
of s
ampl
ing
and
low
cos
t. Co
ncer
n re
gard
ing
cons
iste
ncy
for l
ittor
al z
one
sam
plin
g.
Bent
hic
Alg
aeH
igh
Hig
hH
igh
impo
rtan
ce b
ecau
se th
ey a
re th
e ba
se o
f the
food
web
, sen
sitiv
e to
cha
nge,
dia
gnos
tic o
f cer
tain
type
s of
cha
nge,
m
etric
s ha
ve b
een
deve
lope
d to
iden
tify
stre
ssor
effe
cts,
low
var
ianc
e w
ithin
a s
yste
m; d
ata
avai
labi
lity
gene
rally
low
, sa
mpl
es s
pora
dic
spat
ially
, som
e lo
ng-t
erm
alg
al s
peci
es d
ata
avai
labl
e fr
om h
isto
rical
and
cur
rent
sed
imen
t cor
es; c
hl a
us
ed a
mea
sure
of p
erip
hyto
n pr
oduc
tion;
hig
h fe
asib
ility
due
to h
igh
ease
of s
ampl
ing
and
low
cos
t, po
tent
ial f
or a
rchi
val
anal
ysis
Phyt
opla
nkto
nM
ediu
mH
igh
They
are
the
base
of t
he fo
od w
eb, s
ensi
tive
to c
hang
e, d
iagn
ostic
of c
erta
in ty
pes
of c
hang
e, m
etric
s ha
ve b
een
deve
lope
d to
iden
tify
stre
ssor
effe
cts,
low
var
ianc
e w
ithin
a s
yste
m; s
ome
long
term
mon
itorin
g da
ta a
vaila
ble.
His
toric
al
sedi
men
t cor
e da
ta, a
nd w
ater
col
umn.
Chl
a e
stim
ates
from
sat
ellit
e da
ta a
nd in
situ
pro
bes.
Zoop
lank
ton
Hig
hH
igh
Food
for h
ighe
r tro
phic
leve
ls, i
mpo
rtan
t con
sum
ers
and
seco
ndar
y pr
oduc
ers
in th
e fo
od w
eb; c
omm
unity
str
uctu
re
refle
cts
envi
ronm
enta
l cha
nges
; eas
y to
sam
ple
and
fairl
y ea
sy to
iden
tify;
som
e lo
ng te
rm m
onito
ring
data
ava
ilabl
e,
sedi
men
t cor
es c
ould
be
used
for h
isto
rical
dat
a.
Bact
eria
/fun
giLo
w
Med
ium
Pela
gic
bact
eria
may
be
impo
rtan
t as
indi
cato
rs o
f cha
nge
or s
tres
sor e
ffect
s, re
late
d to
pro
cess
es s
uch
as m
etab
olis
m a
nd
deco
mpo
sitio
n an
d m
ay b
e ca
ptur
ed in
thos
e pr
oces
ses,
unkn
own
if m
etric
s cu
rren
tly e
xist
with
the
exce
ptio
n of
e. c
oli,
gene
ral l
ack
of k
now
ledg
e an
d ex
pert
s; d
ata
avai
labi
lity
quite
low
spa
tially
and
tem
pora
lly; h
igh
ease
of s
ampl
ing,
but
m
ay b
e di
fficu
lt to
pro
cess
/iden
tify
sam
ples
, DN
A b
arco
ding
may
mak
e sa
mpl
e id
entifi
catio
n ea
sier
in th
e fu
ture
but
may
no
t be
inco
rpor
ated
into
mon
itorin
g so
on. S
ampl
es a
re e
asy
to c
olle
ct a
nd a
rchi
ve, d
ifficu
lt to
pro
cess
and
iden
tify.
With
im
prov
ed te
chni
ques
, sho
uld
cons
ider
for f
utur
e sa
mpl
ing
prog
ram
s. Co
uld
be im
port
ant t
echn
ique
to id
entif
y ca
rbon
so
urce
cha
nges
. Mor
e in
form
atio
n ne
eded
to a
sses
s fu
ngi.

98
Foca
l Eco
syst
em
Com
pone
nt (F
EC)
Rank
(lo
w, m
ediu
m, h
igh
prio
rity
)Ju
stifi
cati
on fo
r Ran
kIn
itia
l as
sess
men
tFu
ture
m
onit
orin
g
Path
ogen
sLo
wLo
wM
ay n
ot b
e im
port
ant a
s in
dica
tors
of c
hang
e or
str
esso
r effe
cts,
unkn
own
if m
etric
s cu
rren
tly e
xist
, gen
eral
lack
of
know
ledg
e an
d ex
pert
s; d
ata
avai
labi
lity
quite
low
spa
tially
and
tem
pora
lly; h
igh
ease
of s
ampl
ing,
but
may
be
diffi
cult
to
proc
ess/
iden
tify
sam
ples
Mac
roph
ytes
Med
ium
Hig
hM
ore
impo
rtan
t in
sub/
low
Arc
tic re
gion
s, no
t cur
rent
ly im
port
ant i
n hi
gh A
rctic
, but
impo
rtan
ce m
ay in
crea
se w
ith
war
min
g; m
oder
ate
impo
rtan
ce a
s ha
bita
t; m
ay re
flect
nut
rient
cha
nges
, but
qua
ntita
tive
sam
plin
g m
ay b
e di
fficu
lt an
d m
etho
ds m
ay n
ot b
e in
pla
ce; d
ata
avai
labi
lity
low
to n
on-e
xist
ent;
hist
oric
ally
not
incl
uded
in m
onito
ring,
beg
inni
ng to
be
incl
uded
in E
urop
ean
sam
plin
g
Ripa
rian
vege
tatio
nLo
wLo
wM
ay b
e a
link
to Te
rres
tria
l EM
G; r
emot
e se
nsin
g m
ay b
e po
ssib
le th
ough
reso
lutio
n is
cur
rent
ly a
n is
sue
(if re
solu
tion
incr
ease
s, m
ay b
ecom
e hi
gh p
riorit
y)
Aqua
tic b
irds
Med
ium
Hig
hM
ake
use
of th
e ha
bita
t for
feed
ing/
hab
itat,
may
be
impo
rtan
t for
incr
easi
ng p
rodu
ctiv
ity in
sm
all l
akes
and
wet
land
s, us
e as
a d
iagn
ostic
indi
cato
r of c
hang
e is
que
stio
nabl
e be
caus
e of
larg
e ha
bita
t ran
ge (m
igra
tion)
, lin
k to
Terr
estr
ial
EMG
(and
may
be
an F
EC fo
r the
m ra
ther
than
for u
s); s
ome
data
exi
st o
n ge
ese,
som
e hi
stor
ical
sur
veys
may
exi
st (b
y ho
bbyi
sts,
for e
xam
ple)
, but
spa
tial s
cale
of d
ata
may
be
quite
hig
h in
som
e ca
ses;
hig
h fe
asib
ility
bec
ause
hig
h ea
se o
f sa
mpl
ing
and
low
cos
t, co
nnec
tion
to c
itize
n m
onito
ring.
Pot
entia
l cha
rism
atic
spe
cies
.
Aqua
tic m
amm
als
Low
Med
ium
Mak
e us
e of
the
habi
tat f
or fe
edin
g, im
port
ant f
or h
uman
pop
ulat
ions
, but
impo
rtan
ce a
s a
diag
nost
ic in
dica
tor o
f cha
nge
in la
kes
is u
nkno
wn;
dat
a su
rvey
s m
ay b
e lim
ited,
dat
a av
aila
bilit
y is
unk
now
n; c
onne
ctio
n to
citi
zen
mon
itorin
g
Com
mun
ity
met
abol
ism
Low
Med
ium
Impo
rtan
t asp
ect o
f eco
syst
em fu
nctio
n; d
ata
are
beco
min
g ea
sier
to c
olle
ct b
ecau
se o
f dat
a so
ndes
, but
may
be
diffi
cult
to e
stim
ate
for t
he h
igh
Arc
tic (e
asie
r for
low
and
sub
-Arc
tic);
data
cur
rent
ly b
eing
col
lect
ed in
som
e ar
eas
(in s
itu D
OM
m
onito
ring,
rela
te c
olor
ed D
OM
(cD
OM
) to
bioa
vaila
bilit
y to
get
wat
er c
olum
n re
spira
tion,
idea
is to
rela
te th
e cD
OM
to
rem
ote
sens
ing,
but
few
dat
a cu
rren
tly e
xist
, mor
e da
ta w
ill b
e av
aila
ble
in th
e ne
ar fu
ture
and
in s
itu D
OM
mon
itorin
g m
ay b
ecom
e pa
rt o
f rou
tine
mon
itorin
g w
hile
mat
eria
l bre
akdo
wn
may
be
mor
e lim
ited
Dec
ompo
sitio
nLo
wLo
wIm
port
ant a
spec
t of e
cosy
stem
func
tion;
but
few
dat
a cu
rren
tly e
xist
, mor
e da
ta w
ill b
e av
aila
ble
in th
e ne
ar fu
ture
Trop
hic
stru
ctur
e/en
ergy
flow
/foo
d w
ebs
Med
ium
Med
ium
Impo
rtan
t for
com
mun
ity fu
nctio
n an
d bi
odiv
ersi
ty, u
sefu
l to
dete
ct c
hang
es w
ithin
and
am
ong
syst
ems,
coul
d be
use
ful
for a
sses
smen
t of t
arge
ted
spec
ies
to id
entif
y en
ergy
flow
(ben
thic
vs.
pela
gic,
mar
ine
vs. f
resh
wat
er);
stab
le is
otop
e an
alys
is b
ecom
ing
mor
e co
mm
on a
s it
beco
mes
che
aper
to d
o, b
ut u
nlik
ely
to b
ecom
e pa
rt o
f rou
tine
mon
itorin
g (m
ore
likel
y to
con
tinue
as
part
of r
esea
rch
proj
ects
); fe
w d
ata
curr
ently
exi
st; m
ay lo
ok a
t the
dat
a th
at e
xist
in c
urre
nt a
nd
futu
re a
naly
ses,
but u
nlik
ely
to a
dd to
the
data
thro
ugh
futu
re m
onito
ring.
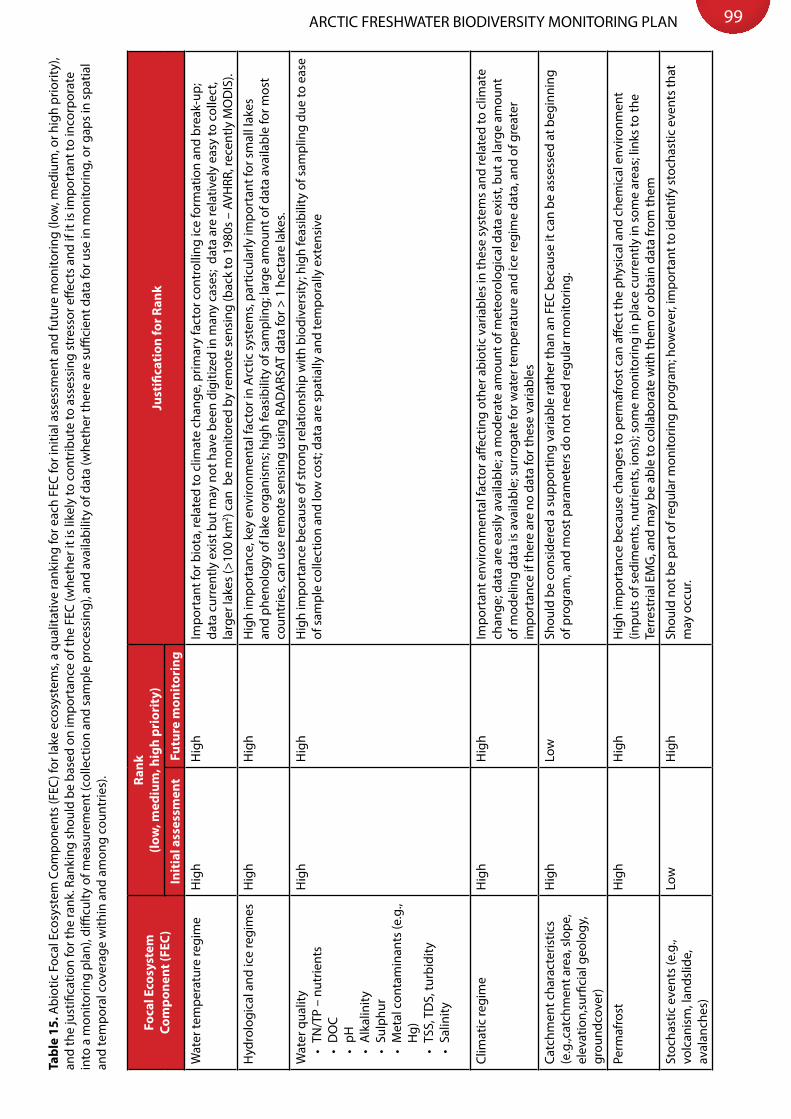
99ARCTIC FRESHWATER BIODIVERSITY MONITORING PLAN
Tabl
e 15
. Abi
otic
Foc
al E
cosy
stem
Com
pone
nts
(FEC
) for
lake
eco
syst
ems,
a qu
alita
tive
rank
ing
for e
ach
FEC
for i
nitia
l ass
essm
ent a
nd fu
ture
mon
itorin
g (lo
w, m
ediu
m, o
r hig
h pr
iorit
y),
and
the
just
ifica
tion
for t
he ra
nk. R
anki
ng s
houl
d be
bas
ed o
n im
port
ance
of t
he F
EC (w
heth
er it
is li
kely
to c
ontr
ibut
e to
ass
essi
ng s
tres
sor e
ffect
s an
d if
it is
impo
rtan
t to
inco
rpor
ate
into
a m
onito
ring
plan
), di
fficu
lty o
f mea
sure
men
t (co
llect
ion
and
sam
ple
proc
essi
ng),
and
avai
labi
lity
of d
ata
(whe
ther
ther
e ar
e su
ffici
ent d
ata
for u
se in
mon
itorin
g, o
r gap
s in
spa
tial
and
tem
pora
l cov
erag
e w
ithin
and
am
ong
coun
trie
s).
Foca
l Eco
syst
em
Com
pone
nt (F
EC)
Rank
(lo
w, m
ediu
m, h
igh
prio
rity
)Ju
stifi
cati
on fo
r Ran
kIn
itia
l ass
essm
ent
Futu
re m
onit
orin
g
Wat
er te
mpe
ratu
re re
gim
eH
igh
Hig
hIm
port
ant f
or b
iota
, rel
ated
to c
limat
e ch
ange
, prim
ary
fact
or c
ontr
ollin
g ic
e fo
rmat
ion
and
brea
k-up
; da
ta c
urre
ntly
exi
st b
ut m
ay n
ot h
ave
been
dig
itize
d in
man
y ca
ses;
dat
a ar
e re
lativ
ely
easy
to c
olle
ct,
larg
er la
kes
(>10
0 km
2 ) can
be
mon
itore
d by
rem
ote
sens
ing
(bac
k to
198
0s –
AVH
RR, r
ecen
tly M
OD
IS).
Hyd
rolo
gica
l and
ice
regi
mes
Hig
h
Hig
hH
igh
impo
rtan
ce, k
ey e
nviro
nmen
tal f
acto
r in
Arc
tic s
yste
ms,
part
icul
arly
impo
rtan
t for
sm
all l
akes
an
d ph
enol
ogy
of la
ke o
rgan
ism
s; h
igh
feas
ibili
ty o
f sam
plin
g; la
rge
amou
nt o
f dat
a av
aila
ble
for m
ost
coun
trie
s, ca
n us
e re
mot
e se
nsin
g us
ing
RAD
ARS
AT d
ata
for >
1 h
ecta
re la
kes.
Wat
er q
ualit
y•
TN/T
P –
nutr
ient
s•
DO
C•
pH•
Alk
alin
ity•
Sulp
hur
•M
etal
con
tam
inan
ts (e
.g.,
Hg)
•TS
S, T
DS,
turb
idity
•Sa
linity
Hig
hH
igh
Hig
h im
port
ance
bec
ause
of s
tron
g re
latio
nshi
p w
ith b
iodi
vers
ity; h
igh
feas
ibili
ty o
f sam
plin
g du
e to
eas
e of
sam
ple
colle
ctio
n an
d lo
w c
ost;
data
are
spa
tially
and
tem
pora
lly e
xten
sive
Clim
atic
regi
me
Hig
hH
igh
Impo
rtan
t env
ironm
enta
l fac
tor a
ffect
ing
othe
r abi
otic
var
iabl
es in
thes
e sy
stem
s an
d re
late
d to
clim
ate
chan
ge; d
ata
are
easi
ly a
vaila
ble;
a m
oder
ate
amou
nt o
f met
eoro
logi
cal d
ata
exis
t, bu
t a la
rge
amou
nt
of m
odel
ing
data
is a
vaila
ble;
sur
roga
te fo
r wat
er te
mpe
ratu
re a
nd ic
e re
gim
e da
ta, a
nd o
f gre
ater
im
port
ance
if th
ere
are
no d
ata
for t
hese
var
iabl
es
Catc
hmen
t cha
ract
eris
tics
(e.g
.,cat
chm
ent a
rea,
slo
pe,
elev
atio
n,su
rfici
al g
eolo
gy,
grou
ndco
ver)
Hig
hLo
wSh
ould
be
cons
ider
ed a
sup
port
ing
varia
ble
rath
er th
an a
n FE
C be
caus
e it
can
be a
sses
sed
at b
egin
ning
of
pro
gram
, and
mos
t par
amet
ers
do n
ot n
eed
regu
lar m
onito
ring.
Perm
afro
st
Hig
hH
igh
Hig
h im
port
ance
bec
ause
cha
nges
to p
erm
afro
st c
an a
ffect
the
phys
ical
and
che
mic
al e
nviro
nmen
t (in
puts
of s
edim
ents
, nut
rient
s, io
ns);
som
e m
onito
ring
in p
lace
cur
rent
ly in
som
e ar
eas;
link
s to
the
Terr
estr
ial E
MG
, and
may
be
able
to c
olla
bora
te w
ith th
em o
r obt
ain
data
from
them
Stoc
hast
ic e
vent
s (e
.g.,
volc
anis
m, l
ands
lide,
av
alan
ches
)
Low
Hig
hSh
ould
not
be
part
of r
egul
ar m
onito
ring
prog
ram
; how
ever
, im
port
ant t
o id
entif
y st
ocha
stic
eve
nts
that
m
ay o
ccur
.

100
Tabl
e 16
. Bio
tic F
ocal
Eco
syst
em C
ompo
nent
s (F
EC) f
or ri
ver e
cosy
stem
s, a
qual
itativ
e ra
nkin
g fo
r eac
h FE
C (lo
w, m
ediu
m, o
r hig
h pr
iorit
y), a
nd th
e ju
stifi
catio
n fo
r the
rank
. Ran
king
sh
ould
be
base
d on
impo
rtan
ce o
f the
FEC
(whe
ther
it is
like
ly to
con
trib
ute
to a
sses
sing
str
esso
r effe
cts
and
if it
is im
port
ant t
o in
corp
orat
e in
to a
mon
itorin
g pl
an),
diffi
culty
of
mea
sure
men
t (co
llect
ion
and
sam
ple
proc
essi
ng),
and
avai
labi
lity
of d
ata
(whe
ther
ther
e ar
e su
ffici
ent d
ata
for u
se in
mon
itorin
g, o
r gap
s in
spa
tial a
nd te
mpo
ral c
over
age
with
in a
nd
amon
g co
untr
ies)
.
Foca
l Eco
syst
em
Com
pone
nt (F
EC)
Rank
(lo
w, m
ediu
m, h
igh
prio
rity
)Ju
stifi
cati
on fo
r Ran
kIn
itia
l Ass
essm
ent
Futu
re
Mon
itor
ing
Fish
Hig
hH
igh
Hig
h fe
asib
ility
: med
ium
-hig
h ea
se o
f sam
plin
g an
d lo
w c
ost o
f sam
plin
g; s
ome
para
met
ers/
indi
ces
may
not
be
sen
sitiv
e in
dica
tors
of c
hang
e, th
ey c
over
a ra
nge
of im
port
ance
as
diag
nost
ic in
dica
tors
of c
hang
e, d
elay
ed
resp
onse
to c
hang
e; p
rovi
de in
form
atio
n on
con
nect
ivity
and
larg
e-sc
ale
patt
erns
(mig
rato
ry) a
nd re
flect
loca
l co
nditi
ons
and
smal
l-sca
le p
atte
rns
(non
-mig
rato
ry),
low
spe
cies
rich
ness
of m
igra
tory
but
hig
h sp
ecie
s ric
hnes
s of
no
n-m
igra
tory
fish
; som
e da
ta g
aps,
but g
ener
ally
hig
h da
ta a
vaila
bilit
y (s
patia
lly a
nd te
mpo
rally
, inc
ludi
ng lo
ng-
term
gov
ernm
ent d
atas
ets)
for m
igra
tory
fish
, low
er d
ata
avai
labi
lity
for n
on-m
igra
tory
fish
; hig
h ec
onom
ic a
nd
soci
al v
alue
, hig
h im
port
ance
to re
gion
al p
eopl
e as
a fo
od re
sour
ce
Bent
hic
mac
roin
vert
ebra
tes
Hig
hH
igh
Hig
h im
port
ance
bec
ause
of h
igh
spec
ies
richn
ess,
refle
ct lo
cal c
ondi
tions
, im
port
ant t
o fo
od w
eb, s
ensi
tive
to c
hang
e, d
iagn
ostic
of c
erta
in ty
pes
of c
hang
e, m
etric
s ha
ve b
een
deve
lope
d to
iden
tify
driv
er e
ffect
s; d
ata
avai
labi
lity
rang
es fr
om s
pora
dic
to g
ood
spat
ial c
over
age,
litt
le lo
ng-t
erm
dat
a; h
igh
feas
ibili
ty d
ue to
hig
h ea
se o
f sa
mpl
ing
and
low
cos
t
Bent
hic
alga
eM
ediu
m (l
ow d
ata
avai
labi
lity)
Hig
hH
igh
impo
rtan
ce b
ecau
se th
ey a
re th
e ba
se o
f the
food
web
, sen
sitiv
e to
cha
nge,
dia
gnos
tic o
f cer
tain
type
s of
ch
ange
, met
rics
have
bee
n de
velo
ped
to id
entif
y dr
iver
effe
cts,
low
var
ianc
e w
ithin
a s
yste
m; d
ata
avai
labi
lity
gene
rally
low
, sam
ples
spo
radi
c sp
atia
lly, l
ittle
long
-ter
m d
ata,
muc
h da
ta e
xist
as
chlo
roph
yll a
mea
sure
men
ts
rath
er th
an a
s sp
ecie
s co
unts
; hig
h fe
asib
ility
due
to h
igh
ease
of s
ampl
ing
and
low
cos
t, po
tent
ial f
or a
rchi
val
anal
ysis
Bact
eria
/fun
giLo
wLo
wM
ay n
ot b
e im
port
ant a
s in
dica
tors
of c
hang
e or
str
esso
r effe
cts,
rela
ted
to p
roce
sses
suc
h as
met
abol
ism
and
de
com
posi
tion
and
may
be
capt
ured
in th
ose
proc
esse
s, un
know
n if
met
rics
curr
ently
exi
st w
ith th
e ex
cept
ion
of e
. col
i, ge
nera
l lac
k of
kno
wle
dge
and
expe
rts;
dat
a av
aila
bilit
y qu
ite lo
w s
patia
lly a
nd te
mpo
rally
; hig
h ea
se o
f sa
mpl
ing,
but
may
be
diffi
cult
to p
roce
ss/id
entif
y sa
mpl
es, D
NA
bar
codi
ng m
ay m
ake
sam
ple
iden
tifica
tion
easi
er
in th
e fu
ture
but
may
not
be
inco
rpor
ated
into
mon
itorin
g so
on
Path
ogen
sLo
wLo
wM
ay n
ot b
e im
port
ant a
s in
dica
tors
of c
hang
e or
str
esso
r effe
cts,
unkn
own
if m
etric
s cu
rren
tly e
xist
, gen
eral
lack
of
kno
wle
dge
and
expe
rts;
dat
a av
aila
bilit
y qu
ite lo
w s
patia
lly a
nd te
mpo
rally
; hig
h ea
se o
f sam
plin
g, b
ut m
ay b
e di
fficu
lt to
pro
cess
/iden
tify
sam
ples
Bryo
phyt
es/
mac
roph
ytes
Low
Med
ium
Mod
erat
e im
port
ance
as
habi
tat,
may
refle
ct n
utrie
nt c
hang
es, b
ut q
uant
itativ
e sa
mpl
ing
may
be
diffi
cult
and
met
hods
may
not
be
in p
lace
; dat
a av
aila
bilit
y lo
w to
non
-exi
sten
t; hi
stor
ical
ly n
ot in
clud
ed in
mon
itorin
g,
begi
nnin
g to
be
incl
uded
in E
urop
ean
sam
plin
g

101ARCTIC FRESHWATER BIODIVERSITY MONITORING PLAN
Foca
l Eco
syst
em
Com
pone
nt (F
EC)
Rank
(lo
w, m
ediu
m, h
igh
prio
rity
)Ju
stifi
cati
on fo
r Ran
kIn
itia
l Ass
essm
ent
Futu
re
Mon
itor
ing
Ripa
rian
vege
tatio
nM
ediu
mH
igh
(par
ticul
arly
if
rem
ote
sens
ing
reso
lutio
n im
prov
es)
Impo
rtan
t for
hab
itat s
tabi
lity,
hab
itat c
ondi
tion
(for fi
sh),
may
be
a lin
k to
Terr
estr
ial E
MG
; som
e ge
nera
l dat
a do
exi
st (r
ough
des
crip
tions
), ac
tual
dat
a av
aila
bilit
y m
ay b
e hi
gh fo
r som
e ar
eas
beca
use
hist
oric
al s
urve
ys
by b
otan
ists
may
incl
ude
ripar
ian
vege
tatio
n; in
clud
ed in
som
e Eu
rope
an m
onito
ring
prog
ram
s as
a ro
ugh
desc
riptio
n, c
ould
be
incl
uded
in m
ore
deta
il in
futu
re m
onito
ring
prog
ram
s, re
mot
e se
nsin
g m
ay b
e po
ssib
le
thou
gh re
solu
tion
is c
urre
ntly
an
issu
e (if
reso
lutio
n in
clud
es, m
ay b
ecom
e hi
gh p
riorit
y)
Aqua
tic b
irds
Low
Med
ium
Mak
e us
e of
the
habi
tat f
or fe
edin
g, b
ut m
ay b
e m
ore
impo
rtan
t for
lake
s an
d w
etla
nds
than
for r
iver
s, us
e as
a
diag
nost
ic in
dica
tor o
f cha
nge
is q
uest
iona
ble
beca
use
of la
rge
habi
tat r
ange
(mig
ratio
n), l
ink
to Te
rres
tria
l EM
G
(and
may
be
an F
EC fo
r the
m ra
ther
than
for u
s); s
ome
data
exi
st o
n ha
rlequ
in d
ucks
, som
e hi
stor
ical
sur
veys
may
ex
ist (
by h
obby
ists
, for
exa
mpl
e), b
ut s
cale
may
be
quite
hig
h in
som
e ca
ses;
hig
h fe
asib
ility
bec
ause
hig
h ea
se o
f sa
mpl
ing
and
low
cos
t, co
nnec
tion
to c
itize
n m
onito
ring
Aqua
tic m
amm
als
Low
Low
Mak
e us
e of
the
habi
tat f
or fe
edin
g, im
port
ant f
or h
uman
pop
ulat
ions
, but
impo
rtan
ce a
s a
diag
nost
ic in
dica
tor
of c
hang
e in
rive
rs is
unk
now
n; d
ata
surv
eys
may
be
limite
d, d
ata
avai
labi
lity
is u
nkno
wn;
con
nect
ion
to c
itize
n m
onito
ring
Com
mun
ity
met
abol
ism
Low
Med
ium
Impo
rtan
t asp
ect o
f eco
syst
em fu
nctio
n; d
ata
are
beco
min
g ea
sier
to c
olle
ct b
ecau
se o
f dat
a so
ndes
, but
may
be
diffi
cult
to e
stim
ate
for t
he h
igh
Arc
tic (e
asie
r for
low
and
sub
-Arc
tic);
data
cur
rent
ly b
eing
col
lect
ed in
som
e ar
eas
(in s
itu D
OM
mon
itorin
g, re
late
col
ored
DO
M (c
DO
M) t
o bi
oava
ilabi
lity
to g
et w
ater
col
umn
resp
iratio
n, id
ea is
to
rela
te th
e cD
OM
to re
mot
e se
nsin
g, b
ut c
anno
t be
done
for s
mal
l str
eam
s; le
af o
r cot
ton
strip
bre
akdo
wn
may
be
bett
er fo
r sm
all s
trea
ms)
but
few
dat
a cu
rren
tly e
xist
, mor
e da
ta w
ill b
e av
aila
ble
in th
e ne
ar fu
ture
and
in s
itu D
OM
m
onito
ring
may
bec
ome
part
of r
outin
e m
onito
ring
whi
le m
ater
ial b
reak
dow
n m
ay b
e m
ore
limite
d
Dec
ompo
sitio
nLo
wM
ediu
mIm
port
ant a
spec
t of e
cosy
stem
func
tion;
dat
a ar
e be
com
ing
easi
er to
col
lect
bec
ause
of d
ata
sond
es, b
ut m
ay b
e di
fficu
lt to
est
imat
e fo
r the
hig
h A
rctic
(eas
ier f
or lo
w a
nd s
ub-A
rctic
); da
ta c
urre
ntly
bei
ng c
olle
cted
in s
ome
area
s (in
situ
DO
M m
onito
ring,
rela
te c
olor
ed D
OM
(cD
OM
) to
bioa
vaila
bilit
y to
get
wat
er c
olum
n re
spira
tion,
idea
is to
re
late
the
cDO
M to
rem
ote
sens
ing,
but
can
not b
e do
ne fo
r sm
all s
trea
ms;
leaf
or c
otto
n st
rip b
reak
dow
n m
ay b
e be
tter
for s
mal
l str
eam
s) b
ut fe
w d
ata
curr
ently
exi
st, m
ore
data
will
be
avai
labl
e in
the
near
futu
re a
nd in
situ
DO
M
mon
itorin
g m
ay b
ecom
e pa
rt o
f rou
tine
mon
itorin
g w
hile
mat
eria
l bre
akdo
wn
may
be
mor
e lim
ited
Trop
hic
stru
ctur
e/en
ergy
flow
/foo
d w
ebs
Low
Low
Impo
rtan
t for
com
mun
ity fu
nctio
n an
d bi
odiv
ersi
ty, u
sefu
l to
dete
ct c
hang
es w
ithin
and
am
ong
syst
ems;
sta
ble
isot
ope
anal
ysis
bec
omin
g m
ore
com
mon
as
it be
com
es c
heap
er to
do,
but
unl
ikel
y to
bec
ome
part
of r
outin
e m
onito
ring
(mor
e lik
ely
to c
ontin
ue a
s pa
rt o
f res
earc
h pr
ojec
ts);
few
dat
a cu
rren
tly e
xist
; may
look
at t
he d
ata
that
ex
ist i
n cu
rren
t and
futu
re a
naly
ses,
but u
nlik
ely
to a
dd to
the
data
thro
ugh
futu
re m
onito
ring

102
Tabl
e 17
. Abi
otic
Foc
al E
cosy
stem
Com
pone
nts
(FEC
) for
rive
r eco
syst
ems,
a qu
alita
tive
rank
ing
for e
ach
FEC
(low
, med
ium
, or h
igh
prio
rity)
, and
the
just
ifica
tion
for t
he ra
nk. R
anki
ng
shou
ld b
e ba
sed
on im
port
ance
of t
he F
EC (w
heth
er it
is li
kely
to c
ontr
ibut
e to
ass
essi
ng s
tres
sor e
ffect
s an
d if
it is
impo
rtan
t to
inco
rpor
ate
into
a m
onito
ring
plan
), di
fficu
lty o
f m
easu
rem
ent (
colle
ctio
n an
d sa
mpl
e pr
oces
sing
), an
d av
aila
bilit
y of
dat
a (w
heth
er th
ere
are
suffi
cien
t dat
a fo
r use
in m
onito
ring,
or g
aps
in s
patia
l and
tem
pora
l cov
erag
e w
ithin
and
am
ong
coun
trie
s).
Foca
l Eco
syst
em C
ompo
nent
(FEC
)
Rank
(lo
w, m
ediu
m, h
igh
prio
rity
)Ju
stifi
cati
on fo
r Ran
kIn
itia
l A
sses
smen
tFu
ture
Mon
itor
ing
Wat
er te
mpe
ratu
re re
gim
eM
ediu
mH
igh
Impo
rtan
t for
bio
ta, r
elat
ed to
clim
ate
chan
ge, p
rimar
y fa
ctor
con
trol
ling
ice
form
atio
n an
d br
eak-
up;
data
cur
rent
ly e
xist
but
may
not
hav
e be
en d
igiti
zed
in m
any
case
s; lo
ng-t
erm
dat
a ex
ist f
or N
ordi
c co
untr
ies,
but t
here
are
few
long
-ter
m d
ata
in N
orth
Am
eric
a; d
ata
are
rela
tivel
y ea
sy to
col
lect
Hyd
rolo
gica
l and
ice
regi
mes
Hig
hH
igh
Hig
h im
port
ance
, key
str
esso
r in
Arc
tic s
yste
ms;
hig
h fe
asib
ility
of s
ampl
ing;
larg
e am
ount
of d
ata
avai
labl
e fo
r mos
t cou
ntrie
s, da
taba
se is
gen
eral
ly s
kew
ed to
war
ds la
rge
river
s
Wat
er q
ualit
y
•TN
/TP
– nu
trie
nts
•
DO
C
•pH
•
Alk
alin
ity
•Su
lphu
r •
Met
al c
onta
min
ants
(e.g
., H
g)
•TS
S, T
DS,
turb
idity
•
Pers
iste
nt o
rgan
ic p
ollu
tant
s •
Salin
ity
Hig
hH
igh
Hig
h im
port
ance
bec
ause
of s
tron
g re
latio
nshi
p w
ith b
iodi
vers
ity; h
igh
feas
ibili
ty o
f sam
plin
g du
e to
ea
se o
f sam
ple
colle
ctio
n an
d lo
w c
ost;
data
are
spa
tially
and
tem
pora
lly e
xten
sive
Clim
atic
regi
me
Hig
hH
igh
Impo
rtan
t env
ironm
enta
l fac
tor a
ffect
ing
othe
r abi
otic
var
iabl
es in
thes
e sy
stem
s an
d re
late
d to
cl
imat
e ch
ange
; dat
a ar
e ea
sily
ava
ilabl
e; a
mod
erat
e am
ount
of m
eteo
rolo
gica
l dat
a ex
ist,
but a
larg
e am
ount
of m
odel
ing
data
is a
vaila
ble;
sur
roga
te fo
r dis
char
ge, w
ater
tem
pera
ture
, and
ice
regi
me
data
, and
of g
reat
er im
port
ance
if th
ere
are
no d
ata
for t
hese
var
iabl
es
Perm
afro
st
Hig
hH
igh
Hig
h im
port
ance
bec
ause
cha
nges
to p
erm
afro
st c
an a
ffect
the
phys
ical
and
che
mic
al e
nviro
nmen
t (in
puts
of s
edim
ents
, nut
rient
s, io
ns; b
ank
stab
ility
); so
me
mon
itorin
g in
pla
ce c
urre
ntly
in s
ome
area
s; li
nks
to th
e Te
rres
tria
l EM
G, a
nd m
ay b
e ab
le to
col
labo
rate
with
them
or o
btai
n da
ta fr
om th
em
Impo
rt/e
xpor
t (of
org
anic
mat
eria
l, se
dim
ent,
heat
ene
rgy,
etc
.)H
igh
Hig
hH
igh
impo
rtan
ce b
ecau
se it
refle
cts
chan
ges
in b
asin
s, w
ater
sou
rce,
cat
chm
ent c
hara
cter
istic
s an
d ha
s an
impo
rtan
t lin
k to
all
biot
a; d
ata
exis
t for
the
6 m
ajor
rive
rs (w
hich
are
loca
ted
in C
anad
a,
US,
Rus
sia)
for s
edim
ents
, car
bons
, dis
solv
ed s
olid
s (a
rctic
gro.
org)
, but
dat
a fo
r oth
er s
yste
ms
are
gene
rally
lack
ing;
futu
re m
onito
ring
shou
ld in
corp
orat
e ad
ditio
nal s
yste
ms
to e
xpan
d sp
atia
l co
vera
ge; h
igh
feas
ibili
ty o
f mea
sure
men
t (ca
n po
tent
ially
use
rem
ote
sens
ing
for l
arge
sys
tem
s),
unlik
ely
to s
ee in
crea
sed
data
for s
mal
l sys
tem
s. A
fter
som
e di
scus
sion
, it w
as d
ecid
ed th
at th
is F
EC,
thou
gh im
port
ant,
inco
rpor
ates
asp
ects
of t
he o
ther
FEC
s lis
ted,
and
ther
efor
e sh
ould
not
sta
nd a
s an
FE
C its
elf.
Rath
er, t
he im
port
/exp
ort o
f mat
eria
ls p
roba
bly
repr
esen
ts a
par
amet
er o
r ind
icat
or, u
sing
da
ta c
olle
cted
for t
he o
ther
abi
otic
FEC
s.
Stoc
hast
ic e
vent
s (e
.g.,v
olca
nism
, la
ndsl
ide,
ava
lanc
hes)
Low
Hig
hSh
ould
not
be
part
of r
egul
ar m
onito
ring
prog
ram
; how
ever
, im
port
ant t
o id
entif
y st
ocha
stic
eve
nts
that
may
occ
ur.

Appendix C. Monitoring Protocol Details

104
C.1 Three-tier approach
The sampling protocols are divided into three levels that are dependent upon cost efficiency, sampling practicality and monitoring relevance. The Level 1 protocols indicate the minimal sampling requirements to describe the FEC or indicator, and should be followed/included in a basic monitoring program. The Level 2 protocols describe the sampling requirements for additional indicators or describe more advanced sampling techniques for the basic indicators, and could be followed/included to enhance the basic monitoring program. Level 3 protocols are generally more advanced and may only be feasible for a few monitoring programs, but could be followed/included to further enhance the basic monitoring program.
C.2 Lake Monitoring Protocols
C.2.1 Biotic FECs
C.2.1.1 Plankton
C.2.1.1.1 Sampling protocols
The standard protocol for the Arctic is based largely on the protocols currently in use for sampling plankton in lakes.
Gear ► Level 1: Plankton nets for qualitative sampling. The nets should be mounted with a collection
bottle and a line long enough to reach through the entire water column (with the exception of very deep lakes). The mesh size should be close to 20 µm for phytoplankton and nanoflagellates, and 50 µm for zooplankton.
► Level 1: Water sampler for quantitative zooplankton measurements. Different types may be used according to national practice. Transparent cylindrical samplers are recommended and the volume taken per sample should be a least 2 liters.
Sampling scheme and sample analysis
Microbes (pico-eukaryotes, bacteria and Archaea; 0.2-2 um) ► Level 2: Flow cytometry or microscopy slides both yield biomass and size structure; production
rates (3H); community genomics is the most definitive approach for whole community analysis (taxonomy and functional genes).
Phytoplankton (>2 um) ► Level 1: Integrated total water column chlorophyll a or profiles at selected optical depths; if not
possible, prioritize the epilimnion. ► Level 1: Preserved sample for archived collections. Minimum 500 mL volume for preserved
samples. Samples should be preserved with Lugol’s solution (5%). ► Level 2: Microscopy (species level) of integrated total water column ► Level 3: HPLC (if liquid nitrogen or -80ºC freezer available) or flow cytometry can reveal high
taxonomic groups without microscopic detail. Primary production provides useful ancillary information (several techniques possible).
Zooplankton (> 50 um)Quantitative sampling
► Level 1: Integrated total water column samples; if not possible, prioritize the epilimnion. Minimum volume depends on the abundance, but less than 10 L is not suitable.
► Level 1: Estimate abundance and species distribution. Preserve samples for archived collections

105ARCTIC FRESHWATER BIODIVERSITY MONITORING PLAN
(e.g., with Lugol’s solution). ► Level 2: Biomass (length measurements), developmental stages. ► Level 3: Brood size, sex ratio, and lipids.
Qualitative sampling ► Level 1: Integrated total water column samples; if not possible, prioritize the epilimnion. ► Level 1: Estimate relative abundance and species distribution. Preserve samples for archived
collections (e.g., with Lugol’s solution) ► Level 2: Group- or taxon-specific biomass (length measurements), developmental stages. ► Level 3: Lipids, genetics, pigments (all require -80oC freezing).
C.2.1.2 Benthos
C.2.1.2.1 Sampling protocols
Benthic algae Sampling protocols for benthic algae in lakes are not well standardized across countries. In many cases, protocols may only refer to the collection of diatom samples, excluding macroalgae. For example, sampling of benthic algae in the US focuses on the collection of sediment cores and analysis of the uppermost layer of the core to assess diatom community composition (USEPA 2007). In several European countries, lake benthic algae protocols are in the process of being developed, and past sampling may be largely unstandardized.
The standard protocol for the Arctic is based largely on the few existing protocols for sampling algae on hard substrates (after the protocol for rivers) and soft substrates (using core sampling). With the development of standardized methods in more countries, and in particular across the EU, it may be necessary to reevaluate these recommendations in the future.
Gear ► Level 1: A brush to collect algal samples from rock/stone habitat (brush specifications should
follow national protocols), and preservative (e.g., formalin or lugol’s, ethanol for diatoms only). ► Level 1: To collect algae from soft substrate habitat (e.g., sand/silt), a sediment corer with a
rubber stopper and piston (i.e., 60-mL plastic syringe with the narrow tip removed to make a simple cylinder), metal or plastic spatula, rubber stopper and preservative (e.g., formalin or lugol’s, ethanol for diatoms only).
Sampling scheme ► Level 1: Semi-quantitative manual sampling of chlorophyll a from surficial sand, pebbles and
stones from a known area. Collected material should preferably be stored at -80ºC but can also be preserved in a known volume of 96% ethanol if later extractions are made in ethanol.
► Level 1: Quantitative sampling of benthic algae with a brush or scalpel from a measured and recorded area on 5-10 rocks/stones in the sampling area. Samples can be mixed to form a single composite sample. If no rocks are present, samples should be collected from any available hard substrate. Samples for taxonomic analysis should be preserved according to available protocols. Store samples for chlorophyll a at -80ºC if possible, or samples can also be preserved in a known volume of 96% ethanol if later extractions are made in ethanol.
► Level 1: Quantitative sampling of benthic algae using the coring device from 5-10 locations in the sampling area. Collect samples by pushing the core at least 5 cm into the sediments. Plug the open end of the corer with the rubber stopper, gently extract the core, and insert the syringe piston into the bottom or the core. Remove the rubber stopper and extrude the top 1 cm of sediment using the piston, then use the spatula to scrape the top 1 cm of sediment into the sampling jar. Samples can be mixed to form single composite sample. Store samples for chlorophyll a and algal taxonomy as described above.
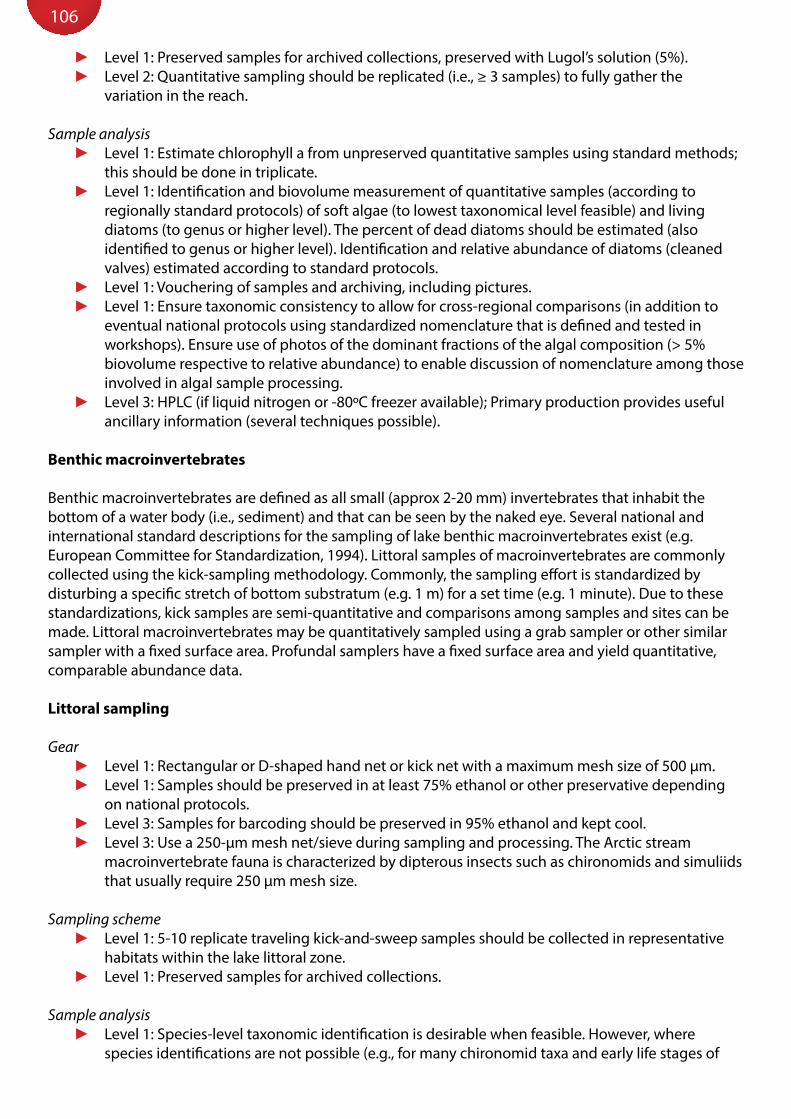
106
► Level 1: Preserved samples for archived collections, preserved with Lugol’s solution (5%). ► Level 2: Quantitative sampling should be replicated (i.e., ≥ 3 samples) to fully gather the
variation in the reach.
Sample analysis ► Level 1: Estimate chlorophyll a from unpreserved quantitative samples using standard methods;
this should be done in triplicate. ► Level 1: Identification and biovolume measurement of quantitative samples (according to
regionally standard protocols) of soft algae (to lowest taxonomical level feasible) and living diatoms (to genus or higher level). The percent of dead diatoms should be estimated (also identified to genus or higher level). Identification and relative abundance of diatoms (cleaned valves) estimated according to standard protocols.
► Level 1: Vouchering of samples and archiving, including pictures. ► Level 1: Ensure taxonomic consistency to allow for cross-regional comparisons (in addition to
eventual national protocols using standardized nomenclature that is defined and tested in workshops). Ensure use of photos of the dominant fractions of the algal composition (> 5% biovolume respective to relative abundance) to enable discussion of nomenclature among those involved in algal sample processing.
► Level 3: HPLC (if liquid nitrogen or -80ºC freezer available); Primary production provides useful ancillary information (several techniques possible).
Benthic macroinvertebrates
Benthic macroinvertebrates are defined as all small (approx 2-20 mm) invertebrates that inhabit the bottom of a water body (i.e., sediment) and that can be seen by the naked eye. Several national and international standard descriptions for the sampling of lake benthic macroinvertebrates exist (e.g. European Committee for Standardization, 1994). Littoral samples of macroinvertebrates are commonly collected using the kick-sampling methodology. Commonly, the sampling effort is standardized by disturbing a specific stretch of bottom substratum (e.g. 1 m) for a set time (e.g. 1 minute). Due to these standardizations, kick samples are semi-quantitative and comparisons among samples and sites can be made. Littoral macroinvertebrates may be quantitatively sampled using a grab sampler or other similar sampler with a fixed surface area. Profundal samplers have a fixed surface area and yield quantitative, comparable abundance data.
Littoral sampling
Gear ► Level 1: Rectangular or D-shaped hand net or kick net with a maximum mesh size of 500 µm. ► Level 1: Samples should be preserved in at least 75% ethanol or other preservative depending
on national protocols. ► Level 3: Samples for barcoding should be preserved in 95% ethanol and kept cool. ► Level 3: Use a 250-µm mesh net/sieve during sampling and processing. The Arctic stream
macroinvertebrate fauna is characterized by dipterous insects such as chironomids and simuliids that usually require 250 µm mesh size.
Sampling scheme ► Level 1: 5-10 replicate traveling kick-and-sweep samples should be collected in representative
habitats within the lake littoral zone. ► Level 1: Preserved samples for archived collections.
Sample analysis ► Level 1: Species-level taxonomic identification is desirable when feasible. However, where
species identifications are not possible (e.g., for many chironomid taxa and early life stages of

107ARCTIC FRESHWATER BIODIVERSITY MONITORING PLAN
other aquatic insects), genus- or family-level determinations are sufficient. Ensure taxonomic consistency to allow for cross-regional comparisons (recommended use of standardized nomenclature, e.g., Limnofauna Europaea, http://www.faunaeur.org/). Numerical abundance should be quantified for each taxon for calculation of community indices.
► Level 1: At least 5 samples should be processed to capture site variability. ► Level 2: If sub-sampling is used, it should follow standard procedures and should be tested
thoroughly for sampling bias. ► Level 2: Biomass should be estimated as wet weight or body length from preserved samples for
calculation of indices related to size/age structure and phenology. ► Level 3: Genetic analysis.
Profundal sampling
Gear ► Level 1: Grab or core samplers with fixed sample surface area. Sieve with approximately 500-µm
mesh size. ► Level 1: Samples should be preserved in at least 75% ethanol or other preservative depending
on national protocols. ► Level 3: Samples for barcoding should be preserved in 95% ethanol and kept cool. ► Level 3: Use a 250-µm mesh net/sieve during sampling and processing. The Arctic profundal
macroinvertebrate fauna is characterized by dipterous insects such as chironomids that may require 250 µm mesh size.
Sampling scheme ► Level 1: 5-10 replicate samples should be collected. The number of replicates depends on the
abundance of macroinvertebrates. Arctic profundals are usually very oligotrophic and density of the animals is low.
► Level 1: Preserved samples for archived collections.
Sample analysis ► Level 1: Species-level taxonomic identification is desirable when feasible. However, where
species identifications are not possible (e.g., for many chironomid taxa and early life stages of other aquatic insects), genus- or family-level determinations are sufficient. Ensure taxonomic consistency to allow for cross-regional comparisons (recommended use of standardized nomenclature, e.g., Limnofauna Europaea, http://www.faunaeur.org/). Numerical abundance should be quantified for each taxon for calculation of community indices.
► Level 2: If sub-sampling is used, it should follow standard procedure and should be tested thoroughly for sampling bias.
► Level 2: Biomass should be estimated as wet weight or body length from preserved samples for calculation of indices related to size/age structure and phenology.
► Level 3: Genetic analysis.
C.2.1.3 Fish
C.2.1.3.1 Sampling protocols
Sampling protocols vary according to fish species, habitat, gear type and logistical capabilities. Thus, to reduce costs and increase “data value”, fish sampling should be linked with other sampling activities (zooplankton, water chemistry, temperature, etc.). Capturing a suite of fish species is the initial step in sampling. Processing the fish according to standardized protocols and analysis of the resulting data provide additional information relevant to monitoring at several levels. Finally, further analysis of sub-samples through specialized techniques (e.g., genetics, stable isotopes) provides added insight to both structural and functional shifts in populations, species, and ecosystems.

108
Due to high catchability of large fish, sampling should be done carefully to avoid overexploitation of larger fish. Thus, the standardized net sampling procedure established for European countries is not recommended, and netting has to be adjusted to the low number of fish species present as well as the low fish density.
Depending on national protocols, survey nets differ in their specified mesh sizes. The Nordic survey nets, specially designed for more southern fish communities dominated by perch (Perca fluviatilis) and recommended by the EU, are 1.5 m deep, 30-33 m long and comprise 12 mesh sizes, ranging from 5 to 55 mm (knot to knot) (Appelberg 2000). Present studies in Svalbard use 8-45 mm meshes (Svenning et al. 2007). Older survey gillnets used in Svalbard, northern Scandinavia, Newfoundland, Labrador and the Canadian Arctic since the 1960s comprised 14 mesh sizes ranging from 6.3 to 75 mm knot to knot (Hammar & Filipsson 1985). It’s vital to continue the use of previous types of survey nets in monitoring series. When comparing fish biomass between different lakes and regions, the use of identical survey nets and standardized efforts in different depth zones is important, which is the main purpose of the new Nordic multi-mesh gillnet and the stratified sampling protocol with specified effort depending on the size and depth of a lake. The effort recommended in the Nordic protocol, however, should never be applied in surveys in low-productive lakes in the Arctic and Subarctic region.
Trapping in outlet rivers (in “open” lake systems) can be used to document the exact number of ascending fish (i.e., anadromous fish like arctic char) in the sampling year. Specific protocols for collecting fish in outlet rivers can be found in section C.3.2.3. In areas that are easily accessible, trapping in outlets could be conducted for 6 weeks, or every second week during a six week period. Ascending fish may be tagged (using fin clips or individual tags) for estimation of the amount of resident fish versus anadromous fish when conducting mark-recapture analysis within the lake after the river trapping.
Gear ► Level 1: Net(s) of regulation mesh size. Recommended nets include gillnets and fyke nets.
Sampling scheme ► Level 1: Use gillnets or fyke nets to collect fish following standard techniques. ► Level 2: Conduct mark-recapture by using nets for capturing/tagging larger fish and
electrofishing for capturing/tagging juveniles (see section C.3.2.3 for information on electrofishing). Nets have to be checked continuously and fish immediately removed (alive) for tagging and release. Tagging should be continued until recaptures include 25% of tagged fish.
► Level 2: Non-lethal gut content collection can be conducted using stomach lavage or other accepted method (see Kamler and Pope 2001).
► Level 2: Thirty resident/landlocked fish of each species should be sacrificed for analysis of parameters such as body condition, morphometrics, sex and sexual maturity state, gut content analysis, parasites, ageing, genetics, and contaminants.
Sample analysis ► Level 1: Species identification, length and weight of individual fish is measured, and sex recorded
when possible on external appearance. When sampling lakes with coregonids, special attention should be given to numbers of gillrakers, as these are important for taxonomic identification. Measurements of fish length (preferably fork length) should be recorded in millimeters, even if larger fish (> 100 mm) may be measured to the nearest 10 mm. Abundance of each species per catch is reported both as total recorded numbers and as numbers per m2.
► Level 2: Fish abundance (numbers and biomass) for each species should be estimated from mark-recapture data, for example, by using the Schnabel mark-recapture method (see Borgstrøm et al. 2010).
► Level 2: Size and age structure (based on ageing from otoliths) should be constructed as well as size-at-age relationships for each species.

109ARCTIC FRESHWATER BIODIVERSITY MONITORING PLAN
► Level 2: Sacrificed fish should be classified with respect to sex, maturity and color of flesh. When sampling coregonids, the number of gillrakers need to be counted. The number of cysts (plerocercoids) of the cestode genus Diphyllobothrium and possibly other ecto-parasites observed on organs in the body cavity should also be estimated.
► Level 2: For gut content analysis on sacrificed fish, stomachs should be cut at the upper esophagus and the pyloric sphincter and frozen with all contents.
► Level 2: Sagittal otoliths should be removed from the fish and preserved dry for ageing and possible strontium and stable isotope analysis. For certain fish species, such as whitefish, salmon and brown trout, scales have historically been used and may continue to be used for ageing.
► Level 3: Adipose fin, skin tissue, and/or gills should be removed and stored at 96 % ethanol for contaminant and genetic analysis.
C.2.1.4 Macrophytes
C.2.1.4.1 Sampling protocols
Some lakes have extensive plant growth (higher plants and especially mosses) throughout the lake; others have small, well-defined plant areas. Lakes with clear waters have high light transparency that can sustain plant growth up to 10-20 m depths. In most lakes, the aquatic plant population is relatively stable throughout the growing season. In some lakes, there is a definite pattern of succession. If the lake is shallow (less than 2 m), the plants in the littoral zone may be damaged and/or moved by ice through the ice-off period.
Gear ► Level 1: Aqua scope or similar viewing scope and depth meter to be used from a dingy (optimal)
or by walking. ► Level 2: A plant rake or ideally scuba diving equipment for biomass estimates or for surveys in
deep lakes. ► Level 3: Photo-documentation by divers.
Sampling scheme ► Level 1: Map the species distribution, assess the coverage and relative density of rooted plants
along transects. Take samples for species identification. The sample locations are transects from shore to shore and are defined on a lake-by-lake basis.
Sample analysis ► Level 1: Identify the species (use taxonomic expertise if possible, e.g., send samples to museums
or international experts), calculate areal coverage. ► Level 2: Determine biomass (dry weight) on an areal basis. ► Level 3: Growth rates estimates using O2-incubators. Epiphyte growth on macrophytes. Preserve
specimens for later (re)identification.
C.2.1.5 Aquatic birds
C.2.1.5.1 Sampling protocols
Aquatic birds are often already monitored if the site is part of existing terrestrial or marine monitoring programs. The data will typically include: species lists, abundance, productivity (recruitment), diets and phenology. If the site is not monitored for aquatic birds it should be included as part of the limnological program. The sampling protocol should include species distribution, number of birds and the time spent at the site. When continual sampling is possible, the date of first arrival and first hatch should also be included in the protocol. Monitoring is highly feasible because sampling using manual observation by binoculars is easy and low cost, and it can be done in connection with other sampling activities.

110
If only one sampling occasion is possible, data collection should optimally occur some time between hatching and fledging of birds, when they are more likely to make use of lakes (particularly ducks and geese). When only a single sampling occasion is possible, efforts should be made to ensure distinction between local breeding birds and migrants. If several sampling dates are possible, they could occur on a weekly/biweekly basis from the day of arrival to the day of departure.
Sampling scheme and sample analysis ► Level 1: Observation should take place from a location a short distance from the lake or under
cover to prevent the birds from fleeing. ► Level 1: Record abundance and species of resident and non-resident birds. ► Level 2: Record date for arrival and departure of aquatic bird species. Monitor breeding activity. ► Level 3: Estimate fecal production within a specified area using up-scaled Raunkjaer circles or
similar methods. Each plot should be 1-2 m2 and should be performed at least three times at different parts of the near-lake shore (typically 0-10 m from the water front).
C.2.2 Abiotic FECs
C.2.2.1 Water temperature regime
C.2.2.1.1 Sampling protocols
Gear ► Level 1: Thermistor or data logger for continuous measurement of temperature.
Sampling scheme and sample analysis ► Level 1: Measurements of surface (within upper 0.5 m) water temperatures during the open
water period on a daily or hourly basis with automated data loggers and accompanied by periodic manual measurements.
► Level 2: Measurements of vertical temperature profiles manually or with automated data loggers (using a surface and a bottom thermistor) in thermally stratified lakes. Depth of temperature measurements will vary depending on the position of the thermocline.
► Level 3: Incorporation of remotely sensed imagery to monitor surface water temperatures. Thermal infrared sensors onboard MODIS, AVHRR, and ASTER are capable of detecting “skin” temperatures in relatively large lakes (>50 km2).
C.2.2.2 Hydrologic and ice regimes
C.2.2.2.1 Sampling protocols
Specific protocols for evaluating the ice regime of lakes were developed by the ALISON project (http://www2.gi.alaska.edu/alison/).
Gear ► Level 1: Staff gauges or water level data loggers.
Sampling scheme and sample analysisLake levels
► Level 1: Daily water level measurements (staff gauge or loggers) during the entire ice-free season.
► Level 2: Continuous measurements using data loggers (pressure). ► Level 3: Remote sensing-based measurements of lake level.

111ARCTIC FRESHWATER BIODIVERSITY MONITORING PLAN
Surface area ► Level 1: Measurements of remote sensing imagery in late summer/fall. Imagery should ideally be
selected to be close to the dates used for sampling water chemistry and biota. ► Level 2: Surface area measurements should be done multiple times in the ice-free season (i.e.,
spring, summer, and fall). Retrospective analyses could be done for study lakes using archived images.
δ18O– δ2H isotopes ► Level 2: Integrated water column sample in 30 ml HDPE bottle, submit to isotope lab for
determination of oxygen and hydrogen isotope composition using conventional techniques.
Ice on / Ice off timing ► Level 1: Record the final disappearance of ice from a lake and the first occurrence of ice on lakes
from field-based observations. ► Level 2: Incorporate additional measures of freeze-up and break-up processes. For example,
inclusion of the initial breakup or the first appearance of open water on the ice surface. ► Level 2: Incorporation of satellite-based remotely sensed imagery in current monitoring
program and retrospective analysis of the timing of ice off and ice on. ► Level 3: Incorporation of field instrumentation (temperature data loggers and time-lapse
cameras) to monitor timing of ice on and ice off.
Ice thickness/growth ► Level 1: Late winter or early spring measurement reflecting annual maximum ice growth,
acquired by drilling holes in lake ice and measuring manually. ► Level 2: Multiple manual measurements throughout the ice growth period. ► Level 3: Incorporation of automated sensors to measure ice growth. ► Level 3: Incorporation of a time series of Synthetic Aperture Radar (SAR) imagery to monitor ice
growth by identifying formation of bottom fast ice in lakes with known bathymetry.
Light transmission ► Level 1: Survey of snow coverage from satellite pictures and/or land based surveillance cameras. ► Level 2: Characterization of the ice structure through boreholes and/or ice cores. ► Level 3: Manual measurements of light transmission through the ice and snow.
C.2.2.3 Water quality
C.2.2.3.1 Sampling protocols
Gear ► Level 1: A water quality multisonde should be used to estimate values on-site for all possible
variables. Standard variables are temperature, conductivity and oxygen, while pH and florescence (chlorophyll) can additionally be measured. Water samples should be collected for the remaining variables.
Sampling scheme and sample analysis ► Level 1: Sampling should occur minimally once a year in late summer/fall. To control for seasonal
and diurnal patterns in water chemistry and the community structure of zooplankton and benthic invertebrates, the timing of sample events should be kept as constant as possible.
► Level 2: Three sampling trips in the ice-free season (spring, mid/late summer, fall), if possible. ► Level 3: Under ice measurements of water chemistry.

112
Nutrients and DOC ► Level 1: Integrated water column samples should be analyzed for total dissolved nitrogen and
phosphorus and DOC. For measurement of dissolved nutrients, exclude particulate matter from the water by filtering through a glass filter fiber (GF/F - 0.7 µm).
► Level 2: Total Kjeldahl nitrogen, nitrate-nitrite measurements.
CDOM ► Level 1: Integrated water column sample - stored in the cold (4°C) and dark until analysis using a
fluorometer (3-D scans for Parafac). ► Level 2: Monitoring surface CDOM using remote sensing-based measurements.
pH ► Level 1: Integrated water column samples should be analyzed for pH using a water quality sonde
when conducting site visits. ► Level 2: Continuous measurements with deployed data loggers.
Alkalinity ► Level 1: Integrated water column samples should be collected for alkalinity measurements back
at the lab.
Major Ions ► Level 1: Integrated water column samples analyzed for Ca, SO4, Na, K, Mg, Cl.
Total suspended solids and turbidity ► Level 1: Fixed-depth water column samples (e.g., at 1 m below the surface) should be submitted
for TSS measurements. ► Level 2: Turbidity measurements (NTU) of fixed-depth water column samples. ► Level 3: Remote sensing-based measurements of turbidity.
Dissolved oxygen ► Level 1: Bottom dissolved oxygen measurements (mg/L) using a probe. ► Level 2: Vertical profile of oxygen in stratified lakes. ► Level 3: Continuous measurements of oxygen using data loggers.
Conductivity ► Level 1: Integrated water column samples should be analyzed for conductivity using a water
quality sonde when conducting site visits. ► Level 2: Continuous measurements with deployed data loggers. ► Level 3: Vertical profile in stratified lakes.
Water clarity (secchi depth) ► Level 1: Mean secchi depth measurements ► Level 2: Estimates of color e.g., OD375nm.
C.2.2.4 Climatic regime
C.2.2.4.1 Sampling protocols
Sampling scheme and sample analysis
Solar radiation, UV, PAR ► Level 1: Measurements of light intensity (PAR, lux) from a nearby climate station (optimally
within 5 km).

113ARCTIC FRESHWATER BIODIVERSITY MONITORING PLAN
► Level 2: Vertical profiles of PAR (photosynthetically active radiation), UV-A and UV-B as well as mean percent irradiance calculated for 320 nm and 380 nm.
► Level 3: Spectral characteristics.
Meteorological and climate variables ► Level 2: Measurements from a meteorological station in the lake catchment (optimally within 5
km).
Surface air temperature ► Level 1: Estimates of daily mean temperature (°C). ► Level 2: Continuous measurements.
Precipitation, relative humidity, wind speed and direction ► Level 1: Estimates of daily total precipitation (mm), relative humidity, mean wind speed (km/h)
and mean wind direction (10s of degrees)
Snow depth ► Level 1: Manual measurements of snow depth in lake catchment. ► Level 3: Measurements from automated sensors mounted above land surface; temperature
sensors from ground surface upward.
C.2.2.5 Permafrost and active layer
C.2.2.5.1 Sampling protocols
Refer to protocols outlined in Manual for Monitoring and Reporting Permafrost Measurements (International Permafrost Association 2008). In regions with ice-rich surface permafrost, monitor the formation of thaw slumps and degradation of ice-wedge polygon networks using field surveys and remotely sensed imagery.
Sampling scheme and sample analysis ► Level 1: Coordinate with Terrestrial Ecosystem Monitoring Group. Incorporate information being
collected by the Circum-polar Active Layer Monitoring (CALM) program and the Thermal State of Permafrost (TSP) program.
► Level 2: Collect late summer (August) measurements of active layer depth along transects or established grids and temperature measurements in cased boreholes at various depths in the ground (1, 2, 3 m etc.).
► Level 2: In regions with ice-rich surface permafrost, conduct retrospective analysis of thermokarst and thaw slump features and assessment of such features in the field on an annual basis and with remotely sensed imagery at decadal to sub-decadal scales.
► Level 3: Measurements of active layer depth at regular intervals along transects or established grids from the time of snowmelt to the annual freeze up. Measurements of temperature in cased boreholes at fixed depths using data loggers.

114
C.3 River Monitoring Protocols
C.3.1 Biotic FECs
C.3.1.1 Benthic algae
C.3.1.1.1 Sampling protocols
Benthic algal sampling currently takes place in many stations in the Arctic and sub-Arctic. Basic aspects of benthic algal sampling are strictly standardized in the US (EPA: Barbour et al. 1999, USGS: Moulton II et al. 2002) and many of the European Countries (European Parliament and Council of the European Union 2000, Kelly et al. 2007, van de Bund 2009). However, there are considerable differences in the sampling protocols. Sampling in many of these protocols is mainly aimed at a quantitative taxonomical analysis of microalgae in the laboratory via microscope, with most of the EU methods focusing on diatoms only (panEU standards only available for diatoms: CEN 2003, 2004; national methods for other algae available for some countries only). The USA protocols and some of the EU protocols additionally include a qualitative or semi-quantitative sampling of macroalgae, although some of the EU methods include macroalgae as part of the macrophytes assessment method. In some areas, standardized methods to quantify macroalgae directly in the field may be used in lieu of laboratory analysis (Vannforvaltning i Norge 2008, Barbour et al. 1999, Reynoldson et al. 2007, Schneider and Lindstrøm 2011). Field workers should thus be trained to do the macroalgal analysis as this might be one of the reasons why data on macroalgae are often missing.
To design a standard protocol for the Arctic that maximizes data collection while remaining consistent with the methods that are currently used, existing protocols were reviewed to compare the essential aspects of the sampling methodologies for benthic algal community diversity and biomass. The protocol for the Arctic includes the analysis of diatom diversity, which is included in most of the reviewed protocols and is an established indicator of water quality. Chlorophyll a, also an essential measure in many of the protocols, is included because it is a simple method that gives a gross overview of benthic algal biomass for a low cost, and it is widely collected, even when algal taxonomy is not part of the monitoring protocol. There are also new tools available that enable the measurement of chlorophyll a directly in the field. Although not all protocols require the analysis of biovolume and diversity of non-diatom algae, this is included in the Arctic protocol because it is important for characterizing the diversity of the entire benthic algal community. Furthermore, the proportion of dead cells should ideally be estimated as part of the diatom analysis, and for this the entire community should be studied. To keep the relatively laborious work of analyzing the non-diatom algae to a minimum, sampling level 1 includes a single composite sample from a single habitat only, while multi-habitat sampling is included in level 2. The analysis of biovolume is not standardized in this protocol, thereby allowing each country to use its preferred method and vary the level of intensity of this analysis.
Gear ► Level 1: A brush to collect algal samples from rocks/stones (brush specifications should follow
national protocols), and preservative (e.g., formalin or Lugol’s, ethanol for diatoms only). ► Level 1: To collect algae from soft substrate habitat (e.g., sand/silt), a sediment corer with a
rubber stopper and piston (i.e., 60-mL plastic syringe with the narrow tip removed to make a simple cylinder), metal or plastic spatula, rubber stopper, and preservative (e.g., formalin or Lugol’s, ethanol for diatoms only).
Sampling scheme ► Level 1: On hard substrates, quantitative sampling of benthic algae with a brush or scalpel from
a measured and recorded area on 5-10 rocks/stones in a reach. Samples can be mixed to form a single composite sample. If no rocks are present, samples should be collected from any available hard substrate. Store samples for chlorophyll a at -80C if possible, or samples can also be

115ARCTIC FRESHWATER BIODIVERSITY MONITORING PLAN
preserved in a known volume of 96% ethanol if later extractions are made in ethanol. Samples for taxonomical analysis should be preserved according to available protocols.
► Level 1: On soft substrates, quantitative sampling of benthic algae with the coring device from 5-10 locations in a reach. Collect samples by pushing the core at least 5 cm into the sediments. Plug the open end of the corer with the rubber stopper, gently extract the core, and insert the syringe piston into the bottom or the core. Remove the rubber stopper and extrude the top 1 cm of sediment using the piston, then use the spatula to scrape the top 1 cm of sediment into the sampling jar. Samples can be mixed to form a single composite sample. Store samples for chlorophyll a and algal taxonomy as described above.
► Level 1: Preserved samples for archived collections, preserved with Lugol’s solution (5%). ► Level 2: Quantitative sampling should be replicated (i.e., ≥ 3 composite samples) to fully gather
the variation in the reach. ► Level 2: Multihabitat sampling of all substrate types will give a more complete overview of all
benthic algal biodiversity of a stream. If possible, sampling should be done semi-quantitatively using available protocols.
Sample analysis ► Level 1: Chlorophyll a from unpreserved quantitative samples using standard methods;
chlorophyll a samples should be collected in triplicate. ► Level 1: Biovolume and identification of quantitative samples (according to regionally
standard protocols) of soft algae (to lowest taxonomical level feasible) and living diatoms (to genus or higher level). The percent of dead diatoms (also identified to genus or higher level). Identification and relative abundance of diatoms (cleaned valves) according to standard protocols.
► Level 1: Vouchering of samples and archiving, including pictures. ► Level 1: Ensure taxonomic consistency to allow for cross-regional comparisons (in addition to
eventual national protocols using standardized nomenclature that is defined and tested in workshops). Ensure use of photos of the dominant fractions of the algal composition (> 5% biovolume respective to relative abundance) to enable discussion of nomenclature among those involved in algal sample processing.
► Level 2: Identification of macro- and other algae, including diatoms, from qualitative multi-habitat sampling to lowest possible level under microscope.
C.3.1.2 Benthic macroinvertebrates
C.3.1.2.1 Sampling protocols
Some discrepancies exist among national protocols for sampling benthic macroinvertebrates. It is recommended that each nation in the Arctic region continue to follow existing sampling protocols to maintain the continuity in the data collection. However, in some cases it may be beneficial to determine a correction factor that might be applied to the data collected with different methods, to allow pan-Arctic data comparisons.
Most currently existing protocols use kick nets or Surber samplers (e.g., Brittain and Milner 2001, Reynoldson et al. 2007), and the use of these sampling techniques is thus highly recommended. However, while fixed-area sampling protocols (using a Surber sampler or using a kick net within a fixed-size frame) are in use in some areas of Europe, the Canadian sampling protocol is time-limited (traveling kick sampling; Reynoldson et al. 2007). Although fixed-area sampling is recommended, a correction factor may be determined to allow interregional comparisons of these sampling data.
Gear ► Level 1: A Surber sampler or kick net with a maximum mesh size of 500 µm should be used. ► Level 1: Samples should be preserved in at least 75% ethanol or formaldehyde depending on

116
national protocols. Samples for barcoding should be preserved in 95% ethanol and kept cool. ► Level 2: For quantitative kick-net sampling, it is recommended that a fixed-size frame (e.g. 25x25
cm) be used to limit the sampling area. ► Level 3: Use a 250 µm mesh net/sieve during sampling and processing. The Arctic stream
macroinvertebrate fauna is characterized by dipterous insects such as chironomids and simuliids that usually require 250 µm mesh size.
Sampling scheme ► Level 1: Approximately ten replicate kick-net or Surber samples should be collected
in representative habitats within the reach. The number of replicates depends on the macroinvertebrate density and variance among replicates. However, where time-limited travelling kick samplings (e.g., Reynoldson et al. 2007) have been used, samples should be replicated within a stream section.
► Level 2: Collect adults, using emergence traps (e.g., Malaise traps), sweep netting, or searching under stones to verify identifications of immature stages as needed. Samples should be preserved in at least 75% ethanol.
► Level 2: Use drift net sampling for assessing possible prey organisms for fish and as a method for collecting chironomid pupal exuviae to aid identifications of larvae. In glacial systems drift nets quickly become clogged, whereas in non-glacial systems this is usually not a problem. Chironomid pupal exuviae can additionally be sampled from along the water edge with a hand net. Samples should be preserved in at least 75% ethanol.
Sample analysis ► Level 1: Species-level taxonomic identification is desirable when feasible. Ensure taxonomic
consistency to allow for cross-regional comparisons (recommended use of standardized nomenclature (e.g., Limnofauna Europaea, http://www.faunaeur.org/). Numerical abundance should be quantified for each taxon for calculation of community indices.
► Level 1: In the case of replicate samples, at least 6 samples should be processed to capture site variability.
► Level 2: If sub-sampling is used, it should follow standard procedure and should be tested thoroughly for sampling bias.
► Level 2: Biomass should be estimated as wet weight or body length from preserved samples for calculation of indices related to size/age structure and phenology.
C.3.1.3 Fish
C.3.1.3.1 Sampling protocols
Standardized electrofishing protocols differ between countries and continents, and the sampling methods are commonly adjusted to fit local conditions, research questions, and logistical constraints. In the Nordic countries electrofishing is carried out using a single anode, often with a field crew of 2-3 persons. In Great Britain it is more common that several anodes and more people are engaged when electrofishing is carried out in larger (wider) streams and rivers. The European standard (British Standards Institution 2003) has been adopted to meet the requirements of the Water Framework Directive to assess ecological status/ecological integrity.
A protocol for Arctic and northern Alpine rivers needs to allow for national differences in already ongoing monitoring programs, although certain aspects may have to be adopted for northern conditions. The success of electric fishing at low temperatures is affected by reduced fish activity and reduced sampling efficiency due to low conductivity. Low conductivity water is highly resistant to the flow of electrical current, thereby reducing the amount of electrical current travelling through the water and passing through the body of the fish. Under such conditions, the electrical field is limited to the immediate area

117ARCTIC FRESHWATER BIODIVERSITY MONITORING PLAN
of the electrode, and alterations to electrofishing gear may be necessary. The efficiency of electrofishing decreases when water temperature decreases, as the corresponding decline in fish metabolism increases the chances of fish mortality during sampling. Electrofishing sample timing in the Arctic should therefore be chosen to coincide with the warmest water temperatures to minimize fish mortality. Stream sites allowing electrofishing should be wadeable (max depth 1m), not have a velocity exceeding 1 m/s, and generally be less than 15 m wide.
Seining is another common method for non-lethal sampling of stream fish communities (Moulton II et al. 2002), and may be used to complement electrofishing collections. Unlike electrofishing, seining is a highly effective method for sampling small-sized individuals < 10-cm total length. Fyke nets are also widely used in streams and rivers on the Alaskan Arctic Coastal Plain where gradients are extremely low and many portions of small streams, in particular, are barely flowing. Setting a fyke net upstream and another downstream at a sampling site provides information as to which direction a fish is traveling. For example, in Alaska many species make seasonal movements to optimize habitat use and these movements often vary temporally by species.
GearElectrofishing
► Level 1: Backpack electrofisher with cathode and at least one anode. There are a number of different brands of equipment, and often one brand dominates in each country.
► Level 1: Dip nets to collect fish while electrofishing. Dip net mesh must be small enough to collect young-of-year fish (3 mm mesh recommended). In addition, a series of buckets with handles is needed for storing fish prior to identification and measurement.
► Level 2: Stop nets or block nets can be used to enclose the stream reach and prevent immigration/emigration during sampling.
► Level 2: Rivers with low electrolyte levels may require the use of a higher voltage, which may restrict the use of battery-powered equipment. Generators using gasoline may therefore be essential, although this gear can cause logistical problems because of its weight (+ 20 kg). In addition, the anodal ring may need to be larger (35 cm).
Netting ► Level 1: Seine nets or fyke nets. Seines are manufactured in a variety of dimensions and mesh
sizes. The NAWQA Program uses 6.4 mm as a standard mesh size for seines. Three sizes of seines are commonly used to sample fish communities: 3 x 1.2 m; 7.6 or 9.1 x 1.2 m; and about 30.5 to 61 x 1.8 m. The 3 x 1.2-m seine is referred to as a “common sense” seine, a “minnow” seine, or a “standard ichthyologic collection” seine, and is attached to two brails. The 7.6- or 9.1-m seine typically has a bag or pocket in the centre of the seine (the bunt), and thus, is referred to as a bag seine. A beach seine is typically used along the shorelines of large bodies of water and is usually > 30 m long. Because of the greater length, larger dimension brails (usually 51 mm x 51 mm) are required for the beach seine to maximize sampling effectiveness and maintain durability.
Sampling schemeElectrofishing
► Level 1: Electrofishing methods must be standardized in terms of reach area or time, so comparisons of catch per unit effort or area can be made across different regions. Quantitative electrofishing according to the European standard commonly uses the pass-removal method, with three (3) consecutive electrofishing passes through the stream reach to remove fish, and statistically assess the population density. In other regions, a single-pass method is preferred, where a time-limited single electrofishing pass through the reach is used to collect fish and determine catch per unit effort.
► Level 2: To ensure that conclusions on abundance, size and age structure are valid for the target population(s), a sufficient number of sites (n) should be included. This number depends on the spatial variation among sites and whether assessing temporal trends or comparisons between populations is the main aim. The spatial variation is expressed as the coefficient of
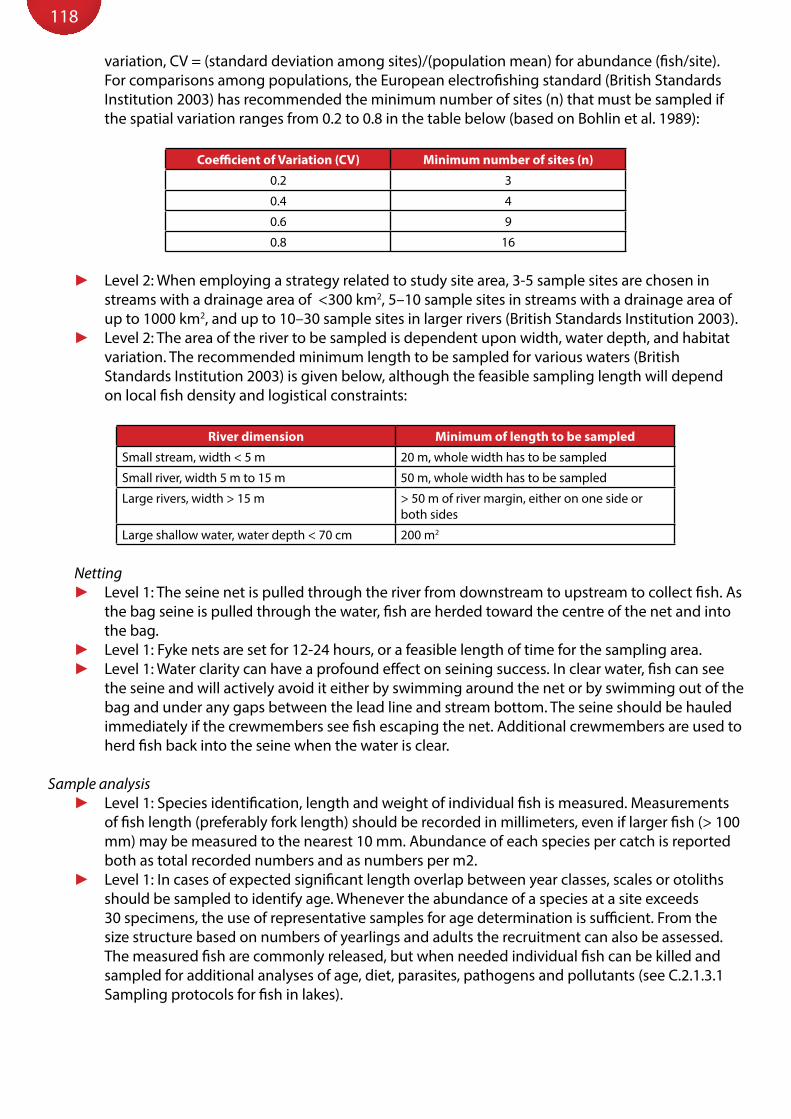
118
variation, CV = (standard deviation among sites)/(population mean) for abundance (fish/site). For comparisons among populations, the European electrofishing standard (British Standards Institution 2003) has recommended the minimum number of sites (n) that must be sampled if the spatial variation ranges from 0.2 to 0.8 in the table below (based on Bohlin et al. 1989):
Coefficient of Variation (CV) Minimum number of sites (n)
0.2 3
0.4 4
0.6 9
0.8 16
► Level 2: When employing a strategy related to study site area, 3-5 sample sites are chosen in streams with a drainage area of <300 km2, 5–10 sample sites in streams with a drainage area of up to 1000 km2, and up to 10–30 sample sites in larger rivers (British Standards Institution 2003).
► Level 2: The area of the river to be sampled is dependent upon width, water depth, and habitat variation. The recommended minimum length to be sampled for various waters (British Standards Institution 2003) is given below, although the feasible sampling length will depend on local fish density and logistical constraints:
River dimension Minimum of length to be sampled
Small stream, width < 5 m 20 m, whole width has to be sampled
Small river, width 5 m to 15 m 50 m, whole width has to be sampled
Large rivers, width > 15 m > 50 m of river margin, either on one side or both sides
Large shallow water, water depth < 70 cm 200 m2
Netting ► Level 1: The seine net is pulled through the river from downstream to upstream to collect fish. As
the bag seine is pulled through the water, fish are herded toward the centre of the net and into the bag.
► Level 1: Fyke nets are set for 12-24 hours, or a feasible length of time for the sampling area. ► Level 1: Water clarity can have a profound effect on seining success. In clear water, fish can see
the seine and will actively avoid it either by swimming around the net or by swimming out of the bag and under any gaps between the lead line and stream bottom. The seine should be hauled immediately if the crewmembers see fish escaping the net. Additional crewmembers are used to herd fish back into the seine when the water is clear.
Sample analysis ► Level 1: Species identification, length and weight of individual fish is measured. Measurements
of fish length (preferably fork length) should be recorded in millimeters, even if larger fish (> 100 mm) may be measured to the nearest 10 mm. Abundance of each species per catch is reported both as total recorded numbers and as numbers per m2.
► Level 1: In cases of expected significant length overlap between year classes, scales or otoliths should be sampled to identify age. Whenever the abundance of a species at a site exceeds 30 specimens, the use of representative samples for age determination is sufficient. From the size structure based on numbers of yearlings and adults the recruitment can also be assessed. The measured fish are commonly released, but when needed individual fish can be killed and sampled for additional analyses of age, diet, parasites, pathogens and pollutants (see C.2.1.3.1 Sampling protocols for fish in lakes).

119ARCTIC FRESHWATER BIODIVERSITY MONITORING PLAN
C.3.1.4 Riparian vegetation
C.3.1.4.1 Sampling protocolsThe sampling scheme is designed to maximize qualitative and quantitative data collection for riparian vegetation by incorporating aspects of several existing protocols. Because existing protocols generally provide only a rough estimate of riparian vegetation and ground cover, this sampling scheme may require the collection of additional data beyond the scope of regional protocols.
Sampling schemeRiparian vegetation and ground cover within 0-5 m of river banks
► Level 1: Record the type of vegetation/ground cover present from the following classes: coniferous trees, deciduous trees, shrubs, tundra with low shrubs, tundra with dwarf shrubs, tundra with rushes/sedges/grasses, wetland, bare ground, permafrost slump, other (specify). Estimate the % cover of each type of vegetation/ground cover.
► Level 1: Where trees are present, estimate the percent shading of the river due to canopy cover. ► Level 2: Estimates of % cover of vegetation/ground cover and % canopy cover should be made
by several individuals, and averages of these estimates should be recorded. ► Level 2: Taxonomic identification of riparian vegetation is recommended to enable estimation of
diversity and richness. Riparian vegetation and ground cover within 0-30 m of river banks
► Level 1: Record the type of vegetation/ground cover present from the following classes: coniferous trees, deciduous trees, shrubs, tundra with low shrubs, tundra with dwarf shrubs, tundra with rushes/sedges/grasses, wetland, bare ground, permafrost slump, other (specify)
► Level 2: Estimate the % cover of each type of vegetation/ground cover. Estimates of % cover of vegetation/ground cover should be made by several individuals, and averages of these estimates should be recorded.
Sample analysis ► Level 2: Where taxonomic identification has been completed, community indices should be
calculated for riparian vegetation.
C.3.2 Abiotic FECs
C.3.2.1 Water temperature regime
C.3.2.1.1 Sampling protocols
Gear ► Level 1: Data loggers for continuous measurement of water temperature.
Sampling scheme ► Level 1: Measure water temperature at mid-stream during visits to collect biotic data. If possible,
measure temperature at five equidistant points across stream cross section to determine if reach is influenced by upstream tributaries resulting in unmixed flow at sampling location.
► Level 1: Utilize data loggers to monitor temperature continuously during open water season.
C.3.2.2 Hydrologic and ice regimes
C.3.2.2.1 Sampling protocols The key to establishing long-term stage-discharge relationships is maintaining a stable datum that is not influenced by erosion or ice processes. In addition, establishing ice-on stage-discharge relationships would also increase accuracy of winter discharge estimates. For sampling areas where the datum may be unstable, hydrolic models (e.g., River 2D) can be applied.

120
Gear ► Level 1: Gauges, data recorders or data loggers for continuous measurements. ► Level 2: Acoustic Doppler Current Profilers (ADCPs) can be used to measure discharge in non-
wadeable streams. Sampling scheme
► Level 1: Continuous water level measurements using staff gauges or data recorders. ► Level 2: Continuous measurements of water level using data loggers (pressure) and periodic field
measurements of discharge at the full range of flows to establish a stage - discharge relation, allowing the calculation of continuous discharge.
► Level 2: For wadeable streams, water discharge should be computed from measurements of cross sectional area and velocity. Point measurements of velocity should be taken at 0.6 m depth from the surface (see Rantz and others 1983). Ideally, no single section (where velocity measurement is made) should account for more than 5 percent of the total discharge. Sites for measuring discharge should be selected for uniform conditions if possible.
► Level 2: For non-wadeable streams, water discharge measurements are significantly more difficult to make and require additional equipment. If possible, measurements should be made from bridges or suspended cableways using similar methods as those used for wadeable streams. Discharge measurements also may be using Acoustic Doppler Current Profilers (ADCPs) from boats or tethered from cables or bridges. Proper use of ADCPs requires specialized training.
► Level 3: Remote sensing based documentation of freeze-up and break-up dates (possible only on larger rivers).
C.3.2.3 Water quality
C.3.2.3.1 Sampling protocols
Gear ► Level 1: A water quality sonde should be used to estimate values on-site for all possible variables.
Water samples should be collected for the remaining variables.Sampling scheme and sample analysis
► Level 1: Sampling should occur minimally once a year at annual visits in late summer/fall. To control for seasonal and diurnal patterns in water chemistry and the community structure of zooplankton and benthic invertebrates, the timing of sample events will be kept as constant as possible.
► Level 2: 3 sampling trips in the ice-free season (spring, mid/late summer, fall). ► Level 3: Under ice measurements in late winter to describe conditions influenced most strongly
by groundwater contributions.
Nutrients and DOC ► Level 1: Integrated water samples should be analyzed for Total dissolved nitrogen and
phosphorus and DOC. Dissolved nutrients exclude particulate matter from the water by filtering through a glass filter fiber (GF/F - 0.7 µm).
► Level 2: Total Kjeldahl nitrogen, nitrate-nitrite measurements.
CDOM ► Level 1: Integrated water sample - stored in the cold (4°C) and dark until analysis using a
fluorometer (lab). ► Level 2: Monitor surface CDOM using remote sensing based measurements.
pH ► Level 1: Integrated water samples should be analyzed for pH using a water quality sonde when
conducting site visits.

121ARCTIC FRESHWATER BIODIVERSITY MONITORING PLAN
► Level 2: Continuous measurements with deployed data loggers.
Alkalinity ► Level 1: Integrated water sample collected for alkalinity measurement.
Major ions ► Level 1: Integrated water sample analysed for Ca, SO4, Na, K, Mg, Cl.
Total suspended solids and turbidity ► Level 1: Integrated water samples should be submitted for TSS measurements. ► Level 2: Turbidity measurements (NTU). ► Level 3: If sondes for water temperature, pH, conductivity, or dissolved oxygen are deployed,
a turbidity probe could be added. However, these probes require frequent maintenance to produce reliable data.
Dissolved oxygen ► Level 1: Measure dissolved oxygen concentration and percent saturation during visits to collect
biotic data. ► Level 2: Utilize data loggers to monitor concentration continuously during open water season.
Conductivity ► Level 1: Measure conductivity during visits to collect biotic data using handheld meters. ► Level 2: Continuous measurements with deployed data loggers, calibrated during field visits.
C.3.2.4 Climatic regime
C.3.2.4.1 Sampling protocols
Sampling scheme and sample analysisMeteorological and climate variables
► Level 2: Measurements from a meteorological station in the catchment (optimally within 5 km).
Surface air temperature ► Level 1: Estimates of daily mean temperature (°C). ► Level 2: Continuous measurements.
Precipitation, relative humidity, wind speed and direction ► Level 1: Estimates of daily total precipitation (mm), relative humidity, mean wind speed (km/h)
and mean wind direction (10s of degrees)
Snow depth ► Level 1: Manual measurements of snow depth in catchment. ► Level 3: Measurements from automated sensors mounted above land surface; temperature
sensors from ground surface upward.
C.3.2.5 Permafrost and active layer
C.3.3.5.1 Sampling protocolsRefer to protocols outlined in Manual for Monitoring and Reporting Permafrost Measurements (International Permafrost Association 2008). In regions with ice-rich surface permafrost, monitor the formation of thaw slumps and degradation of ice-wedge polygon networks using field surveys and remotely sensed imagery.

122
Sampling scheme and sample analysis ► Level 1: Coordinate with Terrestrial Ecosystem Monitoring Group. Incorporate information being
collected by the Circum-polar Active Layer Monitoring (CALM) program and the Thermal State of Permafrost (TSP) program.
► Level 2: Collect late summer (August) measurements of active layer depth along transects or established grids and temperature measurements in cased boreholes at various depths in the ground (1, 2, 3 m etc.).
► Level 2: In regions with ice-rich surface permafrost, conduct retrospective analysis of thermokarst and thaw slump features and assessment of such features in the field on an annual basis and with remotely sensed imagery at decadal to sub-decadal scales.
► Level 3: Measurements of active layer depth at regular intervals along transects or established grids from the time of snowmelt to the annual freeze up. Measurements of temperature in cased boreholes at fixed depths using data loggers.
C.4 Additional Methods for Sampling and Analyzing FECs in Lakes and Rivers
C.4.1 Stable isotope analysis of food web structureEnvironmental stressors can change the structure of lake and river food webs through a number of direct or indirect processes. Long-term changes in food web structure can be monitored using stable carbon (C) and nitrogen (N) isotope ratios. Ratios of these elements are present naturally in organisms and are used to understand how energy (C; from in-lake or external production) flows within the system and across the trophic levels (N) of the organisms. It is also important to recognize that changes in nutrient inputs or system productivity can alter the signal of the isotopes supporting the food web. Not only can these isotopes be used to examine food web structure, but they can also be used to examine long-term changes in nutrient cycling within lakes and rivers. While intensive food web sampling could be done to characterize all potential sources of energy supporting fishes, here we propose a more rapid assessment protocol to facilitate some understanding of the food web without the need for intensive temporal sampling. Site-specific modification of this protocol may be needed.
C.4.1.1 Sampling protocolTo understand changes in food web structure over time, it is critical to collect organisms that represent basal (algae, terrestrial vegetation) inputs to the system. However, small-bodied organisms (e.g., algae) are known to vary in their isotopic composition over the season because of their short turnover times, making them difficult to use without repeated sampling through the open water season. To characterize basal resources to the lake, it is common to collect invertebrate primary consumers because they integrate the variability in primary producers. In lake systems, invertebrate primary consumers should be collected from both the open water (pelagic) and near shore (benthic) regions. When present, many studies have used filter-feeding mussels to reflect pelagic production and snails to assess benthic energy sources. These longer-lived consumers are known to be less temporally variable than the algae that they feed upon. When these organisms are not present, other long-lived primary consumers can be substituted, but the sampling protocols may need to be modified if shorter-lived organisms are used. Without taxa representing the base of the food web, it isn’t possible to interpret C and N isotopes in fish species and any changes in food web structure over time. Fish sampling is typically done once a year because these longer-lived organisms will be much less variable in their isotopic composition over time.
To reduce costs and increase efficiencies, samples for stable isotope analyses can be collected at the same time as the fishing and benthic invertebrate sampling described above. However, analyses should be done on frozen samples rather than on those that have been preserved for identification. It may be necessary to collect separate samples within the same habitats to obtain invertebrates for analyses. It is also important to consider potential spatial and temporal variability within the systems, as previous work has shown that there can be among-site differences in the isotopic composition of benthic invertebrates

123ARCTIC FRESHWATER BIODIVERSITY MONITORING PLAN
(but spatial variability for planktonic organisms is much lower). For this reason, collecting the same benthic invertebrates from several sites is recommended. Invertebrate samples from one location can be pooled to obtain adequate masses but should be analyzed separately by site to assess spatial variability.
Sampling scheme and sample analysis ► Level 2: Collection of fish, benthic primary consumers (e.g. snails, caddisflies), pelagic primary
consumers (mussels, zooplankton). Muscle tissues from a range of sizes of fish for top predators. Invertebrates coarsely sorted and frozen (-20oC).
► Level 3: Analyses for δ13C, δ15N, δ34S (the latter only for sites that are potentially influenced by marine systems, e.g., birds bringing nutrients, sea-run fish).
► Level 3: More trophic levels (zooplankton grouped as rotifers, cladocerans, and copepods, for example).
C.4.2 Remote sensingGiven the number of lakes and large rivers in the Arctic as well as the sheer size of the pan-Arctic region, remotely sensed observations from airborne and space-borne platforms could provide a means for understanding variability within and across regions in various lake and river types and allow for the up-scaling of point measurements, providing a valuable tool in the development of the pan-Arctic monitoring program. There are two primary types of remote sensing platforms: passive and active. Passive sensors tend to rely on reflected energy from the sun to obtain an image, whereas active sensors produce their own energy source and are capable of imaging independent of reflected sunlight. Currently, there are a number of satellite sensors in operation that could be incorporated into such a monitoring program (Table 18). These are optical sensors (passive) and provide useful information on the differences in spectral resolution, spatial resolution, footprint swath, and temporal revisit time, all factors that influence the utility of a particular sensor for remotely sensing water quality or quantity characteristics. Typical examples of data retrieval from optical imagery include surface area, depth, water clarity, chlorophyll, cyanobacteria, and temperature, However, none of the optical platforms are capable of imaging through cloud cover or in the dark. Thus, in addition to the suite of optical platforms there are a number of microwave- or radar-based platforms (active) capable of imaging in typical arctic conditions that could be used to monitor variations in lake surface area seasonally and annually, as well as the onset, growth, and breakup of winter ice cover.
Although there are a number of satellite sensors currently in operation, their role in retrieving information from freshwater remains a young and emerging field. Operationally, very few data are provided on a global or pan-Arctic scale. In the future, this is likely to change as the opportunities are tremendous. In the meantime, Bradt (2005) has listed a series of questions that one should ask when selecting a remote sensor for use in a lake monitoring program:
► How large is the lake? ► What types of measurements are needed? ► How frequently are measurements needed? ► How much expertise is required to process the imagery? ► How much does the imagery cost?
Thus, considering each of these questions prior to incorporation of remote sensing into a lake monitoring program will help determine the feasibility of such an effort. Similar questions could be considered before incorporating remote sensing into a river monitoring program, but river size will limit the inclusion of remote sensing in many programs. Most importantly, remotely sensed observations should be viewed as a tool and not a stand-alone effort in a lake or river monitoring program, as ground-based observations are often necessary for image calibration and information validation.

124
Tabl
e 18
. Lis
t of c
omm
on s
atel
lite
sens
ors
that
cou
ld b
e in
corp
orat
ed in
to a
pan
-Arc
tic la
ke m
onito
ring
prog
ram
(cop
ied
from
Bra
dt 2
005,
Mod
ule
8)
Sens
orSa
telli
teA
genc
yLa
unch
Glo
bal
Cove
rage
Spec
tral
Spat
ial
Foot
prin
tTe
mpo
ral
Radi
omet
ric
Band
sBl
uePi
xel s
ize
(m)
Swat
h(k
m)
Revi
sit
(d)
Inte
nsit
y le
vels
-Q
uick
Bird
Dig
ital G
lobe
Inc.
2001
NO
5YE
S0.
7, 2
.816
.51-
3.5*
11-b
it (0
-204
7)
-IK
ON
OS
Geo
Eye
1999
NO
5YE
S1*
, 4*
13.8
*3-
5*11
-bit
(0-2
047)
-SP
OT
5CN
ES (F
ranc
e)20
02N
O6
NO
2.5,
10,
20
602-
3*11
-bit
(0-2
047)
AST
ERTe
rra
NA
SA (U
SA)
2002
YES
15N
O15
, 30,
90
6016
8-bi
t (0-
255)
Hyp
erlio
nEO
-1N
ASA
(USA
)20
00N
O22
0YE
S30
7.5
1612
-bit
(0-4
095)
TMLa
ndsa
t 5N
ASA
(USA
)19
84YE
S7
YES
30, 8
060
168-
bit (
0-25
5)
ETM
Land
sat 7
USG
S (U
SA)
1999
YES
8YE
S10
, 30,
60
185
168-
bit (
0-25
5)
CZI
HY-
1BCN
SA (C
hina
)20
07YE
S4
YES
250
500
710
-bit
(0-1
023)
MER
ISEN
VISA
TES
A (E
urop
e)20
02YE
S15
YES
300
1150
316
-bit
(0-6
5535
)
OCM
IRS-
P4IR
SO (I
ndia
)19
99YE
S8
YES
350
1420
212
-bit
(0-4
095)
MO
DIS
Aqua
NA
SA (U
SA)
2002
YES
36YE
S25
0, 5
00, 1
000
2330
1.5
12-b
it (0
-409
5)
COC
TSH
Y-1B
CNSA
(Chi
na)
2007
YES
10YE
S11
0014
001
10 b
it- (0
-102
3)
AVH
RR/3
NO
AA
-18
NO
AA
(USA
)20
05YE
S6
NO
1100
3000
112
-bit
(0-4
095)
SeaW
IFS
Orb
View
-3N
ASA
(USA
)19
97YE
S8
YES
1100
2801
110
-bit
(0-1
023)
* figu
res r
epre
sent
off-
nadi
r val
ues

Appendix D.Current and Historical Sampling
Coverage Maps by FEC

126
Figure 16. Lake monitoring data for fish in the pan-Arctic region, indicating the maximum number of sampling years for each location. Points of the map may represent more than one sampling site or lake. The number of sites with data presented is 174 (Canada), 3 (Denmark-Greenland-Faroes), 15 (Finland), 32 (Iceland), 6 (Norway), 2 (Russia), 0 (Sweden), and 193 (the United States of America). This map presents a preliminary selection of available data and is not an exhaustive summary.

127ARCTIC FRESHWATER BIODIVERSITY MONITORING PLAN
Figure 17. Lake monitoring data in benthic macroinvertebrates for the pan-Arctic region, indicating the maximum number of sampling years for each location. Points of the map may represent more than one sampling site or lake. The number of sites with data presented is 565 (Canada), 7 (Denmark-Greenland-Faroes), 16 (Finland), 0 (Iceland), 2 (Norway), 2 (Russia), 55 (Sweden), and 57 (the United States of America). This map presents a preliminary selection of available data and is not an exhaustive summary.

128
Figure 18 Lake monitoring data in zooplankton for the pan-Arctic region, indicating the maximum number of sampling years for each location. Points of the map may represent more than one sampling site or lake. The number of sites with data presented is 211 (Canada), 7 (Denmark-Greenland-Faroes), 8 (Finland), 0 (Iceland), 3 (Norway), 2 (Russia), 6 (Sweden), and 57 (the United States of America). This map presents a preliminary selection of available data and is not an exhaustive summary.

129ARCTIC FRESHWATER BIODIVERSITY MONITORING PLAN
Figure 19 Lake monitoring data for benthic algae in the pan-Arctic region, indicating the maximum number of sampling years for each location. Points of the map may represent more than one sampling site or lake. The number of sites with data presented is 587 (Canada), 0 (Denmark-Greenland-Faroes), 2 (Finland), 0 (Iceland), 0 (Norway), 0 (Russia), 0 (Sweden), and 50 (the United States of America). This map presents a preliminary selection of available data and is not an exhaustive summary.

130
Figure 20 Lake monitoring data for phytoplankton in the pan-Arctic region, indicating the maximum number of sampling years for each location. Points of the map may represent more than one sampling site or lake. The number of sites with data presented is 97 (Canada), 7 (Denmark-Greenland-Faroes), 11 (Finland), 0 (Iceland), 0 (Norway), 2 (Russia), 31 (Sweden), and 69 (the United States of America). This map presents a preliminary selection of available data and is not an exhaustive summary.

131ARCTIC FRESHWATER BIODIVERSITY MONITORING PLAN
Figure 21 Lake monitoring data for macrophytes in the pan-Arctic region, indicating the maximum number of sampling years for each location. Points of the map may represent more than one sampling site or lake. The number of sites with data presented is 76 (Canada), 2 (Denmark-Greenland-Faroes), 5 (Finland), 0 (Iceland), 0 (Norway), 0 (Russia), 0 (Sweden), and 0 (the United States of America). This map presents a preliminary selection of available data and is not an exhaustive summary.

132
Figure 22 Lake monitoring data for aquatic birds in the pan-Arctic region, indicating the maximum number of sampling years for each location. Points of the map may represent more than one sampling site or lake. The number of sites with data presented is 1 (Canada), 2 (Denmark-Greenland-Faroes), 0 (Finland), 1 (Iceland), 0 (Norway), 0 (Russia), 0 (Sweden), and 86 (the United States of America). This map presents a preliminary selection of available data and is not an exhaustive summary.

133ARCTIC FRESHWATER BIODIVERSITY MONITORING PLAN
Figure 23 Lake monitoring data for water temperature in the pan-Arctic region, indicating the maximum number of sampling years for each location. Points of the map may represent more than one sampling site or lake. The number of sites with data presented is 1 (Canada), 7 (Denmark-Greenland-Faroes), 17 (Finland), 3 (Iceland), 6 (Norway), 81 (Russia), 92 (Sweden), and 156 (the United States of America). This map presents a preliminary selection of available data and is not an exhaustive summary.

134
Figure 24 Lake monitoring data for the hydrologic regime in the pan-Arctic region, indicating the maximum number of sampling years for each location. Points of the map may represent more than one sampling site or lake. The number of sites with data presented is 1 (Canada), 2 (Denmark-Greenland-Faroes), 5 (Finland), 2 (Iceland), 1 (Norway), 2 (Russia), 0 (Sweden), and 70 (the United States of America). This map presents a preliminary selection of available data and is not an exhaustive summary.

135ARCTIC FRESHWATER BIODIVERSITY MONITORING PLAN
Figure 25 Lake monitoring data for water quality in the pan-Arctic region, indicating the maximum number of sampling years for each location. Points of the map may represent more than one sampling site or lake. The number of sites with data presented is 2498 (Canada), 7 (Denmark-Greenland-Faroes), 17 (Finland), 0 (Iceland), 0 (Norway), 83 (Russia), 92 (Sweden), and 156 (the United States of America). This map presents a preliminary selection of available data and is not an exhaustive summary.

136
Figure 26 Lake monitoring data for the climatic regime in the pan-Arctic region, indicating the maximum number of sampling years for each location. Points of the map may represent more than one sampling site or lake. The number of sites with data presented is 1 (Canada), 7 (Denmark-Greenland-Faroes), 0 (Finland), 0 (Iceland), 3 (Norway), 0 (Russia), 0 (Sweden), and 52 (the United States of America). This map presents a preliminary selection of available data and is not an exhaustive summary.

137ARCTIC FRESHWATER BIODIVERSITY MONITORING PLAN
Figure 27 Lake monitoring data for permafrost in the pan-Arctic region, indicating the maximum number of sampling years for each location. Points of the map may represent more than one sampling site or lake. The number of sites with data presented is 1 (Canada), 7 (Denmark-Greenland-Faroes), 0 (Finland), 0 (Iceland), 0 (Norway), 0 (Russia), 0 (Sweden), and 0 (the United States of America). This map presents a preliminary selection of available data and is not an exhaustive summary.

138
Figure 28 River monitoring data for fish in the pan-Arctic region, indicating the maximum number of sampling years for each location. Points of the map may represent more than one sampling site or river. The number of sites with data presented is 78 (Canada), 1 (Denmark-Greenland-Faroes), 485 (Finland), 140 (Iceland), 2 (Norway), 1 (Russia), 0 (Sweden), and 37 (the United States of America). This map presents a preliminary selection of available data and is not an exhaustive summary.

139ARCTIC FRESHWATER BIODIVERSITY MONITORING PLAN
Figure 29 River monitoring data for benthic macroinvertebrates in the pan-Arctic region, indicating the maximum number of sampling years for each location. Points of the map may represent more than one sampling site or river. The number of sites with data presented is 416 (Canada), 0 (Denmark-Greenland-Faroes), 116 (Finland), 7 (Iceland), 1 (Norway), 0 (Russia), 445 (Sweden), and 35 (the United States of America). This map presents a preliminary selection of available data and is not an exhaustive summary.

140
Figure 30 River monitoring data for benthic algae in the pan-Arctic region, indicating the maximum number of sampling years for each location. Points of the map may represent more than one sampling site or river. The number of sites with data presented is 129 (Canada), 0 (Denmark-Greenland-Faroes), 99 (Finland), 0 (Iceland), 0 (Norway), 0 (Russia), 0 (Sweden), and 24 (the United States of America). This map presents a preliminary selection of available data and is not an exhaustive summary.
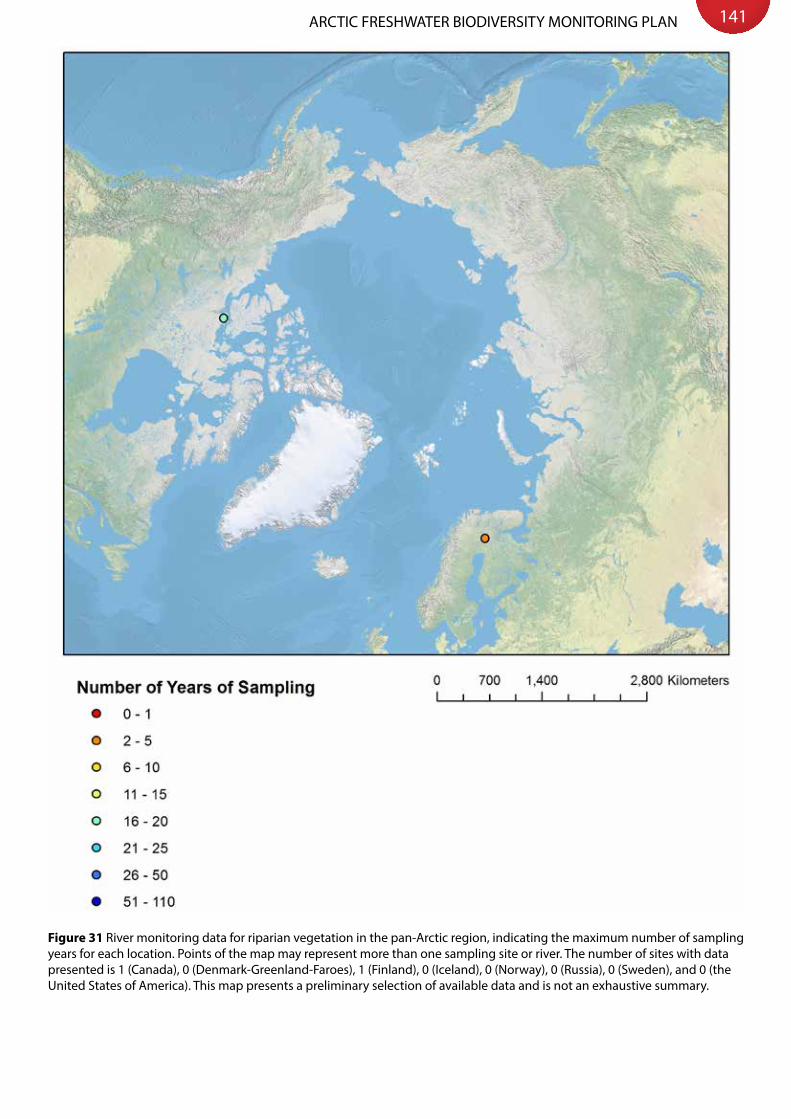
141ARCTIC FRESHWATER BIODIVERSITY MONITORING PLAN
Figure 31 River monitoring data for riparian vegetation in the pan-Arctic region, indicating the maximum number of sampling years for each location. Points of the map may represent more than one sampling site or river. The number of sites with data presented is 1 (Canada), 0 (Denmark-Greenland-Faroes), 1 (Finland), 0 (Iceland), 0 (Norway), 0 (Russia), 0 (Sweden), and 0 (the United States of America). This map presents a preliminary selection of available data and is not an exhaustive summary.

142
Figure 32 River monitoring data for water temperature in the pan-Arctic region, indicating the maximum number of sampling years for each location. Points of the map may represent more than one sampling site or river. The number of sites with data presented is 67 (Canada), 1 (Denmark-Greenland-Faroes), 617 (Finland), 14 (Iceland), 2 (Norway), 0 (Russia), 445 (Sweden), and 46 (the United States of America). This map presents a preliminary selection of available data and is not an exhaustive summary.

143ARCTIC FRESHWATER BIODIVERSITY MONITORING PLAN
Figure 33 River monitoring data for the hydrologic regime in the pan-Arctic region, indicating the maximum number of sampling years for each location. Points of the map may represent more than one sampling site or river. The number of sites with data presented is 412 (Canada), 1 (Denmark-Greenland-Faroes), 394 (Finland), 2 (Iceland), 21 (Norway), 15 (Russia), 0 (Sweden), and 64 (the United States of America). This map presents a preliminary selection of available data and is not an exhaustive summary.

144
Figure 34 River monitoring data for water quality in the pan-Arctic region, indicating the maximum number of sampling years for each location. Points of the map may represent more than one sampling site or river. The number of sites with data presented is 320 (Canada), 1 (Denmark-Greenland-Faroes), 612 (Finland), 0 (Iceland), 20 (Norway), 15 (Russia), 445 (Sweden), and 46 (the United States of America). This map presents a preliminary selection of available data and is not an exhaustive summary.

145ARCTIC FRESHWATER BIODIVERSITY MONITORING PLAN
Figure 35 River monitoring data for the climatic regime in the pan-Arctic region, indicating the maximum number of sampling years for each location. Points of the map may represent more than one sampling site or river. The number of sites with data presented is 1 (Canada), 1 (Denmark-Greenland-Faroes), 310 (Finland), 0 (Iceland), 1 (Norway), 0 (Russia), 0 (Sweden), and 7 (the United States of America). This map presents a preliminary selection of available data and is not an exhaustive summary.

146
Figure 36 River monitoring data for permafrost in the pan-Arctic region, indicating the maximum number of sampling years for each location. Points of the map may represent more than one sampling site or river. The number of sites with data presented is 1 (Canada), 1 (Denmark-Greenland-Faroes), 0 (Finland), 0 (Iceland), 0 (Norway), 0 (Russia), 0 (Sweden), and 5 (the United States of America). This map presents a preliminary selection of available data and is not an exhaustive summary.

Appendix E. Data Storage, Policy and Standards Details

148
I. Data StorageA decentralized data storage system is proposed for the CBMP web portal since it offers a solution to concerns over data ownership and copyright. Data policies such as the Conservation Commons and the IPY Data Policy address these issues in general terms. Decentralized approaches to data storage are already successfully applied in the Global Biological Information Facility (GBIF), Ornithological Information System (ORNIS), and other data networks worldwide. Although the data are decentralized, access to and depiction of the data is unified, allowing for multiple integrations for the user. Other compiled datasets may, with appropriate permissions, be archived also at the CAFF Secretariat. Options for mirrored archiving of data generated by the Freshwater Plan will be considered, such as working with existing data centers.
For all indicators developed under the CBMP, a database of the time series of reviewed and published indicators will be maintained via the data node hosts. All relevant metadata and the time-series data will be consistently available, along with information about the associated methodology, quality, and interpretation. The CBMP Meta-Data Archive will be linked to other clearing-house mechanisms for access and dissemination. Specific data sets will be contributed by partners to the monitoring plans as they are developed and published.
II. Data Policy
A. Ownership and custodianshipA data node host may act as custodian for individual data collectors, holders and publishers, but this does not automatically confer any rights to those data. The responsibility for and ownership of the data will always remain with the data collector, publisher and/or holder. At all times, ownership of the data remains with the original collector, who bears responsibility for any changes or amendments to the data.
Data collectors could transfer their rights to a data archive, or maintain their rights and store their data with a data archive or any other data holder who uses their data. It is also possible to release data conditionally (e.g., based on requested input and acknowledgement). This flexible model embraces all options from free public data to strict data control and is a feature that will likely prove popular with web portal users and contributors.
B. Intellectual property rightsUnless requested otherwise, the data collector will be acknowledged as owner of the intellectual property of the data (or the representative of the organization that is the property owner). This model follows global policies such as Conservation Commons and the IPY Data Policy.
Conservation CommonsThe Conservation Commons is characterized by an underlying set of principles that supports open access to and fair use of data and information related to the conservation of biodiversity. The purpose of the Conservation Commons Principles is to allow the distribution of and access to biodiversity data among the many databases housed by large organizations. The principles are as follows:
► Open access: The Conservation Commons promotes free and open access to data, information, and knowledge for all conservation purposes;
► Mutual benefit: The Conservation Commons welcomes and encourages participants both to use and to contribute data, information, and knowledge; and
► Rights and responsibilities: Contributors to the Conservation Commons have the right to be acknowledged for any use of their data, information, and knowledge, as well as the right to ensure that the integrity of their contribution to the Commons is preserved. Users of the Conservation Commons are expected to comply, in good faith, with terms of use specified by contributors.

149ARCTIC FRESHWATER BIODIVERSITY MONITORING PLAN
International Polar Year Data PolicyThe IPY Data Policy considers data a global resource and promotes free and open access to raw data online to stimulate academic progress. IPY’s policy adheres to the most up-to-date scientific principles, with requirements for data to be documented with standardized metadata (e.g., Federal Geographic Data Committee (FGDC) and National Biological Information Infrastructure (NBII)). Online posting of well-documented and interpreted versions of the data is also encouraged. The purpose of this policy is to encourage the widest possible exchange of relevant data. This policy is endorsed by the funding agencies of polar nations and viewed as a template by many other countries.
C. Data sharing and accessThe data collected by the CBMP will be available continually at a fixed entry point operated by CAFF on the Internet. This point could be mirrored at a data collector/holder’s site, at the Web portal site of a data host, or both (e.g., by linking to both websites). The web portal will allow for organized and restricted access to data where necessary.
CAFF’s CBMP encourages data providers to comply with the Conservation Commons and IPY Data Policy on the delivery of free biodiversity data to the public. Compliance with accepted data policies and provision of data to the CBMP Data Portal system will result in password access being provided to the data layers found on the Data Portal. This incentive-driven approach should encourage scientists and others to contribute their data to the Portal as it will result in their access to other data layers relevant to them. Arctic Council countries are also encouraged to make their publicly funded datasets available for use in the CBMP Data Portal system.
A condition of project funding or support through CAFF/CBMP should be the guaranteed availability of any resulting data for use by the CBMP. Additional uses are encouraged and should also be specified. This should provide maximum opportunity for synergies that inevitably follow the presentation and availability of new data.
D. Data release code All CBMP participants will agree to their data being utilized, within specified terms, in broader analyses and collections by identified users within CAFF and the CBMP. All products, including value-added products (e.g., GIS layers, reports, analyses) identified and released under the management of CAFF and the CBMP, will have appropriate acknowledgement secured. This can be achieved by registration of the data user and through a request to sign or agree with basic conditions of use. These protocols should not pose a constraint to free data release to the public.
The CBMP will create a safe and reliable data network, making high-quality digital data available to global users online. Restricted data would be flagged accordingly (e.g., in the metadata) and only released for specific usage or by specific users with password access. The technical set-up implemented will allow achievement of this goal and protection to the data holder. Data collectors, holders, and providers will have full freedom to specify the level of detail that they wish to make available.
E. Data use restrictionsUltimately, the CBMP wants to optimize the flow of information pertaining to Arctic biodiversity. While the CBMP will strive to provide unrestricted access to data, there are some exceptions that should be considered and accommodated to maximize the utilization of data. For example, unpublished data may require either temporary restrictions and/or partial access (i.e., only advanced analytical results available instead of raw data) in order for the data collector/holder to retain publishing rights. As well, data on some endangered or threatened species may require certain levels of protection to prevent destruction of and/or disturbance to these populations.
The IPY Data Policy prescribes a six-month delay before information is released to the public. Depending on the project and publication circumstances, the CBMP suggests a delay of two to four years, according

150
to data type and project history. Funding agencies in several countries already have a two-year data release policy in place. Details will depend on specific situations, but overall the CBMP will strive for timely release of data to promote scientific progress and discovery.
Following is a list of access classifications: ► Unrestricted access: freely available to all participants to incorporate within any product and
project; ► Permission-based access: Specific acknowledgements/permission statements must be
incorporated within the product. The data management structure will account for these restrictions by creating a process for obtaining permissions to use the data. The system will be efficient and simple to navigate. This will be achieved by using metadata to point to data and describe them, and then by controlled access to actual download of these data once the data user agrees with terms of use;
► Password- restricted access: Access to the data set is restricted to those participants who have been given specific access via a password/key. This can be important for raw data management within a network;
► Copyright restrictions: Available for use only by the data collector/holder. This class is likely to apply to dynamic data sets in a state of flux and receiving constant updates. Even with this level of restriction, there might still be opportunities for the data to contribute generic analyses. An example would be the use of simple data summaries to determine if populations are stable, increasing, or decreasing. The copyright issue needs to be clearly identified. (A pilot project is currently underway to test operability for restricted access of generic seabird data.); and
► Publication delay: These data are being published by the data collector and owner and will be released, ideally, within a six-month period. In some cases, the release could be delayed for up to four years. The exact release date will be specified and negotiated with the provider.
► Protection of endangered species, human rights, and/or national security: These data are not released because release would threaten an endangered species, violate human rights, or pose a risk to national security. Examples include personalized interview information and sensitive human DNA data. Unless the pertinent threat is resolved or clarified, these data will either be unavailable or available only in a coarse or delayed fashion.
F. AcknowledgementsThe database structure and the web-based portal will ensure that the source of every single data set is properly acknowledged. Full acknowledgement requires that each data set carry a unique name and reference. The reference can take any number of forms: publications, organizations’ databases, libraries, data archives with multiple entry providers, networks, etc. The precise wording of the acknowledgement will be provided by the data holder/collector, and it is the responsibility of the data provider to ensure the originality of the source.
III. Data and Metadata StandardsIn order for the various networks involved in implementing the CBMP-Freshwater Plan to collaborate, input, and share data and metadata, common data and metadata standards need to be chosen.
CAFF’s CBMP has chosen the Federal Geographic Data Committee (FGDC) standard to ensure compatibility with the Global Earth Observation System of Systems (GEOSS) program, along with many other global and regional programs that have adopted this standard (e.g., OBIS, GCMD, GBIF). The FGDC standard is widely embraced by IPY and can be stored and linked with all relevant biodiversity and other data sources. Freely available software allows users to apply these metadata conveniently and post them online with the clearinghouses (e.g., Polar Data Catalogue). Because data that lack metadata can be virtually unusable, both are crucial requirements and thus requested by funding agencies and the data initiatives cited here.

For further information and additional copies contact:
CAFF INTERNATIONAL SECRETARIATBorgir
Nordurslod600 Akureyri
ICELAND
Telephone: +354 462 3350Fax: +354 462 3390E-mail: [email protected]
Internet: http: //www.caff.is
ISBN NUMBER: ISBN 978-9935-431-19-6Prentstofan: Stell