current and historical trends in …casmat.org/wp-content/uploads/2017/02/icatreport.pdfcurrent and...
TRANSCRIPT

CURRENT AND HISTORICAL TRENDS IN GENERAL AVIATION IN THE UNITED STATES
Kamala I. Shetty and R. John Hansman
This report is based on the S.M. Thesis of Kamala I. Shetty submitted to the Department of Aeronautics and Astronautics in partial fulfillment of the requirements for the degree of
Master of Science in Aeronautics and Astronautics at the Massachusetts Institute of Technology.
Report No. ICAT-2012-6 August 2012
MIT International Center for Air Transportation (ICAT)
Department of Aeronautics & Astronautics Massachusetts Institute of Technology
Cambridge, MA 02139 USA

2

Current and Historical Trends in General Aviation in theUnited States
byKamala I. Shetty and R. John Hansman
Abstract
General aviation (GA) is an important component of aviation in the United States. In2011, general aviation and air taxi operations represented 63% of all towered opera-tions in the United States, while commercial aviation was responsible for 34% of thoseoperations. It is clear that GA is a considerable component of the national airspaceand airport system, even when only accounting for towered operations. Because ofthis significant presence, insight into GA is relevant to issues in air tra�c manage-ment, air transportation infrastructure, and aviation safety, among others. Beyondthe operational aspect, GA is of significance to society as a whole and to other stake-holders, including pilots groups, aircraft manufacturers, and the work force. In 2009,general aviation generated 496,000 jobs and its total economic contribution to theU.S. economy was valued at $76.5 billion.
However, a comparison of general aviation’s impact on jobs and on the economybetween 2008 and 2009, shows a 20% decrease in jobs and a 21% decrease in totaleconomic impact in the course of a year. There is also a significant decreasing trendin the active pilot population, along with steady decreases in GA flight hours andtowered operations.
The objective of this thesis is to explore the details of these changing trends andto determine what drives and what hinders general aviation activity in the country. Acombination of data analysis and the development of a survey administered to generalaviation pilots shed light on what has driven activity in the past on a national scale,what factors a↵ect an individual pilot’s level of activity, and what challenges thegeneral aviation community faces in the future.
3

4

Acknowledgments
This research was supported by the Federal Aviation Administration through con-tracts DTFAWA10F00092 and Z990301.
The help from general aviation publications, including AVweb, has had a signifi-cant role in the success of this project. Of course, much gratitude is also extended tothe generous response from the general aviation community and to the hundreds ofpilots that took the time to participate in this project.
5

6

Contents
1 Introduction 15
1.1 Research Motivation . . . . . . . . . . . . . . . . . . . . . . . . . . . 15
1.1.1 What is General Aviation . . . . . . . . . . . . . . . . . . . . 15
1.1.2 Current Trends in General Aviation . . . . . . . . . . . . . . . 16
1.1.3 General Aviation Stakeholders . . . . . . . . . . . . . . . . . . 18
1.2 Study Overview . . . . . . . . . . . . . . . . . . . . . . . . . . . . . . 20
2 General Aviation Forecasts 21
2.1 Types of Forecasts . . . . . . . . . . . . . . . . . . . . . . . . . . . . 22
2.1.1 FAA Aerospace Forecast . . . . . . . . . . . . . . . . . . . . . 22
2.1.2 FAA Terminal Area Forecast . . . . . . . . . . . . . . . . . . . 22
2.2 Analysis of 2006 TAF Forecast . . . . . . . . . . . . . . . . . . . . . . 24
2.2.1 All Airports . . . . . . . . . . . . . . . . . . . . . . . . . . . . 24
2.2.2 Towered Airports . . . . . . . . . . . . . . . . . . . . . . . . . 28
2.3 2001 - 2011 Aerospace Forecasts . . . . . . . . . . . . . . . . . . . . . 30
2.3.1 Comparison of Past Forecasts . . . . . . . . . . . . . . . . . . 30
2.3.2 2011-2031 Forecast . . . . . . . . . . . . . . . . . . . . . . . . 30
2.4 Summary . . . . . . . . . . . . . . . . . . . . . . . . . . . . . . . . . 31
3 Trends 33
3.1 Activity Trends . . . . . . . . . . . . . . . . . . . . . . . . . . . . . . 33
3.1.1 Operations Trends . . . . . . . . . . . . . . . . . . . . . . . . 33
3.1.2 Hours Flown Trends . . . . . . . . . . . . . . . . . . . . . . . 35
3.1.3 Spatial Trends . . . . . . . . . . . . . . . . . . . . . . . . . . . 35
3.2 Drivers and Related Trends . . . . . . . . . . . . . . . . . . . . . . . 36
3.2.1 Pilot Population . . . . . . . . . . . . . . . . . . . . . . . . . 36
3.2.2 Aircraft Population . . . . . . . . . . . . . . . . . . . . . . . . 38
3.2.3 Fuel . . . . . . . . . . . . . . . . . . . . . . . . . . . . . . . . 41
3.2.4 Socio-economic factors . . . . . . . . . . . . . . . . . . . . . . 43
3.2.5 World Events . . . . . . . . . . . . . . . . . . . . . . . . . . . 45
3.2.6 Safety . . . . . . . . . . . . . . . . . . . . . . . . . . . . . . . 45
3.3 Conclusions . . . . . . . . . . . . . . . . . . . . . . . . . . . . . . . . 47
7
4 Survey 494.1 Goals . . . . . . . . . . . . . . . . . . . . . . . . . . . . . . . . . . . . 494.2 Design . . . . . . . . . . . . . . . . . . . . . . . . . . . . . . . . . . . 50
4.2.1 Survey type . . . . . . . . . . . . . . . . . . . . . . . . . . . . 504.3 Sampling Method . . . . . . . . . . . . . . . . . . . . . . . . . . . . . 524.4 Sources of Error . . . . . . . . . . . . . . . . . . . . . . . . . . . . . . 524.5 Response Profile . . . . . . . . . . . . . . . . . . . . . . . . . . . . . . 54
4.5.1 Certifications and Ratings . . . . . . . . . . . . . . . . . . . . 544.5.2 Age . . . . . . . . . . . . . . . . . . . . . . . . . . . . . . . . 554.5.3 Gender . . . . . . . . . . . . . . . . . . . . . . . . . . . . . . . 564.5.4 Regions . . . . . . . . . . . . . . . . . . . . . . . . . . . . . . 574.5.5 Occupation . . . . . . . . . . . . . . . . . . . . . . . . . . . . 57
4.6 Summary . . . . . . . . . . . . . . . . . . . . . . . . . . . . . . . . . 58
5 Survey Results 595.1 Flight Hours . . . . . . . . . . . . . . . . . . . . . . . . . . . . . . . . 595.2 Flying Beginnings . . . . . . . . . . . . . . . . . . . . . . . . . . . . . 605.3 2011 Activity . . . . . . . . . . . . . . . . . . . . . . . . . . . . . . . 62
5.3.1 Not Active . . . . . . . . . . . . . . . . . . . . . . . . . . . . . 625.3.2 Active . . . . . . . . . . . . . . . . . . . . . . . . . . . . . . . 63
5.4 Peak Activity . . . . . . . . . . . . . . . . . . . . . . . . . . . . . . . 645.5 Opinions . . . . . . . . . . . . . . . . . . . . . . . . . . . . . . . . . . 685.6 Future Outlook . . . . . . . . . . . . . . . . . . . . . . . . . . . . . . 70
5.6.1 Levels of Activity . . . . . . . . . . . . . . . . . . . . . . . . . 705.6.2 Fuel . . . . . . . . . . . . . . . . . . . . . . . . . . . . . . . . 715.6.3 Activity Stimuli . . . . . . . . . . . . . . . . . . . . . . . . . . 715.6.4 Current Challenges . . . . . . . . . . . . . . . . . . . . . . . . 73
6 Conclusion 75
A Survey of Active and Inactive General Aviation Pilots on FactorsInfluencing Flight Activity 77
8

List of Figures
1-1 2009 General Aviation and Part 135 Survey Results: Total HoursFlown by Use [2] . . . . . . . . . . . . . . . . . . . . . . . . . . . . . 16
1-2 Historical Trend of Commercial and General Aviation [4] . . . . . . . 161-3 GA activity and GDP [4] . . . . . . . . . . . . . . . . . . . . . . . . . 171-4 2011 National Plan of Integrated Airport Systems (Image Source:[6]) 18
2-1 Commercial Growth Forecast [14] . . . . . . . . . . . . . . . . . . . . 252-2 General Aviation Growth Forecast [14] . . . . . . . . . . . . . . . . . 262-3 Comparison of GA and Commercial Projected Growths [14] . . . . . 262-4 2006 Commercial Operations Forecast [14] . . . . . . . . . . . . . . . 272-5 2006 General Aviation Itinerant Operations Forecast [14] . . . . . . . 272-6 2006 General Aviation Local Operations Forecast [14] . . . . . . . . . 282-7 2006 Towered Commercial Operations Forecast [14][4] . . . . . . . . . 292-8 2006 Towered General Aviation Itinerant Operations Forecast [14][4] . 292-9 2006 Towered General Aviation Local Operations Forecast [14][4] . . 292-10 Local General Aviation Operations at All Towered Airports [15] . . . 302-11 Itinerant General Aviation Operations at All Towered Airports [15] . 31
3-1 Towered Operations[4] . . . . . . . . . . . . . . . . . . . . . . . . . . 343-2 Hours Flown by Use [2] . . . . . . . . . . . . . . . . . . . . . . . . . . 343-3 General Aviation Airports and Weather [4] . . . . . . . . . . . . . . . 353-4 Pilot Certificates Held by Category [16] . . . . . . . . . . . . . . . . . 363-5 Percentage of Pilot Certificates Held in the U.S. Population, by Cate-
gory [16] . . . . . . . . . . . . . . . . . . . . . . . . . . . . . . . . . . 373-6 Instructional Hours [2] . . . . . . . . . . . . . . . . . . . . . . . . . . 373-7 Average Age of Active Pilots by Category [16] . . . . . . . . . . . . . 383-8 General Aviation Shipments by Type of Aircraft Manufactured in the
United States [16] . . . . . . . . . . . . . . . . . . . . . . . . . . . . . 383-9 Towered General Aviation Operations and Events A↵ecting Aircraft
Population . . . . . . . . . . . . . . . . . . . . . . . . . . . . . . . . . 393-10 General Aviation Total Shipments, Less Foreign Exports, by Type of
Aircraft Manufactured in the United States [16] . . . . . . . . . . . . 403-11 General Aviation Total Billings by Type of Aircraft Manufactured in
the United States [16] . . . . . . . . . . . . . . . . . . . . . . . . . . . 403-12 Prime Supplier Sale Volumes [17] . . . . . . . . . . . . . . . . . . . . 413-13 Fuel Sale Prices [18] . . . . . . . . . . . . . . . . . . . . . . . . . . . . 42
9

3-14 Towered General Aviation Operations and Rising Fuel Prices . . . . . 42
3-15 Disposable Personal Income Per Capita Chained 2005 Dollars [21] . . 43
3-16 Unemployment [22] . . . . . . . . . . . . . . . . . . . . . . . . . . . . 44
3-17 Towered General Aviation Operations and Economic Recessions . . . 44
3-18 Towered General Aviation Operations and World Events . . . . . . . 45
3-19 General Aviation Accidents [26] . . . . . . . . . . . . . . . . . . . . . 46
3-20 General Aviation Fatalities [26] . . . . . . . . . . . . . . . . . . . . . 46
3-21 Factors A↵ecting General Aviation . . . . . . . . . . . . . . . . . . . 47
4-1 Survey Respondents’ Certification vs. FAA Active Airmen Certifica-tion Estimates . . . . . . . . . . . . . . . . . . . . . . . . . . . . . . . 55
4-2 Survey Respondents’ Age Distribution vs. FAA Total Active AirmenAge Distribution Estimates [28] . . . . . . . . . . . . . . . . . . . . . 56
4-3 States in which Respondents were Primarily Based in 2011 . . . . . . 57
4-4 Regions in which Respondents Flew in 2011 . . . . . . . . . . . . . . 58
5-1 Survey Results - “What is your total flight time?” . . . . . . . . . . . 59
5-2 Survey Results - “When did you start flying?” . . . . . . . . . . . . . 60
5-3 Survey Results - “There are many reasons why someone makes thedecision to learn to fly. Please select all of the following that appliedto you.” . . . . . . . . . . . . . . . . . . . . . . . . . . . . . . . . . . 61
5-4 Survey Results - Reasons for respondents began flying by years theybegan flying . . . . . . . . . . . . . . . . . . . . . . . . . . . . . . . . 61
5-5 Survey Results - “Please explain why you did not fly in 2011?” . . . . 62
5-6 Survey Results - “Approximately, how many hours did you fly in 2011?” 63
5-7 Survey Results - “What type of aircraft did you fly the most during2011?” . . . . . . . . . . . . . . . . . . . . . . . . . . . . . . . . . . . 63
5-8 Survey Results - “During what time period was your flying activity atits highest?” . . . . . . . . . . . . . . . . . . . . . . . . . . . . . . . . 64
5-9 Survey Results - “Please explain why 2010-2011 was the time of yourhighest flying activity?” . . . . . . . . . . . . . . . . . . . . . . . . . 65
5-10 Survey Results - “Approximately, how many hours did you fly in a yearduring your period of peak flying activity?” . . . . . . . . . . . . . . 65
5-11 Survey Results - “What type of aircraft did you fly the most duringyour period of peak flying activity?” . . . . . . . . . . . . . . . . . . 66
5-12 Survey Results - “What impact did the change in the following factorshave on your flying between 2011 and your peak flying years?” . . . . 67
5-13 Survey Results - “To what extent do you agree or disagree with thefollowing statements?” . . . . . . . . . . . . . . . . . . . . . . . . . . 69
5-14 Survey Results - “How do you expect your level of flying activity tochange over the next few years? ” . . . . . . . . . . . . . . . . . . . . 70
5-15 Survey Results - “How do you expect your level of flying activity tochange over the next few years? ” . . . . . . . . . . . . . . . . . . . . 71
10

5-16 Survey Results - “Is your flying activity dependent on fuel costs? Atwhat fuel price (per gallon) would your flying activity significantlydecrease or stop completely?” . . . . . . . . . . . . . . . . . . . . . . 72
A-1 Survey Flow . . . . . . . . . . . . . . . . . . . . . . . . . . . . . . . . 77
11

12

List of Tables
1.1 Number of Airports in the NPIAS by Category . . . . . . . . . . . . 19
3.1 Economic Recessions in the United States [23] . . . . . . . . . . . . . 44
4.1 Average Age of Active Pilots by Category . . . . . . . . . . . . . . . 56
13

14

Chapter 1
Introduction
1.1 Research Motivation
The goal of this study is to gain a better understanding of the factors that drive generalaviation activity in the United States. Historical levels of activity are analyzed alongwith changes in related time series that include fuel costs, aircraft shipments andaverage ages, numbers of active pilots, socioeconomic indicators, etc. Another aspectof the study involves a survey of general aviation pilots in order to gain additionalinsights into these factors by gathering details from the experience of individual pilotsand the reasons they choose to fly or to stop flying. The results of the survey alongwith the analysis of historical trends will help identify any challenges facing the growthof general aviation and its role in the greater aviation community, including what maypromote or hinder activity in the future.
1.1.1 What is General Aviation
Commercial aviation activities in the US are easily defined as all operations that areregulated by Part 121 of the Federal Aviation Regulations put forth by the FAA,which encompasses all scheduled air carrier service [1].
The term general aviation, on the other hand, is a catch-all phrase for all aviationactivities that doe not fall under commercial aviation, major cargo or military opera-tions, and covers a broad spectrum of aviation activity uses. The FAA, in its annualGeneral Aviation and Part 135 Survey, categorizes GA activity by use. Figure 1-1shows the di↵erent categories of GA activity and their corresponding portion of allhours flown in 2009.
From an operational standpoint, these GA activities can be categorized as eitherlocal or itinerant operations, whereas commercial aviation is almost exclusively itin-erant. Operations are defined as either an arrival or departure of local or itinerantnature. Local operations are defined as operations performed by aircraft that areoperating within the local tra�c pattern of the airport or within sight of the airport,are going to designated local practice areas within 20 miles of the airport, or areperforming simulated instrument approaches or low passes at the airport [3]. Forinstance many operations that fall within the personal or instructional use category
15

Figure 1-1: 2009 General Aviation and Part 135 Survey Results: Total Hours Flownby Use [2]
are categorized as local. Itinerant operations are defined as the compliment of localoperations, i.e. aircraft coming from or going to a di↵erent airport. Most business orcorporate transportation uses would call under itinerant operations.
1.1.2 Current Trends in General Aviation
Figure 1-2 compares historical trends for commercial operations and general aviationoperations at towered airports across the country. The plot shows that the twocategories have not followed the same general trends and are driven by di↵erentfactors.
Figure 1-2: Historical Trend of Commercial and General Aviation [4]
16

Historical trends have shown that the growth in annual commercial air travel,measured in revenue passenger kilometers (RPK), is approximately twice the annualgrowth rates of gross domestic product (GDP) [5]. This strong relationship to GDPindicates a significant dependence on the national and world economy and commercialoperations, through some relationship with RPKs, should change in a tractable way.Unlike commercial aviation, GA in recent history has not closely followed aggregateeconomic indicators, such as the GDP. This is illustrated in Figure 1-3. Even in thedecades before 2000, when activity on an average trended upwards along with growthin GDP, there were significant anomalies that indicate that there are other majorfactors at play.
Figure 1-3: GA activity and GDP [4]
Since GA is such a broad category of aviation, many di↵ering drivers are workingat one time to a↵ect aggregate levels of operations. Some of these factors includeeconomics, the volatility of fuel prices, increased use of internet in business (hence,decreasing business travel), tax incentives for aircraft ownership, the costs of owningand operating personal aircraft, the total private pilot and GA aircraft populations,and many more.
Two things are now clearly evident. First, it is clear that while commercial avi-ation and general aviation may share some drivers, such as economic growth, theydo have their own distinct characteristics and factors a↵ecting their levels of activity.This leads to the question of whether or not forecasting one group over the otherhas shown to be more accurate. Second, it is clear that general aviation activity atan aggregate level has su↵ered a significant and seemingly persistent decline over thepast 12 years.
17

1.1.3 General Aviation Stakeholders
Many groups are interested in and play a role, in one way or another, in generalaviation and its future in the United States.
Airports
The FAA’s National Plan of Integrated Airport Systems (NPIAS) identifies all domes-tic, public use airports that are considered a significant part of the civil air transporta-tion system. As of February 2010, There were a total of 19,734 airports (includingheliports and seaplane bases), of which only 3,380 are included in the NPIAS [6].Airports that are included are categorized as follows [6]:
• Primary Commercial Service Airports - airports receiving scheduled passengerservice and having 10,000 or more enplaned passengers per year
• Nonprimary Commercial Service Airports - airports receiving scheduled passen-ger service and having 2,500 or more enplaned passengers per year
• Reliever Airports - airports that relieve congestion at Commercial Service Air-ports by providing improved general aviation service
• General Aviation Airports - all other airports
Figure 1-4 maps out all airports by its category. It is clear that there is a significantamount of airports that solely accommodate GA activity as compared to the numberof primary and secondary airports which, in general, are also able to accomodateGA activity. Table 1.1 shows the actual number of airports by category and theircorresponding percentage of the NPIAS. Commercial aviation is concentrated in about15% of the nation’s significant airports, while GA activity is clearly more dispersed.
Figure 1-4: 2011 National Plan of Integrated Airport Systems (Image Source:[6])
18

Table 1.1: Number of Airports in the NPIAS by Category
Primary 382 11%Nonprimary 121 4%Reliever 269 8%General Aviation 2,560 77%
The type of activity at an airport obviously a↵ects the services that an airportprovides, ranging from runway sizes to hangar space to passenger processing areasand so on. It is, therefore, also obvious the need to distinguish between types ofoperations when planning and operating an airport. The greater the understandingof how general aviation is evolving across the country allows airports to better planfor today and for the future.
Government
Along with local planners and governments, the federal government is very interestedin the demand for airports, as it can base its decision on funding of airport projectson the expected utilization of their investments. The FAA is charged with the task ofdistributing grants across airports in the NPIAS so that the net benefit to the wholeair transportation network and society as a whole is maximized. Those grants aredistributed through the Airport Improvement Program (AIP), a pool of money thatis funded through the collection of airline ticket taxes on all commercial flights [7].
In 2009, $3.47 billion was distributed through 2,885 grants across the country[8]. Only 30.7% of the funds were given to the projects at the largest commercialairports, where a disproportionately larger amount of funds, (88.6%) are collectedfrom all passenger enplanements. Other airports at which significant GA activity ispresent along with commercial activity collects 65.5% of those funds. The smallest ofall airports, those designated as general aviation airports, receive the greatest amountof grants, 52.9%, and receive a significant 17.3% of the funds.
In addition to the importance at the airports, the FAA is interested in generalaviation activities in planning for future workload at air tra�c control towers and forthe management of the National Airspace System (NAS).
American Public
Whether or not its importance is fully appreciated by society, general aviation pro-vides importance service to the American people. General aviation includes activitiesthat are crucial to small and large business, agriculture, law enforcement, flight train-ing, medical evacuation, tourism, and travel to remote areas.
General aviation also contributes to the American economy. In 2009, general avi-ation generated 496,000 jobs and its total economic contribution to the U.S. economywas valued at $76.5 billion [9]. However, a comparison of general aviation’s impact
19

on jobs and on the economy between 2008 and 2009, shows a 20% decrease in jobsand a 21% decrease in total economic impact in the course of a year.
Aircraft Manufacturers
A significant portion of the economic impact of general aviation, 33.7% in 2009, comesfrom aircraft manufacturing. The aircraft manufacturing business relies on the levelsof general aviation activity in the country and needs to know its future in order toconduct business e�ciently.
The general aviation fleet clearly dominates commercial aircraft in terms of num-bers. In 2008, 96% of the active fleet in the United States were general aviationaircraft with 228,662 aircraft versus 7,856 in the country’s commercial fleet [10].
1.2 Study Overview
Given the current state of general aviation in the United States and the number of itsunique stakeholders, a greater understanding of its drivers is of significant importance.The goal of this study is to gain a better understanding of the trends involving generalaviation, including trends in its activity levels, drivers, and forecasting, as well ascurrent attitudes and outlooks.
Chapter 2 overviews the major forecasts used in the US for general aviation ac-tivity. It examines old forecasts and analyses the accuracy of those forecasts andcompares them to those of commercial aviation, in order to determine whether thereis a gap in forecast error between the two groups. GA forecasts are described ingeneral terms, along with a short summary of the FAA’s 2011 forecast for generalaviation over the next 20 years.
Chapter 3 is a survey of the historical and current trends in general aviation. Itfirst looks at di↵erent measures of activity, including towered activity from the FAA’sATADS and hours flown data from the FAA’s General Aviation and Part 135 Survey.It then goes on to characterize the factors a↵ecting this activity including historicaltrends of fuel, socio-economic factors, pilot population, aircraft population, safetyissues, and some other exogenous factors than may have an e↵ect on national levelsof activity.
In Chapter 4, a sample survey of general aviation pilots is introduced as a wayto supplement the data analysis of Chapter 3 in understanding what drives activitylevels. The details of the survey design and methods are discussed, along with anyissues that may a↵ect the interpretation of the survey results.
The details of the survey responses are presented in Chapter 5. An analysisis prepared at the aggregate level and then again within subgroups of the surveyrespondents.
Chapter 6 summarizes the findings of the paper.
20

Chapter 2
General Aviation Forecasts
Chapter 1 discussed the importance of general aviation to society and to its variousstakeholders. Many, if not all, of those stakeholders are interested in the future ofthis subset of aviation, and many either utilize or develop forecasts of GA activity ordemand to help make decisions, so as to prepare for the future or to makes changesto alter the course that it may take.
This chapter is not meant to be an in-depth study of general aviation forecastingor of aviation forecasting in general. The goal, however, is two fold. The first goal isto help bolster the argument that further research into the drivers of general aviationactivity is indeed warranted. The second is to look at and characterize the currentforecasts for general aviation activity in the United States.
One of the main practical goals of identifying the drivers of general aviation is touse that information in the future. As with any phenomena, the forecaster’s job ofpredicting the future is made easier when the system can be modelled as accuratelyas possible. While a forecast’s realized inaccuracy may not necessarily indicate a lackof understanding of the phenomena, it can be the result of di�culties in predictingdriving forces in a necessarily unpredictable world, an incomplete model of the processshould most definitely have a negative impact on the accuracy. Therefore, analyzingthe accuracy of general aviation forecasts, especially in comparison to other forecasts,can provide evidence bolstering the argument for further investigation of generalaviation. To do this, the results of the FAA’s 2006 Terminal Area Forecast areanalyzed and the accuracy of the short term forecasts for GA and commercial activityare compared.
The last part of the chapter looks at the the FAA’s Aerospace Forecast releasedin years 2001 to 2011. A comparison of the forecasts for the last 10 years helpscharacterize the general outlook on general aviation as seen by forecaster’s at the FAA.In later chapters, trends and and other qualitative data will be compared against thecurrent forecast, in order to help qualitatively judge the reasonableness of the forecast.
21

2.1 Types of Forecasts
Forecasts of general aviation can include forecasts of hours flown, operations, totalfleet, based aircraft or any other metric. They can be focused on aggregate levelsacross the nation or be focused on the regional, state or airport levels.
While airports, regional aviation authorities, and other stakeholder create fore-casts of GA activity ,the two biggest forecasts in the United States,the FAA’s AerospaceForecast and Terminal Area Forecast, are discussed below.
2.1.1 FAA Aerospace Forecast
The FAA Aerospace Forecast is a yearly report that presents a 20 year outlook oncommercial and general aviation at the national level.
For general aviation, the reports includes forecasts for:
• Active aircraft
• Hours flown
• Active pilots by type of certification
• Aircraft fuel consumption
• Towered (local and itinerant) operations
The methodologies used to forecast these metrics are not explicitly described,however, the following points are made throughout the report and give some indicationon the forecast methods:
• Growth rates are applied to current estimates of fleet size, hours flown andutilization from the General Aviation and Part 135 Activity Survey [2].
• The growth rate for the fleet is based on assumptions on fleet attrition inconjunction with General Aircraft Manufacturers Association (GAMA) aircraftshipment statistics.
• The growth rate of flight hours are based on assumptions on utilization inconjunction with the forecasted fleet.
• The forecast is formulated in a similar fashion year to year in hopes the errorof the forecast in relation to realized levels can be estimated from year to year.
2.1.2 FAA Terminal Area Forecast
The FAA’s Terminal Area Forecast (TAF) is an o�cial activity forecast for all air-ports in the NPIAS and is used by many groups in the federal government, stategovernments, local airport authorities, and aviation operators for planning. The TAFis based on the results of the Aerospace Forecast.
The TAF consists of annual forecasts at the airport level for :
22

• total enplanements for air carriers and regional carriers
• total itinerant operations for air carrier, air taxi and commuter, general aviation,and military activity
• total local operations for general aviation and military activity
• total instrument operations
The methodology used to create the commercial and GA operations forecasts inthe TAF is abstractly outlined [11] and summarized below:
• The TAF is an unconstrained forecast, meaning the forecast is independent ofcurrent capacities of airports or the national airspace system and is dependentonly on the driving factors of aviation demand.
• Forecasts are formulated from historical relationships between activity and otherlocal and national factors and are compared to an airport’s historical trend.Regression analysis and other growth rates are used as well. No specific modelsare identified.
• The historical data for activity at airports with tower service can be assumedto have negligible measurement error. For all other airports (a majority of GAairports), operations are taken from FAA Form 5010, which are estimates givenby inspectors, or from other various sources.
• Thirty five airports that are included in the FAA’s Operation Evolution Plan(OEP), large commercial hubs of special significance to the air transportationsystem [12], are subject to a more thorough analysis which takes into account:
– local socio-economic factors
– growth rates of origin-destination and connecting passengers
– prices into the airport
– trends in load factors and aircraft sizes
– future schedules from the O�cial Airline Guide (OAG)
• The forecast is constructed by the O�ce of Aviation Policy and Plans, sent outto FAA regional o�ces for reviews and suggestions are taken into consideration.The forecast also may utilize forecasts from local airport authorities or airportmaster plans, if the methods of forecasting are approved by the FAA.
The TAF is an important source of information for policy makers and planners,but it is clear that it has its limitations, and should be supplemented with more indepth analysis.
The documents accompanying the TAF for public release do not stress the meth-ods used for non-towered airports. Also, the TAF presents a single forecasted valueto the public, with no indication of confidence in those values. It does not give any
23

level of confidence in the presented forecast, nor does it make any other attempt toshow a range of values the future could see(i.e. giving optimistic and pessimisticassessments). This may be due to political reasons or due to the fact that the TAFis utilized by many di↵erent parties, some of whom do not have in depth knowledgeof forecasting issues.
Some smaller issues with the methodologies used to formulate the TAF include thefact that the TAF uses inputs from airport master plans and local airport authorities.This is a double edged sword. While local o�cials have a better intuition of whereoperations trends are headed and are more familiar with the issues facing the airportthat can a↵ect activity, it can also lead to bias towards optimism. One source of thisbias is the competition within the AIP funding program itself, as airports will haveto justify that its proposed projects are worthy of grants with levels of future activityworthy of the investments.
Another issue with the TAF and many other aviation forecasts is that since theforecasts are based on historical levels of activity, which can be constrained, regressingon the historical values may not reveal the true unconstrained level of demand.
2.2 Analysis of 2006 TAF Forecast
The 2006 forecast was chosen for this analysis, since it was the oldest forecast availablefor public query. For the purposes of studying the general accuracies of these forecasts,a forecast model that contains more than four realized time periods would have beenideal. This is because short term conditions (i.e. four years into the future) will mostlikely follow the levels and growth rates prevailing at the time of the forecast andthen may be less of an indication of the underlying assumptions of the forecastingmethods [13]. Unfortunately, the analysis is dictated by the information currentlyreadily available to the public.
2.2.1 All Airports
The model has forecasts for 3,392 facilities and queries to this model will return withhistorical activity levels from fiscal years 2001 - 2006 as well as forecasted values atevery year between fiscal years 2007 and 2025. The following analysis first looks atthe national forecast and then looks at the characteristics of the towered airportsseparately.
Characteristics of Growth
Of the 3,392 facilities in the forecast, 59% served non-zero levels of commercial ac-tivity in 2006. It was also noted that no airports in the system were forecasted toaccommodate commercial activity that did not do so previously. The types of growthfor these airports, the percentage change from the base level in 2006 to projectedlevels in 2025, is shown in Figure 2-1. The most striking observation is the fact thatthe majority of airports are assumed to have no change in commercial operations. Of
24

those with projections for change from the 2006 levels, the majority were assumed tohave positive growth in operations through 2025. Figure 2-1 also shows the relativefrequency of those airports that were given positive or negative forecasts by the per-centage growth they are assumed to have in the TAF. The distribution is somewhatof a bell curve, with a median of 22% growth over the two decades. There were a fewoutliers, that had growth in the thousands of percent. These outliers are the airportsthat were projected to serve an increased number of operations from a very low baselevel.
Figure 2-1: Commercial Growth Forecast [14]
Similarly, no airports in the system were forecast to accommodate general aviationthat did not do so in 2006. Given that the portion of the NPIAS that serves generalaviation is 95.6% in the baseline year, there isn’t a large potential opportunity tospread. The expected growths for these airports that serve GA is summarized inFigure 2-2. The amount of airports with forecasted change in GA operations was only25%, compared to the 32% for the same metric for commercial operations. Figure 2-2also shows the histogram of non-zero growths for GA activity. It is interesting tonote that the variability in growth is smaller than that for the same distribution forcommercial activity and that the median of the distribution is slightly higher (29%vs. 22%).
Figure 2-3 corresponds to the subset of the NPIAS that had both commercialand GA operations. The forecast continues to expect that these 611 airports willserve both types of activity. The histogram tallies how GA percentage growth andcommercial growth are related at a specific airport, for all the airports. The horizontalaxis is the range of multipliers k, where commercial growth = k ⇤ GA growth. Thedistribution is centered around zero, indicating that at a majority of airports, assumedgrowth rates of commercial and GA operations were approximately the same.
National Forecast
The 2006 TAF projects a 40.9% increase in nationwide commercial operations, whileGA operations are projected to grow by 17.3%.
25
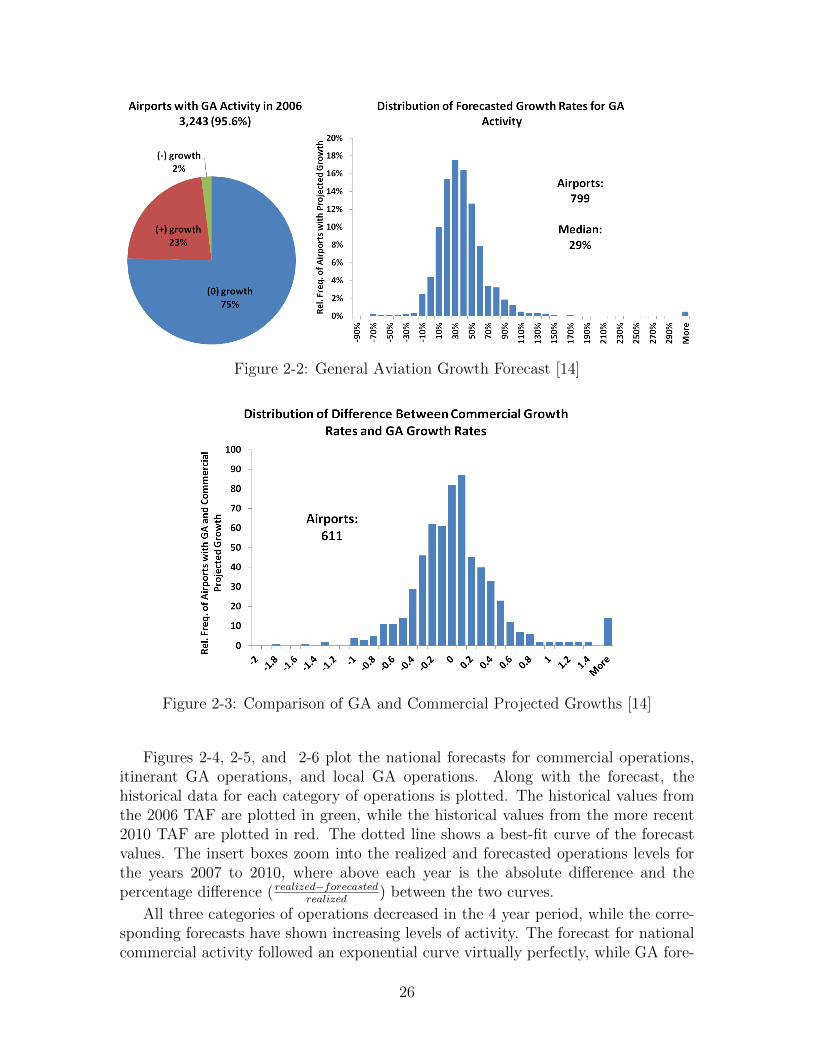
Figure 2-2: General Aviation Growth Forecast [14]
Figure 2-3: Comparison of GA and Commercial Projected Growths [14]
Figures 2-4, 2-5, and 2-6 plot the national forecasts for commercial operations,itinerant GA operations, and local GA operations. Along with the forecast, thehistorical data for each category of operations is plotted. The historical values fromthe 2006 TAF are plotted in green, while the historical values from the more recent2010 TAF are plotted in red. The dotted line shows a best-fit curve of the forecastvalues. The insert boxes zoom into the realized and forecasted operations levels forthe years 2007 to 2010, where above each year is the absolute di↵erence and thepercentage di↵erence ( realized�forecasted
realized
) between the two curves.
All three categories of operations decreased in the 4 year period, while the corre-sponding forecasts have shown increasing levels of activity. The forecast for nationalcommercial activity followed an exponential curve virtually perfectly, while GA fore-
26

Figure 2-4: 2006 Commercial Operations Forecast [14]
Figure 2-5: 2006 General Aviation Itinerant Operations Forecast [14]
casts mostly followed a linear trend. As stated before, the forecasts are especiallyoptimistic for commercial operations, as compared to expected growth in GA.
For all categories, the forecasting error increases with time, confirming a prioriexpectations of forecasting behavior. The commercial forecast slightly performedbetter than the forecast for itinerant GA operations for the first two years, but thenfor the second two, the itinerant GA forecast was closer to observed values. From theperspective of strictly measuring the forecast error as compared to reported data, the
27

Figure 2-6: 2006 General Aviation Local Operations Forecast [14]
forecast for local operations appears to have outperformed the other two.This perceived improved accuracy in the local operations forecast, however, may
not be what it initially appears to be. While the 2006 and 2010 TAF data forhistorical values overlap for commercial activity, the curves are disjoint for itinerantGA operations data, and di↵er even further for the local GA operations. This is asymptom of the data reliability; as discussed previously, data for towered airportsis more accurate than the estimates given for non-towered airports and commercialactivity tends towards towered airports while local general aviation tends towardssmaller, non-towered airports.
An inspection of historical data and the forecasts reported in the TAF for non-towered airports shows that a large majority of airports have a constant level ofoperations across past and future years. Not only did they have zero growth as-sumed, the historical values show no change for the years 2001-2005. This indicatesa tendency in reporting to mirror previous years, predisposing the forecast to greaterapparent accuracy.
2.2.2 Towered Airports
Because of the issues of reliability of forecast accuracy for non-towered airports, asubset of 515 airports was chosen for analysis of the accuracies of the forecasts. Theseairports are in the NPIAS and also have operations data available from the FAA’sAir Tra�c Activity System (ATADS) [4]. The forecasts of these towered airports arecompared to the reported operations for fiscal years 2007-2011.
Figures 2-7, 2-8, and 2-9 compare the forecasts for towered commercial operations,itinerant GA operations, and local GA operations with their observed levels.
28

Figure 2-7: 2006 Towered Commercial Operations Forecast [14][4]
Figure 2-8: 2006 Towered General Avia-tion Itinerant Operations Forecast [14][4]
Figure 2-9: 2006 Towered General Avia-tion Local Operations Forecast [14][4]
The accuracy of the towered commercial operations forecast significantly improvedas compared to the aggregate forecast. Conversely, the general aviation forecastssignificantly deteriorated. This di↵erence in forecasting accuracy demonstrates avery clear di↵erence in the 2006 TAF’s forecast of commercial and GA operations.It appears that the forecasting e↵ort put into commercial activity, especially at thenation’s biggest hubs, are more successful than that put into GA forecasts. Thedi�culty in forecasting GA activity may be due to the complexity of the drivers ofgeneral aviation.
Even though there has been a general trend downwards, starting even before 2006,the forecasts for much of the general aviation operations did not reflect a belief in thecontinuation of those trends. The forecast for general aviation is an optimistic one.The commercial forecast did perform much better in terms of short term forecastaccuracy. Like the GA forecast, it is optimistic, but unlike the GA forecast, theoptimism is more justifiable given the historical trend.
29

2.3 2001 - 2011 Aerospace Forecasts
Now, we shift our focus from evaluating the accuracies of general aviation forecasts tocharacterizing past and current forecasts, as reported in the FAA Aerospace Forecast.
2.3.1 Comparison of Past Forecasts
Figures 2-10 and 2-11 plot the observed and forecasted levels of activity for local anditinerant GA operations, respectively. Observed operations are included from 1994to 2010, along with the the long term forecasts from the years 2000 to 2011 (notethat the length of the forecasts have increased from 10 to 20 years across that timeperiod). Clearly, a generalization can be made about these forecasts that the outlookon general operations are positive. All forecast years project nearly steady growthwithout any periods of decline, even when the observed trend for the previous yearsare negative. While there has been a continual optimism, the projected growth rateshave slowly decreased from the 2000 to 2011 forecasts in response to the observedtrend.
Figure 2-10: Local General Aviation Operations at All Towered Airports [15]
2.3.2 2011-2031 Forecast
Figures 2-10 and 2-11 show the forecast levels of local and itinerant operations until2031. Local GA operations and itinerant GA operations are forecast to grow over the20 year period by 27.1% and 28.2%, respectively.
The forecast posits that the general aviation fleet will increase from 224,172 air-craft in 2010 to 270,920 in 2031, growing at an average rate of 0.9% a year. Within
30

Figure 2-11: Itinerant General Aviation Operations at All Towered Airports [15]
this aggregate growth, the fixed-wing turbine aircraft fleet will grow at a rate of 3.1%per year, the fixed-wing piston aircraft fleet will grow at a rate of 0.2% per year, andthe rotorcraft fleet will grow at a rate of 2.6% per year.
General aviation hours flown are forecast to increase from 24.1M in 2010 to 37.8Min 2031, an average annual growth rate of 2.2% a year. Forecasts for hours flown byaircraft type include fixed-wing turbine aircraft hours flown growing at a rate of 4.0%per year, fixed-wing piston aircraft hours flown growing at a rate of 0.7% per year,and rotorcraft hours flown growing at a rate of 3.0% per year.
2.4 Summary
Aviation forecasting is an imperfect science, and whether considering commercial orgeneral or any other category of aviation, forecasting is a challenge. Both GA andcommercial activities, driven by di↵ering drivers, are dependent on conditions thatare di�cult to predict.
The 2006 TAF gives an indication that general aviation is either di�cult to predictor is not given the amount of thorough formulation that commercial activity forecast-ing is given, yet GA plays a major role in the United States. While forecasting isonly one part of the planning or evaluations by its stakeholders, it does give someweight to the importance of GA forecasts in relation to its more accurately projectedcommercial counterpart. While it could be simply be said that the ”forecast is alwayswrong”, more can always be done to improve forecasting methods. Looking at thepast trends and better identifying what stimulates or hinders general aviation activ-ity, in the context of the past and in the future may help better formulate forecasts
31

in the future.In the past decade, general aviation forecasting work by the FAA has steadily
remained positive, despite the almost consistent decline in activity, with the 2011forecast being no di↵erent. In the next chapter, an examination of the current andpast trends in America’s general aviation activity and its drivers will put into per-spective this optimistic outlook.
32

Chapter 3
Trends
A better understanding of past trends is necessary for forming better expectationsof the future. This chapter takes a step back and explores some of the trends inactivity over the past decades. Historical trends in fuel, socio-economic factors, pilotpopulation, aircraft population, safety issues are also presented as factors that a↵ectactivity across the country.
3.1 Activity Trends
Some direct measures of general aviation activity in the United States include numberof local and itinerant operations and hours flown.
3.1.1 Operations Trends
As discussed in Chapter 2, data on general aviation operations is most accurate andavailable for towered airports in the NPIAS. All trends presented in this sectioninclude only those related to towered general aviation operations, which are collectedand published in the FAA’s Air Tra�c Activity Data System (ATADS) [4].
Figure 3-1 plots towered general aviation operations across the United States from1969 to 2010. Trends for local operations, VFR itinerant operations, IFR itinerantoperations, total itinerant (VFR and IFR) operations, and total (local and totalitinerant) operations are plotted in the figure. Note that only the total itinerant datais available before 1991 and a breakdown of this total into VRF and IFR operationsis available after that year.
In the decade between 1969 and 1979, general aviation operations grew at a rapidrate, with total operations doubling in the short time span. The majority of thisgrowth resulted from an increase in itinerant operations in this time span. After thisinitial ramp up period, both local and itinerant operations followed similar aggregatetrends.
After the decade of growth, general aviation operations dropped dramatically by32% from peak levels in 1979 to 1982, just in three years. This sharp decline is themost drastic change that general aviation experienced in the past 4 decades.
33

Figure 3-1: Towered Operations[4]
After that decline, operations began to climb again, albeit at a rate slower thanthat in the 1970s. Operations slowed again for five years beginning in 1991, beforeincreasing again to the peak levels of the late 1970s in 2000.
Beginning in 2000, total operations have experienced their longest period of histor-ical decline. Between 2000 and and 2010, total towered operations across the countryhad monotonically decreased by 35%. Within this declining trend in recent years, asignificant drop occurred between 2007 and 2009.
Figure 3-2: Hours Flown by Use [2]
34

3.1.2 Hours Flown Trends
Another source of activity measures comes from the FAA’s General Aviation and Part135 Activity Survey which reports estimates of total hours flown in general aviationoperations every year that the survey has been administered. Figure 3-2 shows howhours flown by category of use has changed throughout this time. The downwardtrends found in towered operations are also echoed in the estimates of hours flown.
3.1.3 Spatial Trends
Figure 3-3 gives an indication of how those total operations in recent years have beendistributed across the country. The top 50 general aviation airports, with respect tototal GA operations, are shown on the map of the United States, with the size of themarkers relating to the number of operations at the respective airports. The map isalso overlayed with average annual precipitation in the United States for the years1961-1990, where the red end of the color spectrum indicates low levels of precipitationand the purple end of the spectrum indicating high levels of precipitation.
These 50 airports account for 33% of all towered general aviation operations in thecountry. The airports also occur in clusters, indicating a link between spatial locationsand activity levels. A strong concentration of operations are in the southwest, whereaverage rainfall is at a minimum in the country. The airports are generally clusteredin the southern half of the country,in Southern California, Arizona, and Florida whereunfavorable winter conditions aren’t as prevalent.
Figure 3-3: General Aviation Airports and Weather [4]
35

3.2 Drivers and Related Trends
3.2.1 Pilot Population
The pilot population in the United States, shown in Figure 3-4, has declined sinceits peak in the 1980s across all categories of certification. It decreased by 28% froma peak of 827,071 certificates in 1980 to 594,285 in 2009. An increase in total certifi-cates occurred in 2010 and it could partially be the result of an increase in studentcertificates due to the validity of those certificates being extended by the FAA to 60months.
Figure 3-4: Pilot Certificates Held by Category [16]
The decline is even more evident in Figure 3-5, which considers the number ofcertificates as a proportion of the U.S. population in a given year. This percentagedropped from 0.36% in 1970 to 0.20% in 2010.
36

Figure 3-5: Percentage of Pilot Certificates Held in the U.S. Population, by Category[16]
This decline in population indicates that pilots are retiring at a rate higher thanthe rate at which student pilots are beginning to fly and become certificated. Thistrend can be seen in the data collected from the FAA’s General Aviation and Part135 Activity Survey. Figure 3-6 shows how the number of instructional flight hourshas decreased by a significant 53% from 1990 levels.
Figure 3-6: Instructional Hours [2]
As could also be expected from the slow addition of new pilots into the pilot pop-ulation of the country, the average age of those left in the population are increasing.Figure 3-7 shows how the average age of pilots has steadily increased from 37.8 yearsin 1981 to 44.2 years in 2010.
37

Figure 3-7: Average Age of Active Pilots by Category [16]
3.2.2 Aircraft Population
Along with the decline in pilot population, there has been a decrease in the manu-facturing of general aviation aircraft in the United States and an over all aging of theaircraft fleet.
Figure 3-8 shows the numbers of general aviation aircraft shipments by US man-ufacturers from 1960 to 2010.
Figure 3-8: General Aviation Shipments by Type of Aircraft Manufactured in theUnited States [16]
General aviation aircraft manufacturing experienced a strong boom in the 1970s,which flooded the country’s active fleet. Figure 3-9 shows how this boom correspondsto the rapid growth in towered operations in the same time period. However, by theearly 1980s, the aircraft manufactures were significantly hindered by rising insurance
38

costs brought on by product liability lawsuits as aircraft aged and resulting accidentswere brought into litigation through tort law. From the peak of production in 1979to its low in 1993, the number of shipments decreased by a staggering 94%.
Figure 3-9: Towered General Aviation Operations and Events A↵ecting Aircraft Pop-ulation
Shipments again began to grow after more than a decade of stagnation whenthe General Aviation Revitalization Act (GARA) was passed into law in 1994. Thenew statute limited the liability of aircraft manufacturers to accidents involving theiraircraft in less than 18 years after the delivery of the aircraft [20]. This removed thecrippling financial burden on aircraft manufactures and allowed for a more aircraftproduction. Also during this time, an increase in fractional ownership programs,benefiting from the favorable tax treatment for co-ownership, stimulated demand foraircraft. A dip in shipments observed from 2000 to 2003 is most likely a result ofeconomic recession and the 9/11 terrorist attacks. Shipments resumed growth until2008, until the economy was hit with another significant recession [23].
Although there has been a slow recovery of growth in the past two decades, thepercentage of of general aircraft exported to foreign countries has increased from20.3% in 1978 to 51.6% in 2010. Figure 3-10 adjusts the number of total aircraftshipments to account for those aircraft that are exported out of the country from1978 to 2010. It is now clearer that of the small increases in shipments in the 2000s,only around half of those have stayed in the country.
39

Figure 3-10: General Aviation Total Shipments, Less Foreign Exports, by Type ofAircraft Manufactured in the United States [16]
The decrease in shipment levels are accompanied by an increase in billings as seenin Figure 3-11. Given the significant reduction in aircraft production, the increase intotal billings suggest high increases in aircraft costs, even in constant dollars.
Figure 3-11: General Aviation Total Billings by Type of Aircraft Manufactured inthe United States [16]
More expensive and fewer new aircraft entering lead to the domination of olderaircraft in the population. The resulting increase in maintenance costs and newacquisition costs imply that operating costs in general aviation have been on the rise,which could contribute significantly to the decrease in activity.
40

3.2.3 Fuel
Fuel cost is one of the most basic, easily tracked, and understood drivers of aviationactivity. As fuel prices increase or the volatility of prices increases, it should beexpected that flying activity levels will be a↵ected negatively.
Figure 3-12 shows how fuel consumption has changed since the 1980s. Aviationgasoline used to fuel piston type aircraft has experienced steadily decreasing salesover this time period, while jet fuel has increased.
Figure 3-12: Prime Supplier Sale Volumes [17]
Figure 3-13 shows how fuel prices have changed since 1978 in constant 2005 dollars.The shaded regions on the graph show periods of significant increase in fuel pricesand they correspond to the shaded regions in Figure 3-14. During the periods of highfuel price increases, towered operations are in significant decline.
41
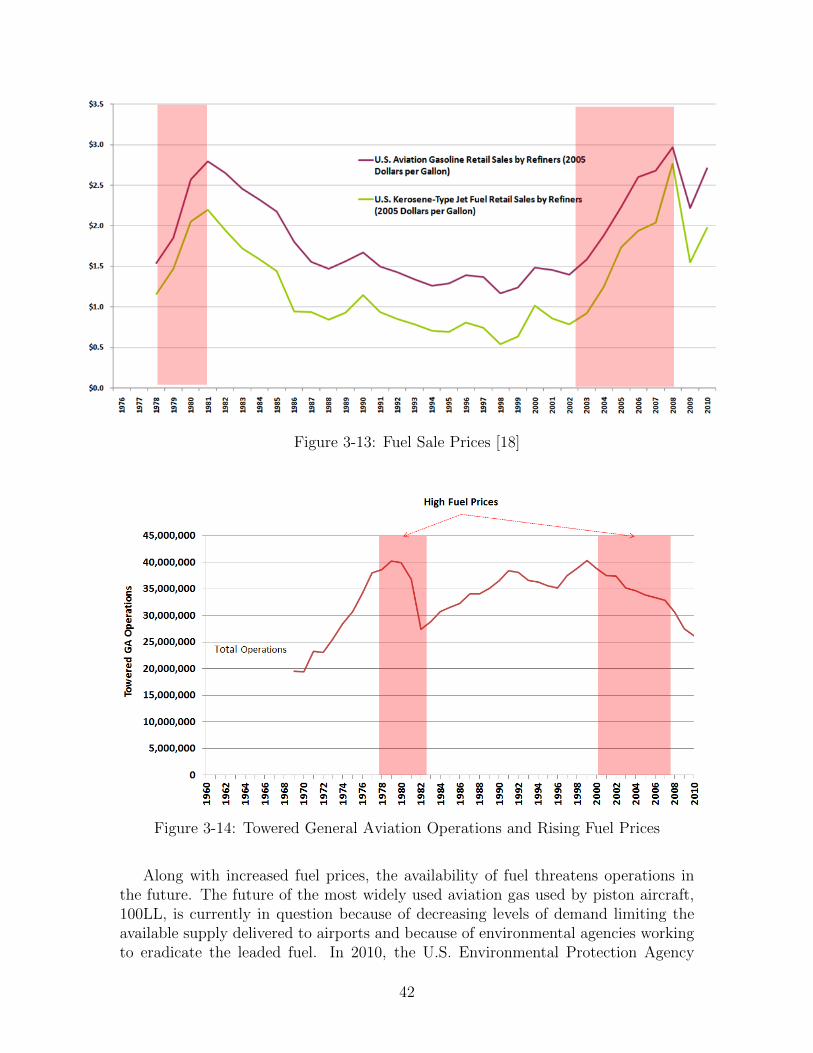
Figure 3-13: Fuel Sale Prices [18]
Figure 3-14: Towered General Aviation Operations and Rising Fuel Prices
Along with increased fuel prices, the availability of fuel threatens operations inthe future. The future of the most widely used aviation gas used by piston aircraft,100LL, is currently in question because of decreasing levels of demand limiting theavailable supply delivered to airports and because of environmental agencies workingto eradicate the leaded fuel. In 2010, the U.S. Environmental Protection Agency
42

issued an Advance Notice of Proposed Rulemaking (ANPR) which announced aninvestigation into current emission engine standards. This action was in responseto pressure from the environmental advocacy group Friends of Earth to regulateor eliminate the leaded gas. The group argued that half of all lead found in theatmosphere can be attributed to piston-engine aircraft emissions and that the public’sexposure to this lead may lead to serious heath e↵ects, especially in children [19].
3.2.4 Socio-economic factors
As discussed in Chapter 1, the national GDP alone is not a strong indicator of ag-gregate general aviation activity in the country. Figure 3-15 and Figure 3-16 showthe trends of other socio-economic factors, disposable personal income per capita, inchained 2005 dollars, and the unemployment rate in the United States, respectively.
Again, disposable personal income alone does not appear to be a good indicator ofactivity. Its positive and mostly steady trend does not track the patterns in activitylevels. While increasing levels of disposable income are expected to correlate withhigher levels of flying activity because of its relation to how much pilots can spendon flying, the trend alone does not take into account costs associated with flying andtherefore cannot alone give an indication of activity.
Figure 3-15: Disposable Personal Income Per Capita Chained 2005 Dollars [21]
Unemployment is hypothesized to a↵ect activity levels in the country as lowerlevels of unemployment indicate better economic conditions for businesses, more pilotsinvolved in aviation related jobs, and more pilots or potential pilots being able tofinancially support their flying activities. The peaks of unemployment between 1970and 1985 did in fact coincide with periods of increase in towered GA activity. Themost recent spike in unemployment, from 2008 and 2010 related to a strong economicrecession, coincides with the begin of the steeper drop-o↵ in activity beginning in2008. The beginning of the two declines in activity starting in 1991 and in 2000 alsocoincides with two periods economic recessions in the country, as seen in Table 3.1.Figure 3-17 illustrates how periods of economic recession, shaded green, relate toperiods of decline in activity.
43

Figure 3-16: Unemployment [22]
Table 3.1: Economic Recessions in the United States [23]
Recession Length Peak Unemployment Rate GDP DeclineJuly 1990 March 1991 8 months 7.8% -1.4%March 2001 - November 2001 8 months 6.3% -0.3%December 2007 - June 2009 1 year, 6 months 10.0% -5.1%
Figure 3-17: Towered General Aviation Operations and Economic Recessions
44

3.2.5 World Events
As also noted in Figure 3-18, downturns in aggregate general aviation levels havealso coincided with events occurring in the United States, other than those directlyrelated to economics or the aircraft production rates discussed previously.
Figure 3-18: Towered General Aviation Operations and World Events
Along with the economic recession of the early 1990s, the decline in activity in thefirst half of the 1990s may also be linked to the country’s involvement in the PersianGulf War (August 1990 February 1991) and to Hurricane Andrew (August 1992),the costliest natural disaster in Florida’s history that destroyed airport facilities andaircraft in one of the nation’s most active area of general activity [24].
The current decline in activity that began in the early 2000s that coincided witheconomic downturn was further compounded by the terror attacks of September11,2001. The attack resulted in the immediate halt of all activity for days and itsmore prolonged e↵ects came in the form of poor perceptions of aviation in the public,increased security procedures at airports, and tighter regulation of the airspace [25].
3.2.6 Safety
As with any type of aviation, safety or perceived safety is an issue that can a↵ecthow the public, users, or potential student pilots view general aviation and, therefore,a↵ect activity.
The number of fatal and non-fatal general aviation accidents in the United Statesalong with the number of accidents per 100,000 flight hours, as reported by the Bureauof Transportation Statistics, are presented in Figure 3-19. Since the late 1960s, thenumber of general aviation accidents has been on an almost steady decline. An evenmore dramatic trend is seen in the number of accidents per 100,000 flight hours, which
45

has followed a near exponential decline since 1938. It dropped from over 30 accidentsper 100,000 flight hours in the late 1960s to 5 accidents per 100,000 flight hours in2010.
Figure 3-19: General Aviation Accidents [26]
Figure 3-20 shows that the absolute number of fatal accidents has been generallydecreasing since the beginning of the 1980s. A decrease of 1,000 fatal accidentsoccured over the past two decades. The total fatalities per accident, however, hasnot dropped at the same rate as the number of accidents and is quite less steady,fluctuating between 0.4 and 0.3 fatalities per fatal accident.
Figure 3-20: General Aviation Fatalities [26]
46

Accidents and accident rates have been on the decline for the past 50 years,while total fatalities per accident have stagnated in recent years. There is no strongcorrelation between the measures of activity discussed in the first section of thischapter and the measures of general aviation safety. The more positive indication ofan advancement in safety does not seem to be a primary driver of higher aggregateactivity levels.
3.3 Conclusions
Despite the optimism in the forecasts seen in Chapter 2, general aviation activity,whether measured by local operations, itinerant operations or by hours flown, hasdropped since its peak in the late 1970’s. There have been periods of growth anddecline in activity since then that allowed activity to reach those levels again by endof the 1990s, but a steady decline has persisted for next two decades.
General aviation activity grew to peak levels in the 1970s, accompanied by highproduction rates of new general aviation aircraft, until it was set back by liabilityissues faced at the end of the decade and volatile fuel costs. Operations levels slowlyrecovered, until the 1990s, when war, natural disasters, and economic downturn,resulted in decline. Activity was only allowed to ramp back up for five years be-fore economic downturn marked the inflection point in the trend, which was furthercompounded by the 9/11 terrorist attacks, rising fuel prices throughout most of thedecade, and world wide economic recession at the end of the decade. Concurrently,there has been a decline in the pilot and aircraft populations, with less student pilots,on average an older pilot population, more expensive new aircraft, and an older activeaircraft population.
Figure 3-21: Factors A↵ecting General Aviation
47

The drivers and related trends explored in this chapter work in both independentand confounding ways to produce the levels of activity realized. While however somemajor factors a↵ecting activity presented themselves, they are also by no means theonly factors at play. In Chapter 4, a survey of general aviation pilots is presentedas a way to further clarify these complicated relationships and to shed more light onwhat a↵ects an individual’s flying activity and on what they believe is in store forthe future of general aviation.
48

Chapter 4
Survey
The data presented in the previous chapter gives insight into aggregate trends ingeneral aviation across the country. While major drivers or related trends presentedthemselves in this data, we seek to gather a deeper understanding of what factorsa↵ect a given pilot’s flying activity on an individual level. To help achieve this goal, anexploratory survey of general aviation pilots was employed to gather the experiencesand opinions of a sample of active and inactive pilots.
The chapter begins with a discussion of the motivation behind using a survey tocollect more data on general aviation activity. The design and sampling method ofthe survey are then presented. This is followed by a discussion of the methodologicalissues facing this design and any implications that it may have on the analysis of thesurvey’s results. Then a profile of the survey respondents is presented, along withdiscussion of how well it fits the population of interest. The chapter concludes witha brief commentary on the e↵ectiveness of the survey in achieving its methodologicalgoals.
4.1 Goals
An important step in understanding the state of general aviation in the U.S. is tocharacterize it numerically, through the analysis of the trends in easily quantifieddata, as was done in the previous chapter. However, subtleties in the drivers of anindividual’s flying activity can be lost when aggregating information across the entirepopulation of pilots that produce the activity in the country. Therefore, we look forother information that will provide another perspective that will either complimentthe findings in the data or to provide new insight.
In order to compliment the current available data and to paint a more completepicture of the state of general aviation, an exploratory survey of general aviation pilotswas developed and administered. A survey is used as an e�cient tool in learning moreabout the opinions and experiences of a group of people which is too large to surveyin full. The survey aims to gather information from a population as large as thehundreds of thousands of pilots in the United States, including those who may ormay not be currently active.
49

The purpose of the survey is to two fold. The first is for information gatheredfrom the survey to either confirm or dispute the hypothesized relationships presentedin the previous chapter. The results can help to separate correlation from causationin the data analysed, making clear what in fact drives or hinders activity. In additionto this role, it is also aimed at obtaining information that are not directly reflectedin the data. It asks for experiences, and in particular, opinions on the past, current,and future issues in general aviation.
Goals of the survey include answering questions such as:
• What are the experiences of pilots in terms of when they started flying, whythey began flying, and what factors hindered or bolstered their flying activitythroughout their flying careers.
• Are the experiences or opinions of GA pilots more or less the same acrosspopulation groups or do they di↵er significantly? If they di↵er, do they changewith factors such as a pilot’s age or where they live or fly?
• What do pilots expect in the future and what do they think are the biggestchallenges facing general aviation?
The hope is that the information provided directly by GA users will add anotherdimension to the data analysis and will make the results of this research more usefulto those who have an interest in GA’s future.
4.2 Design
4.2.1 Survey type
The survey is self administered survey hosted on the internet. The survey includes acombination of open ended, multiple choice, interval scale, and ratio scale questions.
Content
The pages of the survey, as seen by the participant, are in Appendix A.
• The survey begins with an explanation of what the survey is about, who isadministering the survey, and what the goal of the survey is. The terms of par-ticipation and confidentiality, along with contact information for any questionsregarding the survey are presented to the participant.
• The participants are then asked to best describe their current certification andratings. Total flight time, age, gender, and occupation are also collected. Thisdemographic information is used to gauge how well the survey respondentsrepresent the pilot population of interest and also to group respondents bysimilar characteristics in the analysis of the findings.
50

• The participants are asked when they began flying and whether or not theiractivity increased or decreased since that time. The are also presented with alist of potential reasons a person might learn to fly and are asked to select thereasons that applied to themselves.
• The participants are then asked if they flew in 2011. If they did, they are askedto describe their activity in 2011 by providing hours flown, the state based from,the regions flown in, and the primary aircraft type flown.. If they did not flyin 2011, they are asked to describe why they did not fly in 2011 in an openresponse format.
• The participants are asked to identify the period of time, in 5 year increments,that they were most actively flying. If 2011 was the peak of their flying activity,are asked to describe why 2011 was their peak year of flying. If they choose anyother period, they are asked to characterize their flying during their indicatedpeak year of flying by providing hours flown, the state based from, the regionsflown in, and the primary aircraft type flown.
• If 2011 was not their peak flying period, the participants are asked to describewhy their flying decreased from their peak year to 2011 in an open responseformat. They are then asked to indicate how significantly changes in di↵erentfactors (including costs, income, employment, enjoyment, available time, etc.)contributed to their decline in flying hours.
• The participants are asked to select how much they agree or disagree with aset of given statements relating to general aviation issues. These statementswere formulated to test the validity of a number of hypotheses of what a↵ectsflying activity that emerged from the data analysis in Chapter 3. In thesequestions, they are providing their opinion on issues including aviation careers,flying activity and economic issues, enjoyment of flying, the a↵ect of the interneton flying, increased regulations, fuel costs, and new technologies.
• Finally, the participants are asked to characterize their outlook on their personalflying and on the future of general aviation in the U.S. They are asked how theyexpect their flying to change over the next few years and also if there is anyfuel price that would significantly hinder their flying activity. Free responsequestions also ask what would stimulate their activity and what they believe tobe the biggest challenges facing the general aviation community.
Best Practices
The survey was developed with the approval of MIT’s Institutional Review Board foradherence to best practices in social sciences research. In the goal of protecting therights and welfare of the participants, the questions and survey methods were designedto be minimally invasive, with only enough detail to make meaningful conclusions.Along this vein, the participants answers were collected with SSL encryption, so that
51

responses are encrypted securely to the survey host’s servers. The participants wereinformed that no email addresses or IP addresses would be collected, that they wouldnot be contacted afterwards, and that demographic information provided could notbe used to identify the participants. They were also informed that their participationwas voluntary, they would not be provided compensation for their participation, andthat they could chose not to answer questions. The participants were provided withthe email addresses of the survey administrators if they had any issues or concerns.
4.3 Sampling Method
Given cost and time constraints, a non-probability method of sampling was used forthe survey presented here. To obtain data in a time frame acceptable to the projectand within the constraints of the research budget, the method used was combinationof methods defined as convenience and snowball sampling. Convenience samplinginvolves sampling those in the population who are readily available or are easy toaccess for the survey. Snowball sampling relies on people who have participated inthe survey to refer the study to others who they seem fit to participate.
The survey was hosted online. Numerous general aviation groups and news sourceswere contacted about the research project and the survey, where they in turn informedtheir readers of the survey either through articles or newsletters. The biggest of thesegroups was AVweb, an independent aviation news source, with over 225,000 generalaviation pilots and aircraft owners, OEM’s, suppliers and related businesses whosubscribe to AVweb’s e-newsletters and visit the website. AVweb ran an sponsoredadvertisement in its two weekly e-newsletters for four weeks, which called for theinput of general aviation pilots and was linked to survey. It is also assumed that somenumber of respondents were referred to the survey by other pilots who participated.
4.4 Sources of Error
In the previous section, it was discussed that the sampling method used was notan ideal random sampling method and therefore the prerequisites for utilizing mostfamiliar statistical analysis relating the results of the survey to the total populationare not met. The survey results are subject to greater sampling error, the amount ofinaccuracy in estimating a value (average, proportion, etc.) intended to represent anentire population from the value obtained from a sample.
Inaccuracy occurs not only due to the fact that the sample is not random, butalso on account of coverage, sampling, nonresponse, and measurement errors [27].
• Coverage Error: Coverage error occurs when every person in the populationof interest does not have a known and non-zero chance of being included in thesample. The very design of this survey limits it to those who are familiar withusing a computer and have access to the internet. The method of distribution ofthe survey also limits coverage to those who are subscribed to general aviation
52

online newsletters or are referred to the survey by another survey taker. Cov-erage error encompasses not only issues with oversampling of this subset of thepopulation, but also the over- or under-sampling of di↵erent sub-populationswith specific characteristics. For instance, the mode of distributing the surveyover the internet may lead to the exclusion of some age groups that could beless likely to subscribe to online newsletters(an issue that is explored in the nextsection). It can also be expected that pilots who are currently very active ingeneral aviation, as opposed to another period of time in their flying careers,are the pilots who subscribe to such online newsletters and will be exposed tothe survey.
• Sampling Error: Sampling error occurs due to the fact that responses areonly collected from a sample and not from the entire population.
• Nonresponse Error: Nonresponse error refers to the possible bias surveyresults present due to the fact that not all individuals who are invited to partic-ipate actually do. This bias will not exist if the nonresponse occurs in a randomfashion, but this is usually not the case. Nonresponse can be correlated withan indi↵erence to the survey goals and this may then lead to attracting a largerthan proportional number of participants with survey responses tending towardextreme values of the population. Since participation is voluntary and in theprivacy of one’s home (or elsewhere not under supervision), it can be expectedthat those with stronger opinions on the subject of interest (the state of GA)to agree to participate. The hope is that the GA community, is one in whichinterest is more or less uniform accross the board, i.e. everyone cares about itsstate.
• Measurement Error: Measurement error is usually separate from errors re-lated to sampling and is the result of not measuring what is intended. This canbe attributed to many di↵erent sources that can come from both the surveyand the survey taker. The survey questions were written clearly and in a neu-tral tone in order to minimize misunderstanding of the intended question andto minimize a projection of desired outcome. To this goal, the statements inwhich the survey taker has to indicate how much they agree or disagree withthe statement alternated between sentences written in a positive tone and anegative tone. The survey respondents may themselves introduce more mea-surement errors that the survey cannot prevent, such as inaccurate answers dueto faulty memory or inaccurate comprehension of actual behaviors. Survey re-sponses are also subject to policy response bias, where a survey respondent willgive answers that they believe will result in survey conclusions that they favor.For example, it is possible that a respondent to exaggerate hardships that a↵ecttheir flying activity in order to push for specific regulation changes.
The e↵ects of these errors are not independent of each other and, unfortunately,there is no systematic way to quantify the total e↵ect of these errors on the totalinaccuracy of a population estimate. It is just important to note that these errors
53

are present, some of which would be present even in a random sample, and that theylimit the power of applying the results of the survey to the population of active andinactive GA pilots. It is important to keep in mind that this is an exploratory surveywhich aims to gain general information about the pilot experiences.
Some aspects of the errors involving coverage have been evaluated after the com-pleted sample was collected. In the next section, some aspects of how well the samplerespondents represent the population of interest are evaluated.
4.5 Response Profile
A total of 1,250 responses were collected for analysis over a period of 6 weeks. Thedemographics of this response pool are summarized in this section.
In light of the discussion in the previous sections on issues in representing thepopulation of interest and on known sources of errors, the proportion of respondentsthat fall into a given demographic category are computed in this section and arecompared to what is known about the population a priori. It is important see if thesurvey results are over (or under) representing any one segment of the total populationof interest (all pilots active in GA in the United States) in order to put the results ofthe survey in some context.
However, problems arise even in trying to compare some basic demographics ofthe survey respondents with that of the population. Certain demographics cannot becompared simply because there is no prior data indicating the proportion of the pop-ulation of certain segments within the total population. For instance, given availabledata it is not possible to determine the proportion of pilots in a given occupation. Forthe other demographic strata, such as certifications, age, and gender, it is possible toget data on active airmen, pilots who hold an airmen certificate and have a currentmedical certificate. This has to serve as a close proxy for the population of interestin this survey, which includes active and non-active pilots who are active in generalaviation activity.
4.5.1 Certifications and Ratings
Figure 4-1 summarizes the pilot certifications of the survey respondents where re-spondents are grouped according to their highest certification. In the same figure isthe distribution of highest certifications held by active airmen, as estimated by theFAA for the year 2011 [28]. The general shape of the distributions are the same,however it can be seen that the percentages of students and airline transport pilotssurveyed are lower than in the population of active airmen while the percentages ofprivate and commercial pilots surveyed are higher than in the population of activeairmen. This is where it needs to be stressed that the comparisons are being madebetween the pilots who participated in the survey because they are or were involved ingeneral aviation and between all active airmen. It is probable that those with privateor commercial certifications are more involved in general aviation flying activity thanair transport pilots. If that is the case, the respondents may represent the population
54

of interest more than what this comparison indicates. There may also be a lowernumber of students than what would be expected from the population because thestudents are just becoming involved in the general aviation community and may nothave been equally exposed to the presence of the survey. Also, they may not haveenough interest or experience with the issues in the survey that would compel themto participate.
Figure 4-1: Survey Respondents’ Certification vs. FAA Active Airmen CertificationEstimates
It is also noted that 20% of survey respondents indicated that they are flightinstructors, a percent not to far o↵ from the 16% of active airmen categorized asflight instructors by FAA estimates.
4.5.2 Age
The average age of the respondents was 56.6 years old. Figure 4-2 shows the relativefrequency of age groups in 5 year bins; the distribution is approximately bell curvedand skewed upwards about the mean. The second distribution shown on Figure 4-2correseponds to FAA estimates of active airmen by age group for 2011 [28]. It isclear from the comparison of the two distributions that survey respondents representa generally older portion of the active pilot population.
This shift in the mean population age also is present when accounting for dif-ferences in pilot category. Table 4.1 shows the FAA’s estimates of average age foractive pilots by certification category, where pilots with multiple ratings are includedunder the highest rating. Along with those values are the average ages for the surveyrespondents by certification. Other than the average for the sport category, which isequal to the average age estimated by the FAA for the population of active pilots,the survey averages are higher than their corresponding population.
55

Figure 4-2: Survey Respondents’ Age Distribution vs. FAA Total Active Airmen AgeDistribution Estimates [28]
Table 4.1: Average Age of Active Pilots by Category
FAA Estimate Survey RespondentsTotal 44.4 56.6Student 31.4 48.4Sport 54.4 54.4Recreational 48.8 54.5Private 47.9 56.4Commercial 44.4 57.4Airline Transport 49.7 57.1
It should also be noted that the survey called for participants who are either activeor inactive general aviation pilots, therefore the FAA estimates in the second distribu-tion do not exactly represent the population of interest. However, the estimates stillact as a good benchmark of how well the survey respondents’ age characteristics mir-ror those across their corresponding population, especially because a large majorityof the respondents (86.6%) were active in 2011.
4.5.3 Gender
A total of 4.8% of respondents identified themselves as female. FAA estimates for2011 place total female airmen at 6.7% of all active airmen [28], so the survey’s genderdistribution is not significantly skewed from the population.
56

4.5.4 Regions
Figure 4-3 shows the distribution of responses indicating in which states the respon-dents were primarily based in 2011. Significant numbers of respondents come fromTexas, California, and Florida, which is expected given the sizes of the states and theirlevels of GA activity. Massachusetts stands out as having more respondents than ex-pected, which possibly can be attributed to the fact that the survey originates in theBoston area and partially relied on snowball sampling.
Figure 4-3: States in which Respondents were Primarily Based in 2011
In Figure 4-4, the regions in which the respondents indicated that they flew werecompared to the share of towered activity in those regions. Of course, a direct compar-ison cannot be made between the proportion of pilots and the proportion of operationsthat is attributed to a given region. It should also be noted that that a given par-ticipant could chose more than one region, therefore the proportions will not sum to100%.
Similar distributions are found when looking at the corresponding answers forpeak flying activity.
4.5.5 Occupation
A total of 16.3% of respondents’ answers to the question of occupation are categorizedas being aviation related. Jobs falling under this category include responses such aspilot, flight instructor, air tra�c controller, aircraft sales related, flight operationsmanagers and aviation safety inspectors.
Another 63.1% of respondents occupations were categorized as currently holdingnon-aviation related jobs. The remaining 20.6% of respondents indicated that they
57

Figure 4-4: Regions in which Respondents Flew in 2011
were currently retired, a significant percentage, but not surprising given the averageage.
4.6 Summary
An exploratory survey was designed to give context to the trends in general aviationoutlined and discussed in Chapter 3. It was distributed online, with the help ofgeneral aviation news outlets, and was completed by 1,250 active and non activepilots involved in general aviation.
There are limitations to the sampling method used and the most significant issueassumed to be the coverage error in the responses. While it is impossible to accuratelyquantify the errors present in aggregating the responses to portray the population, ane↵ort was made to compare the profile of the respondents with that of the populationin order to put this error within a qualitative context. Given that the response profiledid not indicate any worrisome deviations from the proportions of the populationbelonging to the various sub populations, the expectation is that this source of error,along with the other sources, are small enough for the responses to still be of significantinterest.
In Chapter 5, the results of the survey are summarized. It is assumed that it isvalid to apply these results to make general observations about general aviation inthe United States, always keeping in mind the limitations of the survey. The surveycan be considered an exploratory one, the results of which can give general insightsand can lead to the development of more scientific surveys with statistics that can beapplied to the entire population.
58

Chapter 5
Survey Results
The results of the survey presented in Chapter 4 are discussed in this chapter.
5.1 Flight Hours
Figure 5-1 is the distribution of total flight hours reported by the respondents. Thedistribution shows 58% of respondents reporting their total flight time between 500and 2,000 hours.
Figure 5-1: Survey Results - “What is your total flight time?”
59

5.2 Flying Beginnings
Figure 5-2 is the distribution of years that the respondents selected as being the yearthat they began flying.
Figure 5-2: Survey Results - “When did you start flying?”
Figure 5-3 shows the percentage of respondents who selected a given reason to whythey started flying. The most popular response, with 81.9% of respondents selectingit, was “I always wanted to fly.” Personal travel was the second most popular, followedby flying as a leisure activity as the third. About of a quarter of respondents indicatedthat a career in aviation was a motivating factor in initially learning to fly. Recallfrom Chapter 4 that about 16% of respondents currently hold an aviation related job,indicating an approximate 10% of respondents who were attracted to aviation careersbut are not employed in the aviation sector. However, this gap may be even smallerin reality, assuming that a portion of the 20% of retired respondents previously heldan aviation related job.
The responses to this question on the reasons for learning to fly do not all follow thesame aggregate level proportions when accounting for the year that the respondentsbegan flying. Two of the eight reasons provided, “I always wanted to fly” and “I wasin the military,” appeared to have clearly di↵ering importance across the groups ofyears. Figure 5-4 shows the proportion of respondents, grouped by the year that theybegan flying, who chose “I always wanted to fly” as a reason they began. There is atrend downwards in the proportion of respondents who selected this motivator, andmay indicate a slow shift in the allure of flying over generations. Also in the figure,are the proportions determined for “I was in the military,” which also has decreasedfrom the 1940s onward.
The responses indicated that 27.3% of pilots had decreased levels of activity justafter they initially learned to fly. The overwhelming majority of those who indicated
60

Figure 5-3: Survey Results - “There are many reasons why someone makes the decisionto learn to fly. Please select all of the following that applied to you.”
Figure 5-4: Survey Results - Reasons for respondents began flying by years theybegan flying
this cited cost issues and/or time constraints due to family commitments, school, orwork as the reason for decline. One respondent who indicated that his flying decreasedexplained that “work and family obligations seem to take priority when there are noregularly scheduled lessons.” Access to an airplane was another significant issue; onethat seemed to be resolved as soon as an airplane was purchased years later. Incomparison, the number of respondents who cited other reasons for the decline in
61

activity was small and included those who either lost interest in flying or who lackedconfidence in their flying abilities.
5.3 2011 Activity
5.3.1 Not Active
A total of 13.4% of the survey respondents indicated that they did not fly in 2011.There were no significant di↵erences in the distributions of demographic characteris-tics between those who answered “yes” to the question “Did you fly in 2011” and thegroup that said “no.” For instance, the average age for those who said “no” was 58years, while it was 56 years for those who indicated “yes”).
Those who indicated that they did not fly in 2011 were asked, “Please explainwhy you did not fly in 2011?” The questions were posed in a free response format andthe resulting answers were categorized afterwards. Figure 5-5 shows the proportionof those who did not fly in 2011 that cited a given reason for not flying in 2011. Morethan half of the responses indicated that costs were a significant reason for why theydid not fly; a result that echoes the hypothesis posed in Chapter 3 that increasingcosts are a↵ecting activity in recent years. A quarter of the respondents cited medicalissues while lack of free time to fly and a loss of plane or access to plane were alsoreasons cited. A few respondents complained that over regulation and governmentbureaucracy have made flying more of a burden than what it is worth. A few otherscited that there was no or a diminished demand for their aviation services in 2011,which may be linked to the trends relating activity decline and economic downturnsshown in Chapter 3.
Figure 5-5: Survey Results - “Please explain why you did not fly in 2011?”
62

5.3.2 Active
The 86.6% of respondents who did fly in 2011 were asked to provide details abouttheir flying activities in that year.
Figure 5-6 is a distribution of hours flown in 2011 by those who indicated that theydid indeed fly in 2011. Figures 4-3 and 4-4, in Chapter 4, show location informationprovided by the respondents. Figure 5-7 charts the type of aircraft primarily flown,with 79% of respondents indicating that their primary aircraft was a single enginepiston type.
Figure 5-6: Survey Results - “Approximately, how many hours did you fly in 2011?”
Figure 5-7: Survey Results - “What type of aircraft did you fly the most during2011?”
63

5.4 Peak Activity
All of the survey participants were asked to identify the time period in which theirflying activity was the highest. Figure 5-8 shows that periods of peak activity in-creases in frequency in the sample as the periods approach the current year. Nearly50% of respondents indicated that they flew the most between 2005-2011. This highpercentage may be a consequence of the limitations of the sampling methods used,as discussed in Chapter 4. It is plausible to assume that a disproportionate amountof pilots in the population were sampled from those pilots who are more likely to beat or around their peak of activity at the time the survey was conducted, since thesurvey was distributed through general aviation interest web outlets.
Figure 5-8: Survey Results - “During what time period was your flying activity at itshighest?”
Of all the respondents, 21% of indicated that their period of peak activity was the2010-2011 period. This group of the respondents were asked to explain why the mostrecent years was the period of peak activity and the responses were categorized andpresented in Figure 5-9. A 45% of this group said that this period was their peak dueto the fact that they are training for their private pilots license or for higher ratings.Increased career and business flying was also frequently mentioned in the explanations,however, not all of these were attributed to growth in business. Interestingly, afew of the respondents stated that their employers reduced personnel in the flightdepartment, therefore creating more flying for themselves. New or improved accessto an airplane was mentioned by 18%, most of whom bought new aircraft recently.More free time was also mentioned by just over 10% of respondents; many of themrecently retired or now have adult children. An increase in disposable income was alsoa factor but only one respondent attributed reduced costs for his increase in activity.This pilot recently moved from Europe to United States in this period, and explainedthat flying in Europe was prohibitively expensive and now could a↵ord flying when in
64

America. There was also some mention of an increase in personal travel, participationin a flying club, and favorable weather conditions as positive drivers of activity in thisperiod.
Figure 5-9: Survey Results - “Please explain why 2010-2011 was the time of yourhighest flying activity?”
The respondents who indicated a time period other than 2010-2011 were askedasked to provide details about their flying activities in their time of peak activity.Respondents gave estimates of the hours they flew in a year and the responses areaggregated in Figure 5-10. As expected the distribution shows that the flight timesoverall shifted higher from those in 2011 (Figure 5-6).
Figure 5-10: Survey Results - “Approximately, how many hours did you fly in a yearduring your period of peak flying activity?”
65

The respondents also indicated the place where they were primarily based in theirpeak year. From the respondents who did not indicate that their peak year was in2011, the number of respondents who were in a given state during their peak year,but were primarily based in another state in 2011 were calculated. The results showthat the biggest changes come from Florida and Texas, indicating that moving outof those states are linked to decreases in flying activity. This is not surprising giventhe spatial trend in operations shown in Figure 3-3. As discussed in Chapter 3, thesestates are in areas of higher GA activities.
There is also a shift in the primary aircraft flown in the times of peak activitywhich can be seen in Figure 5-11. The percentage of single engine piston aircraftdecreased from 2011 by approximately 4 percentage points, because of an increase inmulti engine piston and turbojet aircraft as the primary aircraft in the peak years.
Figure 5-11: Survey Results - “What type of aircraft did you fly the most during yourperiod of peak flying activity?”
The survey participants were also presented with 14 di↵erent potential causes fora decline in flying activity and were asked to indicate how much of a factor each wasin influencing the pilot’s activity starting in their peak years to 2011. The responsesare summarized in Figure 5-12 and are presented in order of how many respondent’scited the factor as having a negative impact on their activity.
The responses indicate that change in fuel costs was the most significant driver ofdecline across all the respondents, with 41% of pilots stating that it had a significantlynegative impact. Change in fuel costs also had the least percentage of respondents,18%, saying that it had no e↵ect on their flying. This result echoes the data fromChapter 3 that rising fuel costs are one of the biggest indicators of decline in aggregateactivity in the country. Fuel costs proved to be the most significant factor in thedecline of activity at the individual pilot’s level in this group of pilots surveyed.
More than 50% of the respondents had a decrease in their free time that negativelya↵ected the amount of time they could fly. This is a significant find given that therelation between available time and activity can not directly identified as a factora↵ecting activity in the aggregate analysis of Chapter 3.
66

Figure 5-12: Survey Results - “What impact did the change in the following factorshave on your flying between 2011 and your peak flying years?”
67

The costs of keeping current, personal income, costs of aircraft maintenance, againechoing the hypothesis of rising maintenance costs in part due to the aging aircraftfleet. Post-9/11 security changes were selected by approximately half the participantsof having a real negative impact on their flying, indicating that a portion of the post-9/11 trend downwards in operations may be a persisting, rather than transient, force.
Medical issues, availability of airports, and limitations at airports had the leaste↵ect on the flying activities of the respondents; that is, they did not seem to befactors that influenced them in one way or another. Only a very small percentage ofrespondents indicated that they lost the desire to be a part of the aviation communityor that a decrease in the level of excitement that they derived from flying.
5.5 Opinions
The survey respondents were also presented with a list of statements relating todi↵erent aspects of general aviation or aviation in general and were asked to indicateto what extent they agreed or disagreed with the statements. The list of statementsand the percentages of respondents who indicated a given level of agreement with thestatement are listed in Figure 5-13.
Four of the statements had the strongest responses. This means that in additionto most respondents being not neutral to the statement, a high percentage of thosewere in strong agreement with the statement. Most respondents agree that despitethe length of time they have been flying, being a pilot has not lost its appeal that ledthem to learn to fly, the internet has made flying easier and safer, new technologieshave made flying safer and more e�cient, and new navigation tools have made flyingeasier or safer.
Two statements were clearly neutral on an average level, where the number ofrespondents who agreed or strongly agree were approximately equal to those whodisagreed or strongly disagreed. The respondents were equally split on whether flyingis a good career choice and on whether aircraft ballistic parachutes have made flyingeasier.
However the availability of fuel at airports was only an issue for 18% of respon-dents, and only a significant issue for 4%. Similarly, the impact of the internet as atechnology decreasing the need to fly was only an issue for 7% percent of the respon-dents.
Only 2% of respondents strongly disagreed with the notion that their flying activ-ity decreases in times of economic recession or that their activity increases when theirincome increases or that increased fuel costs lead them to fly less. The majority ofrespondents, 59%, 66%, and 67%, respectively, agree with these statements. Again,these results echo the hypotheses posed by the data in Chapter 3 that economic re-cessions, increasing fuel costs, and decreases in personal income are strong barriersto activity.
68

Figure 5-13: Survey Results - “To what extent do you agree or disagree with thefollowing statements?”
69

5.6 Future Outlook
5.6.1 Levels of Activity
The survey participants were asked to indicate how their levels of flying activitywould change in the near future and the results are presented in Figure 5-14. Only aquarter of the respondents expect their activity to decrease, while about one third areexpecting that their activity will stay at 2011 levels. A majority of respondents, 44%,were fairly optimistic about the immediate future and indicated that their activitywould slightly increase or significantly increase.
Most of those who indicated that their activity would significantly decrease orslightly decrease explained that they would no longer be in training or do not have asmuch free time as they did in the previous year, with no respondents citing financialissues as a reason. Respondents who indicated that they did not expect any changein their flying activity cited either having access or owning new planes, having justobtained new licenses or ratings, or expected workload in their business or job as thereasons. Of the respondents that just obtained new licenses or ratings, half indicatedthat their activity will stay steady, while the other half belonged to the group thatexpected a slight increase in their activity. Many of those who also indicated anincrease in activity wrote about how their retirement and/or having adult childrenallow them to have the time and financial means to fly more often.
Figure 5-14: Survey Results - “How do you expect your level of flying activity tochange over the next few years? ”
Figure 5-15 disaggregates the responses from Figure 5-14 and groups them by theage group of the respondents. As expected, the graph shows that as the respondents’age increases, the frequency of those who expect their activity to increase decreases.While only 10% of those less than 30 years old expect their activity to decrease, morethan twice that percentage of 50-70 year olds expect declines in their activity and39% of those over 70 expect a decline. Concurrently, the frequency of those who
70

expect their activity to stay relatively constant increases with age. This result, alongwith the increasing average of the pilot population seen in Figure 3-7, does not giveindication of a positive future impact on the growth of operations in the country.
Figure 5-15: Survey Results - “How do you expect your level of flying activity tochange over the next few years? ”
5.6.2 Fuel
Fuel price has proved to be an important driver found in both the aggregate trends andin the responses of the survey participants. Due to its importance, survey participantswere asked to identify a price of fuel that would result in a significant decrease in theirflying activity. About 20% responded that they did not know and another 13% saidthat changes in fuel prices would not a↵ect their flying. The cumulative distribution offuel prices for the remaining 68% is shown in Figure 5-16, where the bar correspondingto a fuel price indicates the proportion of respondents who chose that fuel price orlower as their tipping point. About 50% indicated that $7.00 would hamper theiractivity and the majority, a 90%, would significantly reduce flying if fuel rose to$10.00.
5.6.3 Activity Stimuli
The respondents were asked “What factors would stimulate an increase in your flyingactivity?” The responses contained references to a large number of issues relating
71

Figure 5-16: Survey Results - “Is your flying activity dependent on fuel costs? Atwhat fuel price (per gallon) would your flying activity significantly decrease or stopcompletely?”
to general aviation, but there were some common themes that were echoed in manyresponses.
The most referenced factor across all responses was fuel cost, which was mentionedin 31% of the total responses. reduced operating costs in a general sense was cited in22% of responses. Another 11% of respondents did not mention reduced fuel costs orcosts in general, but implicated that an increase in disposable income would stimulatetheir activity. In addition to these major factors, 4% of respondents talked about job-related issues, another 4% mentioned an increase in business, and another 3% simplysaid, “better economy.”
A related theme in the responses is access to or ownership of aircraft. A total of5% of the respondents said that owning their own, new aircraft, which would be madepossible by lower prices, would lead them to fly more. Another 6% of respondentsalternatively wished for more easily available planes, through rentals or clubs. A fewrespondents said specifically that they would like access to light sport aircraft. Manyof those who wanted more access to the rentals were also in the 4% of those whostated that lower rental costs would help stimulate their flying activity.
Many respondents, about 11%, indicated that less restrictive regulations wouldstimulate their activity. Many complained about the Transportation Safety Admin-istration (TSA), Temporary Flight Restrictions(TFR), access to airspace, and aboutgovernment over regulation in general. Others, a 4% of the respondents, specificallywished for changes in the current medical regulations, many of whom wanted to relaxor eliminate the 3rd class medical requirements for the operation of specific types ofaircraft, including light sport aircraft.
72
Safety and technology was another topic discussed, where 4% of respondentswished for new technologies to become available, or more readily available to them, inaircraft. Technologies that were mentioned included more fuel e�cient engines, air-craft not dependent on 100LL, improved and simplified instrumentation, and aircraftwith glass cockpits and parachutes.
Other significant issues were not related to costs or regulations. Of the all therespondents, 11% said that their activity will increase if they had more available freetime. Another 6% stated that if they had more friends or family to fly with, or ifthere was a greater community interest in flying, they would fly more.
Other factors that were mentioned included better weather, better ground trans-portation at destination airports, more ratings, more air shows or fly-ins, better fuelavailability at airports, better information about TFRs on the internet, increases incommercial flying ticket prices, and new challenges.
A percentage of respondents, 4%, said that no changes would lead to an increasein their activity.
5.6.4 Current Challenges
At the end of the survey, the participants were given the opportunity to share whatthey believe are the biggest challenges facing the general aviation community. Manyof the responses echoed what was already discussed in the previous question on whatwould stimulate their flying activity, but with a greater focus on costs, fuel, regula-tions, public perceptions, and the declining pilot population.
More than half of the respondents, 52%, noted high costs as one of the biggestchallenges to general aviation in the future. Many mentioned that flying, especially inthe recreational sense, is becoming prohibitively expensive. One respondent answeredthe open ended question with:
“Costs. Period. Nothing recreational is as expensive or as regulatory. Ihave owned and own both sailboats, powerboats and an airplane and theairplane is far and away the more expensive hobby.”
The second most mentioned issue facing general aviation involved regulations.34% of respondents responded with concern about government regulations in generalaviation. Responses included references to the TSA, complicated, changing or out-dated rules, and increasing number of TFRs. One pilot responded that there are “toomany people/organizations making the process overly complicated.” He went on toexplain how this can hinder the recreational pilot:
“When I learned to fly it was like a boat on a lake – free to roam. I enjoythe precision of flying but only if it is for work – it’s not a job for amateursor novices anymore.”
The public’s interest or perception of general aviation was an issue for 18% ofrespondents. These respondents believed that the general public most often has wrongimpressions of what general aviation is, what purpose it serves, and who is involved.
73

A respondent stated that, “public perception of general aviation flying as being forreckless adventurers with more money than sense, and that they are subsidizing theactivity.”
Often coupled with the concern about costs,regulations, and public perceptionwas mention of the declining pilot population, as seen in Figure 3-4. 22% of respon-dents mentioned that lower levels of new interest in general aviation along with poorstudent retention rates are threatening the future of general aviation in America. Onerespondent noted that “most new pilots think the cost to learn to fly and continueflying has shifted out of the range of normal middle income people.” Another positedthat as the pilot population declines, in part due to increasing costs, the economiesof scale in all aspects of cost in general aviation will diminish and will push costs upeven more, creating a crippling positive feedback loop.
Impending federal air tra�c service user fees are of concern to 11% of the surveyparticipants, while 7% are concerned about finding a replacement for 100LL fuel, and5% worry about the increasing numbers of smaller airports closing.
Other issues included references to medical requirements, safety issues, aging gen-eral aviation fleets, and outdated aircraft technologies.
74

Chapter 6
Conclusion
General aviation is an important component of aviation in the United States. In 2011,general aviation and air taxi operations represented 63% of all towered operationsin the United States, while commercial aviation was responsible for 34% of thoseoperations. It is clear that GA is a considerable component of the national airspaceand airport system, even when only towered operations are considered. Because of thissignificant presence, insight into GA is relevant to issues in air tra�c management,air transportation infrastructure, and aviation safety, among others. Beyond theoperational aspect, general aviation is of significance to society as a whole and to otherstakeholders, including pilots groups, aircraft manufacturers, and the work force. Allof these groups are interested in what drives general aviation activity in order to helpsupport the activity or to forecast its future.
Forecasting general aviation activity has proved to be an imperfect science. Anexample of how general aviation forecasting has been less accurate than its commer-cial counterpart can be seen in the comparison of the results of the 2006 TAF withthe realized levels of activity. This forecast was a positive one, and indeed, all ofthe forecasts of general aviation have remained positive for the past decade, even inthe face of continually declining activity throughout that time period. The apparentdi�culties of forecasting general aviation activity give rise to the need for a betterunderstanding of the factors that a↵ect this activity in the country. Greater under-standing can also benefit general aviation stakeholders by identifying what hindersand what promotes the activity across the country.
Looking at past levels in general aviation operations in the context of other relatedtrends and historical events has shed light on what drives GA activity. Generalaviation in terms of towered activity reached its peak by the late 1970s, supported bystrong production rates of general aviation aircraft. However, aging aircraft, liabilityissues causing drops in production rates, and increasingly volatile fuel costs stalled theactivity significantly in the early stages. Activity slowly grew back, again approachingpeak levels until war, natural disasters, and economic downturn resulted in a declinein the early 1990s. The recovery from this decline followed for five years until anothereconomic downturn in the 2000s stopped the growth and they activity began itscontinual decline, compounded by the e↵ects of 9/11 terrorist attacks, rising fuelprices, and world wide economic recession at the end of the decade. Throughout this
75

time, general aviation continued to su↵er from aging fleets and declining numbers inthe pilot population.
An exploratory survey of 1,250 general aviation pilots was conducted as a wayto give context to these trends and to help shed light as to what factors a↵ect anindividual pilot’s flying activity. As also seen in the historical trends, fuel costs andcosts in general have had a major influence on the activity levels of those surveyed.The results of the survey echoed what the trends implied - economic recessions andfuel costs are major factors that impede the growth of activity. An interesting resultof the survey that was not clearly evident in the data indicated that available freetime has also been a major factor in a↵ecting activity levels.
Another goal of the survey was to gain perspective on the future of general avi-ation. When asked what would help stimulate their activity in the future, pilotswished for less cumbersome regulations, better access to aircraft through rentals orflying clubs, and an overall decrease in costs. In the responses of the surveyed pilots,increasing costs, increased regulation, lack of public understanding of the role of gen-eral aviation, and the declining pilot population stand out as the biggest challengesthat general aviation faces.
76

Appendix A
Survey of Active and InactiveGeneral Aviation Pilots on FactorsInfluencing Flight Activity
The following pages show the survey questions as they appeared to the respondentsonline. There is a skip logic built into the online survey so that depending on theresponses of particular questions, the survey taker will proceed to or skip certainpages of the survey. This logic is summarized in Figure A-1 which describes the flowof the survey. The survey is divided into di↵erent pages that cover di↵erent sets ofquestions and di↵erent participants will see di↵erent pages of the survey dependingon the answers to specific questions. The page labels in Figure A-1 are representativeof the types of questions asked on that page.
Figure A-1: Survey Flow
77

Pag
e 1

Pag
e 2
We are looking for a
ctive an
d inactive ge
neral aviation pilots to
participate in a sho
rt survey.
The International C
enter for Air Transportation at th
e Massachusetts In
stitute of T
echnology is conducting a study of general aviation tre
nds. The goal of this study is to
gain a bette
r understanding of
the factors that drive ge
neral aviation activity in th
e United States. This includ
es iden
tifying
any cha
lleng
es fa
cing
the grow
th of g
eneral aviation an
d its role in th
e grea
ter aviation commun
ity as
well w
as iden
tifying
wha
t may promote activity in th
e future.
We are interested
in collecting the expe
riences and
opinion
s of pilots like you
that are active or have be
en active in gen
eral aviation. Gen
eral aviation is now
faced with man
y challeng
es and
you
r pa
rticipation an
d invaluab
le insigh
t will fu
rthe
r the
und
erstan
ding
of the
se issues and
ultimately shed
more light on wha
t can
be do
ne to
sup
port you
r com
mun
ity.
• PARTICIPATION AND W
ITHDRAWAL
Your p
articipation in th
is study is com
pletely voluntary and you are fre
e to choose whether to
be in it or n
ot. If you choose to be in th
is study, you may subsequently withdraw
from
it at a
ny time
without p
enalty or c
onsequences of any kind.
• CONFIDENTIALITY
Any inform
ation that is obtaine
d in con
nection with th
is study and
that can
be directly or indirectly iden
tified with you
will rem
ain confiden
tial.
The results of the survey will not be linked to you or y
our IP address. A
ny dem
ographic inform
ation and inform
ation about your p
ilot certification that is collected is fo
r research purposes only and will
not b
e used
to iden
tify you.
• CONTA
CT
If you have any questions or c
oncerns about the survey, please feel free to
contact Kam
ala Shetty at [email protected] or Prof. R. John Hansm
an at rjhans@
mit.edu.

Pag
e 3
Ple
ase s
ele
ct a
ll o
ptio
ns b
elo
w t
hat b
est d
escrib
e y
our c
ertif
icatio
n a
nd r
atin
gs
What is y
our t
otal fl
ight t
ime?
What is y
our a
ge?
Wh
at is y
ou
r g
en
de
r?
Wh
at is y
ou
r o
cc
up
atio
n?
Airp
lane
Single
Eng
ine La
ndAirp
lane
Single
Eng
ine Sea
Airp
lane
Multi
Eng
ine La
ndAirp
lane
Multi
Eng
ine Sea
Rotocraft
Helicop
ter
Other
Airp
lane
Instrumen
tRotocraft
Instrument
Stude
ntgfedc
gfedcgfedc
gfedcgfedc
gfedcgfedc
gfedc
Recreationa
lgfedc
gfedcgfedc
gfedcgfedc
gfedcgfedc
gfedc
Sport
gfedcgfedc
gfedcgfedc
gfedcgfedc
gfedcgfedc
Private
gfedcgfedc
gfedcgfedc
gfedcgfedc
gfedcgfedc
Com
mercial
gfedcgfedc
gfedcgfedc
gfedcgfedc
gfedcgfedc
Airline Transport
gfedcgfedc
gfedcgfedc
gfedcgfedc
gfedcgfedc
Instructor
gfedcgfedc
gfedcgfedc
gfedcgfedc
gfedcgfedc
Hours:
Years: M
ale
nmlkj
Female
nmlkj

Pag
e 4
Wh
en
did
yo
u s
ta
rt f
lyin
g?
Aft
er y
ou learned t
o f
ly, did
your a
ctiv
ity increase o
r d
ecrease a
nd w
hy?
Th
ere
are
ma
ny r
ea
so
ns w
hy s
om
eo
ne
ma
ke
s t
he
de
cis
ion
to
le
arn
to
fly
. P
lease s
ele
ct a
ll o
f the f
ollow
ing t
hat a
pplied t
o
yo
u.
6
55 66
I always wanted to fly
gfedc
I wan
ted to have a career in aviation
gfedc
I was in th
e military
gfedc
I nee
ded a challeng
e gfedc
I was drawn to th
e sense of com
mun
ity in th
e aviation en
vironm
ent
gfedc
I wan
ted to be ab
le to
fly as a leisure activity
gfedc
I wan
ted to be ab
le to
fly for p
ersona
l travel
gfedc
I wanted to be able to
fly for b
usiness tra
vel
gfedc
Other re
ason(s)
gfedc

Pag
e 5
Did
yo
u f
ly in
20
11
?
Yes
nmlkj
No
nmlkj

Pag
e 6
Ple
ase e
xpla
in w
hy y
ou d
id n
ot f
ly in 2
011?
55 66

Pag
e 7
Approxim
ately
, how
many h
ours d
id y
ou f
ly in 2
011?
In w
hic
h s
ta
te
we
re
yo
u p
rim
aril
y b
ase
d in
20
11
?
In w
hic
h r
egio
ns d
id y
ou n
orm
ally f
ly? (
Choose a
ll t
hat a
pply
)
Wh
at t
yp
e o
f a
irc
ra
ft d
id y
ou
fly
th
e m
ost d
urin
g 2
01
1?
Hours:
6
Alaskan Region (AK)
gfedc
Centra
l Region (IA
, KS, M
O, N
E)
gfedc
Eastern Region (DC, D
E, M
D, N
J, NY, P
A, V
A, W
V)
gfedc
Great Lakes Region (IL
, IN, M
I, MN, N
D, O
H, S
D, W
I) gfedc
New
England Region (CT, ME, M
A, N
H, R
I, VT)
gfedc
Northwest M
ountain Region (CO, ID, M
T, OR, U
T, W
A, W
Y)
gfedc
Southern Region (AL, FL, GA, K
Y, M
S, N
C, P
R, S
C, T
N, V
I) gfedc
Southwest R
egion (AR, L
A, N
M, O
K, T
X)
gfedc
WesternPacific Region (AZ, CA, H
I, NV)
gfedc
Piston Single Eng
ine
nmlkj
Piston Multi Eng
ine
nmlkj
Turbop
rop
nmlkj
Turbojet
nmlkj
Rotocraft
nmlkj
Experimen
tal
nmlkj
Other
nmlkj

Pag
e 8
Du
rin
g w
hat t
ime p
erio
d w
as y
ou
r f
lyin
g a
ctiv
ity a
t its h
igh
est?
6

Pag
e 9
Approxim
ately
, how
many h
ours d
id y
ou f
ly in a
year d
urin
g y
our p
erio
d o
f peak f
lyin
g a
ctiv
ity?
In w
hic
h s
ta
te
we
re
yo
u p
rim
aril
y b
ase
d d
urin
g y
ou
r p
erio
d o
f p
ea
k f
lyin
g a
ctiv
ity?
In w
hic
h r
egio
ns d
id y
ou n
orm
ally f
ly d
urin
g y
our p
erio
d o
f peak f
lyin
g a
ctiv
ity? (
Choose a
ll t
hat a
pply
)
Wh
at t
yp
e o
f a
irc
ra
ft d
id y
ou
fly
th
e m
ost d
urin
g y
ou
r p
erio
d o
f p
ea
k f
lyin
g a
ctiv
ity?
Hours:
6
Alaskan Region (AK)
gfedc
Centra
l Region (IA
, KS, M
O, N
E)
gfedc
Eastern Region (DC, D
E, M
D, N
J, NY, P
A, V
A, W
V)
gfedc
Great Lakes Region (IL
, IN, M
I, MN, N
D, O
H, S
D, W
I) gfedc
New
England Region (CT, ME, M
A, N
H, R
I, VT)
gfedc
Northwest M
ountain Region (CO, ID, M
T, OR, U
T, W
A, W
Y)
gfedc
Southern Region (AL, FL, GA, K
Y, M
S, N
C, P
R, S
C, T
N, V
I) gfedc
Southwest R
egion (AR, L
A, N
M, O
K, T
X)
gfedc
WesternPacific Region (AZ, CA, H
I, NV)
gfedc
Piston Single Eng
ine
nmlkj
Piston Multi Eng
ine
nmlkj
Turbop
rop
nmlkj
Turbojet
nmlkj
Rotocraft
nmlkj
Experimen
tal
nmlkj
Other
nmlkj
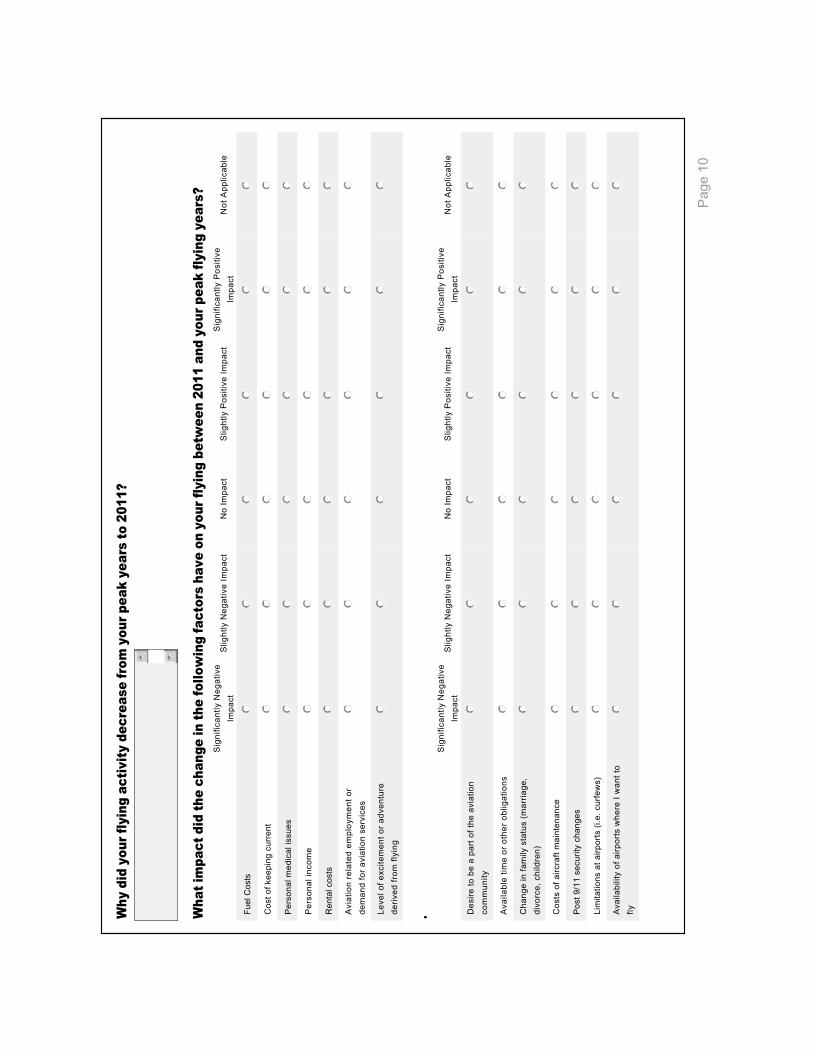
Pag
e 10
Why d
id y
our f
lyin
g a
ctiv
ity d
ecrease f
rom
your p
eak y
ears t
o 2
011?
Wh
at im
pa
ct d
id t
he
ch
an
ge
in
th
e f
oll
ow
ing
fa
cto
rs h
ave
on
yo
ur f
lyin
g b
etw
ee
n 2
01
1 a
nd
yo
ur p
ea
k f
lyin
g y
ea
rs?
.
55 66
Significan
tly Neg
ative
Impa
ctSlightly Neg
ative Im
pact
No Impact
Slightly Positive Im
pact
Significan
tly Positive
Impa
ctNot App
licab
le
Fuel Costs
nmlkjnmlkj
nmlkjnmlkj
nmlkjnmlkj
Cost of keeping current
nmlkjnmlkj
nmlkjnmlkj
nmlkjnmlkj
Personal m
edical issues
nmlkjnmlkj
nmlkjnmlkj
nmlkjnmlkj
Persona
l incom
enmlkj
nmlkjnmlkj
nmlkjnmlkj
nmlkj
Rental costs
nmlkjnmlkj
nmlkjnmlkj
nmlkjnmlkj
Aviation related em
ploymen
t or
demand for a
viation services
nmlkjnmlkj
nmlkjnmlkj
nmlkjnmlkj
Level of e
xcitemen
t or a
dven
ture
derived
from
flying
nmlkjnmlkj
nmlkjnmlkj
nmlkjnmlkj
Significan
tly Neg
ative
Impa
ctSlightly Neg
ative Im
pact
No Impact
Slightly Positive Im
pact
Significan
tly Positive
Impa
ctNot App
licab
le
Desire
to be a pa
rt of the
aviation
commun
itynmlkj
nmlkjnmlkj
nmlkjnmlkj
nmlkj
Available tim
e or other obligations
nmlkjnmlkj
nmlkjnmlkj
nmlkjnmlkj
Change in fa
mily status (m
arria
ge,
divorce, children)
nmlkjnmlkj
nmlkjnmlkj
nmlkjnmlkj
Costs of a
ircraft maintenance
nmlkjnmlkj
nmlkjnmlkj
nmlkjnmlkj
Post 9/11 security changes
nmlkjnmlkj
nmlkjnmlkj
nmlkjnmlkj
Limitations at a
irports (i.e. curfews)
nmlkjnmlkj
nmlkjnmlkj
nmlkjnmlkj
Availability of airp
orts whe
re I wan
t to
flynmlkj
nmlkjnmlkj
nmlkjnmlkj
nmlkj

Pag
e 11
Ple
ase
ex
pla
in w
hy 2
01
02
011 w
as t
he t
ime o
f your h
ighest f
lyin
g a
ctiv
ity?
55 66

Pag
e 12
To w
hat e
xtent d
o y
ou a
gree o
r d
isagree w
ith t
he f
ollow
ing s
tatem
ents?
.
Stron
gly
Disagree
Disagree
Neutra
lAgree
Stron
gly Agree
Flying
is a goo
d career cho
ice.
nmlkjnmlkj
nmlkjnmlkj
nmlkj
In times of e
conomic re
cession, my flying activity decreases.
nmlkjnmlkj
nmlkjnmlkj
nmlkj
When my income increases, my level of flying increases.
nmlkjnmlkj
nmlkjnmlkj
nmlkj
My flying activity has noticea
bly de
crea
sed after S
eptembe
r 11, 200
1.nmlkj
nmlkjnmlkj
nmlkjnmlkj
The cost of com
mercial air service in my area affe
cts how much I p
ersonally fly.
nmlkjnmlkj
nmlkjnmlkj
nmlkj
Despite th
e leng
th of time I h
ave be
en flying
, being
a pilot h
as not lost its ap
peal th
at led me to learn to fly.
nmlkjnmlkj
nmlkjnmlkj
nmlkj
The internet has made flying easier or s
afer.
nmlkjnmlkj
nmlkjnmlkj
nmlkj
Stron
gly
Disagree
Disagree
Neutra
lAgree
Stron
gly Agree
The use of th
e internet to
conduct business or to
more easily connect with friends or fa
mily has decreased my need to
fly.
nmlkjnmlkj
nmlkjnmlkj
nmlkj
Com
pared to when I first starte
d flying, increased security, safety, or n
oise re
gulations have affected th
e am
ount of
time I fly.
nmlkjnmlkj
nmlkjnmlkj
nmlkj
Increasing fu
el costs have led me to fly less.
nmlkjnmlkj
nmlkjnmlkj
nmlkj
New
technologies (G
PS, full aircraft parachutes, e
tc.) have made flying safer a
nd more efficient.
nmlkjnmlkj
nmlkjnmlkj
nmlkj
New
navigation tools, such as GPS, h
ave made flying easier or s
afer.
nmlkjnmlkj
nmlkjnmlkj
nmlkj
Aircraft ballistic parachutes has made flying safer.
nmlkjnmlkj
nmlkjnmlkj
nmlkj
Currently, the availability of fu
el at a
irports th
at I want to fly to
is an issue.
nmlkjnmlkj
nmlkjnmlkj
nmlkj

Pag
e 13
How
do y
ou e
xpect y
our level of
flyin
g a
ctiv
ity t
o c
hange o
ver t
he n
ext f
ew
years?
Ple
ase
ex
pla
in w
hy y
ou
be
lie
ve
th
e a
mo
un
t y
ou
fly
wil
l c
ha
ng
e (
or n
ot c
ha
ng
e)?
Is y
ou
r f
lyin
g a
ctiv
ity d
ep
en
de
nt o
n f
ue
l c
osts? A
t w
hat f
uel pric
e (
per g
allon)
would
your f
lyin
g a
ctiv
ity s
ignif
icantly
de
cre
ase
or s
to
p c
om
ple
te
ly?
What f
actors w
ould
stim
ula
te a
n increase in y
our f
lyin
g a
ctiv
ity?
Wh
at d
o y
ou
th
ink
are
th
e b
igg
est c
ha
lle
ng
es f
ac
ing
th
e g
en
era
l a
via
tio
n c
om
mu
nit
y?
55 66
6
55 66 55 66
Significantly Decrease
nmlkj
Slightly Decrease
nmlkj
No Change
nmlkj
Slightly In
crease
nmlkj
Significan
tly In
crea
se
nmlkj Com
ments

Bibliography
[1] Federal Aviation Administration. 14 CRF Part 119 [Online]. Avail-able: http://ecfr.gpoaccess.gov/cgi/t/text/text-idx?c=ecfr&sid=
20f8b9bd3b9f0616f33be94922aabe66&rgn=div6&view=text&node=14:
3.0.1.1.3.2&idno=14
[2] Federal Aviation Administration. General Aviation and Part 135 Activity Sur-veys - CY 2009 [Online]. Table 1.6. Available: http://www.faa.gov/data_
research/aviation_data_statistics/general_aviation/CY2009/
[3] Federal Aviation Administration. ATADS Gloassary [Online]. Available: http://aspm.faa.gov/atads/gloss.htm
[4] Federal Aviation Administration. Air Tra�c Activity Data System (ATADS)[Online]. Available: http://aspm.faa.gov/
[5] P. Belobaba et al., The Global Airline Industry. Wiley, 2009.
[6] Federal Aviation Administration. National Plan of Integrated Airport Systems(NPIAS): 2011-2015 [Online]. Available: http://www.faa.gov/airports/
planning_capacity/npias/reports/media/2011/npias_2011_narrative.
[7] Federal Aviation Administration. Airport Improvement Program (AIP): Fundingfor Airport Planning and Development [Online]. Available: http://www.faa.
gov/airports/aip/
[8] Federal Aviation Administration. Airport Improvement Program (AIP) GrantHistories [Online]. Available: http://www.faa.gov/airports/aip/grant_
histories/#reports
[9] Federal Aviation Administration. The Economic Impact of Civil Aviation on theU.S. Economy: August 2011 [Online]. Available: http://www.faa.gov/air_
traffic/publications/media/FAA_Economic_Impact_Rpt_2011.pdf
[10] Available: http://www.bts.gov/publications/national_transportation_
statistics/html/table_01_13.html
91

[11] Federal Aviation Administration. Terminal Area Forecast Summary: FiscalYears 2006-2025 [Online]. Available: http://www.faa.gov/about/office_
org/headquarters_offices/apl/aviation_forecasts/taf_reports/media/
TAF2006-2025Summary.pdf
[12] Federal Aviation Administration. OEP 35 [Online]. Available: http://
aspmhelp.faa.gov/index.php/OEP_35
[13] R. de Neufville and A.R. Odoni, Airport Systems: Planning, Design, and Man-agement. McGraw-Hill Professional, 2003.
[14] Federal Aviation Administration. Terminal Area Forecast (TAF) [Online]. Avail-able: http://aspm.faa.gov/main/taf.asp
[15] Federal Aviation Administration. FAA Aerospace Forecasts [Online]. Avail-able: http://www.faa.gov/about/office_org/headquarters_offices/apl/
aviation_forecasts/
[16] General Aviation Manufacturers Association. General Aviation Sta-tistical Databook & Industry Outlook [Online]. Available: http:
//www.gama.aero/media-center/industry-facts-and-statistics/
statistical-databook-and-industry-outlook
[17] U.S. Energy Information Administration. U.S. Prime Supplier Sales Volumesof Petroleum Products [Online]. Available: http://tonto.eia.doe.gov/dnav/pet/pet_cons_prim_dcu_nus_a.htm
[18] U.S. Energy Information Administration. U.S. Refiner Petroleum ProductPrices [Online]. Available: http://www.eia.gov/dnav/pet/pet_pri_refoth_
dcu_nus_m.htm
[19] U.S. Environmental Protection Agency Advance Notice of Proposed Rulemakingon Lead Emissions From Piston-Engine Aircraft Using Leaded Aviation Gasoline[Online]. Available: http://www.gpo.gov/fdsys/pkg/FR-2010-04-28/html/
2010-9603.htm
[20] T. H. Kister. ”General Aviation Revitalization Act: Its e↵ect on manufacturers”.Defense Counsel Journal, vol. 65, pp. 109, Jan. 1998.
[21] U.S. Bureau of Economic Analysis. PERSONAL INCOME AND OUT-LAYS [Online]. Available: http://www.bea.gov/newsreleases/national/pi/pinewsrelease.htm
[22] U.S. Bureau of Economic Analysis. Current Employment Statistics - CES (Na-tional) [Online]. Available: http://www.bls.gov/ces/
[23] National Bureau of Economic Research. US Business Cycle Expansions and Con-tractions [Online]. Available: http://www.nber.org/cycles/cyclesmain.html
92
[24] New York Times. HURRICANE ANDREW; Hurri-cane Rips Through Florida and Heads Into Gulf [On-line]. Available: http://www.nytimes.com/1992/08/25/us/
hurricane-andrew-hurricane-rips-through-florida-and-heads-into-gulf.
html?pagewanted=all&src=pm
[25] R. F. Stengel. Air Transportation After September 11th [Online]. Available:http://www.princeton.edu/~stengel/AT911.pdf
[26] National Transportation Safety Board. Aviation Statistical Reports: Table 10.Accidents, Fatalities, and Rates, 1991 through 2010, U.S. General Aviation [On-line]. Available: http://www.ntsb.gov/data/table10.html
[27] D. Dillman et al., Internet,Mail,and Mixed-Mode Surveys: The Tailored DesignMethod. John Wiley & Sons, 2009.
[28] Federal Aviation Administration. US Civil Airmen Statistics: 2011[Online]. Available: http://www.faa.gov/data_research/aviation_data_
statistics/civil_airmen_statistics/2011/
93