current federal and state sources of public transportation funding
TRANSCRIPT

New NY Bridge Mass Transportation Task Force
April 26, 2013
CURRENT FEDERAL AND STATE SOURCES OF PUBLIC TRANSPORTATION FUNDING
Got $?

OBJECTIVES…
• Present factual information on current sources/uses of federal/State revenues for public transportation
• Begin dialogue on the feasibility of current and/or new resources to support expanded trans-Hudson commuter services
• Provide context for the current federal/State funding environment

NO FREE RIDE
51% 48%
42% 39%
30% 29% 26%
14% 13% 12% 10%
23% 28%
48%
0%
10%
20%
30%
40%
50%
60%
70%
80%
90%
100%
Farebox Recovery

FEDERAL TRANSIT FUNDING
• Separate Mass Transit Account (MTA) within the federal Highway Trust Fund (HTF)
• Account receives 20 percent of each increase in the motor fuel tax (beginning in 1983)
• The current motor fuel tax is 18.4 cents, of which 2.86 cents is dedicated to the transit
• Transit program also receives 20% of total funding through general revenues

MOVING AHEAD FOR PROGRESS IN THE 21ST CENTURY (MAP-21)
Authorizes federal transportation funds through September 30, 2014
Extends federal motor fuel taxes through FFY 2016 and other highway trust fund related taxes through FFY 2017
Eliminates earmarks; reduces the number of discretionary programs
Re-focuses highway and transit resources on the repair, rehabilitation and replacement of aging infrastructure, vehicles and equipment

FEDERAL PUBLIC TRANSPORTATION ASSISTANCE
6
1%
52%
1% 1%
42%
1% 2%
5303/5304 Metropolitan/Statewide Planning 5307 Urbanized Area Formula
5310 Seniors/Individuals with Disabilities 5311 Rural Area Formula
5309 Fixed Guideway SGR 5309 Bus SGR
5339 Bus/Bus Facilities Formula

SECTION 5307 - URBANIZED AREA FORMULA PROGRAM
• Apportionment to urbanized areas of more than 200,000 in population based on multi-tiered
formula, including:
– Population and population density
– Bus revenue vehicle miles
– Fixed guideway revenue vehicle miles
– Fixed guideway route miles
– Incentive tier based on bus/fixed guideway passenger miles and operating costs
• Eligible activities include:
– Replacement of buses/rollingstock – Construction/rehabilitation of passenger/maintenance facilities – Communications and fare collection systems – Preventive maintenance
• Federal share for eligible capital activities is 80 percent
• In FFY 2011, the ten-county urbanized area received $680 million; 95% of which was generated by services in the five-boroughs
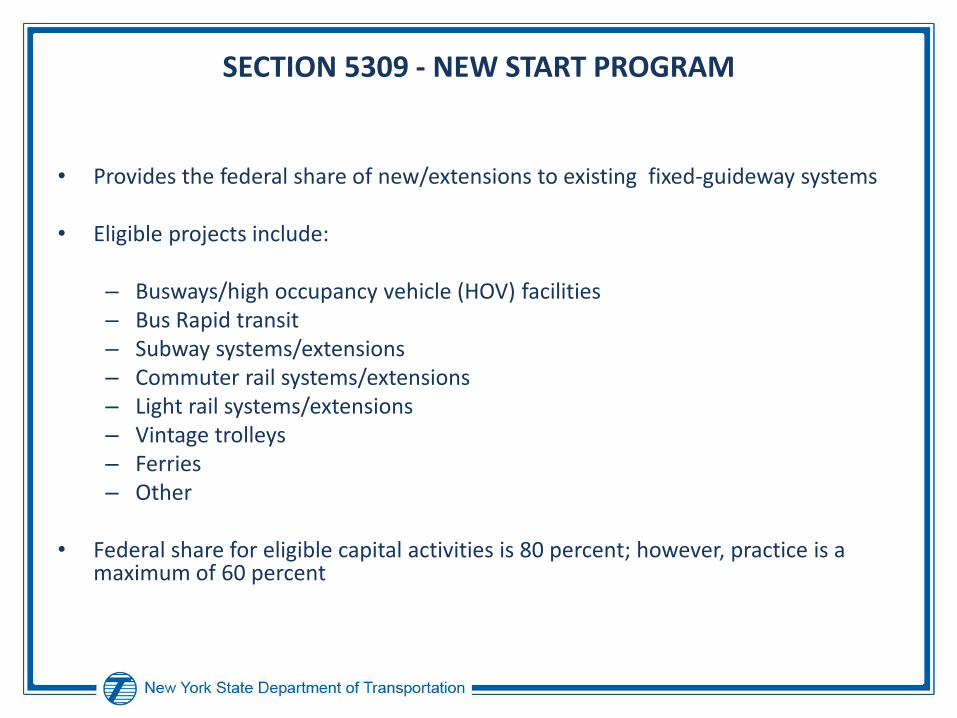
SECTION 5309 - NEW START PROGRAM
• Provides the federal share of new/extensions to existing fixed-guideway systems
• Eligible projects include:
– Busways/high occupancy vehicle (HOV) facilities – Bus Rapid transit – Subway systems/extensions – Commuter rail systems/extensions – Light rail systems/extensions – Vintage trolleys – Ferries – Other
• Federal share for eligible capital activities is 80 percent; however, practice is a
maximum of 60 percent

SECTION 5309 - NEW STARTS PROGRAM

SECTION 5309 - NEW STARTS PROGRAM
• Projects become candidates by completing the appropriate steps in the major capital investment planning and project development process
• Project must be based on the results of an Alternatives Analysis, justified against a set of statutory criteria, and supported by an adequate degree of local financial commitment
• Funds provided pursuant to a full funding grant agreement (FFGA) that defines the project scope/specifies the multi-year federal commitment; any additional costs are the responsibility of the project sponsor
• Funding allocation recommendations are made in an annual report to Congress: “Annual Report on New Starts”
• Significant pipeline/lengthy process

SECTION 5309 - NEW STARTS PROGRAM
• Adequate degree of local financial commitment, as measured by:
o The proposed share of total project costs from sources other than from the New Starts program (overmatch)
o The strength of the proposed project’s capital financing plan
o The ability of the sponsoring agency to fund operation and maintenance of the entire system – existing and planned

FUTURE HAS NEVER LOOKED MURKIER
Sequestration
Continuing Resolutions
Solvency of HTF
New House T&I Leadership/Policy Direction
12

0
10
20
30
40
50
60
70
80
90
100
Historical CPI-U Estimated CPI-U Based on 18-year Average from 1993-2011
51% Purchasing Power Loss by 2022
PURCHASING POWER LOSS OF GAS TAX DUE TO INFLATION
2,800
2,850
2,900
2,950
3,000
3,050
Billio
ns o
f M
ile
s
Vehicle Miles Traveled - Nov 2002 to Nov 2012(Moving 12 Month Total)

CASH TRANSFERS TO HIGHWAY TRUST FUND TO MAINTAIN CURRENT FUNDING
Required General Fund transfer to the Highway Trust Fund o September 2008 - $8 billion o August 2009 - $7 billion o March 2010 - $19.5 billion o July 2012 - $2.4 billion (Leaking Underground Storage Tank Trust Fund) o FFY 2013 - $6.2 billion General Fund transfer to HTF (scheduled) o FFY 2014 - $12.6 billion General Fund transfer to HTF scheduled
2014 budget proposes to increase by $2.6 billion
Total transfers to HTF: $55.7 billion since 2008
30
35
40
45
50
55
60
2004 2005 2006 2007 2008 2009 2010 2011 2012 2013 2014 2015 2016 2017 2018 2019 2020 2021 2022 2023
(Ye
ar
of E
xpe
nd
itu
re D
olla
rs in
Bill
ion
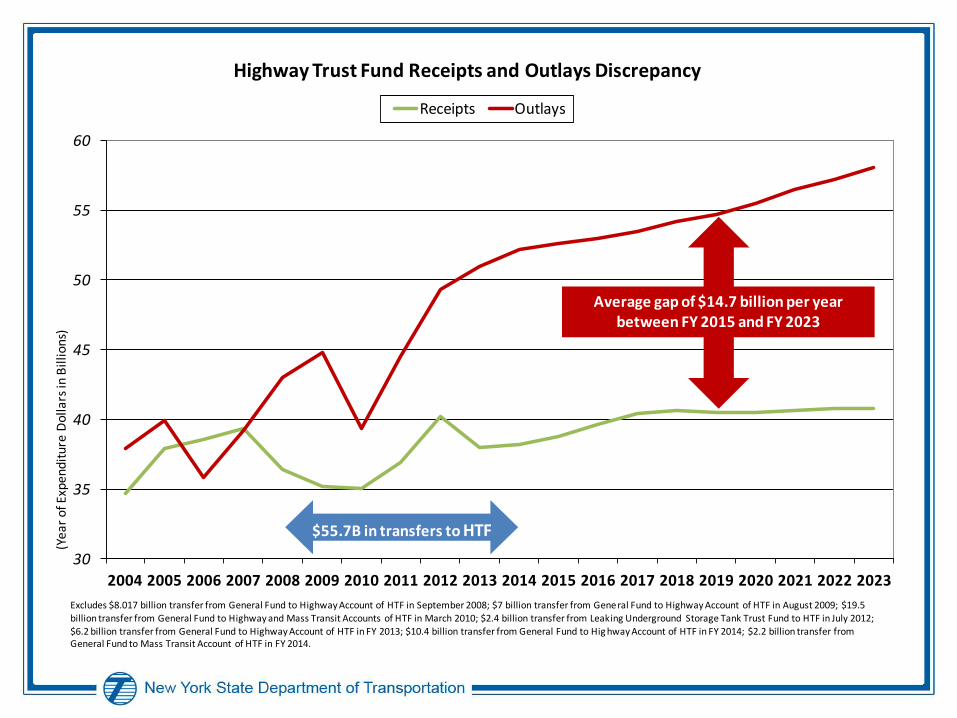
s)Highway Trust Fund Receipts and Outlays Discrepancy
Receipts Outlays
Excludes $8.017 billion transfer from General Fund to Highway Account of HTF in September 2008; $7 billion transfer from General Fund to Highway Account of HTF in August 2009; $19.5
billion transfer from General Fund to Highway and Mass Transit Accounts of HTF in March 2010; $2.4 billion transfer from Leaking Underground Storage Tank Trust Fund to HTF in July 2012;
$6.2 billion transfer from General Fund to Highway Account of HTF in FY 2013; $10.4 billion transfer from General Fund to Hig hway Account of HTF in FY 2014; $2.2 billion transfer from General Fund to Mass Transit Account of HTF in FY 2014.
$55.7B in transfers to HTF
Average gap of $14.7 billion per year between FY 2015 and FY 2023

$3,790
85%
$682
15%
WHAT TYPE OF STATE ASSISTANCE IS PROVIDED?
Operating Capital
Metropolitan Transportation Commuter District

$3,022
68%
$1,451
32%
HOW ARE STATE RESOURCES FOR PUBLIC TRANSPORTATION GENERATED?
Business Taxes User Taxes & Fees
Metropolitan Transportation Commuter District

24%
11%
19% 9%
1% 3%
1% 2%
30%
WHAT ARE THE SOURCES THAT SUPPORT STATE ASSISTANCE?
Corporate Franchise/Surcharge Petroleum Business Tax MTA District Sales Tax
Motor Vehicle Fees Miscellaneous Motor Fuel Tax
Auto Rental Tax Taxi Surcharge Payroll Tax
Metropolitan Transportation Commuter District

SYSTEM REVENUES/EXPENSES
• State Operating Aid and Passenger Revenue account for +/- 66% of TOE
• State taxes and fees supporting public transportation are economically sensitive
• System labor, health, legacy and fuel costs are fastest growing components of operating budgets
• Increasing pressure on locally-derived revenues
• Growing demand fueled by changing demographics
