current microbiological risk assessment practices: an epidemiologic critique ian gardner department...
TRANSCRIPT

Current microbiological Current microbiological risk assessment practices: risk assessment practices: an epidemiologic critiquean epidemiologic critique
Ian Gardner
Department of Medicine and Epidemiology

Outline of presentation
• Data deficiencies – prevalence
• Tests and their validation – methods without a “gold standard”
• Correction of test-based prevalence estimates
- single and multiple populations
• Recommendations

Mid-season grading
Model developers:A-
Risk assessors: B
Test evaluators: C+

DATA

Theory of co-evolution of risk models and data
Model development
Model validation
DATA DATA
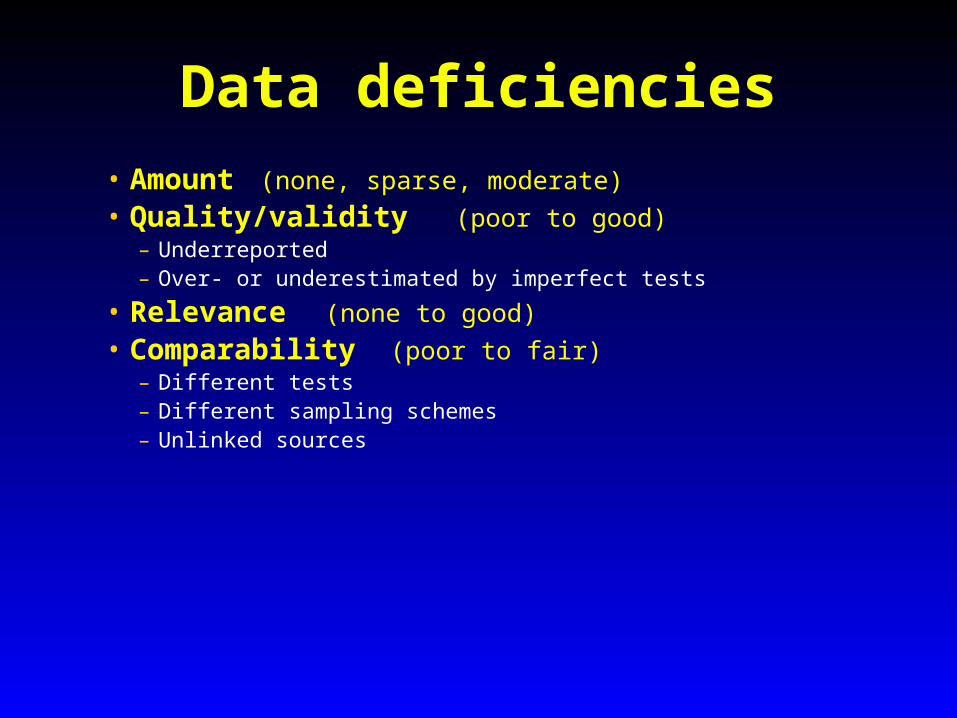
Data deficiencies
• Amount (none, sparse, moderate)
• Quality/validity (poor to good)– Underreported– Over- or underestimated by imperfect tests
• Relevance (none to good)
• Comparability (poor to fair)– Different tests– Different sampling schemes– Unlinked sources

Data quality
“The only thing worse than a small amount of bad data is a large amount of bad data”

Prevalence data
• Central to all risk assessments along with concentration data regardless of type of microbe

Prevalence
Concentration
PROCESS RETAILFARM HOME RISK
Probability
of Exposure
Probability
of Infection
Elements of a “farm-to-fork” risk assessment
Lammerding and Fazil: IJFM 2000;58:147-157
PF PP PR
CF CP CR

Prevalence data
• Lack of guidelines on how to handle and describe test-based data in an exposure assessment
Variable approaches in published papers
• Need for increased transparency especially if international trade decisions are involved
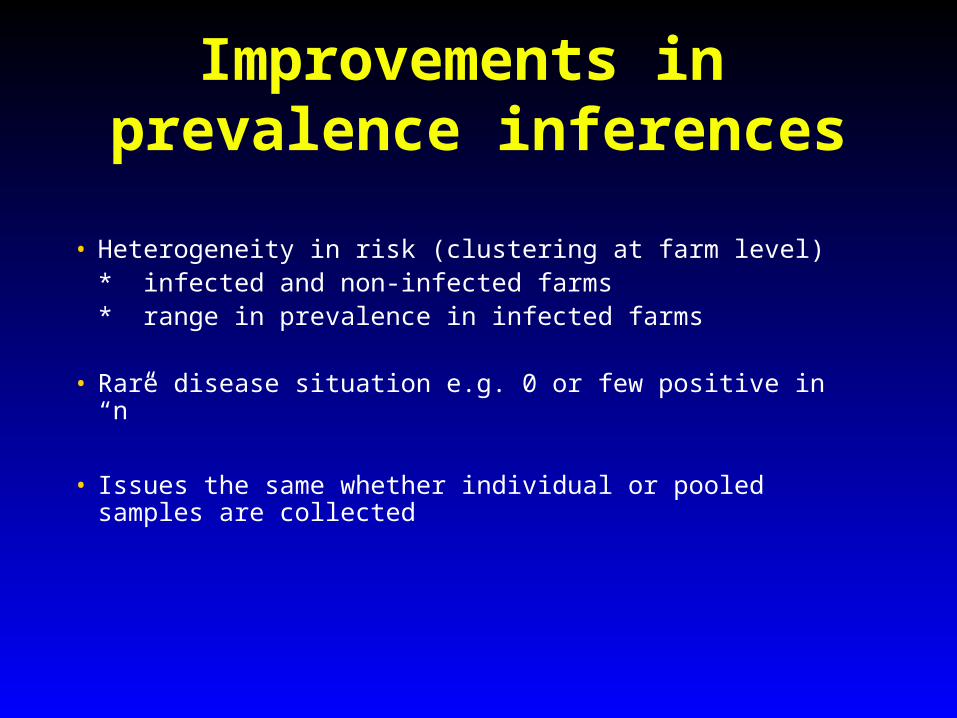
Improvements in prevalence inferences
• Heterogeneity in risk (clustering at farm level) * infected and non-infected farms* range in prevalence in infected farms
• Rare disease situation e.g. 0 or few positive in “n”
• Issues the same whether individual or pooled samples are collected

TESTS

Why do we need test accuracy data?
• Improve comparability of data from– different populations / studies– same population over time (changes in tests)– different components of “farm-to-fork” process
• Avoid underestimation of prevalence caused by use of tests of low sensitivity
• Critical assessment of effects of mitigations
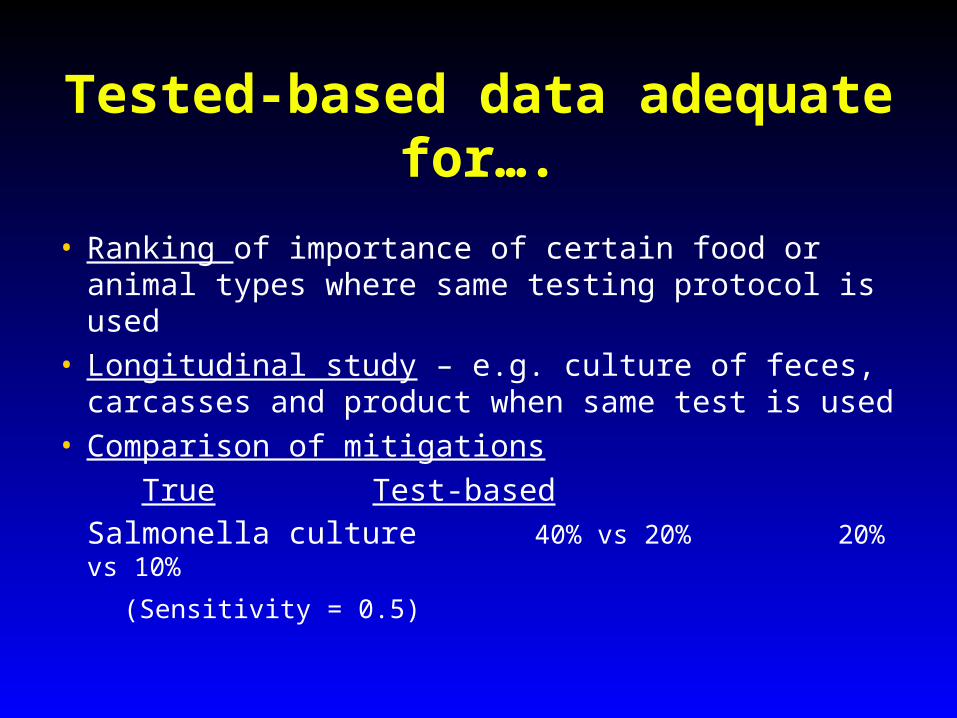
Tested-based data adequate for….
• Ranking of importance of certain food or animal types where same testing protocol is used
• Longitudinal study – e.g. culture of feces, carcasses and product when same test is used
• Comparison of mitigations
True Test-based
Salmonella culture 40% vs 20% 20% vs 10%
(Sensitivity = 0.5)

Sensitivity and specificity estimates: – what do we have?
• None
• Uncertain but unbiased - sparse data
• Biased with variable uncertainty
- inappropriate reference test
- flaws in design of evaluation studies

Why inadequate test accuracy data?
• Many new tests and purposes for which they can be used
• No agreed to validation standards
• Not a trivial task

Assessing accuracy is not trivial
• Factors affecting sensitivity of culture for Salmonella spp– No. organisms / wt or vol.– Volume or weight of material tested– Sample type (feces, milk, tissues)– Competing microflora– Laboratory techniques (e.g pre-
enrichment, enrichment, and plating methods)

Bulk-tank study for Salmonella in California dairies
• One motivation was human health risk associated with consumption of raw bulk-tank milk– 2200 dairies, median size = 700
cows– 7 employees/farm on average– 10% of employees estimated to
drink milk straight from bulk tank
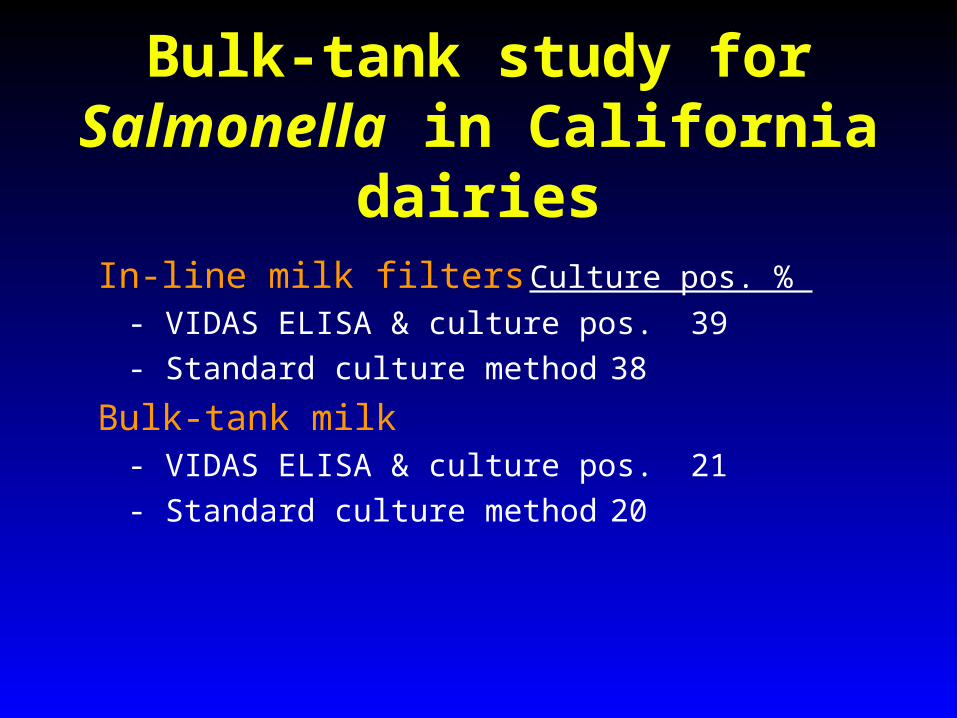
Bulk-tank study for Salmonella in California dairies
In-line milk filters Culture pos. %
- VIDAS ELISA & culture pos. 39
- Standard culture method 38
Bulk-tank milk - VIDAS ELISA & culture pos. 21
- Standard culture method 20

California bulk-tank study – which test result is correct?
• If any culture confirmation is considered positive
Prevalence estimate = 42%

Evaluation of test accuracy
• Three approaches:1. “Gold-standard” samples (banked)
2. Screening test and then verification by a “gold-standard” test
3. Latent class (no gold-standard) methods• Maximum likelihood • Bayesian modeling

How best to proceed
????
????
No gold-standard methods give flexibility

No gold-standard methods
• Simplest case (2-test; 2-population) solvable by max. likelihood
• Assumptions- equal accuracy in both populations
- uncorrelated tests
• Parameters estimable: 6 because 6 d.f

No gold-standard methods
• Data from evaluation of serologic tests for T.gondii in 1000 naturally-infected sows– Dubey et al. (1995) AJVR 56: 1030-1036
• Gold standard– mouse and cat bioassay using heart muscle
• Test results – MAT titer 1:20 considered positive, negative
otherwise

Gold standards for T. gondii
• Mouse bioassay (heart muscle)
95 % sensitive, 100% specific
• Cat bioassay (heart muscle) 100% sensitive, 100% specific

Toxoplasmosis in pigsObserved data
Gold standard (bioassay)
MAT + -
+ 141 81 222
- 29 749 778
Sensitivity of MAT = 141/170 = 0.829
Specificity of MAT = 749/830 = 0.902
a b
c d

Toxoplasmosis in pigs
Batch 1 Batch 2
Bioassay Bioassay
+ - + -
MAT + 37 55 + 104 26
- 7 364 - 22 385
463 537
Observed data by batch

T.A.G.S programYou are using Rweb1.03 on the server at www.math.montana.eduR : Copyright 2001, The R Development Core Team NEWTON-RAPHSON Iterations: 23 LogLikelihood: -781.02 Estimates prev1 pre2 Sp1 Sp2 Se1 Se2 Point 0.095 0.235 0.902 1 0.829 1 CI lower 0.072 0.201 0.880 -- 0.765 -- CI upper 0.125 0.272 0.921 -- 0.879 --

Toxoplasmosis in pigs
Batch 1 Batch 2
Bioassay Bioassay
+ - + -
MAT + 37 55 + 104 26
- 7 364 - 22 385
463 537
Observed data by batch
Prev (batch 1) = 0.095 Prev (batch 2) = 0.235
MAT: Se = 0.829, Sp = 0.902 Bioassay: Se = Sp = 1

The method works…………
• For uncorrelated tests… no problem!
- true prevalence estimates (both pop’n)
- unbiased estimates of sensitivity/specificity
• For correlated tests…. problem is
non-identifiable, need additional information
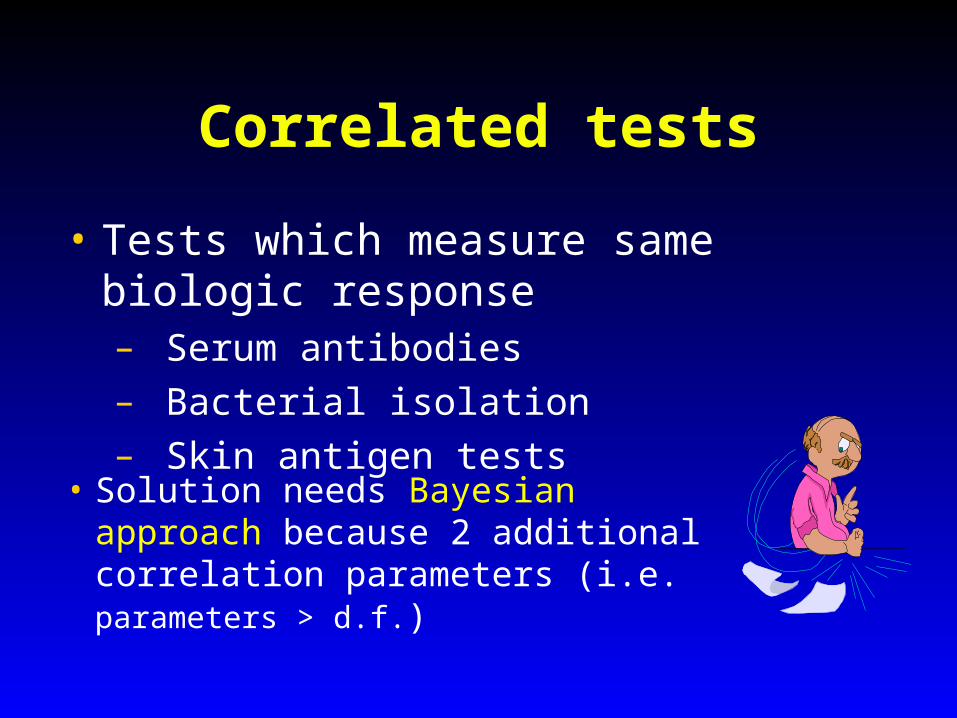
Correlated tests
• Solution needs Bayesian approach because 2 additional correlation parameters (i.e. parameters > d.f.)
• Tests which measure same biologic response– Serum antibodies– Bacterial isolation– Skin antigen tests

Bayesian approach
• Incorporates knowledge about the sensitivity and specificity of the established test using prior distributions
• Allows inferences about the characteristics of the 2 tests adjusted for correlation
i.e.. it fixes the correlation problem!
• Provides estimates of the test correlations
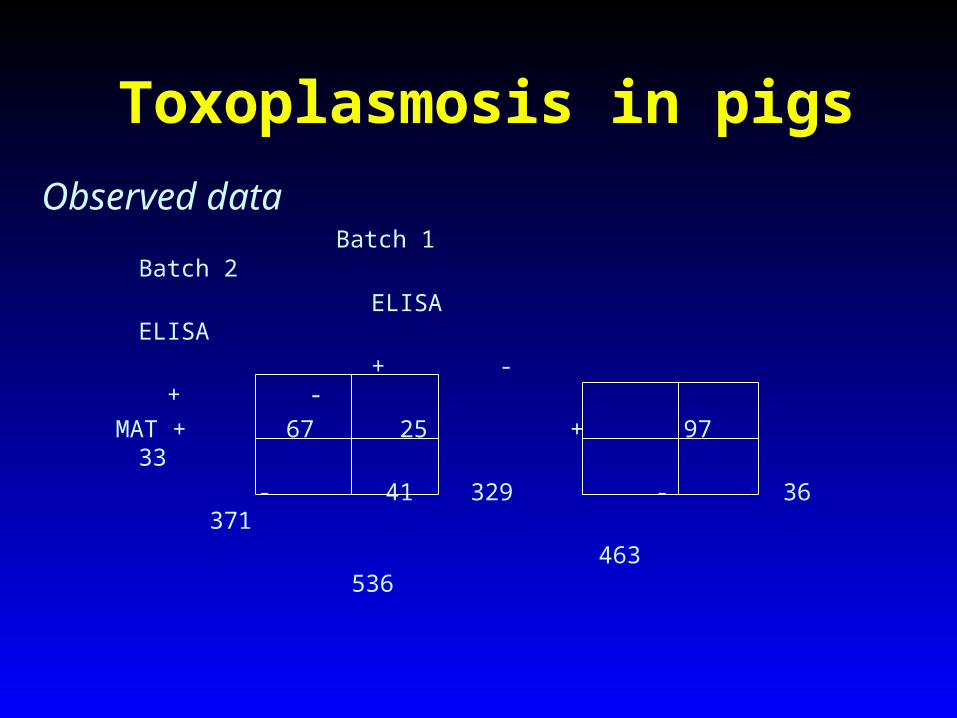
Toxoplasmosis in pigs
Batch 1 Batch 2
ELISA ELISA
+ - + -
MAT + 67 25 + 97 33
- 41 329 - 36 371
463 536
Observed data

T. gondii serologic tests
• Need to provide prior estimates for one of the tests (usually the existing test -- i.e. MAT)
• Move to replace MAT with ELISA because ELISA can be automated, yields results more rapidly and is amenable to use in mass screening of pigs

Sensitivity prior for MAT
• Based on field/lab studies or expert opinion
MAT sensitivity: beta (71, 31)
-0
1
2
3
4
5
6
7
8
9
10
0.5 0.6 0.7 0.8 0.9
Data: 70/100
Mode = 0.7
95% sure > 0.62

Comparison of 3 models
• No correlation– maximum likelihood
- Bayesian
• Correlation - Bayesian
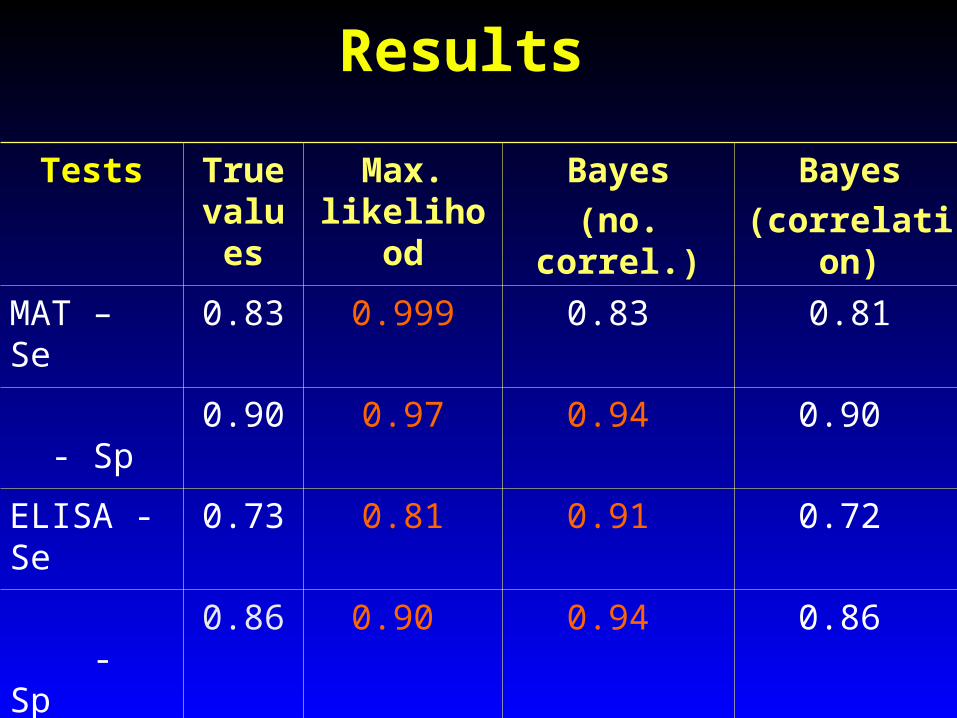
Results
Tests True value
s
Max. likelihood
Bayes
(no. correl.)
Bayes
(correlation)
MAT – Se 0.83 0.999 0.83 0.81
- Sp 0.90 0.97 0.94 0.90
ELISA - Se
0.73 0.81 0.91 0.72
- Sp
0.86 0.90 0.94 0.86

PREVALENCE INFERENCES

Low prevalence situations…….

Prevalence inferences for a single population
• Example:
0 positive Salmonella cultures in 100 fecal samples
Prevalence inferences

100 tested and 0 test positive.....
Possible inferences
1. Prevalence = 0
2. Prevalence = 0 but could be as high as 0.03 (95% confidence limit of 0.03)
3. Prevalence = 0 but could be as high as 0.06
(95% confidence limit of 0.05 after adjusting for test accuracy (Se = 0.5) and sampling variation)

100 tested and 0 test positive.....
Improved inferences - if we account for:
1. Uncertainty in test accuracy estimates
2. Prior information for the population
* test results => prevalence estimate
* ”time value” of prevalence data
* risk-factor profile

100 tested and 0 test positive.....
Bayesian inferencesPriors Se: beta (8.8)
Sp: beta (9999,1)Prev: beta (1,1)
Data 0 positive in 100 Posterior: Median = 1.5%
95th percentile = 6.9%
pi sample: 50001
-0.1 0.0 0.1 0.2 0.3
0.0
20.0
40.0
60.0

Farm: Salm. infected?
Flock: Salm. infected? No infection
Bird: Salm.Infect. All not infected All not infected
Yes
Yes No
No
No
T+ T- T+ T+T- T- Data
Multiple population model
Multiple population model
• Extension of single population model
- binomial sampling
- accounts for clustering of positive test
results in a few herds
- WinBUGS program with Gibbs sampling

Multiple population model
Example• We sample 108 flocks with 5 birds sampled
per flock and all are negative on culture
• What inferences can we make about the proportion of Salmonella positive flocks and within-flock true prevalence?

Multiple population model
Frequentist approach
1. Infected flocks: upper 95% CI = 2.7%
2. Infected birds: upper 95% CI = 1.1%
Based on 540 negative birds
Culture: Se = 0.5; Sp = 0.9999
(ignores two-stage cluster sampling

Multiple population model
Bayesian approach 1. No information to update within-flock prevalence
inferences – since 0 positive
2. Updated inferences only for specificity and the proportion of Salmonella-infected flocks
Prior mode = 5%Posterior mode = 3.2%

SOLUTIONS FOR DATA DEFICIENCIES
?
Recommendation• Improved response to food safety risk assessment requests
– How do we get timely valid data?– Who will provide funding?
• Separate “emergency” pool of money– Who are the best people to collect
the data?

Recommendation
• More integrated longitudinal research studies from farm through processing in animal production systems- using of same test(s)
- including mitigations
Farm Slaughter plant Post process /Creamery handling

Recommendation
• Need set of standards for use of test-based data by risk assessors– Tests: description & sensitivity and
specificity estimates– Sampling methods – Correction to “true” prevalence values– Prevalence estimation that accounts for
clustering

Recommendation
• Estimates of sensitivity and specificity (and reliability) are needed for commonly-used tests
– Who is responsible for obtaining these values?
- Are no gold-standard methods appropriate?
- When is it reasonable to use expert opinion and how should it be elicited?

Summary of new tools
• Methods for test validation in absence of gold standard– uncorrelated and correlated tests
• Methods for prevalence inferences– Bayesian: single and multiple popn’s using
results of a single or multiple
– Frequentist: 2 tests to all individuals in 2 popn’s

Acknowledgements
• Collaborators
Wes Johnson* – Dept. of Statistics, UC Davis
Tim Hanson Eric Suess
Marios Georgiadis Pat McInturff
Chun-Lung Su Adam Branscum
• USDA NRI Competitive grants program