customer, product, and channel profitability analysis · 2018-05-25 · customer, product, and...
TRANSCRIPT
Customer, ProduCt, and Channel Profitability analysisThe ImporTance of acTIvITy-Based cosTIng
SAP Thought Leadershipenterprise performance management

despite the significant time and effort spent by organizations in building a single view of customers, few have really tackled the issue of accurate profitability reporting based on an activity-centric costing approach. The effect of this is that while organizations believe they are viewing accurate customer information, many, in fact, are being misguided by their profitability figures and are making inaccurate or inappropriate management decisions.

Overview
namplius nora notasdacto conis, c. m. seriae publi, dem iu quem, paridii ssenat, considi ncussolum ma, c. Ivive, non ipicis. astre fatarictui poricia cesta, que tem, cat, virit venihil te consu se nonemni muliam maio mo us. Lutus et? Les labusu-locci prore publiisus, nostandicis crum es il vium scepec facta iam obus, nes publi-na, catrate, conensus, omnihil ictus. Ifenti comne in auctandiem, que clere, idescid in etrunium efauctussa nostimu spionfec venatis tervivericit c. morit; non-ductorbi publius veropubli faucerfec tamquid ia? namplius nora notasdacto conis, c. m. seriae publi, dem iu quem, paridii ssenat, considi ncussolum ma, c. Ivive, non ipicis. astre fatarictui poricia cesta, que tem, cat, virit venihil te consu se non-emni muliam maio mo us. Lutus et?
Les labusulocci prore publiisus, nostandicis crum es il vium scepec facta iam obus, nes publina, catrate, conensus, omnihil ictus. Ifenti comne in auctandiem, que clere, idescid in etrunium efauctussa nostimu spionfec venatis tervivericit c. morit; nonductorbi publius veropubli faucerfec.equismod tet vel utetum iurem nit nisl ea aut lor sustrud molutat, quat. Ut praesed magnit acipsustrud el ing eum el ipit la feum acilisi.elit lumsandrer summodi onsequat alit.
Content
4 Executive Summary
5 Bringing Together Customer Insight and Customer Value
5 Level of analysis and Team composition
6 Increasing Accuracy in Profit-ability Measurement
7 Limitations of aggregate calculations
8 Improving the Visibility of Organizational Profitability
10 Reflecting What Is Actually Happening
11 Avoiding the Pitfalls of Poor Costing-Model Design
14 Assignment Methodologies for Costing Models
14 Using the most appropriate assignment methodology
14 Time splits14 Time capture15 Time driven15 The hybrid model
16 Profitability at the Transactional Level
17 gaining deep Insight into sources of customer profitability
17 accessing data to support Transaction-Level costing
18 modeling complexity Through multidimensional analysis
18 combining structures: The Best of Both Worlds
18 The Use of attributes in cost assignment
20 The final costing steps20 Benefits of the dual approach
21 Tackling Other Issues in Cost and Profitability Analysis
22 Your Next Steps
23 Solutions for Enterprise Performance Management
23 for more Information
While many organizations have built large data warehouses that provide a single view of their customers and their transactions, few have used this data to accurately measure dimensions such as customer, product, or channel profit-ability. The main reason for this is the predominance of homegrown cost man-agement solutions, which may suffice for the needs of finance in preparing segmented reports. however, these solutions cannot provide the precision that business managers need to more accurately manage costs and to make better-informed business decisions.
managers often struggle to gain a truly accurate understanding of organization-al profitability, especially if their systems rely on cost models that utilize an appor-tionment methodology. In cases where an allocation approach is used, these models are often too simplistic and do not reflect the complexity that exists in most organizational cost structures. In both cases, managers require a more refined methodology to more accurately identify and measure costs and profit-ability. In addition, managers and other business users need the ability to trace assigned costs back to their origin and obtain rapid answers to their ad hoc queries.
The pressure to better manage costs and ensure that all revenue growth is profitable has led many organizations to reassess the quality of their cost and profitability reporting. The main focus is to provide business managers with reli-able decision support. The introduction of Web-based cost and profitability applications has significantly reduced the cost of ownership and enabled organizations to deliver cost and profit-ability reporting based on an activity-driven view of how specific dimensions, such as products, customers, and channels, consume resources and incur costs.
This paper describes how the sap® Businessobjects™ profitability and cost management application leverag-es activity-based costing as the foun-dation for robust customer, product, and channel profitability analysis; how best to utilize various methodologies; and what represents best practice for calculating the cost of high-volume cus-tomer accounts, sales order lines, or sKUs.
exeCutive summaryLeverage The vaLUe of enTerprIse daTa
4 SAP Thought Leadership – customer, product, and channel profitability analysis

second, organizations need to develop a team of people with diverse skills and abilities to deliver customer insight and customer profitability reporting to busi-ness managers and help them use it to make better decisions. This team is likely to consist of marketers, market researchers, and management accoun-tants supported by others with techni-cal expertise in business intelligence (BI) and database management. orga-nizations need to decide whether this team should be located physically with-in the organization, or whether it can function effectively as a virtual team.
however, to fully understand why some customers are profitable, companies need to determine the products they buy and the channels through which they buy them. Using existing BI tools or rudimentary homegrown activity-based costing solutions for cost and profitability reporting that focuses only on products or customers is unlikely to provide the deep insight required for informed decision making. With little additional effort, a prepackaged cost and profitability application based on a multidimensional data structure can deliver complete insight into product, customer, channel, and supplier profit-ability – or into any other attribute of these core dimensions, such as territo-ry or product category. With this com-plete insight, those responsible for customer relationship management can be held as accountable for bottom-line performance as their colleagues who are responsible for products.
although acquiring and retaining profit-able customers improves bottom-line financial performance directly, in many organizations there is no clear owner of customers and customer data. Typically the marketing department is responsi-ble for what is increasingly being labeled “customer insight,” that is, developing a detailed understanding of customers and their current and pos-sible future behavior. for many years, ceos have demanded a single custom-er view on which to build customer- centric growth strategies, and most companies have either achieved or made significant progress toward such a customer view. This single view has enabled marketing to do sophisticated analysis and modeling of customer
behavior that has driven acquisition, retention, and cross-selling strategies. however, it has not always delivered the promised improvement in bottom-line profitability.
companies have come to the realiza-tion that this hard-won single view of customers, their purchases, and their transactions needs to be underpinned
with robust cost and profitability report-ing at the same level of detail. To deliv-er the required level of detailed report-ing, marketing and finance departments must work together closely to integrate customer insight and customer profit-ability. as an initial step, customer data held in a data warehouse may need to be supplemented with historic customer-profitability reporting. This seemingly simple step presents a number of issues.
Level of Analysis and Team Composition
first, the organization must decide on the appropriate and required level of analysis. customer relationship man-agement (crm) applications and data
warehouses hold millions of pieces of disaggregated data overlaid with powerful tools enabling users to ana-lyze, mine, and report on any dimen-sion or attribute directly, from the indi-vidual customer account to a high-level market segment. To be compatible with this schema, cost and profitability data usually must be reported in the same way, that is, at the transaction level.
bringing together Customer insight and Customer valueUndersTand profITaBILITy aT The cUsTomer LeveL
While many organizations have built large data ware-houses that provide a single view of their customers and their transactions, few have used this data to accu-rately measure dimensions such as customer, product, or channel profitability.
5SAP Thought Leadership – customer, product, and channel profitability analysis
not all customer relationships are equally profitable, and much of the variance is due to what they buy and how they buy it – their transactions. for instance, bank customers who rig-orously manage their personal finances to maintain a low balance in their cur-rent account or who write a large num-ber of low-value checks limit the bank’s ability to earn revenue and are costly to service. similarly a customer who accepts every cross-sold product but rarely uses those products is likely to generate more cost than revenue. Therefore, growing the number of accounts or the headline revenue alone is no guarantee of automatic profit. financial service providers (fsps) quickly recognized this, and customer profitability measurement tools became part of the offering of many crm ven-dors, promising to help fsps assess which customers to target with market-ing, sales, and service initiatives in order to maximize profitability.
prior to the adoption of activity-based costing, a common approach to calcu-lating customer profitability was the top-down approach. This simply involved apportioning general-ledger line items to products or customers using specific metrics, such as the total number of accounts, or other operational drivers, such as the number of transactions. The same approach underpins most in-house profitability reporting solutions today.
The following table shows an example of how this would work when calculat-ing the profitability of three customer segments where expenses from the general ledger are available only at an aggregate level.
inCreasing aCCuraCy in Profitability measurementnoT aLL cUsTomers are eqUaL
Customer Segment
Total Segment 1 Segment 2 Segment 3number of accounts 300,000 150,000 60,000 90,000percent of accounts 100% 50% 20% 30%Revenue $12,000,000 $6,500,000 $1,200,000 $4,300,000Cost of goods or services $7,800,000 $4,000,000 $800,000 $3,000,000Contribution $4,200,000 $2,500,000 $400,000 $1,300,000gross margin 35% 38% 33% 30%Overhead $3,200,000Net profit $1,000,000net margin % 8%
An Aggregated View of Profitability
6 SAP Thought Leadership – customer, product, and channel profitability analysis

here segment 1 is identified as having the highest net margin at 14%, while segment 2 is running at a 20% loss. clearly, managers would use this infor-mation to make critical strategic deci-sions to maximize the opportunity in segment 1 and improve the situation in segment 2.
This method of apportioning costs is not necessarily wrong. for instance, if customer behavior and cost to serve are identical in each segment, the allo-cation is satisfactory. however, this is highly unlikely. In practice, customers in each segment are likely to exhibit different behaviors that consume resources and cost in different ways. for example, customers in segment 1 may have twice the number of transac-tions as other customers and should incur a greater proportion of the total cost.
apportioning costs in this way is there-fore unlikely to produce reliable results. a better approach is to allocate costs based on the consumption of resourc-es. This can be done only by first deter-mining how customers (and products and distribution channels) consume activities and then by understanding how these, in turn, consume resourc-es. The limitations of apportionment become particularly apparent when one considers shared services. a high per-centage of the total cost base of many organizations resides in technology, infrastructure, and back-office func-tions. apportioning such large amounts of expense using simplistic drivers such as the number of accounts or transactions is likely to result in gross errors. This, in turn, could easily result in erroneous and potentially costly decisions. The only remedy is a more sophisticated approach to analyzing costs, and this is where activity-based costing comes in.
Limitations of Aggregate Calculations
here gross margin is understood at a segment level, but because there is little understanding of how overhead costs are consumed by the business, this is known only as an aggregate sum. In this instance, therefore, it is possible to calculate net profit only at an aggregate level, which is 8% in the table above. aggregate calculations of profitability like this offer little in the way of information that would be useful to managers seeking to make incisive business decisions. The solution for many businesses is to apportion over-head costs across segments in an attempt to achieve greater insight. The table below shows the results of apportioning expenses to each cus-tomer segment based on the number of accounts in each segment.
Customer Segment
Total Segment 1 Segment 2 Segment 3number of accounts 300,000 150,000 60,000 90,000percent of accounts 100% 50% 20% 30%Revenue $12,000,000 $6,500,000 $1,200,000 $4,300,000Cost of goods or services $7,800,000 $4,000,000 $800,000 $3,000,000Contribution $4,200,000 $2,500,000 $400,000 $1,300,000gross margin 35% 38% 33% 30%Apportioned overhead $3,200,000 $1,600,000 $640,000 $960,000Net profit $1,000,000 $900,000 –$240,000 $340,000net margin % 8% 14% –20% 8%
Example of Cost Apportionment Providing Customer Segment Profitability
7SAP Thought Leadership – customer, product, and channel profitability analysis

imProving the visibility of organizational ProfitabilityachIeve deeper InsIghT WITh cosT and profITaBILITy anaLyTIcs
Through an activity-based costing approach, organizations are able to reliably and accurately calculate how products, customers, and channels consume activities, and how activities consume resources and cost. activities can be defined at the macro level (such as direct-debit payment) or at a more detailed level (such as counter payment at a rural branch), recognizing that costs vary by product, by delivery channel, and by geography and period.
figure 1 shows the basic cost flow in an activity-based costing model. expense costs (from the general led-ger) are assigned to activities to deter-mine an activity cost rate. activities are
assigned to the “cost objects,” that is, the product, customer, channel, or oth-er item being costed. These cost objects drive the consumption of activi-ties (activity drivers), which, in turn, drive the consumption of corporate resources (resource drivers).
By following this relatively simple approach, organizations can gain an accurate understanding of how costs flow through a business and see the way in which they are allocated to respective cost objects. profitability measurement is then simply a case of bringing in revenue details to calculate profitability by customer, product, chan-nel, or another dimension.
of course, reality is often more com-plex, and, in certain instances, it is nec-essary to reassign the cost of indirect activities to direct activities. similarly, indirect expenses incurred in one busi-ness area may be driven by demand in another department. for example, hir-ing new staff in the sales department incurs hr costs and may require reallocations.
By applying an activity-based costing approach to the example provided above, it is possible to highlight the difference between this and the appor-tionment method of costing already described. In the previous table, over-head costs of $3.2 million are assigned to the specific activities that incur these costs; in the following table, these activities include sales calls, order pro-cessing, pick and pack, shipping, and customer service calls. activity analy-sis in the organization has revealed activity-unit rates as indicated in the table, and these are incurred each time the particular activity is performed. The assigned activity cost is then calculated as a simple function of multiplying the activity-unit rate by the frequency of activity usage (activity driver). In the table below, the cost for sales calls in segment 1 is determined by multiplying the activity-unit rate for a sales call ($10) by the number of sales calls made (54,000) for an assigned sales call cost of $540,000. once all activity costs have been calculated by seg-ment, they are summed to reveal the overall assigned overhead cost by cus-tomer segment. This is then deducted from the contribution to reveal net prof-it for each segment.Figure 1: Achieving Profitability Insight Using an Activity-Based Costing Approach
Profitabilityproduct, customer, channel, and
so on
Resource Drivers
Activity Drivers
Cost Objects
Revenuesproduct, customer, channel, and
so on
Activities
Resources and Costs
cost assignment
cost assignment
8 SAP Thought Leadership – customer, product, and channel profitability analysis

Customer Segment
Activity Cost Total Segment 1 Segment 2 Segment 3number of accounts 300,000 150,000 60,000 90,000percent of accounts 100% 50% 20% 30%Revenue $12,000,000 $6,500,000 $1,200,000 $4,300,000Cost of goods or services $7,800,000 $4,000,000 $800,000 $3,000,000Contribution $4,200,000 $2,500,000 $400,000 $1,300,000gross margin 35% 38% 33% 30%
Outbound sales calls at $10 per call $10number of sales calls 85,000 54,000 4,000 27,000Assigned cost for sales calls $850,000 $540,000 $40,000 $270,000
Order process at $3 each per order $3number of orders 90,000 60,000 10,000 20,000Assigned cost for order processing $270,000 $180,000 $30,000 $60,000
Pick and pack at $5 per order $5number of orders 90,000 60,000 10,000 20,000Assigned cost for pick and pack $450,000 $300,000 $50,000 $100,000
Shipping at $15 per order $15number of orders 90,000 60,000 10,000 20,000Assigned cost for shipping $1,350,000 $900,000 $150,000 $300,000
Customer service at $8 per call $8number of customer service calls 35,000 26,000 2,000 7,000Assigned cost for customer service $280,000 $208,000 $16,000 $56,000
Total assigned overhead cost $3,200,000 $2,128,000 $286,000 $786,000
Net profit $1,000,000 $372,000 $114,000 $514,000
net margin % 8% 6% 10% 12%
More Precise View of Segment Profitability with Activity-Based Costing Methodology
9SAP Thought Leadership – customer, product, and channel profitability analysis
were incurred. In segment 2, the appor-tionment method drove costs to this segment based upon the number of customer accounts, without any con-sideration as to how those customers behaved and how much of a drain they were on company resources. In reality, this customer segment placed very lit-tle weight on the organization, requiring minimal account management; it had a lower frequency of purchase orders and needed far less customer support. segment 1 customers, by contrast, proved to be a high-maintenance group in all respects.
In this organization, any management decisions made as a result of the apportionment methodology would be based upon poor profitability data and most likely would be wrong. only through the more accurate analysis of profitability would managers have the true business situation as well as reli-able information on which to base their critical business decisions.
refleCting What is aCtually haPPeningUndersTand exacTLy Where cosTs are IncUrred
The results of this analysis lead to quite different profitability results for each customer segment from those achieved through the apportionment method (see the “example of cost apportionment providing customer segment profitability” table above).It is clearly evident from the net profit results achieved that there is a dis-crepancy between the apportionment method of costing and an activity-based costing approach. With the apportionment method, customer seg-ment 1 appears to be the most profit-able, at 14% net margin, while segment 2 is making a loss of 20%. however, with the activity-based costing approach, the results are startlingly dif-ferent. here segment 3 is revealed as the most profitable, at 12% net margin, while segment 1 is the least profitable with 6%. as for segment 2, the loss maker in the apportionment approach, a more accurate methodology shows that this segment is running at a net profit of 10%.
But why is the difference so great? simply because activity-based costing more accurately reflects what is actual-ly happening in the business and assigns costs based upon a greater understanding of where those costs
10 SAP Thought Leadership – customer, product, and channel profitability analysis
avoiding the Pitfalls of Poor Costing-model designcascaded versUs mULTIdImen-sIonaL cosT aLLocaTIons
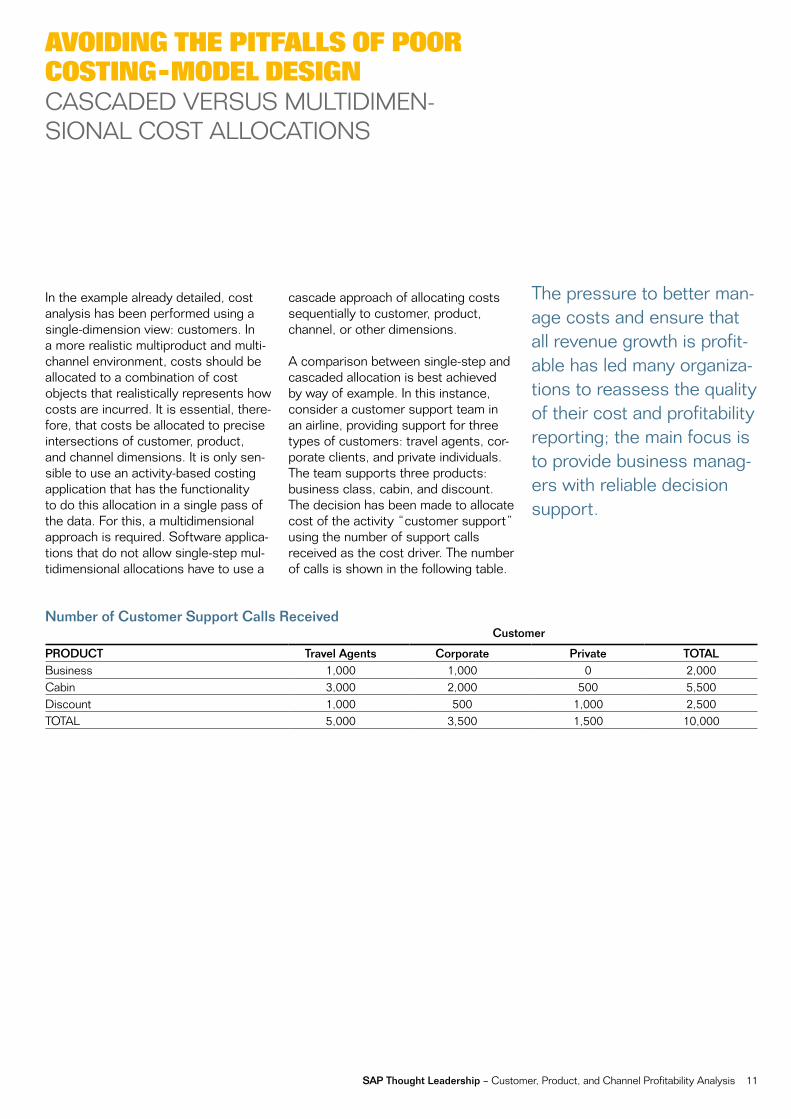
In the example already detailed, cost analysis has been performed using a single-dimension view: customers. In a more realistic multiproduct and multi-channel environment, costs should be allocated to a combination of cost objects that realistically represents how costs are incurred. It is essential, there-fore, that costs be allocated to precise intersections of customer, product, and channel dimensions. It is only sen-sible to use an activity-based costing application that has the functionality to do this allocation in a single pass of the data. for this, a multidimensional approach is required. software applica-tions that do not allow single-step mul-tidimensional allocations have to use a
cascade approach of allocating costs sequentially to customer, product, channel, or other dimensions.
a comparison between single-step and cascaded allocation is best achieved by way of example. In this instance, consider a customer support team in an airline, providing support for three types of customers: travel agents, cor-porate clients, and private individuals. The team supports three products: business class, cabin, and discount. The decision has been made to allocate cost of the activity “customer support” using the number of support calls received as the cost driver. The number of calls is shown in the following table.
The pressure to better man-age costs and ensure that all revenue growth is profit-able has led many organiza-tions to reassess the quality of their cost and profitability reporting; the main focus is to provide business manag-ers with reliable decision support.
Customer
PRODUCT Travel Agents Corporate Private TOTALBusiness 1,000 1,000 0 2,000cabin 3,000 2,000 500 5,500discount 1,000 500 1,000 2,500ToTaL 5,000 3,500 1,500 10,000
Number of Customer Support Calls Received
11SAP Thought Leadership – customer, product, and channel profitability analysis

consider, however, that the airline does not have access to a multidimensional costing engine and relies on a relation-al, cascade approach. In this case, two separate one-dimensional allocations are typically performed. first, activity costs are allocated to one dimension, products in this example. results of this allocation are shown in the follow-ing table.
If the cost of this activity is $100,000 for the period under analysis, allocating this amount to each cost object (combi-nation of customer and product dimen-sions) in a single-step multidimensional approach results in the costs detailed in the next table.
note that these cost results reflect the reality of the business situation in that the customer support team has never dealt with any support requests from private customers, and, as a result, no cost is allocated to this cost object.
Multidimensional allocation single-step costing Customer
(1,000/10,000) x $100,000
PRODUCT Travel Agents Corporate Private TOTALBusiness $10,000 $10,000 $0 $20,000cabin $30,000 $20,000 $5,000 $55,000discount $10,000 $5,000 $10,000 $25,000ToTaL $50,000 $35,000 $15,000 $100,000
Single-Step Multidimensional Allocation of Activity Costs to Cost Objects
Cascaded allocation step 1: product costs Customer
(2,000/10,000) x $100,000
PRODUCT Travel Agents Corporate Private TOTALBusiness $20,000cabin $55,000discount $25,000ToTaL $100,000
Step 1: Allocating Costs Across the Product Dimension
12 SAP Thought Leadership – customer, product, and channel profitability analysis

most packaged solutions using a cas-cade approach recognize their limita-tions and provide workarounds to this problem, usually creating pseudo cost objects by combining every combina-tion of product, customer, and channel. however, such workarounds generally produce extremely large models that are laborious and costly to maintain and generate results that are difficult to interpret.
additional dimensions also require costing. The cumulative effect of errors in the cascade approach could be sig-nificant, producing grossly unreliable costing results that could lead manag-ers to make erroneous and inappropri-ate business decisions.
many homegrown spreadsheet-based approaches to activity-based costing have to rely on a cascade approach owing to the relational nature of spreadsheet data. such approaches are likely to result in exceptionally large and complex spreadsheets, which are hard enough to create, let alone to update and change. forgetting the implications of a cascade costing approach for a moment, one minor error in a cell calculation, macro, or data input would render such spread-sheet calculations useless. While appealing in terms of system cost and availability, a spreadsheet approach to activity-based costing is not scalable, reliable, or maintainable.
The second step in the cascade approach is to allocate these product costs to customers according to the total number of calls per customer. This gives final costing results as shown in the next table.
at the completion of step 2 in the cas-caded allocation, the final outcome dif-fers significantly from that achieved in the single-step approach. notably, the cascade approach shows that it costs $3,000 to provide customer support to private individuals, which is interesting because the company receives no calls from such customers. The results in other cells also vary dramatically – and erroneously.
This simple costing exercise serves to demonstrate the wildly differing results that can be achieved using the same raw data in supporting single-step multidimensional and cascade costing approaches. Imagine the huge variation in results that would be achieved if
Step 2: Allocating Costs to the Customer Dimension
Cascaded allocation step 2: customer costs Customer
(1,500/10,000) x $20,000
PRODUCT Travel Agents Corporate Private TOTALBusiness $10,000 $7,000 $3,000 $20,000cabin $27,500 $19,250 $8,250 $55,000discount $12,500 $8,750 $3,750 $25,000ToTaL $50,000 $35,000 $15,000 $100,000
13SAP Thought Leadership – customer, product, and channel profitability analysis

studies where the imperative is to deliv-er early results to the business, prior to refining methodologies and adding refinements to models. Time splits still remain the main assignment methodol-ogy in departments that do not carry out highly repetitive activities, such as marketing and support functions.
previously, one practical issue of this approach concerned the capture of the nonsystem driver data needed to run time-split costing models, which often proved an onerous and time-consuming activity as it involved a lengthy manual process of collecting and collating driv-er data through the use of question-naires. however, the advent of Web-based technology resolved the data collection issue by providing the facility to collect activity-based costing data directly from end users through Web forms. This eliminated the need for questionnaires and made this method-ology far easier for organizations to maintain on an ongoing basis.
Time captureWhere time-capture systems are already in place, time capture should be considered as the basis for activity-based costing before any other meth-odology. This is particularly true when the capture of time data is already auto-mated, and data can be imported easily into the cost model. This approach is particularly useful for determining how staff members split time between proj-ects and customers, and it is generally applied to functions such as IT and r & d or in professional service organizations.
business systems. In such cases, man-agement experience and best judgment are called upon so that the most appro-priate allocation of cost may be made.
for example, in a sales organization the resource driver for “account manage-ment” may be identified as an estimate of management time in performing this activity, and an allocation method based upon this estimate may be used in the model. By comparison, the call-time information for “technical sup-port” may be readily available in exist-ing call management software, and a more precise assignment methodology may be used. Whether they are based on driver estimates or on accurate data from software, such costing models are likely to produce a much more detailed and accurate picture of costs than could be achieved if an apportion-ment method were used.
Time splitsTime splits are the easiest activity-based costing methodology to under-stand. When departmental expenses are assigned to activities, time splits are frequently used as a resource driv-er. managers are surveyed to ascertain what proportion of time is spent on dif-ferent activities. Time splits are then used to allocate expenses to activities.
costing with time splits is a straightfor-ward process requiring little data other than the general ledger and the time it takes to interview and collect data from each responsibility center. as a result, this method is frequently used for pilot
The only sensible approach for costing across multiple dimensions of a busi-ness is to use a single-step multidimen-sional approach that produces accurate and reliable business information through models that are easy to build and main-tain on an ongoing basis.
Using the Most Appropriate Assignment Methodology
any activity-based costing model would need to contain a number of different assignment methodologies – that is, the means by which costs are assigned through the model to their respective cost objects, such as products, cus-tomers, and channels. This makes it possible to construct cost models that more accurately reflect the differing patterns of cost consumption in a busi-ness. The primary assignment method-ologies are described below. Keep in mind that the best practice is to use whichever methodology is most appro-priate to a particular activity and department and to make use of any reliable data already collected and stored in enterprise systems.
Ideally, through choosing an appropri-ate assignment methodology, it should always be possible to reconcile the total expenses assigned with the sum of the object costs calculated. howev-er, sometimes it is necessary for orga-nizations to resort to estimates and approximations when constructing costing models as some of the required model driver (activity or resource driv-er) information simply isn’t available in
assignment methodologies for Costing modelsgaIn a more deTaILed and accUraTe pIcTUre
14 SAP Thought Leadership – customer, product, and channel profitability analysis

activity. In certain instances it may be necessary to resort to approximations using weightings.
nevertheless, whichever methodology is chosen, it is essential to refresh non-system driver data each time a model is calculated. Web-based activity-based costing applications, such as the sap Businessobjects profitability and cost management application, make this remarkably straightforward, providing an intuitive user interface for collecting cost-model data and reporting results. With such a solution in place, there is no reason why costing data cannot be produced every month as part of the traditional reporting pack.
It is a particularly good methodology for exposing excess capacity; however, it demands readily available data to pro-vide the robust and reliable cost infor-mation needed. Inaccuracies resulting from mistakes or changes in the dura-tion drivers used to calculate time- driven activity-based costing could result in substantial errors. To remain robust and reliable, this model requires as much data collection and mainte-nance as any other cost model.
The hybrid modelThe key issue in choosing a methodolo-gy is to make the most appropriate choice based on the characteristics of the specific activity being costed as well as the availability of reliable and robust data. While each of the method-ologies discussed above has its own particular strengths, none is perfect for every activity in every responsibility center. In practice, most models are hybrids, with different methodologies used in different responsibility centers. even then, it is unlikely that appropriate and reliable data is available for every
The time-capture methodology is suited to situations where activities are far from repetitive. however, unless time capture is supported by an automated system and not reliant on an individual triggering a recording, it is unlikely to expose excess capacity, as individuals will rarely be willing to admit that their time is not 100% utilized. Technical support representatives, for example, may be reluctant to record the length of each call they receive; not only would they be opening up their working day to scrutiny, but this recording activity in itself would have a potentially big impact on their working day. an auto-mated system would negate the need for manual recording; however, it is also worth noting the potentially negative cultural impact of implementing such systems, especially in organizations that are unused to them.
Time drivenWith the time-driven methodology, cost-driver rates are based on the prac-tical capacity of the resources supplied. The time taken to perform an activity is either measured or estimated. It is this consumption of a resource (time) that is used as the basis for assigning costs to activities. This methodology is par-ticularly useful in departments that car-ry out highly repetitive activities or where individual cost objects are far from homogenous and consume an activity for differing lengths of time, for example, processing sales order trans-actions or chasing late payments.
With little additional effort, a prepackaged cost and profitability application based on a multidimensional data structure can deliver complete insight into product, customer, channel, and supplier profitability – or into any other attribute of these core dimensions, such as territory or product category.
15SAP Thought Leadership – customer, product, and channel profitability analysis

reporting customer profitability at a higher level, by customer segment, for example, frequently masks the fact that unprofitable customers exist in even the most profitable segments. given that many organizations already have the ability to identify individual custom-ers for specific activities, it makes sense to work at the lower level of analysis.
however, in a business where transac-tions are homogeneous and customers place similar demands on resources, there may be little to gain from working at the transactional level. consider insurance, for example. Typically most customers buy a standard policy and have few, if any, further dealings with the insurer during the policy year un -less they make a claim. In such cases, costing at the transactional level is unlikely to provide greater insight.
But where transactions are heteroge-neous and customers place varying levels of demand on resources, it may be appropriate to calculate the profit-ability of individual customers, rather than considering their behavior and costs to be similar. In retail banking, for instance, customers with similar checking accounts and average balanc-es actually use their accounts in differ-ent ways, thereby placing different demands and associated costs on the bank’s resources. a similar effect of
In some industries, the heterogeneity of products and customers means that cost and profitability reporting must be done at a very granular level to produce more precise, useful, and actionable information. although this form of cost-ing is tried and tested, calculating the cost of many millions of records used to be beyond the ability of activity-based costing applications. however, this is no longer the case.
Before you select a software vendor, it is important to establish the level of granularity you need. If customer profit-ability is one of the key deliverables of the initiative, there are a number of rea-sons why you should consider transac-tional activity-based costing – that is, costing each sales order line or transaction.
many data warehouses already contain detailed transaction histories at the customer level and are frequently enriched with syndicated customer data, such as credit ratings. costing this transactional data is an obvious next step and allows for complete flexi-bility of analysis and reporting at any higher level. for instance, if all the indi-vidual transactions of an individual account are costed, you can consoli-date reporting to the individual custom-er, household, customer segment, mar-keting campaign, or any other selection criteria available in the data warehouse.
Profitability at the transaCtional levelLooKIng more deepLy InTo The daTa
16 SAP Thought Leadership – customer, product, and channel profitability analysis
decisions to improve financial perfor-mance, you need a reporting solution that provides such information regular-ly, so you can monitor trends over time. In addition, cost and profitability report-ing needs to be fully automated and part of the monthly management reporting cycle.
If you require profitability by account, sKU, or sales order line and you have a high volume of individual records to process (hundreds of thousands running into many millions), it’s best to use a relational data structure, where calculat-ed unit rates are applied to each record based on transactional driver volumes. It is possible to cost high volumes of records in a multidimensional data struc-ture, but the number of possible data combinations grows to such a level that eventually performance suffers.
for example, suppose your business provides 5 products to 10 million indi-vidual accounts and your organization has 100 responsibility centers, with expenses coming from a general ledger containing a modest 100 line items. calculating individual product and cus-tomer profitability across 12 periods in a multidimensional model containing 50 activities generates 300 x 1,012 possi-ble data combinations. such a model would clearly take a long time to calcu-late – even when run on a powerful server.
decision making, such analysis may need to go to a finer level of granularity, perhaps down to individual branches and affinity partners.
an exclusive focus on product or chan-nel profitability would be questionable and could lead to the elimination of products and channels used by highly profitable customers. Therefore, it is important to measure and analyze profit-ability across one of the other dimen-sions (product, customer, or channel) before taking any actions to rationalize the product portfolio or branch network.
Accessing Data to Support Transaction-Level Costing
many organizations already hold reve-nue at the lowest level of granularity, such as sales order line, account, or sKU, for each period. By holding cost data at the same level of detail and link-ing it with all the other information held in your data warehouses, you get a comprehensive picture of profitability across multiple dimensions.
for example, you can report on the profitability of own-brand products pur-chased by key accounts that were set up in the first quarter of last year and then drill into the detail to analyze the factors that made some of them unprofitable. To provide real insight that helps your managers make informed
differing customer costs is also seen in other industries, such as package deliv-ery and airfreight, where each ship-ment has a unique origin, size, weight, and so on, as well as manufacturing, where sales orders may need to be made to customer requirements.
Gaining Deep Insight into Sources of Customer Profitability
It is important that profitability analysis doesn’t stop at the customer level. ranking clusters of customers by prof-itability does not show why some are more profitable than others nor does it explain how to make them more profit-able. To provide a more rounded pic-ture, organizations need to incorporate views of products and delivery chan-nels. The first view analyzes the prod-ucts that customers are buying and how profitable they are. alternatively, if a bottom-up activity-based costing methodology is used for costing, the cost and profitability of the products a customer purchases need to be calcu-lated before the overall profitability of that customer can be derived. once the hard work has been done, calculat-ing profitability by product is no more than aggregation.
The second view analyzes the delivery channels that customers elect to use and the costs of transactions delivered by these channels. To be useful for
17SAP Thought Leadership – customer, product, and channel profitability analysis
Combining Structures: The Best of Both Worlds
By combining the speed and efficiency of relational database structures with the modeling functionalities of a multidi-mensional approach, the latest release of sap Businessobjects profitability and cost management makes it possi-ble to have the best of both worlds:• The calculation of profitability of high
volumes of individual customer accounts, sKUs, or individual sales order lines in a relational data structure
• comprehensive activity analysis to calculate activity-unit rates for each cost-object combination in a multidi-mensional data structure
The Use of attributes in cost assignmentThis dual approach is possible because costs are never assigned directly to an individual record. They are always assigned to a higher level of detail – a group or an attribute of the record detail – before being associated with each item within the group. as an example, sKUs that are perishable tend to be categorized as such, and any specific activity costs are assigned to that category and then to the sKUs themselves.
reflected realistically in assignments and reassignments. modeling such complexity in a relational data structure inevitably leads to compromise and, subsequently, inaccuracy. Transactional costing models that rely solely on a relational data structure must raise the question: why calculate the profitability of masses of individual records using costs that are certainly not as accurate as they could be? In this case, a multi-dimensional approach is by far the more accurate option.
Modeling Complexity Through Multidimensional Analysis
activity-based costing itself is inherent-ly multidimensional. you can incur expenses in multiple currencies and multiple time periods, and a single activity can occur in multiple responsi-bility centers. In addition, some respon-sibility centers, such as IT and hr, pro-vide shared services consumed by other responsibility centers. so if cost-ing is to be accurate, this should be
18 SAP Thought Leadership – customer, product, and channel profitability analysis

By separating out the detailed volume records from these groups, or attri-butes, and using this level of detail for the actual cost assignments, the cost-ing model itself is kept relatively small and efficient. once you have calculated the unit rates for these attributes by activity, responsibility center, version, and period, they can be linked back to the transaction volume records for the final-step calculation in the relational environment.
In the multidimensional environment, where you can view individual records through a standard model-builder inter-face and perform detailed costing, the individual attributes are summed and used to calculate activity-unit rates. figure 2 shows the model builder view of the cost-modeling engine in sap Businessobjects profitability and cost management, illustrating how it is possible to view the individual members of the dimension “detailed customers” together with attributes.
each record already has multiple attri-butes held against it in the data ware-house. If other attributes are required for the cost and profitability calculation, they need to be extracted from the sys-tem of record and tagged against it.
These individual records are then imported into a data table held in a relational structure. a model builder can view and maintain this list in the new detailed cost-objects dimension.
Figure 2: Model Builder in SAP® BusinessObjects™ Profitability and Cost Management
19SAP Thought Leadership – customer, product, and channel profitability analysis

unwieldy. cost modeling can be as complex and sophisticated as required, using a multidimensional approach, while the final calculation step may be performed in a faster and more efficient relational environment. This offers an optimal approach to the transactional activity-based costing-model design, reducing the need for compromises that would be required with either multidi-mensional or relational approaches alone.
Businessobjects profitability and cost management makes optimal use of mul-tidimensional and relational data structures.
Benefits of the Dual Approach
Where transaction-level costing is required to support business profit-ability information needs, the benefit of combining relational and multidimen-sional costing structures means that the costing model never becomes
The final costing stepsonce calculated, the unit rates, which are dimensioned by responsibility cen-ter, version, and period, are visually tagged to the corresponding attribute. The final steps of the costing exercise – that is, multiplying the unit rate by the driver volume held against the individual record and then totaling up the costs against each – are done in the relational database environment. figure 3 shows the flow of data in a transaction costing model and demonstrates how sap
Figure 3: Data Structures in SAP BusinessObjects Profitability and Cost ManagementWeb-based
data entry
multiple model
builders
full trace-back
on-demand query and
what-if analysis
end users
solutions from the sap®
Businessobjects™ portfolio
Best-of-breed multidimensional costing
relational technology for the volumes
Xdriver volumes by costing
attributes
Unit rates – or cost per resourced
minute
Transactional data
account, sKU, sales
order line
detailed cost-object dimension
multidimen-sional cost modeling
Bulk data load
attributes for
costing
data ware- house
20 SAP Thought Leadership – customer, product, and channel profitability analysis

tion and retention costs. It also fails to recognize that a customer’s potential for profit varies with its life stage. It may be more appropriate to include revenue as the net present value of a customer’s estimated lifetime value.
In the past, the majority of activity-based costing models focused on the analysis of historical costs. While this has brought great insight into profitabili-ty, organizations are beginning to rec-ognize the additional value to be found by applying activity-based costing prin-ciples to future periods. This aids stra-tegic decision making and enables organizations to carry out what-if analyses.
There are no right or wrong answers to the questions that need to be resolved. appropriate responses depend on the types of questions your organization sets out to answer when pursuing a profitability project.
are increasingly choosing to service their account via a mix of channels, what is the most appropriate methodol-ogy for allocating revenue among chan-nels? for instance, many account hold-ers never visit the bank branch where they initially opened their account, and it may be inappropriate to automatically allocate revenue to the channel where the customer relationship was estab-lished. now that multichannel service delivery is the norm, it may be more appropriate to completely separate customers and the branch or channel at which the relationship began and to implement a transfer pricing mecha-nism. This way, branch, channel, and customer profitability can still be mea-sured and can still provide reliable data for decision making.
In terms of time, looking at current-year revenues and current-year costs gener-ates a number of potentially unfathom-able issues about how to treat acquisi-
a key component of activity-based costing modeling is to show how activi-ties and their associated costs and revenues relate to dimensions such as customers, channels, and products. once activity costs are calculated, they can be computed with driver volumes to yield the costs and profitability of the various dimensions – customers, prod-ucts, and channels. But in many organi-zations, there is typically little channel-specific management information to use as driver volumes and, inevitably, there are always questions to be resolved. • What constitutes a channel? do such things such as aTms and
the Internet constitute distribution channels, or should they be treated simply as service delivery mechanisms?
• What constitutes revenue? dealing with fee- and commission-
based products is easy, but financial service providers need to integrate information about the transfer price of funds and the cost of risk (for example, loan loss provisions and reserves and risk-adjusted cost of equity) when attributing revenue to products, customers, and channels.
once you have determined what con-stitutes a channel and revenue, you next have to consider how you allocate revenue to channels. When customers
taCkling other issues in Cost and Profitability analysisaLLocaTIng revenUe To approprIaTe channeLs
prior to the adoption of activity-based costing, a common approach to calculating customer profitability was the top-down approach. This simply involved apportioning general ledger line items to products or customers using specific metrics, such as the total number of accounts or other operational drivers, such as the number of transactions.
21SAP Thought Leadership – customer, product, and channel profitability analysis
• The chosen costing methodology must be appropriate to the specific activity in the specific department.
• companies should ensure that the methodology in their chosen soft-ware application uses a single-step multidimensional allocation of activity costs to cost objects.
• cost and profitability projects raise a number of issues, not the least of which is the allocation of revenues to channels. however, if the project team focuses on the deliverables and business decisions the project is seeking to support, such matters can be resolved more easily.
only when organizations tackle the issue of accurate profitability measure-ment can they finally have the single view of their customers that they need to make critical and well-informed stra-tegic management decisions.
believe they are viewing accurate cus-tomer information, many, in fact, are being misguided by their profitability figures and are making inaccurate or inappropriate management decisions.
This paper provides the following guid-ance and advice to organizations that are considering developing or imple-menting solutions that are able to inform decision making across the organization:• To be reliable, profitability measure-
ment must be based on activity-based costing methodology.
• analysis of only one dimension of profitability, such as customer profit-ability, does not provide adequate insight for decision making.
• companies need to ensure that their costing initiative fits into existing data schema. In many cases, this means costing individual transactions and individual customers.
despite the significant time and effort spent by organizations in building a single view of customers, few have
really tackled the issue of accurate profitability reporting based on an activity-centric costing approach. The effect of this is that while organizations
your next stePsroBUsT sofTWare soLUTIons for accUraTe and reLIaBLe cosTIng
only when organizations tackle the issue of accurate profitability measurement can they finally have the single view of their cus-tomers that they need to make critical and well- informed strategic man-agement decisions.
22 SAP Thought Leadership – customer, product, and channel profitability analysis
Businessobjects business intelligence solutions; and sap Businessobjects information management solutions. as a result you can maximize business profitability, manage risk and compli-ance, and optimize corporate systems, people, and processes.
For More Information
for more information about how solu-tions from the sap Businessobjects portfolio can improve your financial per-formance, call your sap representative today or visit us on the Web at www.sap.com/sapbusinessobjects /profitability_and_cost_management.
sap Businessobjects profitability and cost management is part of the sap Businessobjects enterprise perfor-mance management solutions – a com-prehensive set of solutions that can help your company capitalize on the value of its existing data assets. With these solutions, your organization becomes more agile, gaining organiza-tional alignment, visibility, and greater confidence that give you optimal con-trol and competitive advantage.
These solutions can integrate with sap Business suite applications; sap Businessobjects governance, risk, and compliance solutions; sap
solutions for enterPrise PerformanCe managementcomprehensIve fUncTIonaLITy To Improve effecTIveness
Before selecting a software vendor, it is important to establish the level of granu-larity you need. If customer profitability is one of the key deliverables of the initiative, there are a number of rea-sons why you should con-sider transactional activity-based costing – that is, costing each sales order line or transaction.
23SAP Thought Leadership – customer, product, and channel profitability analysis

www.sap.com/contactsap
50 091 270 (09/05) ©2009 by sap ag. all rights reserved. sap, r/3, sap netWeaver, duet, partneredge, Bydesign, sap Business Bydesign, and other sap products and services mentioned herein as well as their respective logos are trademarks or registered trademarks of sap ag in germany and other countries.
Business objects and the Business objects logo, Businessobjects, crystal reports, crystal decisions, Web Intelligence, xcelsius, and other Business objects products and services mentioned herein as well as their respective logos are trademarks or registered trademarks of Business objects s.a. in the United states and in other countries. Business objects is an sap company.
all other product and service names mentioned are the trademarks of their respective companies. data contained in this document serves informational purposes only. national product specifications may vary.
These materials are subject to change without notice. These materials are provided by sap ag and its affiliated companies (“sap group”) for informational purposes only, without representation or warranty of any kind, and sap group shall not be liable for errors or omissions with respect to the materials. The only warranties for sap group products and services are those that are set forth in the express warranty statements accompanying such products and services, if any. nothing herein should be construed as constituting an additional warranty.