customer satisfaction index july 2006
DESCRIPTION
Customer Satisfaction Index July 2006. RESULTS. Introduction This report presents the results for the Customer Satisfaction Index survey undertaken in July 2006. The objectives of the research were: For importance , find out customers’ requirements and their relative importance - PowerPoint PPT PresentationTRANSCRIPT
Customer Satisfaction IndexJuly 2006
RESULTS

IntroductionThis report presents the results for the Customer Satisfaction Index survey undertaken in July 2006.
The objectives of the research were:
• For importance, find out customers’ requirements and their relative importance
• For satisfaction, find out our customers’ perception of our performance
• To create Priorities for Improvement (to deliver resident satisfaction and build loyalty organisations must match their performance with residents’ priorities and these PFIs are an indication of whether this is happening or not). Therefore, PFIs are extremely useful in deciding where best to focus resources on making the improvements that will contribute most to increasing resident satisfaction.
• To create a Satisfaction Index (an overall measure of customer satisfaction which can be monitored over time)
A standard satisfaction survey just measures residents’ satisfaction with the services an organisation provides. However, a Satisfaction Index survey measures whether it is ‘doing best what matters most to their residents’.

Methodology
The first survey of this kind for all public-facing services was undertaken in 2002. By building on this and to establish how important or unimportant chosen topic areas were to residents in 2006, two focus groups were held. Each group lasted for a duration of two hours and were held in Stratford-upon-Avon and Southam. The first part of the discussion looked at the attendees’ feelings of satisfaction and dissatisfaction with the council in various subject areas. The second part of the discussions concentrated on the relative importance of each of the topic areas to those individuals. It must be recognised that all the topics within the survey are important and in their own right should be priorities for the Council. However, the survey gives the Council a way of ranking these priorities and it is these which the Council must look to improve. In this instance, a 10 point scale has been recommended as good practice.
A questionnaire was sent to 5000 randomly selected residents off the electoral role. 897 questionnaires were returned in the timeframe allowed (5 were undelivered). A response rate of 18% was achieved. For the comparatively long length of questionnaire, this is an expected response. According to specialists in this field, a return of 15-20% is the norm for this sort of research. On an observed statistic of 50%, the standard error of +/-3% was achieved in this survey.

Summary of Findings (I)
The following are based on all respondents: -
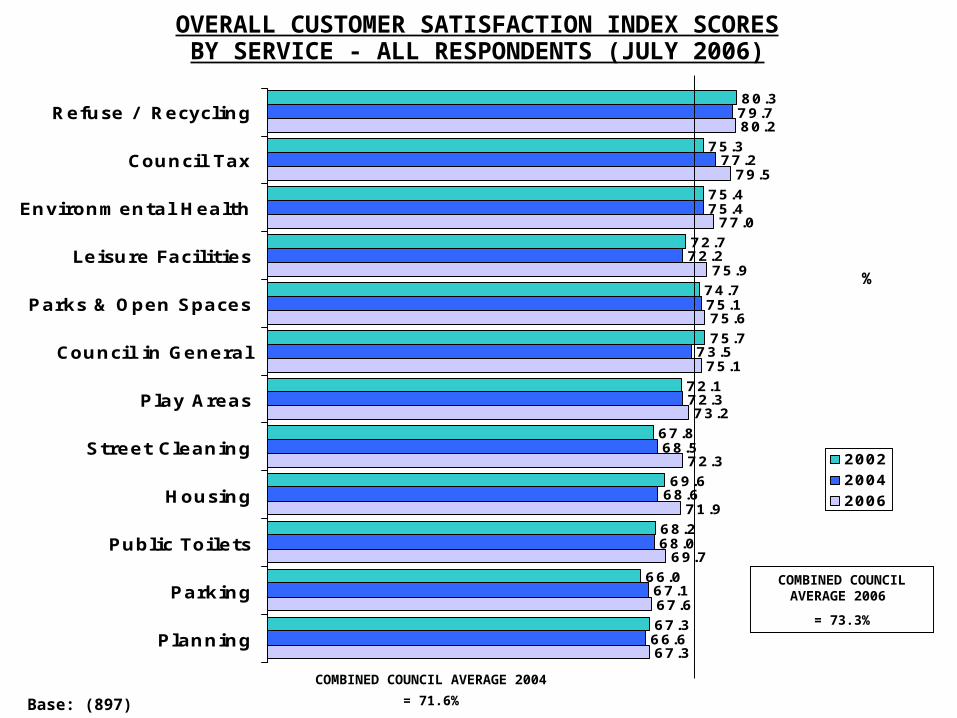
The overall satisfaction score for all Council services is 73.3%, an increase of 1.7% on
2004.
The highest rated score for a service is 80.2% - refuse and recycling. The lowest rated
services are planning (67.3%) and parking (67.6%).
Three services have improved their CSI score by more than 3% compared with the last
survey – street cleaning, leisure facilities and housing. No service score went down
compared with 2004.
Compared against all 97 requirements used, the five highest scoring were: the friendliness
of refuse collectors; opening times of SDC offices; the helpfulness of refuse collectors; the
provision of green wheelie bins; and the variety of equipment available in play areas.
The lowest scoring, which are the top priorities for improvement were: the cost of car
parking; being consulted on the District’s planning policies; the building of schools, roads,
etc in line with housing developments; the amount of information the Council provides on
the future development of the District; and the availability of affordable housing across the
District.

Summary of Findings (II)
The following are based on users of a service: -
The overall satisfaction score for users of Council services is 70.9%, a 2% increase on
2004.
For every service, the CSI score for users of a service in the last two years is lower
compared with the scores of all respondents. For example, the planning score for all
respondents is 67%, but this falls to 64% for those who have used the service.
Compared with 2004, the satisfaction of residents rose by 5% for those who had used
the Housing service and used the Council’s leisure facilities. Those contacting Council
Tax were more satisfied, with their CSI score increasing 2.5%. All services saw an
increase in their user CSI score, except for a negligible decrease of 0.1% in
Environmental Health.
The highest rated service aspects for users were the opening times of SDC offices,
feeling safe using SDC’s leisure facilities, the information provided on SDC’s leisure
facilities and events, and the variety of equipment available at play areas.
The lowest rated aspects for users were the cost of car parking, the availability of
affordable housing across the District, being consulted on the Districts planning policies
and the building of schools etc in line with housing development.

Summary of Findings (III)
The following summarises the best and worst aspects for each service surveyed (these are
the same for both “all respondents” and “users”, except for the following: Best aspect for
leisure facilities users was “feeling safe using the facilities” and the worst aspect for council
tax users was the “accuracy of council tax billing”): -
Service Best Aspect Worst Aspect The Council in General
Opening times of SDC offices Returning telephone calls
Council Tax Being able to contact the relevant person
Keeping promises and commitments
Environmental Health Pest control in your locality Noise control within your locality
Housing Professionalism of housing staff
Availability of affordable housing across the district
Leisure Facilities Information provided on SDC facilities/events
Cleanliness of leisure facilities
Parking Provision of Park & Ride in the District
Cost of car parking
Parks & Open Spaces Clean & tidy appearance of parks & gardens
Personal safety in Stratford parks
Planning Professionalism of planning staff
Being consulted on the Districts planning policies
Play Areas Variety of equipment available in play areas
Free of dogs / dog mess
Public Toilets Lighting in public toilets
Number of public toilets
Refuse Collection / Recycling
Friendliness of refuse collectors
Range of items allowed for recycling
Street Cleaning Removal of abandoned cars Keeping the streets free from dog fouling

Summary of Findings (IV)
The overall mean score for satisfaction with Council services in 2006 is 6.62, 0.13 higher
than that achieved in 2004.
More residents agree that the Council offers value for money in 2006 than it did in 2004.
In 2004, the mean score was 5.47 out of 10; in 2006 it had risen to 5.68.
Respondents were asked to make additional comments. The top three mentions are the
need for more recycling facilities / better recycling (23%), the need to provide more
wheelie bins and refuse bags (15%), and one in ten made comments that car park fees
were too high. 9% asked to see a review of council tax bandings.
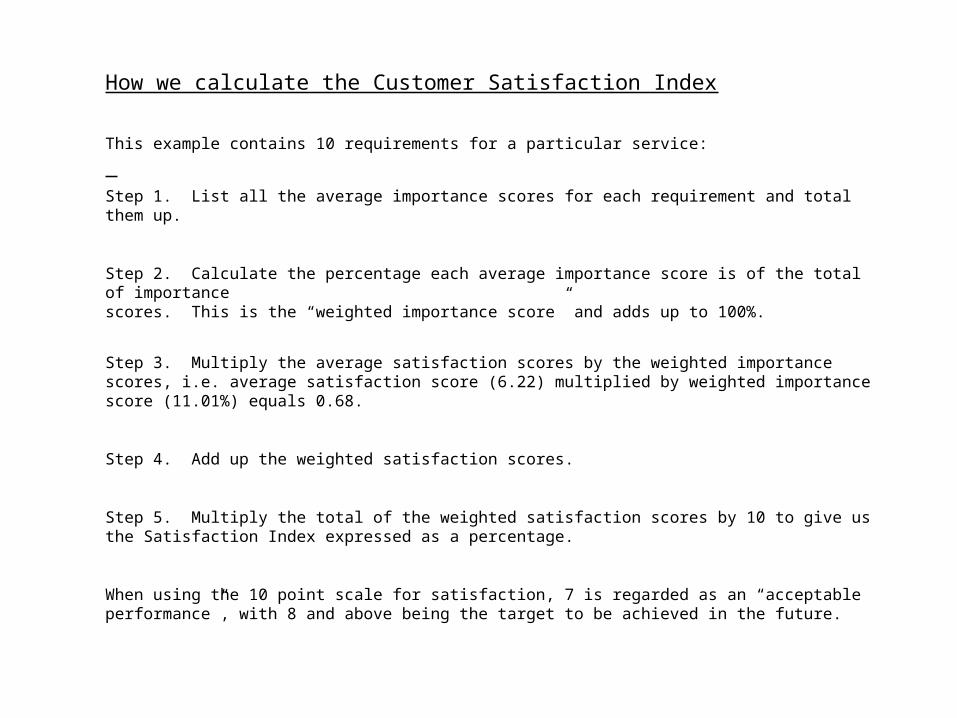
How we calculate the Customer Satisfaction Index
This example contains 10 requirements for a particular service:
Step 1. List all the average importance scores for each requirement and total them up.
Step 2. Calculate the percentage each average importance score is of the total of importancescores. This is the “weighted importance score” and adds up to 100%.
Step 3. Multiply the average satisfaction scores by the weighted importance scores, i.e. average satisfaction score (6.22) multiplied by weighted importance score (11.01%) equals 0.68.
Step 4. Add up the weighted satisfaction scores.
Step 5. Multiply the total of the weighted satisfaction scores by 10 to give us the Satisfaction Index expressed as a percentage.
When using the 10 point scale for satisfaction, 7 is regarded as an “acceptable performance”, with 8 and above being the target to be achieved in the future.

Overall ResultsFor Each Service

71.8
71.6
73.3
2002
2004
2006
OVERALL CUSTOMER SATISFACTION INDEX SCORESCOMBINED COUNCIL AVERAGE - ALL RESPONDENTS (02-06)
%
80.3
75.3
75.4
72.7
74.7
75.7
72.1
67.8
69.6
68.2
66.0
67.3
79.7
77.2
75.4
72.2
75.1
73.5
72.3
68.5
68.6
68.0
67.1
66.6
80.2
79.5
77.0
75.9
75.6
75.1
73.2
72.3
71.9
69.7
67.6
67.3
Refuse / Recycling
Council Tax
Environmental Health
Leisure Facilities
Parks & Open Spaces
Council in General
Play Areas
Street Cleaning
Housing
Public Toilets
Parking
Planning
200220042006
OVERALL CUSTOMER SATISFACTION INDEX SCORESBY SERVICE - ALL RESPONDENTS (JULY 2006)
Base: (897)
COMBINED COUNCIL AVERAGE 2006
= 73.3%
COMBINED COUNCIL AVERAGE 2004
= 71.6%
%

1.6
3.8
3.7
3.3
2.3
1.7
0.9
0.7
0.5
0.5
0.4
1.6
Street Cleaning
Leisure Facilities
Housing
Council Tax
Public Toilets
Council in General
Environmental Health
Play Areas
Planning
Parking
Refuse / Recycling
Parks & Open Spaces
%
SERVICE COMPARISON OF 2006 CSI SCORE VS 2004 CSI SCOREALL RESPONDENTS (difference in % score)

68.7
68.9
70.9
2002
2004
2006
OVERALL CUSTOMER SATISFACTION INDEX SCORESCOMBINED COUNCIL AVERAGE - USERS (02-06)
%

70.6
71.0
75.7
70.2
72.6
65.3
67.5
65.8
64.8
75.9
69.9
72.3
71.1
72.4
66.2
67.7
67.0
63.3
78.4
74.5
74.1
72.8
72.3
71.2
69.4
67.4
64.3
Council Tax
Leisure Facilities
Council in General
Play Areas
Environmental Health
Housing
Public Toilets
Parking
Planning
200220042006
OVERALL CUSTOMER SATISFACTION INDEX SCORESBY SERVICE - USERS (JULY 2006)
Base: (693)
COMBINED COUNCIL AVERAGE 2006
= 70.9%
COMBINED COUNCIL AVERAGE 2004
= 68.9%
%

1.7
1.0
-0.1
0.4
1.7
1.8
2.5
4.6
5.0Housing
Leisure Facilities
Council Tax
Council in General
Play Areas
Public Toilets
Planning
Parking
Environmental Health
%
SERVICE COMPARISON OF 2006 CSI SCORE VS 2004 CSI SCOREUSERS (difference in % score)

Individual ResultsBy Service
(All Respondents)
The results for each service requirement are shown with the worst score first and the best score last. This creates our
“Priorities for Improvement”.

T O P 1 0 M O S T I M P O R T A N T I N D I V I D U A L P R I O R I T I E S
A C R O S S A L L S E R V I C E S 2 0 0 6
( A L L R E S P O N D E N T S )
9 .3 0
9 .2 3
9 .1 9
9 .1 8
9 .1 6
9 .1 2
9 .0 8
9 .0 4
9 .0 3
9 .0 3
9 .0 3
4 5 6 7 8 9 1 0
R e g u la r w e e k ly re fu s e c o lle c t io n s
A c c u ra c y o f c o u n c il t a x b illin g
K e e p in g p ro m is e s a n d c o m m it m e n t s in g e n e ra l
K e e p in g p ro m is e s a n d c o m m it m e n t s in C o u n c il T a x
N o t le a v in g a m e s s a ft e r re fu s e c o lle c t io n
R e t u rn in g t e le p h o n e c a lls in C o u n c il T a x
F re e o f d o g s / d o g s m e s s in p la y a re a s
C le a n lin e s s & c o n d it io n o f p u b lic t o ile t s
K e e p in g p ro m is e s a n d c o m m it m e n t s in P la n n in g
S a fe t y a n d s e c u r it y o f c a r p a rk s
O p e n in g t im e s o f S D C o ffi c e s
M e a n S c o re

T O P 1 0 L E A S T I M P O R T A N T I N D I V I D U A L P R I O R I T I E S
7 .4 3
7 .5 1
7 .6 9
7 .7 9
7 .8 8
7 .9 6
7 .9 6
8 .1 6
8 .1 9
8 .2 0
4 5 6 7 8 9 1 0
P ro v is io n o f P a rk & R id e in t h e D is t r ic t
O p e n in g t im e s o f S D C o ffi c e s
V a r ie t y o f e q u ip m e n t a v a ila b le in p la y a re a s
F r ie n d lin e s s o f re fu s e c o lle c t o rs
I n fo rm a t io n p ro v id e d o n S D C fa c ilit ie s
A m o u n t o f s e a t in g a v a ila b le in p a rk s a n d o p e n s p a c e s
A d e q u a t e p ro v is io n o f p la y a re a s a c ro s s D is t r ic t
N o s o f p a rk in g s p a c e s a llo c a t e d fo r d is a b le d p e o p le &p e o p le w it h c h ild re n
A v a ila b ilit y o f a ff o rd a b le h o u s in g a c ro s s D is t r ic t
B e in g a b le t o c o n t a c t re le v a n t p e rs o n w it h in h o u s in g
M e a n S c o re
ACROSS ALL SERVICES 2006
(ALL RESPONDENTS)

T O P 1 0 P R I O R I T I E S R E S I D E N T S S A T I S F I E D W I T H -
A C R O S S A L L S E R V I C E S 2 0 0 6
( A L L R E S P O N D E N T S )
8 .8 5
8 .5 5
8 .2 5
8 .2 0
8 .2 0
8 .1 1
8 .0 9
8 .0 8
8 .0 2
8 .0 2
4 5 6 7 8 9 1 0
R e g u la r w e e k ly re fu s e c o lle c t io n s
P ro v is io n o f g re e n w h e e lie b in s
F r ie n d lin e s s o f re fu s e c o lle c t o rs
H e lp fu ln e s s o f re fu s e c o lle c t o rs
F e e lin g s a fe u s in g le is u re fa c ilit ie s
F o o d s a fe t y in lo c a l p re m is e s
A c c u ra c y o f c o u n c il t a x b illin g
N o t le a v in g a m e s s a ft e r re fu s e c o lle c t io n
B e in g a b le t o c o n t a c t t h e re le v a n t p e rs o n in c o u n c il t a xc o lle c t io n
K e e p in g p ro m is e s & c o m m it m e n t s
M e a n S c o re

T O P 1 0 P R I O R I T I E S R E S I D E N T S L E A S T S A T I S F I E D W I T H -
A C R O S S A L L S E R V I C E S 2 0 0 6
( A L L R E S P O N D E N T S )
5 .4 5
5 .7 7
6 .1 4
6 .1 4
6 .1 7
6 .2 5
6 .2 8
6 .5 6
6 .5 9
6 .5 9
4 5 6 7 8 9 1 0
C o s t o f c a r p a rk in g
B e in g c o n s u lt e d o n t h e D is t r ic t 's p la n n in g p o lic ie s
A v a ila b lilit y o f a ff o rd a b le h o u s in g a c ro s s D is t r ic t
A m o u n t o f C o u n c il fe e d b a c k o n fu t u re d e v e lo p m e n t o fD is t r ic t
N u m b e r o f p u b lic t o ile t s a v a ila b le in D is t r ic t
B u ild in g o f s c h o o ls e t c in lin e w it h d e v e lo p m e n t
A m o u n t o f c a r p a rk in g in t h e t o w n c e n t re s
B e in g k e p t in fo rm e d o n a re g u la r b a s is a b o u t p la n n in ga p p lic a t io n
N u m b e r o f s p a c e s a llo c a t e d fo r d is a b le d p e o p le &p e o p le w it h c h ild re n
P ro v is io n o f P a rk & R id e in D is t r ic t
M e a n S c o re

C U S T O M E R S A T I S F A C T I O N I N D E X : I M P O R T A N C E V S S A T I S F A C T I O NT H E C O U N C I L I N G E N E R A L - A L L R E S P O N D E N T S
( J U L Y 2 0 0 6 )
9 .1 9
9 .0 0
8 .7 8
8 .8 9
8 .7 2
8 .6 7
8 .6 8
8 .7 8
8 .5 3
7 .5 1
7 .4 0
7 .2 7
7 .2 2
7 .4 3
7 .4 8
7 .6 4
7 .7 1
7 .8 4
7 .6 5
7 .4 6
4 5 6 7 8 9 1 0
K e e p in g p ro m is e s a n dc o m m it m e n t s
R e t u rn in g t e le p h o n ec a lls / re s p o n d in g t o e - m a ils
E x p la n a t io n o f a d e c is io nm a d e
P ro v is io n o f a n a n s w e r t oy o u r p ro b le m
P ro v id in g a p ro m p tre s p o n s e t o e n q u ir ie s
K n o w le d g e o f s t a ff
P ro fe s s io n a lis m o f s t a ff
B e in g p u t t h ro u g h t o t h ec o r re c t d e p a r t m e n t
B e in g a b le t o c o n t a c t t h ere le v a n t p e rs o n
O p e n in g t im e s o f S D Co ffi c e s
M e a n S c o re
I m p o rt a n c e S a t is fa c t io n
B A S E : ( S e e A p p e n d ix )
CSI Score for Council in General = 75.1%

C U S T O M E R S A T I S F A C T I O N I N D E X : I M P O R T A N C E V S S A T I S F A C T I O NC O U N C I L T A X - A L L R E S P O N D E N T S
( J U L Y 2 0 0 6 )
9 .1 2
9 .1 8
9 .2 3
8 .9 9
8 .8 6
8 .7 7
8 .8 3
8 .8 8
7 .9 5
8 .0 2
8 .0 9
7 .9 2
7 .8 4
7 .8 6
7 .9 3
8 .0 2
4 5 6 7 8 9 1 0
R e tu r n in g te le p h o n e c a lls
K e e p in g p r o m is e s &c o m m itm e n ts
A c c u r a c y o f c o u n c il ta xb ilin g
P r o v is io n o f a n a n s w e r toy o u r p r o b le m
E x p la n a tio n o f a d e c is io nm a d e
K n o w le d g e o f s ta ff
P r o f e s s io n a lis m o f s ta ff
B e in g a b le to c o n ta c t th er e le v a n t p e r s o n
M e a n S c o r e
I m p o r ta n c e S a tis f a c t io nB A S E : ( S e e A p p e n d ix )
CSI Score for Council Tax = 79.5%

C U S T O M E R S A T I SFA CT I O N I N D E X : I M P O R T A N CE V S S A T I SFA C T I O NE N V I R O N M E N T A L H E A LT H – A L L R E S P O N D E N T S
( J U LY 2 0 0 6 )
8 .6 2
8 .9 4
8 .6 1
9 .0 0
8 .7 7
7 .2 6
7 .7 3
7 .4 5
8 .1 1
7 .9 5
4 5 6 7 8 9 1 0
N o ise co n tr o l w ith in y o u rlo ca lity
C o n tro llin g o f h e a lths ta n d a r d s in p u b lic a r e a s
A tm o sp h e r ic p o llu tio nco n tr o l w ith in y o u r
lo ca lity
Fo o d sa fe ty in lo ca lp r e m ise s
P e s t co n tr o l in y o u rlo ca lity
M e a n S co r e
I m p o rta n c e S a t is fa c t io n
B A S E : ( S ee A pp en d ix )CSI Score for Environmental
Health= 77.0%

C U S T O M E R S A T I S F A C T I O N I N D E X : I M P O R T A N C E V S S A T I S F A C T I O NH O U S I N G - A L L R E S P O N D E N T S
( J U L Y 2 0 0 6 )
8 .1 9
8 .5 1
8 .5 1
8 .2 0
8 .2 5
8 .2 1
8 .2 2
8 .2 4
5 .7 7
7 .3 0
7 .5 4
7 .3 0
7 .3 9
7 .3 8
7 .4 0
7 .4 3
4 5 6 7 8 9 1 0
A v a ila b ilit y o f a ff o rd a b leh o u s in g a c ro s s D is t r ic t
K e e p in g p ro m is e s &c o m m it m e n t s
R e t u rn in g y o u r t e le p h o n ec a lls
B e in g a b le t o c o n t a c t t h ere le v a n t p e rs o n w it h in
h o u s in g
P ro v is io n o f a n a n s w e r t oy o u r p ro b le m
E x p la n a t io n o f a d e c is io nm a d e
K n o w le d g e o f h o u s in g s t a ff
P ro fe s s io n a lis m o f h o u s in gs t a ff
M e a n S c o re
I m p o r t a n c e S a t is fa c t io nB A S E : ( S e e A p p e n d ix )
CSI Score for Housing= 71.9%
C U S T O M E R S A T I S F A C T I O N I N D E X : I M P O R T A N C E V S S A T I S F A C T I O NL E I S U R E F A C I L I T I E S - A L L R E S P O N D E N T S
( J U L Y 2 0 0 6 )
8 .7 3
8 .6 4
8 .7 0
8 .2 9
8 .3 0
8 .5 6
8 .3 5
8 .7 8
8 .2 3
7 .8 8
7 .2 6
7 .2 5
7 .5 3
7 .4 0
7 .4 8
7 .7 9
7 .7 4
8 .2 0
7 .7 6
7 .4 5
4 5 6 7 8 9 1 0
C le a n lin e s s o f le is u refa c ilit ie s
V a lu e fo r m o n e y
M a in t e n a n c e o ffa c ilit ie s / e q u ip m e n t
S u it a b ilit y o f le is u refa c ilit ie s fo r d iff e re n t a g e s
A v a ila b ilit y lo c a lly o fle is u re fa c ilit ie s
P ro p e r ly q u a lifi e d s t a ff a tle is u re fa c ilit ie s
H e lp fu ln e s s o f s t a ff
F e e lin g s a fe u s in g t h efa c ilit ie s
F r ie n d lin e s s o f s t a ff
I n fo rm a t io n p ro v id e d o nS D C fa c ilit ie s / e v e n t s
M e a n S c o re
I m p o r t a n c e S a t is fa c t io n
B A S E : ( S e e A p p e n d ix )
CSI Score for Leisure Facilities= 75.9%

C U S T O M E R S A T I S F A C T I O N I N D E X : I M P O R T A N C E V S S A T I S F A C T I O NP A R K I N G - A L L R E S P O N D E N T S
( J U L Y 2 0 0 6 )
8 .9 6
8 .6 6
8 .4 8
8 .5 5
8 .1 6
9 .0 3
8 .8 4
8 .3 9
7 .4 3
5 .4 5
6 .2 5
6 .5 6
6 .6 8
6 .5 9
7 .6 9
7 .6 1
7 .3 5
6 .5 9
4 5 6 7 8 9 1 0
C o s t o f c a r p a rk in g
A m o u n t o f c a r p a rk in g in th e to w n c e n tre
F re e p a rk in g in c o u n c il c a r p a rks o u ts id e S tra t fo rd -u p o n - A v o n
U n d e rs ta n d in g p a rk in g ru le s & c h a rg e s
N o s . o f s p a c e s s u ita b le fo r d is a b le d p e o p le / p e o p lew ith c h ild re n
S a fe ty & s e c u rity o f c a r p a rks
L ig h t in g o f c a r p a rks
Ro a d s ig n s d ire c t in g y o u to c a r p a rks
P ro v is io n o f P a rk & R id e in th e D is t r ic t
M e a n S c o re
I m p o rta n c e S a t is fa c t io n
B A S E : ( S e e A p p e n d ix )CSI Score for Parking= 67.6%

C U S T O M E R S A T I S F A C T I O N I N D E X : I M P O R T A N C E V S S A T I S F A C T I O NP A R K S & O P E N S P A C E S - A L L R E S P O N D E N T S
( J U L Y 2 0 0 6 )
8 .8 5
8 .5 0
7 .9 6
8 .6 7
7 .6 9
7 .3 6
7 .2 2
7 .9 5
4 5 6 7 8 9 1 0
P e rs o n a l s a fe t y inS t ra t fo rd 's p a rk s
P ro v is io n o f t h e s a m e le v e lo f s e rv ic e a c ro s s t h e
D is t r ic t
A m o u n t o f s e a t in ga v a ila b le
C le a n & t id y a p p e a ra n c e o fp a rk s & g a rd e n s
M e a n S c o re
I m p o rt a n c e S a t is fa c t io n
B A S E : ( S e e A p p e n d ix )
CSI Score for Parks & Open Spaces= 75.6%

CUSTOMER SATI SFACTI ON I NDEX: I MPORTANCE VS SATI SFACTIONPLANNI NG – ALL RESPONDENTS
(J ULY 2006)
8.41
8.63
8.57
8.45
9.03
8.67
8.99
8.75
8.46
8.81
8.75
8.59
8.59
8.59
8.75
8.72
5.77
6.17
6.14
6.28
6.97
6.63
7.00
6.82
6.60
7.01
6.99
6.89
6.90
7.04
7.21
7.24
4 5 6 7 8 9 10
Being consulted on the District's planning policies
Building of schools etc in line with housing development
Amount of Council information on future development of District
Being kept informed on a regular basis about application
Keeping promises and commitments
Any objections made to a planning application are considered
Returning your telephone calls
Explanation of decision made
Time taken to make a decision about a planning application
Provision of answer to your problem
Being able to contact relevant person within planning dept
Accessibility of planning staff
Providing a quick response to enquiries
Receiving advice & information from planning staff
Knowledge planning staff
Professionalism of planning staff
Mean Score
Importance Satisfaction
BASE: (See Ap p endix)
CSI Score for Planning= 67.3%

C U S T O M E R S A T I S F A C T I O N I N D E X : I M P O R T A N C E V S S A T I S F A C T I O NP L A Y A R E A S – A L L R E S P O N D E N T S
( J U L Y 2 0 0 6 )
9 .0 8
8 .8 4
8 .8 3
7 .9 6
7 .6 9
7 .3 2
7 .3 4
7 .6 5
6 .8 7
7 .4
4 5 6 7 8 9 1 0
F re e o f d o g s / d o g m e s s
C le a n lin e s s & c o n d it io n o fp la y a re a s / e q u ip m e n t
S a fe ty & s e c u rity o f p la ya re a s / e q u ip m e n t
A d e q u a te p ro v is io n o f p la ya re a s a c ro s s th e D is tr ic t
V a rie ty o f e q u ip m e n ta v a ila b le in p la y a re a s
M e a n S c o re
I m p o rta n c e S a t is fa c t io nB A S E : ( S e e A p p e n d ix )CSI Score for Play Areas=
73.2%

C U S T O M E R S A T I S F A C T I O N I N D E X : I M P O R T A N C E V S S A T I S F A C T I O NP U B L I C T O I L E T S – A L L R E S P O N D E N T S
( J U L Y 2 0 0 6 )
8 .5 0
8 .8 7
9 .0 4
8 .9 9
8 .3 4
8 .3 8
8 .9 2
6 .1 4
7 .0 0
7 .3 5
7 .3 2
6 .6 9
6 .7 5
7 .4 7
4 5 6 7 8 9 1 0
N u m b e r o f p u b lic to ile tsa v a ila b le in D is tr ic t
S u ffi c ie n t a m o u n t o f to ile tro lls / s o a p e tc
C le a n lin e s s & c o n d it io n o fp u b lic to ile ts
F e e lin g s a fe u s in g p u b licto ile ts
L o c a t io n o f p u b lic to ile ts
O p e n in g t im e s o f p u b licto ile ts
L ig h t in g in p u b lic to ile ts
M e a n S c o re
I m p o rta n c e S a t is fa c t io n
B A S E : ( S e e A p p e n d ix )
CSI Score for Public Toilets= 69.7%

C U S T O M E R S A T I S F A C T I O N I N D E X : I M P O R T A N C E V S S A T I S F A C T I O NR E F U S E C O L L E C T I O N / R E C Y C L I N G - A L L R E S P O N D E N T S
( J U L Y 2 0 0 6 )
8 .5 3
9 .1 6
8 .4 2
8 .8 7
8 .3 6
9 .3 0
8 .8 0
8 .2 8
7 .7 9
6 .8 0
8 .0 8
7 .8 9
7 .9 5
7 .5 3
8 .8 5
8 .5 5
8 .2 0
8 .2 5
4 5 6 7 8 9 1 0
R a n g e o f it e m s a llo w e d fo rre c y c lin g
N o t le a v in g a m e s s a ft e rc o lle c t io n
U s a b ilit y o f re c y c lin gc o n ta in e rs
P ro v is io n o f b la c k b a g s
P ro v is io n o f c e n t ra lre c y c lin g p o in t s
R e g u la r w e e k ly re fu s ec o lle c t io n s
P ro v is io n o f g re e n w h e e lieb in s
H e lp fu ln e s s o f re fu s ec o lle c t o rs
F r ie n d lin e s s o f re fu s ec o lle c t o rs
M e a n S c o re
I m p o rt a n c e S a t is fa c t io n
B A S E : ( S e e A p p e n d ix )
CSI Score for Refuse/Recycling= 80.2%

C U S T O M E R S A T I S F A C T I O N I N D E X : I M P O R T A N C E V S S A T I S F A C T I O NS T R E E T C L E A N I N G - A L L R E S P O N D E N T S
( J U L Y 2 0 0 6 )
9 .0 0
8 .8 3
8 .8 4
8 .6 2
8 .9 9
8 .8 3
7 .0 2
7 .1 0
7 .1 5
7 .0 4
7 .4 5
7 .6 3
4 5 6 7 8 9 1 0
K e e p in g t h e s t re e t s fre efro m d o g fo u lin g
P ro v is io n o f s a m e le v e l o fs e rv ic e a c ro s s D is t r ic t
R e s p o n d in g q u ic k ly t olit t e r / fl y t ip p in g p ro b le m
N u m b e r o f lit t e r b in sp ro v id e d
K e e p in g t h e s t re e t s fre efro m lit t e r
R e m o v a l o f a b a n d o n e d c a rs
M e a n S c o re
I m p o r t a n c e S a t is fa c t io n
B A S E : ( S e e A p p e n d ix )
CSI Score for Street Cleaning= 72.3%

Individual ResultsBy Service
(Users of a Service in Last 2 Years)

C U S T O M E R S A T I S F A C T I O N I N D E X : I M P O R T A N C E V S S A T I S F A C T I O NT H E C O U N C I L I N G E N E R A L - U S E R S
( J U L Y 2 0 0 6 )
9 .2 4
9 .0 7
8 .8 5
8 .9 8
8 .7 6
8 .7 4
8 .7 0
8 .8 6
8 .6 0
7 .6 0
7 .2 7
7 .1 0
7 .0 7
7 .3 2
7 .3 5
7 .6 0
7 .6 4
7 .7 5
7 .5 9
7 .4 2
4 5 6 7 8 9 1 0
K e e p in g p ro m is e s a n dc o m m it m e n t s
R e t u rn in g t e le p h o n ec a lls / re s p o n d in g t o e - m a ils
E x p la n a t io n o f a d e c is io nm a d e
P ro v is io n o f a n a n s w e r t oy o u r p ro b le m
P ro v id in g a p ro m p tre s p o n s e t o e n q u ir ie s
K n o w le d g e o f s t a ff
P ro fe s s io n a lis m o f s t a ff
B e in g p u t t h ro u g h t o t h ec o r re c t d e p a r t m e n t
B e in g a b le t o c o n t a c t t h ere le v a n t p e rs o n
O p e n in g t im e s o f S D Co ffi c e s
M e a n S c o re
I m p o rt a n c e S a t is fa c t io n
B A S E : ( S e e A p p e n d ix )
CSI Score for Council in General = 74.1%

C U S T O M E R S A T I S F A C T I O N I N D E X : I M P O R T A N C E V S S A T I S F A C T I O NC O U N C I L T A X - U S E R S
( J U L Y 2 0 0 6 )
9 .2 0
9 .1 6
9 .0 5
8 .9 6
8 .7 9
8 .7 6
8 .7 8
8 .8 3
7 .9 1
7 .8 8
7 .7 9
7 .8 4
7 .7 3
7 .7 8
7 .8 3
7 .9 5
4 5 6 7 8 9 1 0
A c c u ra c y o f c o u n c il ta xb illin g
Ke e p in g p ro m is e s &c o m m itm e n ts
Re tu rn in g te le p h o n e c a lls
P ro v is io n o f a n s w e r top ro b le m
E x p la n a t io n o f a d e c is io nm a d e
Kn o w le d g e o f c o u n c il ta xs ta ff
P ro fe s s io n a lis m o f c o u n c ilta x s ta ff
B e in g a b le to c o n ta c t th ere le v a n t p e rs o n
M e a n S c o re
I m p o rta n c e S a t is fa c t io n
B A S E : ( S e e A p p e n d ix )
CSI Score for Council Tax= 78.4%

C U S T O M E R S A T I S FA C T I O N I N D E X : I M P O R T A N C E V S S A T I S FA C T I O NE N V I R O N M E N T A L H E A LT H - U S E R S
( J U LY 2 0 0 6 )
8 .8 1
8 .7 6
9 .0 1
9 .1 1
8 .9 4
6 .4 3
6 .8 1
7 .2 2
7 .8 8
7 .7 7
4 5 6 7 8 9 1 0
No ise co n tro l w ith in yo u rlo ca lity
A tm o sp h er ic p o llu tio nw ith in yo u r lo ca lity
C o n tro llin g o f h ealthstan d ard s in p u b lic areas
Fo o d safety in lo ca lp rem ises
P est co n tro l in yo u rlo ca lity
M ean S co re
I m p o rta n c e Sa tis fa c tio nB A S E : ( S ee A pp end ix ) CSI Score for Environmental Health= 72.3%

C U S T O M E R S A T I S F A C T I O N I N D E X : I M P O R T A N C E V S S A T I S F A C T I O NH O U S I N G - U S E R S
( J U L Y 2 0 0 6 )
9 .0 1
9 .0 9
8 .9 5
9 .0 8
8 .7 9
8 .8 0
8 .7 8
8 .8 5
5 .5 1
7 .1 3
7 .3 0
7 .5 2
7 .2 9
7 .3 2
7 .3 6
7 .5 4
4 5 6 7 8 9 1 0
A v a ila b ilit y o f a ff o rd a b leh o u s in g a c ro s s D is t r ic t
K e e p in g p ro m is e s &c o m m it m e n t s
B e in g a b le t o c o n t a c tre le v a n t p e rs o n w it h in
h o u s in g
R e t u rn in g y o u r t e le p h o n ec a lls
P ro v is io n o f a n a n s w e r t oy o u r p ro b le m
E x p la n a t io n o f d e c is io n m a d e
K n o w le d g e o f h o u s in g s t a ff
P ro fe s s io n a lis m o f h o u s in gs t a ff
M e a n S c o re
I m p o r t a n c e S a t is fa c t io n
B A S E : ( S e e A p p e n d ix )
CSI Score for Housing= 71.2%

C U S T O M E R S A T I S F A C T I O N I N D E X : I M P O R T A N C E V S S A T I S F A C T I O NL E I S U R E F A C I L I T I E S - U S E R S
( J U L Y 2 0 0 6 )
8 .9 1
8 .7 6
8 .9 3
8 .6 6
8 .4 4
8 .7 4
8 .5 9
8 .4 3
8 .0 3
8 .8 2
6 .9 3
7 .0 3
7 .2 5
7 .4 3
7 .2 8
7 .6 7
7 .6 6
7 .7 3
7 .3 4
8 .2 0
4 5 6 7 8 9 1 0
C le a n lin e s s o f le is u refa c ilit ie s
V a lu e fo r m o n e y
M a in te n a n c e o ffa c ilit ie s / e q u ip m e n t
A v a ila b ility lo c a lly o fle is u re fa c ilit ie s
S u ita b ility o f le is u refa c ilit ie s fo r a ll a g e s
P ro p e rly q u a lifi e d s ta ff
H e lp fu ln e s s o f s ta ff
F rie n d lin e s s o f s ta ff
I n fo rm a t io n p ro v id e d o nS D C fa c ilit ie s o r e v e n ts
F e e lin g s a fe u s in g th efa c ilit ie s
M e a n S c o re
I m p o rta n c e S a t is fa c t io n
B A S E : ( S e e A p p e n d ix )
CSI Score for Leisure Facilities= 74.5%
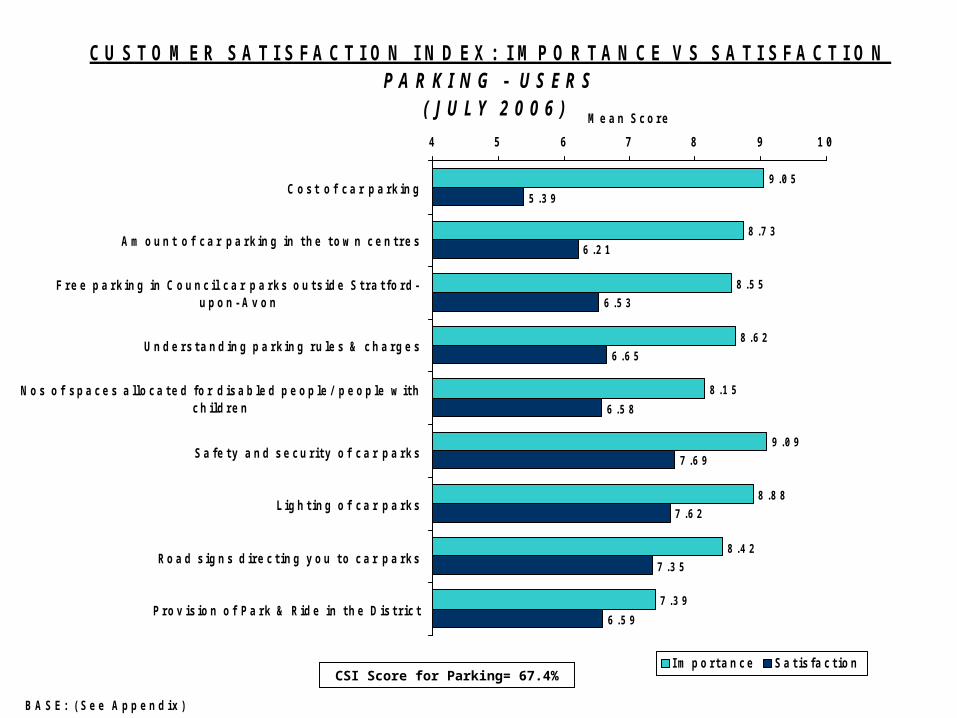
C U S T O M E R S A T I S F A C T I O N I N D E X : I M P O R T A N C E V S S A T I S F A C T I O NP A R K I N G - U S E R S
( J U L Y 2 0 0 6 )
9 .0 5
8 .7 3
8 .5 5
8 .6 2
8 .1 5
9 .0 9
8 .8 8
8 .4 2
7 .3 9
5 .3 9
6 .2 1
6 .5 3
6 .6 5
6 .5 8
7 .6 9
7 .6 2
7 .3 5
6 .5 9
4 5 6 7 8 9 1 0
C o s t o f c a r p a rk in g
A m o u n t o f c a r p a rk in g in th e to w n c e n tre s
F re e p a rk in g in C o u n c il c a r p a rks o u ts id e S tra t fo rd -u p o n - A v o n
U n d e rs ta n d in g p a rk in g ru le s & c h a rg e s
N o s o f s p a c e s a llo c a te d fo r d is a b le d p e o p le / p e o p le w ithc h ild re n
S a fe ty a n d s e c u rity o f c a r p a rks
L ig h t in g o f c a r p a rks
Ro a d s ig n s d ire c t in g y o u to c a r p a rks
P ro v is io n o f P a rk & R id e in th e D is t r ic t
M e a n S c o re
I m p o rta n c e S a t is fa c t io n
B A S E : ( S e e A p p e n d ix )
CSI Score for Parking= 67.4%

C U S T O M E R S A T I S F A C T I O N I N D E X : I M P O R T A N C E V S S A T I S F A C T I O NP L A N N I N G - U S E R S
( J U L Y 2 0 0 6 )
8 . 5 7
8 . 7 8
8 . 7 1
8 . 6 6
8 . 9 8
8 . 7 8
9 . 0 3
9 . 2 1
9 . 1 4
9 . 0 9
9 . 0 0
8 . 8 8
8 . 9 1
8 . 9 8
9 . 0 0
9 . 0 1
5 . 2 9
5 . 5 7
5 . 8 2
5 . 9 0
6 . 3 5
6 . 2 3
6 . 4 9
6 . 7 0
6 . 6 3
6 . 6 6
6 . 7 1
6 . 6 8
6 . 7 1
6 . 9 4
6 . 9 9
7 . 0 6
4 5 6 7 8 9 1 0
B e in g c o n s u lt e d o n t h e D is t r ic t 's p la n n in g p o lic ie s
B u ild in g o f s c h o o ls e t c in lin e w it h h o u s in g d e v e lo p m e n t
A m o u n t o f C o u n c il fe e d b a c k o n fu t u r e d e v e lo p m e n t o f D is t r ic t
B e in g k e p t in fo r m e d o n a r e g u la r b a s is a b o u t p la n n in g a p p lic a t io n
A n y o b j e c t io n s m a d e t o a p la n n in g a p p lic a t io n a r e c o n s id e r e d
T im e t a k e n t o m a k e a d e c is io n a b o u t a p la n n in g a p p lic a t io n
E x p la n a t io n o f a d e c is io n m a d e
K e e p in g p r o m is e s a n d c o m m it m e n t s
R e t u r n in g y o u r t e le p h o n e c a lls
P r o v is io n o f a n a n s w e r t o y o u r p r o b le m
B e in g a b le t o c o n t a c t r e le v a n t p e r s o n w it h in p la n n in g d e p t
P r o v id in g a q u ic k r e s p o n s e t o e n q u ir ie s
A c c e s s ib ilit y o f p la n n in g s t a ff
R e c e iv in g a d v ic e & in fo r m a t io n f r o m p la n n in g s t a ff
K n o w le d g e o f p la n n in g s t a ff
P r o fe s s io n a lis m o f p la n n in g s t a ff
M e a n S c o re
I m p o r t a n c e S a t is fa c t io n
B A S E : ( S e e A p p e n d ix )
CSI Score for Planning= 64.3%

C U S T O M E R S A T I S F A C T I O N I N D E X : I M P O R T A N C E V S S A T I S F A C T I O NP L A Y A R E A S - U S E R S
( J U L Y 2 0 0 6 )
9 .3 7
9 .1 8
8 .4 2
9 .1 5
8 .0 8
7 .2 4
7 .2 8
6 .8 0
7 .6 6
7 .3 9
4 5 6 7 8 9 1 0
F re e o f d o g s / d o g m e s s
C le a n lin e s s & c o n d it io n o fp la y a re a s / e q u ip m e n t
A d e q u a te p ro v is io n o f p la ya re a s a c ro s s th e D is tr ic t
S a fe ty a n d s e c u r ity o f p la ya re a s / e q u ip m e n t
V a rie ty o f e q u ip m e n ta v a ila b le in p la y a re a s
M e a n S c o re
I m p o rta n c e S a t is fa c t io n
B A S E : ( S e e A p p e n d ix )
CSI Score for Play Areas= 72.8%

C U S T O M E R S A T I S F A C T I O N I N D E X : I M P O R T A N C E V S S A T I S F A C T I O NP U B L I C T O I L E T S - U S E R S
( J U L Y 2 0 0 6 )
8 .6 6
8 .8 7
8 .5 4
8 .4 8
9 .1 4
9 .0 3
8 .9 4
6 .0 6
6 .9 9
6 .6 8
6 .6 6
7 .3 5
7 .3 1
7 .4 7
4 5 6 7 8 9 1 0
N u m b e r o f p u b lic to ile tsa v a ila b le in D is t r ic t
S u ffi c ie n t a m o u n t o f to ile tro lls / s o a p e tc
O p e n in g t im e s o f p u b licto ile ts
L o c a t io n o f p u b lic to ile ts
C le a n lin e s s & c o n d it io n o fp u b lic to ile ts
F e e lin g s a fe u s in g p u b licto ile ts
L ig h t in g in p u b lic to ile ts
M e a n S c o re
I m p o rta n c e S a t is fa c t io n
B A S E : ( S e e A p p e n d ix )
CSI Score for Public Toilets= 69.4%

Overall Views of Council Services (All Respondents)

3.1
7.4
23.3
25.4
16.7
13.4
5.2
3.1
1.1
1.4
0 10 20 30
10 - ExtremelySatisfied
9
8
7
6
5
4
3
2
1 - ExtremelyDissatisfied
CUSTOMER SATISFACTION INDEXOVERALL SATISFACTION WITH COUNCIL SERVICES
ALL RESPONDENTS (JULY 2006)
Base: (843)
%
COMBINED COUNCIL AVERAGE 2006 = 6.62 (Mean Score)
COMBINED COUNCIL AVERAGE 2004 = 6.49 (Mean Score)
COMBINED COUNCIL AVERAGE 2002 = 6.48 (Mean Score)

2.3
4.2
13.3
17.5
17.9
20.7
10.0
5.5
2.6
6.1
0 10 20 30
10 - Totally Agree
9
8
7
6
5
4
3
2
1 - TotallyDisagree
CUSTOMER SATISFACTION INDEXAGREE/DISAGREE THAT COUNCIL OFFERS VALUE FOR MONEY
ALL RESPONDENTS (JULY 2006)
Base: (840)
COMBINED COUNCIL AVERAGE 2006 = 5.68 (Mean Score)
COMBINED COUNCIL AVERAGE 2004 = 5.47 (Mean Score)
COMBINED COUNCIL AVERAGE 2002 = 5.84 (Mean Score)
%

22.8
14.8
9.8
8.6
8.3
6.5
6.5
6.5
5.6
5.6
5.6
5.3
5.3
5.0
0 10 20 30
Need more recycling facilities/ better recycling
Provide wheelie/ recycling bins/ bags
Car park fees too high
A review of Council Tax banding
Insufficient car parking/ free parking/ car parks closed
More equal share of council money/ time
Not enough refuse collections/ poor refuse collectors
Complaints ignored/ council services no feedback
Mentions of Council Tax
Dog fouling/ on paths
State of roads/ road signs
Mentions of wasting money (e.g. roadworks)
Too much new housing/ factories/ unsuitable business
Villages/ outside of towners feel forgotten
CUSTOMER SATISFACTION INDEXADDITIONAL COMMENTS (JULY 2006)
Base: (337)
Mentions 5% or more
%

APPENDIX A(Respondent Profile)

PROFILE
AGE: % ETHNICITY: %
16 – 25 4.3 British 98.7
26 – 35 8.9 I rish 0.4
36 – 45 13.6 White Other 0.4
46 – 54 13.9 Black & Black British African 0.2
56 – 65 26.0 I ndian 0.2
Over 65 33.4 White & Black African 0.1
(870) (848) SEX: % Male 39.9
Female 60.1
(837)

APPENDIX B(Base Sizes)
Council in General All Users Council Tax (Continued) All Users
Being able to contact relevant person 849 547 Provision of answer to your problem 821 241
Being put through to the correct dept 850 548 Explanation of a decision made 817 236
Providing a prompt response to enquires 844 542 Keeping promises & commitments 820 235
Professionalism of staff 841 541 Returning your telephone calls 821 234
Knowledge of staff 831 532 Refuse Collection / Recycling
Provision of answer to problem 838 538 Usability of recycling containers 863 N/A
Explanation of a decision made 830 529 Provision of central recycling points 857 N/A
Keeping promises & commitments 834 529 Range of items allowed for recycling 856 N/A
Returning your telephone calls 823 523 Regular weekly refuse collections 870 N/A
Opening times of SDC offices 797 527 Friendliness of refuse collectors 861 N/A
Council Tax Helpfulness of refuse collectors 860 N/A
Accuracy of council tax billing 839 239 Not leaving a mess after collection 870 N/A
Being able to contact the relevant person 830 245 Provision of black bags 865 N/A
Professionalism of staff 816 243 Provision of green wheelie bins 859 N/A
Knowledge of staff
809 237
BASE SIZES - IMPORTANCE (I)

Council in General All Users Council Tax (Continued) All Users
Being able to contact relevant person 775 543 Provision of answer to your problem 657 242
Being put through to the correct dept 778 545 Explanation of a decision made 651 242
Prompt response to enquiries 772 543 Keeping promises & commitments 648 241
Professionalism of staff 768 543 Returning your telephone calls 647 238
Knowledge of staff 760 537 Refuse Collection / Recycling
Provision of answer to problem 767 540 Usability of recycling containers 839 N/A
Explanation of a decision made 756 537 Provision of central recycling points 820 N/A
Keeping promises & commitments 756 539 Range of items allowed for recycling 831 N/A
Returning your telephone calls 751 529 Regular weekly refuse collections 850 N/A
Opening times for SDC offices 749 516 Friendliness of refuse collectors 829 N/A
Council Tax Helpfulness of refuse collectors 828 N/A
Accuracy of council tax billing 677 247 Not leaving a mess after collection 842 N/A
Being able to contact the relevant person 656 246 Provision of black bags 848 N/A
Professionalism of staff 656 244 Provision of green wheelie bins 837 N/A
Knowledge of staff
649 241
BASE SIZES - SATISFACTION(II)

Street Cleaning All Users Public Toilets (Continued) All Users
Keeping the streets free from litter 867 N/A Sufficient amount of toilet rolls/soap etc 834 521
Removal of abandoned cars 842 N/A Leisure Facilities
Keeping the streets free from dog fouling 865 N/A Cleanliness of leisure facilities 787 215
Provision same level of service across district 846 N/A Availability locally of leisure facilities 782 215
Responding quickly to litter/flytipping 845 N/A Properly qualified staff 783 215
No of litter bins provided 852 N/A Friendliness of the staff 779 215
Environmental Health Helpfulness of the staff 782 214
Controlling of health standards in public areas
843 125 Maintenance of the facilities/equipment 782 215
Noise control within your locality 854 125 Value for money 781 215
Atmospheric pollution within your locality 838 124 Feeling safe using the facilities 777 214
Food safety in local premises 850 125 Information provided on SDC facilities or events
774 214
Pest control in your locality 850 126 Suitability of leisure facilities for different ages
777 215
Public Toilets Play Areas
Cleanliness & condition of public toilets 842 525 Safety & security of play areas/ equipment
858 340
Number of public toilets 838 524 Cleanliness & condition of play areas/ equipment
854 342
Opening times of public toilets 831 518 Free of dogs/dog mess 862 342
Location of public toilets 830 519 Variety of equipment 850 339
Feeling safe using public toilets 832 519 Adequate provision across the District 853 337
Lighting in public toilets
833 520
BASE SIZES - IMPORTANCE (III)

Street Cleaning All Users Public Toilets (Continued) All Users
Keeping the streets free from litter 839 N/A Sufficient amount of toilet rolls/soap etc 698 513
Removal of abandoned cars 790 N/A Leisure Facilities
Keeping the streets free from dog fouling 825 N/A Cleanliness of leisure facilities 585 215
Provision same level of service across district 786 N/A Availability locally of leisure facilities 584 216
Responding quickly to litter/flytipping 776 N/A Properly qualified staff 583 216
No of litter bins provided 814 N/A Friendliness of the staff 580 215
Environmental Health Helpfulness of the staff 581 216
Controlling of health standards in public areas
619 115 Maintenance of the facilities/equipment 580 216
Noise control within your locality 632 115 Value for money 581 216
Atmospheric pollution within your locality 622 117 Feeling safe using the facilities 583 217
Food safety in local premises 626 114 Information provided on SDC facilities or events
577 213
Pest control in your locality 631 121 Suitability of leisure facilities for different ages
557 216
Public Toilets Play Areas
Cleanliness & condition of public toilets 709 526 Safety & security of play areas/ equipment
621 346
Number of public toilets 688 506 Cleanliness & condition of play areas/ equipment
620 346
Opening times of public toilets 688 504 Free of dogs/dog mess 619 344
Location of public toilets 694 511 Variety of equipment 618 344
Feeling safe using public toilets 696 512 Adequate provision across the District 609 332
Lighting in public toilets
698 513
BASE SIZES - SATISFACTION (IV)

Parks & Open Spaces All Users Planning (Cont) All Users
Clean & tidy appearance of parks & gardens 763 N/A Provision of answer to your problem 546 208
Provision same level of service across district
733 N/A Explanation of decision made 546 209
Personal safety in Stratford’s parks 747 N/A Keeping promises & commitments 543 206
Amount of seating available 751 N/A Returning your telephone calls 544 206
Planning Housing
Receiving advice from planning staff pre application
550 209 Availability of affordable housing across the District
531 98
Time taken to make decision on an application
545 208 Being able to contact relevant person in housing
517 99
Providing a quick response to enquiries 550 212 Professionalism of housing staff 515 98
Any objections made to planning application
541 202 Knowledge of housing staff 510 96
Being kept informed on a regular basis 550 211 Provision of answer to problem 512 99
Building of schools in line with housing developments
545 203 Explanation of a decision made 513 98
Amount of information the Council provides on the future development of District
550 205 Keeping promises & commitments 510 97
Consultation on planning policies 546 205 Returning your telephone calls 511 98
Being able to contact relevant person in planning
544 207
Accessibility of planning staff 543 208
Professionalism of planning staff 544 207
Knowledge of planning staff 541 204
BASE SIZES - IMPORTANCE (V)

Parks & Open Spaces All Users Planning (Cont) All Users
Clean & tidy appearance of parks & gardens 875 N/A Provision of answer to your problem 662 214
Provision same level of service across district
845 N/A Explanation of decision made 654 213
Personal safety in Stratford’s parks 855 N/A Keeping promises & commitments 655 215
Amount of seating available 837 N/A Returning your telephone calls 654 215
Planning Housing
Receiving advice from planning staff over the telephone
674 217 Availability of affordable housing across the District
627 101
Time taken to make a planning decision 669 216 Being able to contact relevant person in housing
623 100
Providing a quick response to enquiries 666 216 Professionalism of housing staff 619 99
Any objections made to planning application are considered
656 215 Knowledge of housing staff 617 98
Being kept informed on a regular basis 661 217 Provision of answer to problem 620 98
Building of schools in line with housing developments
658 215 Explanation of a decision made 616 98
Amount of information the Council provides on the future development of District
663 216 Keeping promises & commitments 618 98
Being consulted on the Districts planning policies
658 216 Returning your telephone calls 618 98
Being able to contact relevant person in planning
658 215
Accessibility of planning staff 657 216
Professionalism of planning staff 657 216
Knowledge of planning staff 654 215
BASE SIZES - SATISFACTION (VI)

Parking All Users
Safety and security of car parks 826 692
Lighting of car parks 823 692
Cost of car parking 826 691
Road signs directing you to car parks 814 684
Amount of car parking in the town centre 819 688
Understanding rules & charges 814 686
Numbers of spaces for disabled people/people with children
803 668
Free parking in Council car parks outside Stratford-upon-Avon
812 678
Provision of Park & Ride in the District 810 678
BASE SIZES - IMPORTANCE (VII)

Parking All Users
Safety and security of car parks 826 693
Lighting of car parks 823 690
Cost of car parking 826 691
Road signs directing you to car parks 814 690
Amount of car parking in the town centre 819 694
Understanding rules & charges 814 683
Numbers of spaces for disabled people/people with children
803 671
Free parking in Council car parks outside Stratford-upon-Avon
812 676
Provision of Park & Ride in the District 810 668
BASE SIZES - SATISFACTION (VIII)