january 2021 uk customer satisfaction index
TRANSCRIPT

instituteofcustomerservice.com
JANUARY 2021
UK Customer Satisfaction IndexThe state of customer satisfaction in the UK


1UK Customer Satisfaction Index | January 2021
Many middle or low income customers have delayed
big-ticket purchases whilst more affluent customers
are giving greater consideration to ethical suppliers
and the service experience. All are seeking to deal
with organisations that ‘do the right thing’ and
demonstrate that they care about the customer.
The rapid rollout of the COVID-19 vaccine brings hope
that economic activity and social life will soon revive.
For organisations, this is a moment to learn from
the lessons of the last year, to refocus and act with
renewed purpose and impact.
For me, there are three key learnings that stand
out. First, organisations need to be smart and agile
in harnessing technology to enable fast, efficient
transactional service and access to critical information
and advice. Secondly, as customers, we need human
contact, empathy and reassurance, especially for
issues that are complex or personally important.
Thirdly, the past year has brought to the fore the rich
potential for virtual technologies to enable innovative
new ways of experiencing services and content.
Increasingly, organisations will need to develop and
excel in each of these areas in order to adapt to
customer needs and create a sustainable future.
Finally, I wish you a safe and successful 2021. As ever,
I welcome your feedback and engagement in The
Institute’s research, events, products and services.
Now, more than ever, the service agenda is central
to our future and I look forward to working with The
Institute’s members to demonstrate the value and
positive impact of service at this critical time.
Taken at face value, the latest customer satisfaction
results in this UKCSI look similar to those we
published a year ago. But of course, the customer
experience environment has been shaken and
changed by the events of the last year. Many
organisations have displayed incredible agility to
maintain services and respond proactively to changes
in their customers’ circumstances and needs –
seeking to reassure, engage and provide appropriate
advice and support. Other organisations have
struggled to adapt, or failed to engage proactively,
adding to the disruption and anxiety experienced
by customers and employees. There has clearly
been a significant growth in online services, digital
innovation and exciting new ways of delivering
services. But it is also clear that human contact
remains something that consumers need.
The pandemic has exposed a hardening polarisation
in society. Many people with access to technology,
domestic space and a decent income have enjoyed a
secure, if frustrating lockdown experience. However,
many others have suffered a decline in their financial,
mental or physical well-being and are fearful about
what the future holds. Our research suggests
that around 20% of people have suffered from a
deterioration in their well-being, with customers on
relatively low incomes and people with a disability or
long-term health affected more than average.
In this UKCSI, we show how customer behaviours
have changed and that many of these changes are
likely to persist. Customers of all ages and in all
income groups are buying more online and thinking
more carefully about where they spend their money.
ForewordJoanna Causon Chief Executive

2 UK Customer Satisfaction Index | January 2021

3UK Customer Satisfaction Index | January 2021
Executive summary
Part 1 The state of customer satisfaction in the UK
Part 2 Customer satisfaction and business peformance, loyalty and reputation
Part 3 Customer satisfaction during the COVID-19 crisis
Part 4 Changing customer behaviours and well-being
Part 5 Recommendations for organisations
UKCSI Key facts
Organisations in the UKCSI
About the UKCSI
UKCSI sector reports
Breakthrough research from The Institute
About The Institute
Contents
4
12
32
40
46
60
70
71
72
73
74
76

Executive Summary

5UK Customer Satisfaction Index | January 2021
The January 2021 UKCSI is 76.8 (out of 100), 0.1 points lower than January 2020 and the lowest level since July 2015
Jan-21Jan-13 July-15Jan-09
76.877.076.977.1
77.777.9
78.178.277.8
77.4
77.0
76.276.0
76.3
77.1
77.978.2
14.6% of customers
experienced a problem with an organisation the
highest level ever recorded

6 UK Customer Satisfaction Index | January 2021
36.2%42.8%
27.1%26.4%
17.4%16.6%
10.1%6.5%
4.0%3.2%
2.2%1.5%
1.5%1.0%
0.9%1.3%
0.7%0.6% Jan-20
Jan-21Social media
In writing (letter)
Text
Web chat
App
Over the phone(e.g. called a contact centre)
Website
In person
The proportion of in person experiences has fallen, whilst email has grown, compared to a year ago
Average customer satisfaction rose slightly for in person experiences but fell for email, App and Web chat experiences.
Jan-21Jan-20
Web chatAppEmailPhoneWebsiteIn writingIn person
79.378.6
70.169.5
78.3 78.0
73.8 73.7
71.171.6
80.0 80.3
70.9
72.6
% channels used for customer experiences recorded in the UKCSI
Average customer satisfaction by channel

7UK Customer Satisfaction Index | January 2021
However, both the Public Services (Local) and Public Services (National) sectors have lower average customer satisfaction for experiences recorded in September / October 2020 than those recorded in March / April 2020. This appears to confirm that the evolving COVID-19 crisis continues to create significant challenges for Public Services organisations and their customers.
The drop in customer satisfaction with the Transport sector has been caused mainly by a decline in average satisfaction for experiences with airlines.
Customer satisfaction with the Public Services (National) sector has risen by 1.5 points. Banks & Building Societies, Tourism and Transport have fallen by at least 1 point
UKCSI Jan 2020UKCSI Jan 2021Transport
Utilities
Telecommunications & Media
Public Services (Local)
Services
Public Services (National)
Tourism
Banks & Building Societies
Insurance
Automotive
Retail (Food)
Leisure
Retail (Non-food)80.5
80.3
80.1
80.0
80.0
79.9
78.4
78.4
78.4
78.4
78.3
79.5
77.7
79.5
76.7
75.2
76.6
76.7
74.4
73.6
74.3
74.8
72.7
72.3
69.9
71.2

8 UK Customer Satisfaction Index | January 2021
271 organisations or organisation types received a UKCSI score. 44 have improved by 2 points or more compared to January 2020. 73 have declined by at least 2 points
271Organisations and
organisationtypes in the UKCSI
44Organisationshave improvedyoy by at least
two points
73Organisations
have experienceda yoy drop of
at least 2 points
first direct, John Lewis and M & S (Non-food) are the highest rated organisations.
Jan-21 Rank
Organisation SectorJan-21 Score
Jan-20 Score
Jan-20Rank
Changein scoreJan-20 to Jan-21
1 first direct Banks & Building Societies 85.5 85.4 2 0.1
2 John Lewis Retail (Non-food) 85.1 85.6 1 -0.5
3 M & S Retail (Non-food) 84.1 82.4 18 1.7 p
4 Amazon.co.uk Retail (Non-food) 83.6 84.1 5 -0.5 q
5 M & S (food) Retail (Food) 83.5 81.6 28 1.9 p
6 Tesco Mobile Telecommunications & Media 83.3 81.7 27 1.6 p
7 Pets at Home Retail (Non-food) 83.2 81.9 24 1.3 p
8 Netflix Leisure 83.1 82.7 15 0.4
9 Aldi Retail (Food) 82.9 82.3 19 0.6
10 Costa Coffee Leisure 82.8 79.7 67 3.1 p
p Increase in UKCSI score of less than one point q Fall in UKCSI score p Increase in UKCSI score of one point or more
first direct, John Lewis, M & S (Non-food), M & S (food) and Pets at Home are amongst the highest rated organisations across each of the Experience, Customer Ethos, Emotional Connection and Ethics dimensions of customer satisfaction.
In Banks and Building Societies, Telecommunications and Media, Tourism and Utilities, more than 30% of the companies that received a UKCSI score fell by at least 2 points compared to January 2020.

9UK Customer Satisfaction Index | January 2021
All food retailers1 that appear in both the UKCSI and Kantar’s market share research have witnessed annual sales growth of at least 5%
Ocado was the fastest growing retailer, with sales up by 36.1%. Although, Ocado’s customer satisfaction (80.0) is 2.1 points below its January 2020 level, it has improved by 1.3 points compared to July 2020.
Iceland’s sales rose by 17.9%. Average customer satisfaction with Iceland was 81.1, 1.2 points more than a year ago. Iceland is the third highest rated food retailer for customer satisfaction, after M & S and Aldi.
Banks or building societies whose customer satisfaction was at least 1 point better than the sector average recorded an average of 2,677 net current account gains, compared to 1,794 net losses for those with a UKCSI score at least 1 point below the sector average
Amongst the organisations that feature in both the UKCSI and the Current Account Switching Service Dashboard, Starling Bank, Nationwide and NatWest achieved the most net current account gains2. Each of these organisations received a UKCSI score higher than the sector average.
1 Based on Kantar’s research into annual sales growth for the 12 weeks ending 1 November 2020. Please note: M & S (food) is the highest rated food retailer in the UKCSI but is not included in Kantar’s analysis of sales growth and market share
2 Based on the Current Account Switching Service (CASS) Dashboard Issue 28. Note: Monzo achieved the second highest number of net current account gains, after Starling Bank, but it did not receive sufficient responses to receive a UKCSI score. HSBC’s current account gains include the HSBC, first direct and M & S Bank brands.
Average current account quarterly net gains completing 1 April - 30 June 2020
Banks & Building Societies with UKCSI within 1 point
( +/- ) of sector average
Banks & Building Societies witha UKCSI at least 1 point above
sector average
Net current account gains Net current account losses
2,677 -10,019
Banks & Building Societieswith a UKCSI at least 1 point
below sector average
Net current account losses
-1,794

10 UK Customer Satisfaction Index | January 2021
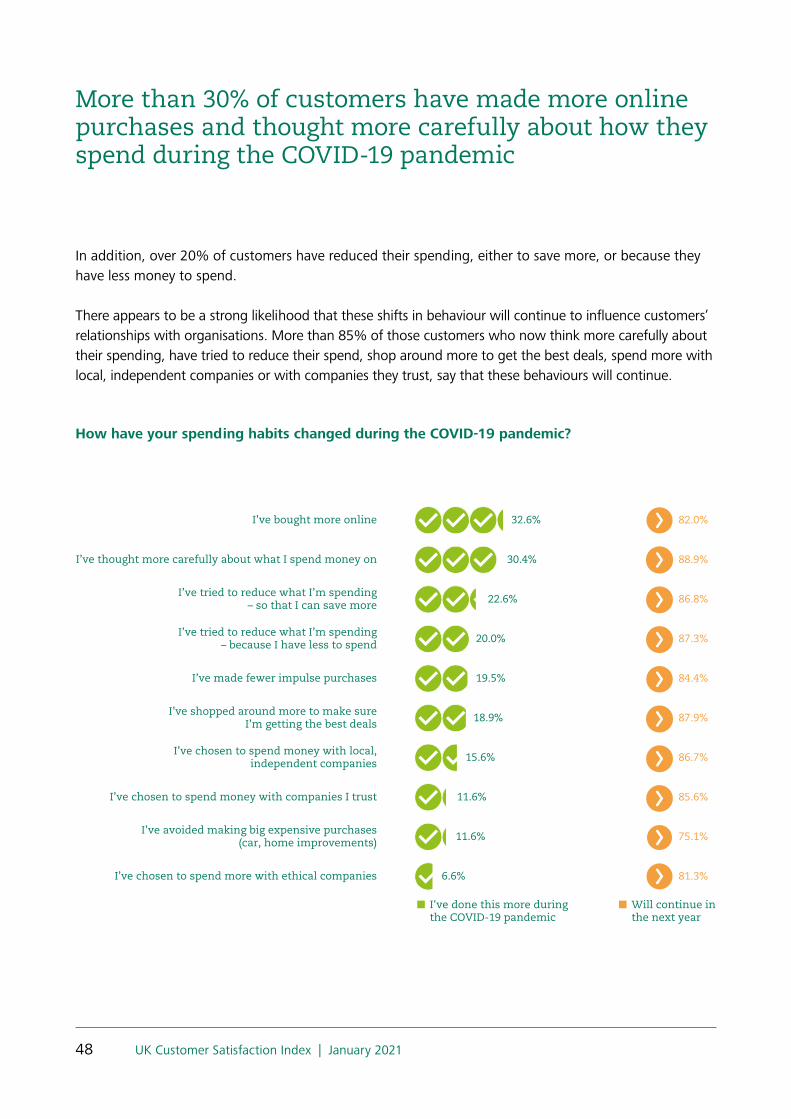
More than 30% of customers have made more online purchases and thought more carefully about how they spend during the COVID-19 pandemic
In addition, over 20% of customers have reduced their spending, either to save more, or because they have less money to spend.
More than 85% of those customers who now think more carefully about their spending, have tried to reduce their spend, shop around more to get the best deals, spend more with local, independent companies or with companies they trust, say that these behaviours will continue.
Customers who feel they have become financially worse off during the COVID-19 pandemic are more likely than average to have cut back and thought more carefully about their spending, bought more online and avoided big ticket purchases.
Customers who say they have become financially better off since the onset of COVID-19 are more likely than average to have spent money with companies they trust, or with ethical companies. The reduction in their spending has enabled them to save more.
I've done this more duringthe COVID-19 pandemic
Will continue inthe next year
I’ve chosen to spend more with ethical companies
I’ve avoided making big expensive purchases(car, home improvements)
I’ve chosen to spend money with companies I trust
I’ve chosen to spend money with local,independent companies
I’ve shopped around more to make sureI’m getting the best deals
I’ve made fewer impulse purchases
I’ve tried to reduce what I’m spending– because I have less to spend
I’ve tried to reduce what I’m spending– so that I can save more
I’ve thought more carefully about what I spend money on
I’ve bought more online 32.6%
30.4%
22.6%
20.0%
19.5%
18.9%
15.6%
11.6%
11.6%
6.6%
82.0%
88.9%
86.8%
87.3%
84.4%
87.9%
86.7%
85.6%
75.1%
81.3%
How have your spending habits changed during the COVID-19 pandemic?

11UK Customer Satisfaction Index | January 2021
Most customers feel their well-being is about the same as it was 6 months ago. But at least 22% say their financial or physical well-being has got worse and 18.8% say their mental well-being has deteriorated
Customers aged 18 – 44, and those with an annual household income of at least £50,000 are more likely than average to have better well-being than 6 months ago.
Customers aged 45 – 64 and those with an annual income below £20,000 are more likely than average to say their financial or mental well-being has deteriorated in the last 6 months.
People with a disability or long-term health condition are more likely than average to have experienced a decline in their financial, physical and mental well-being.
Recommendations for organisations
Make it easy for customers to contact your organisation and access help1
Communicate and engageproactively with your customers2
Be responsive to customers’personal context3
Prioritise and plan for theneeds of vulnerable customers4
Develop a culture ofagility and innovation7
Assess your customers’changing priorities and needs8
Focus on short and long termrisk and performance9
Take care of employees’ well-being6
Maintain a focus ondelivery and logistics5 Maintain a focus ondelivery and logistics5
Our research concludes with 9 recommendations and key actions for organisations to improve their customer service and respond to changing customer needs and behaviours.
12 UK Customer Satisfaction Index | January 2021
The state of Customer satisfactionin the UK
1

13UK Customer Satisfaction Index | January 2021
The January 2021 UKCSI is 76.8 (out of 100), 0.1 points lower than January 2020 and 0.2 points lower than July 2020
Jan-21Jul-20Jan-20Jul-19Jan-19Jul-18Jan-18Jul-17Jan-17Jul-16Jan-16Jul-15Jan-15Jul-14Jan-14Jul-13Jan-13Jul-12Jan-12Jul-11Jan-11Jul-10Jan-10Jul-09Jan-09
76.877.076.977.1
77.777.978.178.277.8
77.477.0
76.276.0
76.3
77.1
77.978.2
78.0
77.477.3
76.7
75.6
75.2
74.1
72.0
Although the overall UKCSI has hardly changed over the last year, January 2021 is the lowest UKCSI score since July 2015, when it was 76.2.
14 UK Customer Satisfaction Index | January 2021
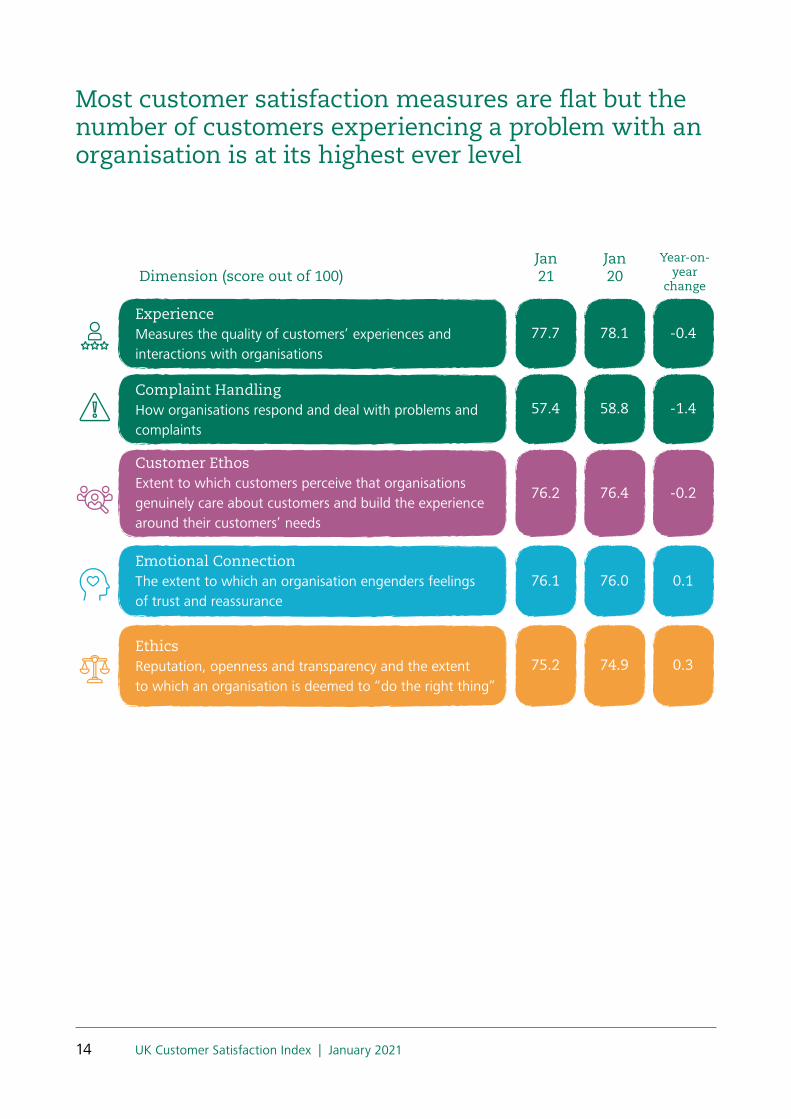
Most customer satisfaction measures are flat but the number of customers experiencing a problem with an organisation is at its highest ever level
ExperienceMeasures the quality of customers’ experiences and interactions with organisations
Dimension (score out of 100)Jan21
EthicsReputation, openness and transparency and the extent to which an organisation is deemed to “do the right thing”
Customer EthosExtent to which customers perceive that organisations genuinely care about customers and build the experience around their customers’ needs
Complaint HandlingHow organisations respond and deal with problems and complaints
Emotional ConnectionThe extent to which an organisation engenders feelings of trust and reassurance
77.7
75.2
76.2
57.4
76.1
Jan 20
78.1
74.9
76.4
58.8
76.0
Year-on-year
change
-0.4
0.3
-0.2
-1.4
0.1

15UK Customer Satisfaction Index | January 2021
13 of the 26 measures in the UKCSI are at the same level as in January 2020. However, the number of customers experiencing a problem with an organisation increased by 1 percentage point to 14.6%, its highest ever level. At the same time, average satisfaction with complaint handling has fallen.
Jan-21Jul-20Jan-20Jul-19Jan-19Jul-18Jan-18Jul-17Jan-17Jul-16Jan-16Jul-15Jan-15
13.4
13.9
14.3
13.6
14.1
14.6
13.2
12.6 12.7
12.8
12.5
13.1 13.1
% of customers experiencing a problem

16 UK Customer Satisfaction Index | January 2021
The proportion of in person experiences has fallen, whilst email has grown, compared to a year ago
Unsurprisingly, given the disruption caused by the COVID-19 pandemic, the channel make-up of customer experiences has changed. The proportion of experiences conducted in person has fallen sharply, by 6.6 percentage points, compared to January 2020. More experiences have been recorded for every other channel except for in writing. In particular, the proportion of email experiences rose by 3.6 percentage points, from 6.5% to 10.1%.
% channels used for customer experiences recorded in the UKCSI
36.2%
42.8%
27.1%
26.4%
17.4%
16.6%
10.1%
6.5%
4.0%
3.2%
2.2%
1.5%
1.5%
1.0%
0.9%
1.3%
0.7%
0.6% Jan-20
Jan-21Social media
In writing (letter)
Text
Web chat
App
Over the phone (e.g. called a contact centre)
Website
In person

17UK Customer Satisfaction Index | January 2021
The drop in the proportion of recorded in person experiences is particularly marked in the Public Services, Tourism, Leisure, Retail and Banking sectors. The growth in the number of email experiences is especially prominent in Tourism, Automotive, Transport, Insurance, Utilities and Public Services.
SectorIn person In person
yoy changeEmail Email
yoy change
Automotive 48.4% -6.1% q 12.0% 5.6% p
Banks & Building Societies 33.8% -7.6% q 6.0% 2.2% p
Insurance 11.3% -1.5% q 12.3% 3.9% p
Leisure 60.3% -11.4% q 6.7% 2.8% p
Public Services (Local) 40.8% -17.5% q 9.6% 3.4% p
Public Services (National) 50.4% -9.8% q 8.4% 3.3% p
Retail (Food) 72.3% -5.4% q 4.9% 1.1% p
Retail (Non-food) 44.5% -8.5% q 6.8% 2.4% p
Services 42.0% -2.6% q 10.9% 1.7% p
Telecommunications & Media 13.3% -3.9% q 10.6% 3.3% p
Tourism 14.3% -7.9% q 15.1% 8.1% p
Transport 32.6% -4.7% q 11.5% 4.5% p
Utilities 6.1% 0.7% p 16.0% 3.5% p
p Change in channel usage of less than one percentage point q Fall in channel use p Increase in channel use

18 UK Customer Satisfaction Index | January 2021
Average customer satisfaction rose slightly for in person experiences and fell for email, App and webchat experiences
Average customer satisfaction by channel is generally at a similar level to January 2020. Despite the fall in the number of in person recorded experiences, average satisfaction for this channel rose slightly, by 0.7 points to 79.3. Email, App and Web chat are the only channels in which average customer satisfaction is lower than a year ago.
Jan-21Jan-20
Web chatAppEmailPhoneWebsiteIn writingIn person
79.378.6
70.169.5
78.378.0
73.8 73.7
71.171.6
80.080.3
70.9
72.6
Average customer satisfaction by channel

19UK Customer Satisfaction Index | January 2021
Customer satisfaction in the Public Services (National) sector has risen by 1.5 points. Banks & Building Societies, Tourism and Transport have fallen by at least 1 point. 9 sectors are broadly at the same level as a year ago for customer satisfaction
1 sectorup by at least one point compared to
January 2020
5 sectorsup by less than one point compared to
January 2020
2 sectorsremained the same when compared to
January 2020
2 sectorsdown by less than
one point since January 2020
3 sectorsdown by at least one point since January 2020
Public Services (National) Leisure Automotive Services
Banks & Building Societies
Public Services (Local) Insurance
Telecoms& Media
Tourism
Retail (Food)
Retail (Non-food)
Utilities
Transport

20 UK Customer Satisfaction Index | January 2021
5 of the 13 UKCSI sectors – Leisure, Public Services (Local), Retail (Food), Retail (Non-food) and Utilities - are slightly higher (by less than 1 point) compared to January 2020.
The Automotive and Insurance sectors are at the same level for customer satisfaction as they were in January 2020.
The Services and Telecommunications and Media sectors each has slightly lower average customer satisfaction (a drop of less than 1 point) compared to a year ago.
Average customer satisfaction in the Public Services (National) sector is 76.7, 1.5 points higher than in January 2020 and its highest ever score. The rise in customer satisfaction with the Public Services (National) sector is largely due to improved scores for HMRC, Jobcentre Plus, NHS / hospital service and Post Office.
UKCSI Jan 2020UKCSI Jan 2021Transport
Utilities
Telecommunications & Media
Public Services (Local)
Services
Public Services (National)
Tourism
Banks & Building Societies
Insurance
Automotive
Retail (Food)
Leisure
Retail (Non-food)80.5
80.3
80.180.0
80.079.9
78.478.4
78.478.4
78.379.5
77.779.5
76.775.2
76.676.7
74.473.6
74.374.8
72.772.3
69.971.2
Year on year changes in customer satisfaction by sector

21UK Customer Satisfaction Index | January 2021
Sector
Jan 2021 UKCSI score (out of 100)
12 month change (compared to Jan 2020)
6 month change (comparedto July 2020)
Highest scoring organisation inthe sector
Highest organisation's score
Retail (Non-food) 80.5 0.2 0.5 John Lewis 85.1
Leisure 80.1 0.1 -0.1 Netflix 83.1
Retail (Food) 80.0 0.1 0.4 M & S (food) 83.5
Automotive 78.4 0.0 0.1 Mini 82.5
Insurance 78.4 0.0 -0.2 LV= 82.6
Banks & Building Societies 78.3 -1.2 -0.8 first direct 85.5
Tourism 77.7 -1.8 -0.9 Premier Inn 82.4
Public Services (National) 76.7 1.5 0.6 Post Office 79.8
Services 76.6 -0.1 -0.5 Green Flag 80.9
Public Services (Local) 74.4 0.8 -0.9 Library 81.2
Telecommunications & Media 74.3 -0.5 0.1 Tesco Mobile 83.3
Utilities 72.7 0.4 0.1 Octopus Energy 81.4
Transport 69.9 -1.3 -1.5 Jet2 78.6
p Increase in UKCSI score of less than one point q Fall in UKCSI score of one point or more p Increase in UKCSI score of one point or more
Year on year changes in customer satisfaction by sector

22 UK Customer Satisfaction Index | January 2021
The drop in customer satisfaction in the Banks & Building Societies, Tourism and Transport sectors is reflected in a growth in the number of customers experiencing a problem and a fall in satisfaction with complaint handling.
Banks & Building Societies
Change from Jan 2020
TourismChange from Jan 2020
TransportChange from Jan 2020
Satisfaction with complaint handling 5.6 -0.9 5.8 -0.7 4.9 -0.3
% experiences rated as right first time 85.5% -0.2% 79.3% -3.1% 74.0% -2.0%
% of customers experiencing a problem with an organisation
11.2% 1.2% 14.4% 4.9% 20.6% 1.2%

23UK Customer Satisfaction Index | January 2021
The drop in customer satisfaction with the Transport sector has been caused mainly by lower average satisfaction for experiences with Airlines
Average customer satisfaction with Airlines fell by 5.2 points to 69.8. The number of customers experiencing a problem with one of the Airlines recorded in the UKCSI grew by 8.6 percentage points, to 23%.
Customer satisfaction with Coach / Bus operators improved by 1.7 points and average satisfaction with Train operators was similar to last year (up 0.3 points).
69.269.5
75.0
69.8
Customer satisfaction index scores out of 100
Jan 20Jan 21
Rail / Train Coach / BusAir
68.570.2
Customer satisfaction in the Transport sector

24 UK Customer Satisfaction Index | January 2021
The top 50 organisations
p Increase in UKCSI score of less than one point q Fall in UKCSI score p Increase in UKCSI score of one point or more
Jan-21 Rank
Organisation SectorJan-21 Score
Jan-20 Score
Jan-20 Rank
Changein scoreJan -20 to Jan -21
1 first direct Banks & Building Societies 85.5 85.4 2 0.1
2 John Lewis Retail (Non-food) 85.1 85.6 1 -0.5
3 M & S (Non-food) Retail (Non-food) 84.1 82.4 18 1.7
4 Amazon.co.uk Retail (Non-food) 83.6 84.1 5 -0.5
5 M & S (food) Retail (Food) 83.5 81.6 28 1.9
6 Tesco Mobile Telecommunications & Media 83.3 81.7 27 1.6
7 Pets at Home Retail (Non-food) 83.2 81.9 24 1.3
8 Netflix Leisure 83.1 82.7 15 0.4
9 Aldi Retail (Food) 82.9 82.3 19 0.6
10 Costa Coffee Leisure 82.8 79.7 67 3.1
11 Specsavers Retail (Non-food) 82.7 78.2 104 4.5
12 LV= Insurance 82.6 83.3 10 -0.7
13 = Mini Automotive 82.5 74.3 187 8.2
13 = Nationwide Banks & Building Societies 82.5 85.0 4 -2.5
15 Premier Inn Tourism 82.4 83.2 11 -0.8
16 Churchill Insurance 82.3 78.6 98 3.7
17 = Caffe Nero Leisure 81.9 78.9 87 3.0
17 = Greggs Leisure 81.9 83.0 12 -1.1
17 = Home Bargains Retail (Non-food) 81.9 81.0 34 0.9
17 = Wilko Retail (Non-food) 81.9 79.4 68 2.5
21 TK Maxx Retail (Non-food) 81.8 77.4 124 4.4
22 Nissan Automotive 81.7 79.8 62 1.9
23 Suzuki Automotive 81.6 84.1 5 -2.5
24 Subway Leisure 81.5 80.7 39 0.8
25 Octopus Energy Utilities 81.4 NO DATA NO DATA NO DATA

25UK Customer Satisfaction Index | January 2021
p Increase in UKCSI score of less than one point q Fall in UKCSI score p Increase in UKCSI score of one point or more
Jan-21 Rank
Organisation SectorJan-21 Score
Jan-20 Score
Jan-20 Rank
Changein scoreJan -20 to Jan -21
26 Jet2holidays.com Tourism 81.3 82.0 23 -0.7
27 = Iceland Retail (Food) 81.1 79.9 60 1.2
27 = Nationwide Insurance Insurance 81.1 80.9 37 0.2
27 = SAGA Insurance Insurance 81.1 80.2 53 0.9
30 Škoda UK Automotive 81.0 80.1 56 0.9
31 = Aviva Insurance 80.9 80.4 45 0.5
31 = Green Flag Services 80.9 80.4 45 0.5
31 = McDonald's Leisure 80.9 80.4 45 0.5
34 = Direct Line Insurance 80.8 82.2 20 -1.4
34 = Ebay Retail (Non-food) 80.8 78.8 91 2.0
34 = Halfords Retail (Non-food) 80.8 NO DATA NO DATA NO DATA
37 Toyota Automotive 80.5 82.2 20 -1.7
38 booking.com Tourism 80.4 80.5 43 -0.1
39 = Amazon Prime Video Leisure 80.3 NO DATA NO DATA NO DATA
39 = Holland & Barrett Retail (Non-food) 80.3 80.3 51 0.0
39 = The Co-operative Bank Banks & Building Societies 80.3 79.8 62 0.5
42 Marriott Tourism 80.2 78.0 110 2.2
43 = Dacia Automotive 80.1 NO DATA NO DATA NO DATA
43 = Spotify Leisure 80.1 80.4 45 -0.3
45 = Ikea Retail (Non-food) 80.0 83.8 7 -3.8
45 = Ocado Retail (Food) 80.0 82.1 22 -2.1
45 = Pizza Express Leisure 80.0 75.3 172 4.7
48 = Scottish Water Utilities 79.9 77.8 118 2.1
48 = Tesco Retail (Food) 79.9 79.4 68 0.5
50 Post Office Public Services (National) 79.8 79.1 80 0.7

26 UK Customer Satisfaction Index | January 2021
first direct is the highest rated organisation in the January 2021 UKCSI. Its score of 85.5 is almost the same as in January 2020 (up 0.1 points).
M & S (Non-food) and M & S (Food) have each received higher UKCSI scores than in January 2020, by 1.7 points and 1.9 points respectively.
With an increase of 1.6 points, Tesco Mobile is among the top 10 highest rated organisations. It is the only Telecommunications & Media sector organisation in the Top 50 organisations.
Mini is the most improved organisation in the January 2021 UKCSI. Its score of 82.5 is 8.2 points higher than in January 2020.
Green Flag (Services) and The Post Office (Public Services National) are the only organisations in their sectors that appear in the top 50. Octopus Energy and Scottish Water are the only Utilities organisations among the 50 highest rated organisations in this UKCSI.

27UK Customer Satisfaction Index | January 2021
Top rated organisations by customer satisfaction dimension
UKCSI dimensions
�rst direct
Amazon.co.uk
John Lewis
Tesco Mobile
M & S (Non-food)
Net�ix
Aldi
M & S (Food)
Costa Coffee
Pets at Home
Home Bargains
Grand Central
Marriott
HastingsDirect
Insurance
Tesco Mobile
O2
B&Q
H&M
Audi
M & S (Food)
AXA
John Lewis
�rst direct
M & S (Non-food)
Pets at Home
M & S (Food)
Mini
Caffe Nero
Dacia
Costa Coffee
Specsavers
John Lewis
�rst direct
M & S (Non-food)
M & S (Food)
Pets at Home
Mini
Nationwide
Net�ix
Aldi
LV=
Dacia
Suzuki
Waitrose
John Lewis
�rst direct
M & S (Food)
Pets at Home
M & S (Non-food)
LV=
Mini
TK Maxx
Tesco Mobile
Churchill
Aldi
ExperienceComplaint Handling
CustomerEthos
EmotionalConnection Ethics
first direct, John Lewis, M & S (Non-food), M & S (Food) and Pets at Home are amongst the highest rated organisations across each of the Experience, Customer Ethos, Emotional Connection and Ethics dimensions of customer satisfaction. John Lewis is the highest rated organisation for the Customer Ethos, Emotional Connection and Ethics dimensions, as it was in the last 2 UKCSI reports, January 2020 and July 2020.
The Complaint Handling dimension features a wider spread of organisations amongst the top performers than the other dimensions. For Complaint Handling, only organisations for whom at least 10 complaints were recorded receive a published score. This means that, whereas for the Experience, Customer Ethos, Emotional Connection and Ethics dimensions every organisation receives a score, organisations generating particularly low levels of complaints may not receive published ratings for satisfaction with complaint handling.

28 UK Customer Satisfaction Index | January 2021
20 most improved organisations
20 most improved organisations over one year
UKCSI score January 2020
UKCSI score January 2021
Change Compared to sector average
Sector
Mini 74.3 82.5 8.2 4.1 Automotive
Southern 56.9 64.7 7.8 -5.2 Transport
London Northwestern Railway 68.7 75.0 6.3 5.1 Transport
Jobcentre Plus 62.3 68.0 5.7 -8.7 Public Services (National)
Abellio Scot Rail 59.3 64.9 5.6 -5.0 Transport
RAC 73.6 79.2 5.6 0.8 Insurance
Seat 73.5 78.3 4.8 -0.1 Automotive
Pizza Express 75.3 80.0 4.7 -0.1 Leisure
CrossCountry 66.5 71.2 4.7 1.3 Transport
Specsavers 78.2 82.7 4.5 2.2 Retail (Non-food)
Thameslink 63.1 67.5 4.4 -2.4 Transport
TK Maxx 77.4 81.8 4.4 1.3 Retail (Non-food)
Severn Trent Water 74.0 78.3 4.3 5.6 Utilities
First Group - bus companies 60.5 64.3 3.8 -5.6 Transport
Churchill 78.6 82.3 3.7 3.9 Insurance
Jaguar 74.1 77.2 3.1 -1.2 Automotive
Costa Coffee 79.7 82.8 3.1 2.7 Leisure
TSB 73.3 76.3 3.0 -2.0 Banks & Building Societies
Currys/PC World 72.3 75.3 3.0 -5.2 Retail (Non-food)
Caffe Nero 78.9 81.9 3.0 1.8 Leisure
Organisation is at least 1 point higher than the sector average Organisation is at least 1 point lower than the sector average
29UK Customer Satisfaction Index | January 2021
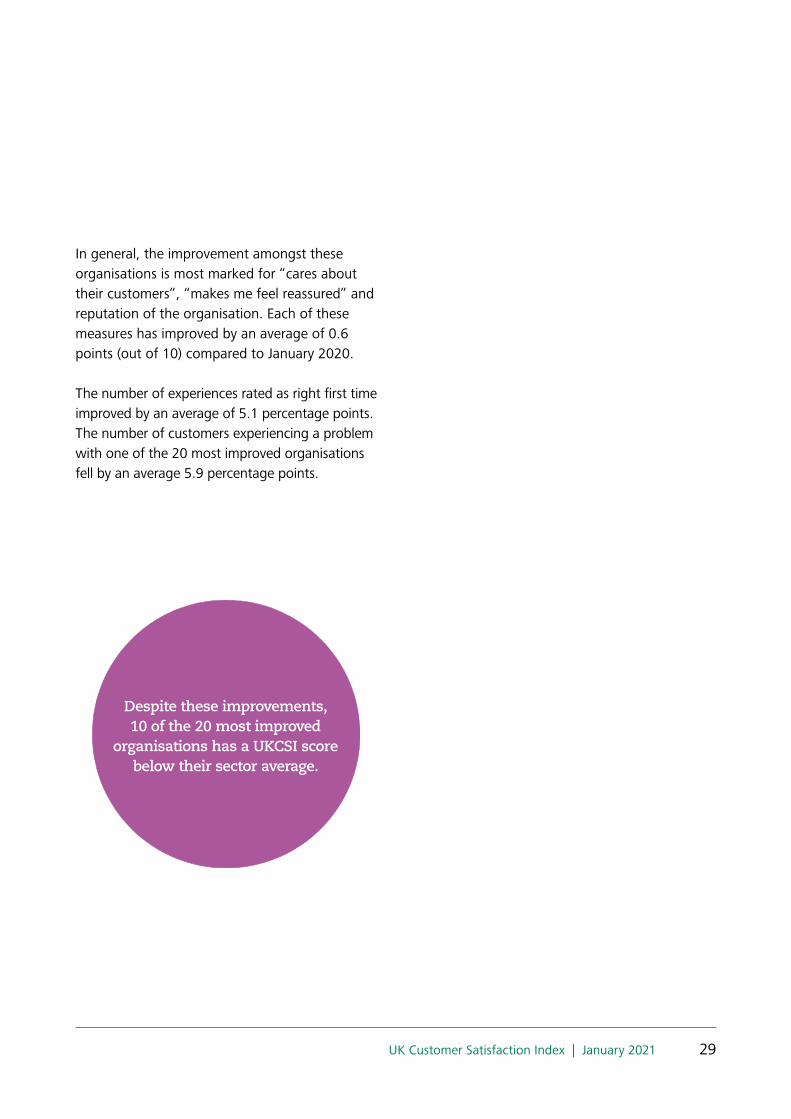
In general, the improvement amongst these organisations is most marked for “cares about their customers”, “makes me feel reassured” and reputation of the organisation. Each of these measures has improved by an average of 0.6 points (out of 10) compared to January 2020.
The number of experiences rated as right first time improved by an average of 5.1 percentage points. The number of customers experiencing a problem with one of the 20 most improved organisations fell by an average 5.9 percentage points.
Despite these improvements, 10 of the 20 most improved
organisations has a UKCSI score below their sector average.

30 UK Customer Satisfaction Index | January 2021
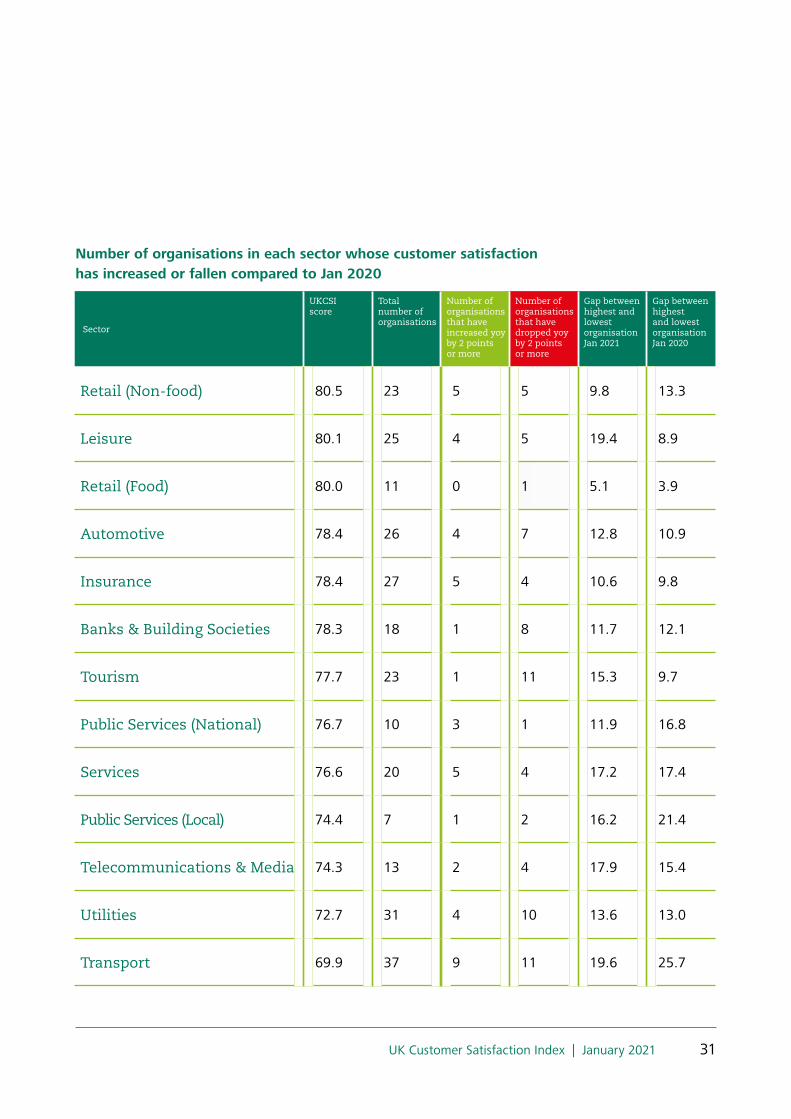
In Banks and Building Societies, Telecommunications and Media, Tourism and Utilities, more than 30% of the companies that received a UKCSI score fell by at least 2 points compared to January 2020. However, this trend does not apply equally to all sectors. In the Public Services (National), Insurance and Services sectors, more organisations improved, than declined, by at least 2 points.
More organisations have declined than improved for customer satisfaction by at least 2 points, compared to January 2020
271Organisations and
organisationtypes in the UKCSI
44Organisationshave improvedyoy by at least
two points
73Organisations
have experienceda yoy drop of
at least 2 points
Number of organisations seeing a change in UKCSI score
15%
11% 10%
18%16%
21%
30%28%
20%
27%
Jan-19 Jul-19 Jan-20 Jul-20 Jan-21
Organisations that have improved their UKCSI score by at least 2 points compared to previous yearOrganisations that have experienced a UKCSI drop of at least 2 points compared to previous year
31UK Customer Satisfaction Index | January 2021
Number of organisations in each sector whose customer satisfaction has increased or fallen compared to Jan 2020
Sector
UKCSI score
Total number of organisations
Number of organisations that have increased yoy by 2 points or more
Number of organisations that have dropped yoy by 2 points or more
Gap between highest and lowest organisation Jan 2021
Gap between highest and lowest organisation Jan 2020
Retail (Non-food) 80.5 23 5 5 9.8 13.3
Leisure 80.1 25 4 5 19.4 8.9
Retail (Food) 80.0 11 0 1 5.1 3.9
Automotive 78.4 26 4 7 12.8 10.9
Insurance 78.4 27 5 4 10.6 9.8
Banks & Building Societies 78.3 18 1 8 11.7 12.1
Tourism 77.7 23 1 11 15.3 9.7
Public Services (National) 76.7 10 3 1 11.9 16.8
Services 76.6 20 5 4 17.2 17.4
Public Services (Local) 74.4 7 1 2 16.2 21.4
Telecommunications & Media 74.3 13 2 4 17.9 15.4
Utilities 72.7 31 4 10 13.6 13.0
Transport 69.9 37 9 11 19.6 25.7

32 UK Customer Satisfaction Index | January 2021
Customer satisfaction and business performance, loyalty and reputation
2

33UK Customer Satisfaction Index | January 2021
Kantar’s research into grocery sales and market share3 shows that take-home sales rose by 9.3% during the 12 weeks to 1 November 2020. Online sales in September 2020 were up 76% compared to September 2019, with one in five households ordering groceries via the internet and online sales accounting for 12.5% of all Retail (food) sales. These trends are reflected in the customer responses gathered for the UKCSI in the Retail (Food) sector. The proportion of experiences conducted via an organisation’s website is 14.7%, 3.4 percentage points more than in January 2020.
As well as the rise in online sales, Kantar reported 14% growth in frozen food sales and an increase in food consumption at home, influenced by the continuing presence of the COVID-19 virus, restrictions on opening hours in the hospitality sector and the winding-down of the Government’s Eat Out to Help Out scheme.
Overall customer satisfaction in the Retail (Food) sector is 80.0 (out of 100), almost the same (0.1 points higher) as in January 2020 and up slightly (by 0.4 points) compared to July 2020. Despite this apparent stability, there has been a spike in the number of customers experiencing a problem with an organisation, up 2.2 percentage points to 13.9%, the highest level recorded for the sector.
Over a third of customers’ problems (34.3%) were concerned with availability of products / services: this proportion is broadly in line with previous UKCSI surveys. However, the scale of problems felt by customers may not be fully visible to organisations. Compared to the other 12 UKCSI sectors, Retail (Food) has the highest proportion of customers who have experienced a problem but don’t make a complaint. In general, the growth in website experiences appears to have contributed to higher customer satisfaction in the sector. Average satisfaction for experiences through an organisation’s website rose by 1.1 points to 82.3 compared to January 2020. Nevertheless, across the Retail (Food) sector, most customer experiences are in person. Average customer satisfaction with in person experiences is 80.9, up 0.4 points compared to January 2020.
Customer satisfaction and sales growth in the Retail (Food) sector
3 See www.kantar.com/uki/inspiration/fmcg/2020-uk-shoppers-keep-a-close-eye-on-christmas-as-lockdowns-return/

34 UK Customer Satisfaction Index | January 2021
Retail (Food) January 2021 UKCSI = 80.0
UKCSI score
0%
5%
10%
15%
20%
25%
30%
35%
40%
76 77 78 79 80 81 82 83 84
Ann
ual s
ales
gro
wth
fo
r th
e 12
wee
ks e
ndin
g 1
No
vem
ber
2020
Sour
ce:
Kan
tar
Wo
rldp
anel
Aldi
Ocado
Co-op Food
Waitrose
Sainsbury's
Iceland
Tesco
ASDA
MorrisonsLidl
Customer satisfaction and sales growth: the Retail (Food) sector
Food retailers withUKCSI at least
1 point above sector average
12.3%
Food retailers withUKCSI within + / - 1 point
of sector average
14.4%
Food retailers withUKCSI at least 1 pointbelow sector average
9.6%

35UK Customer Satisfaction Index | January 2021
All food retailers4 that appear in both the UKCSI and Kantar’s market share research have witnessed annual sales growth of at least 5%. Organisations with a UKCSI score at least 1 point higher than the Retail (Food) sector average have a higher growth rate (12.3%) than those with a UKCSI that is at least 1 point below the sector average (9.6%).
The relationship between organisations’ levels of customer satisfaction and sales growth is less pronounced than it was before the COVID-19 pandemic. However, a closer examination of trends relating to individual organisations shows that some have benefited more than others from the shift to online food shopping.
4 Note: M & S (food) is the highest rated food retailer in the UKCSI but is not included in Kantar’s analysis of sales growth and market share
Ocado and Iceland have both the highest proportion and highest average customer satisfaction for website experiences, compared to other food retailers in the UKCSI.
Ocado has been a leading beneficiary of the growth in online sales. According to Kantar’s research it was the fastest growing retailer, with sales up by 36.1%, increasing its market share to 1.7%. Although, Ocado’s customer satisfaction (80.0) is 2.1 points below its January 2020 level, it has improved by 1.3 points compared to July 2020.
Customer satisfaction trends in the Retail (Food) sector
SectorJan-21 Jul-20 Jan-20 Change
compared to Jan 2020
Change compared to July 2020
Retail (Food) sector average 80.0 79.6 79.9 0.1 0.4
M & S (food) 83.5 83.5 81.6 1.9 0.0
Aldi 82.9 82.9 82.3 0.6 0.0
Iceland 81.1 80.3 79.9 1.2 0.8
Ocado 80.0 78.7 82.1 -2.1 1.3
Tesco 79.9 79.2 79.4 0.5 0.7
Sainsbury's 79.7 78.8 80.1 -0.4 0.9
Co-op Food 79.6 79.5 80.6 -1.0 0.1
Waitrose 79.6 78.2 80.2 -0.6 1.4
Morrisons 78.8 77.8 78.6 0.2 1.0
ASDA 78.4 78.2 78.9 -0.6 0.2
Lidl 78.4 78.6 78.4 0.0 -0.2
Increase in UKCSI score of one point or more Fall in UKCSI score of one point or more

36 UK Customer Satisfaction Index | January 2021
Iceland’s sales rose by 17.9%. Kantar’s research suggests that this growth was not confined to frozen food products but extended to Iceland’s wider product range. Iceland customers’ average spend per trip was worth 44% more than in 2019, the biggest increase of any retailer. In the UKCSI, average satisfaction with Iceland was 81.1, 1.2 points more than a year ago. Indeed, Iceland is the third highest rated food retailer for customer satisfaction, after M & S and Aldi.
Waitrose’s annual sales growth was 10.6%. Its online sales grew faster than any other food retailer and its market share rose for the first time since 2017, to 5.1%. Customer satisfaction with Waitrose, 79.6, is 0.6 points lower than a year ago but it has improved by 1.4 points on its July 2020 level.
Tesco has the highest customer satisfaction of the big four supermarkets, 79.9. Its sales rose by 9.1% and its market share is unchanged. Morrisons had the highest sales growth of the big four, 11.4%. Although average customer satisfaction with Morrisons (78.8) is below the sector average (80.0), it is 1 point higher than in July 2020.
These results for sales growth and customer satisfaction in the Retail (Food) sector confirm that online experiences have grown in prominence. This trend has benefited organisations with an established online presence and infrastructure, as well as creating growth opportunities across the sector. However, the relatively high numbers of customers experiencing problems demonstrates that many organisations face challenges in managing stock, supply chains and scaling up deliveries. In the coming months, the ability to respond to and deliver on customer demand will become increasingly crucial both for customer satisfaction and sustainable sales growth.

37UK Customer Satisfaction Index | January 2021
In this UKCSI we have reviewed data from the latest Current Account Switching Service (CASS) dashboard5, covering switches completing between 1 April and 30 June 2020, with the corresponding UKCSI period (July 2020).
Banks or building societies whose customer satisfaction was at least 1 point better than the sector average recorded an average of 2,677 net current account gains, compared to 1,794 net losses for those with a UKCSI score at least 1 point below the sector average.
Banks & Building Societies: higher customer satisfaction and current account gains
Banks & Building Societies average UKCSI July 2020 = 79.1
-20,000
-10,000
0
10,000
20,000
72 74 76 78 80 82 84 86
Cur
rent
Acc
ount
Net
Gai
ns /
Loss
es
UKCSI July 2020
Nationwide
TSBThe Co-operative
Bank
SantanderHalifax
Lloyds
NatWest
HSBC
Bank of Scotland
Barclays
Starling Bank
Tesco
RBS
Average current account quarterly net gains
5 Current Account Switching Service (CASS) Dashboard Issue 28
Banks & Building Societies with UKCSI within 1 point
( +/- ) of sector average
Banks & Building Societies witha UKCSI at least 1 point above
sector average
Net current account gains Net current account losses
2,677 -10,019
Banks & Building Societieswith a UKCSI at least 1 point
below sector average
Net current account losses
-1,794

38 UK Customer Satisfaction Index | January 2021
6 Note: Monzo achieved the second highest number of net current account gains, after Starling Bank, but it did not receive sufficient responses to receive a UKCSI score. HSBC’s current account gains include the HSBC, first direct and M & S Bank brands.
Amongst the organisations that feature in both the UKCSI and the CASS dashboard, Starling Bank, Nationwide and NatWest achieved the most net current account gains6. Each of these organisations received a UKCSI score higher than the sector average. The relatively large number of net current account losses amongst organisations with a UKCSI score within a point (higher or lower) of the sector average is due significantly to the performance of Santander (12,532 net current account losses) and Halifax (10,019 net current account losses).
The number of customers switching current accounts fell during May and June because of the COVID-19 pandemic but since July 2020 has increased month by month. In the final quarter of 2020, CASS launched an advertising campaign to encourage individuals and businesses to take charge of their money, reduce financial stress and find the most appropriate bank account. In future UKCSI reports we will review the impact of this campaign and continue to monitor the relationship between customer satisfaction and current account switches.

39UK Customer Satisfaction Index | January 2021
A 9 or 10 out of 10 for customer satisfaction drives greater loyalty, recommendation and trust
Across the average of all organisations in the UKCSI, achieving a 9 or 10 (out of 10) for customer satisfaction has a much stronger effect even than an 8 out of 10 in generating the highest levels of trust, recommendation, loyalty and reputation.
Trust% of customers who give an
organisation a 9 or 10trust rating
Recommendation% of customers scoring an organisation
9 or 10 on likelihood to recommend
Open and transparent% of customers who give a 9 or 10 rating
Customers who scorean organisation 9 or 10 out of 10
for customer satisfaction
Customers who scorean organisation 8 - 8.9 out of 10
for customer satisfaction
Loyalty% of customers scoring an organisation
9 or 10 on intention to remain a customer
Reputation% of customers who give an organisation a
9 or 10 when asked “how would you ratethe reputation of this organisation”
94% 38%
96% 46%
94% 54%
97% 64%
84% 35%

40 UK Customer Satisfaction Index | January 2021
Customer satisfaction during the COVID-19 crisis
3

41UK Customer Satisfaction Index | January 2021
The customer data used in the January 2021 UKCSI is based on survey fieldwork collected immediately before and during the first national lockdown (16 March to 13 April 2020) and between 14 September and 12 October 2020.
The UKCSI normally focuses on interpreting year on year and longer-term trends in customer satisfaction. But, given the extraordinary operating environment created by the COVID-19 crisis, we have also reviewed how customer satisfaction has evolved through the COVID-19 pandemic by examining data about customer experiences from the specific time periods in which the research was conducted.

42 UK Customer Satisfaction Index | January 2021
Overall customer satisfaction was slightly lower in autumn 2020 than in spring. In the Retail sectors average satisfaction improved but it fell for Public Services
76.9 77.0 77.076.8
Jan 2020 UKCSI Responses given16 March - 13 April 2020
July 2020 UKCSI Responses given14 Sept - 12 Oct 2020
Jan 2021 UKCSI
Index scores out of 100
Customer responsesthat make up the January 2021 UKCSI
Lockdownstarts
23 March
Non-essentialRetail re-opens
15 June
Eat Outto Help Out
scheme3-31 August
Three-tierrestrictions
introduced in England12 October
76.6

43UK Customer Satisfaction Index | January 2021
Since the first COVID-19 national lockdown in March 2020, average levels of customer satisfaction in most sectors is consistent with their broader year on year trend.
For example, customer satisfaction in the Banks and Building Societies and Tourism sectors has continued to decline and was lower for data collected in September / October 2020 than it was in March / April 2020. Average satisfaction with the Insurance and Leisure sectors is generally flat, notwithstanding significant differences in the customer satisfaction ratings of individual organisations.
The Retail (Food), Retail (Non-food), Automotive and Utilities sectors all have higher levels of satisfaction for experiences recorded in September / October 2020 compared to those in March / April 2020.
However, the Public Services (Local) and Public Services (National) sectors show a different trajectory since the March 2020 lockdown than their year-on-year trends would suggest. Whilst both Public Service sectors have better customer satisfaction in the January 2021 UKCSI than they did a year ago, each has lower customer satisfaction for experiences recorded in September / October 2020 than in March / April 2020. This evidence appears to confirm that the evolving COVID-19 crisis continues to create significant challenges for Public Services organisations and their customers.

44 UK Customer Satisfaction Index | January 2021
Customer satisfaction by sector during the COVID-19 crisisOverall CSI Jan 2020
UKCSIResponses given16 March -13 April2020
July 2020 UKCSI
Responses given14 Sept -12 Oct2020
Jan 2021 UKCSI
yoy change
Change between March / April 2020 andSept / Oct 2020 responses
UK all-sector average 76.9 77.0 77.0 76.6 76.8 -0.1 -0.4
Automotive 78.4 77.9 78.3 78.8 78.4 0.0 0.9
Banks & Building Societies 79.5 78.7 79.1 77.9 78.3 -1.2 -0.8
Insurance 78.4 78.5 78.6 78.4 78.4 0.0 -0.1
Leisure 80.0 80.1 80.2 80.0 80.1 0.1 -0.1
Public Services (Local) 73.6 76.1 75.3 72.7 74.4 0.8 -3.4
Public Services (National) 75.2 76.9 76.1 76.5 76.7 1.5 -0.4
Retail (Food) 79.9 79.4 79.6 80.7 80.0 0.1 1.3
Retail (Non-food) 80.3 80.2 80.0 80.9 80.5 0.2 0.7
Services 76.7 77.4 77.1 76.0 76.6 -0.1 -1.4
Telecommunications & Media 74.8 74.0 74.2 74.5 74.3 -0.5 0.5
Tourism 79.5 78.1 78.6 77.3 77.7 -1.8 -0.8
Transport 71.2 71.0 71.4 68.8 69.9 -1.3 -2.2
Utilities 72.3 72.3 72.6 73.1 72.7 0.4 0.8

45UK Customer Satisfaction Index | January 2021
Anecdotal feedback from Institute members and other organisations suggests that many organisations saw an upsurge in customer satisfaction in surveys they conducted in the weeks following the lockdown introduced on 23 March 2020. Customers appreciated the efforts of organisations to maintain continuity of their service and the care shown by frontline employees. Many organisations increased their proactive communications with customers, who were perhaps relatively tolerant of problems, delays or lack of availability of products and services.
The latest evidence from the UKCSI suggests that customer attitudes have shifted, with important implications for customer service.
A consistent focus on delivery of the essentials of customer service across the range of channels used by their customers will be critical. Organisations need to understand and engage with changing customer behaviours and needs, that are often driven by changes in personal circumstances. Organisations will need to provide reassurance, personalised care and advice and where appropriate, demonstrate flexibility.
In the next chapter, we examine changing customer behaviours and well-being and how this has influenced their relationships with organisations.

46 UK Customer Satisfaction Index | January 2021
Changing customer behaviours and well-being
4

47UK Customer Satisfaction Index | January 2021
In this section, we examine how customer needs and behaviours have changed during the COVID-19 pandemic and the likelihood that these changes will persist. We also investigate the extent to which customers’ financial, mental or physical well-being has been affected by the pandemic and how this influences their relationships with organisations.
Our evidence suggests that there have been significant shifts in customer behaviour during the COVID-19 pandemic, many of which are likely to endure.
In addition, many customers have experienced changes in their personal well-being, either from a financial, mental or physical health perspective. Our research shows that most people feel their level of well-being is relatively stable. Nevertheless, there is a wide spread of customers - across all age groups, income brackets and regions - whose financial, mental or physical well-being has either improved or deteriorated.Moreover, customers in certain age groups and income brackets appear to have been particularly affected by changes in personal well-being. Many of these customers also fear that they will be financially worse off in the next 6 months.
Our evidence suggests that there have been significant shifts in customer
behaviour during the COVID-19 pandemic, many of which are
likely to endure
48 UK Customer Satisfaction Index | January 2021
More than 30% of customers have made more online purchases and thought more carefully about how they spend during the COVID-19 pandemic
In addition, over 20% of customers have reduced their spending, either to save more, or because they have less money to spend.
There appears to be a strong likelihood that these shifts in behaviour will continue to influence customers’ relationships with organisations. More than 85% of those customers who now think more carefully about their spending, have tried to reduce their spend, shop around more to get the best deals, spend more with local, independent companies or with companies they trust, say that these behaviours will continue.
How have your spending habits changed during the COVID-19 pandemic?
I've done this more duringthe COVID-19 pandemic
Will continue inthe next year
I’ve chosen to spend more with ethical companies
I’ve avoided making big expensive purchases(car, home improvements)
I’ve chosen to spend money with companies I trust
I’ve chosen to spend money with local,independent companies
I’ve shopped around more to make sureI’m getting the best deals
I’ve made fewer impulse purchases
I’ve tried to reduce what I’m spending– because I have less to spend
I’ve tried to reduce what I’m spending– so that I can save more
I’ve thought more carefully about what I spend money on
I’ve bought more online 32.6%
30.4%
22.6%
20.0%
19.5%
18.9%
15.6%
11.6%
11.6%
6.6%
82.0%
88.9%
86.8%
87.3%
84.4%
87.9%
86.7%
85.6%
75.1%
81.3%

49UK Customer Satisfaction Index | January 2021
The growth in online retail is a general trend but appears to be especially marked amongst older customers
At least 43% of customers aged 65 and over and at least 33% of those aged 45 – 64 have made more online purchases in the past 6 months.
27.3%
22.1%
26.2%
33.0%
37.3%
45.8%
43.4%
18 to 24 25 to 34 35 to 44 45 to 54 55 to 64 65 to 79 80 and above
% of customers in each age group who have made more online purchases in the last 6 months

50 UK Customer Satisfaction Index | January 2021
Changes in customer behaviour have often been influenced by changes in financial circumstances
Customers who feel they have become financially worse off during the COVID-19 pandemic are more likely than average to have cut back and thought more carefully about their spending, bought more online and avoided big ticket purchases.
Customers who say they have become financially better off since the onset of COVID-19 are more likely than average to have spent money with companies they trust, or with ethical companies. The reduction in their spending has enabled them to save more.
I’ve become financially better offin the last 6 months
I’ve become financially worse offin the last 6 months
I’ve chosen to spend more with ethical companies
I’ve chosen to spend money with companies I trust
I’ve chosen to spend money with local, independent companies
I’ve avoided making big expensive purchases(car, home improvements)
I’ve shopped around more to make sure I’m getting the best deals
I’ve reduced my spending and have saved more
I’ve made fewer impulse purchases
I’ve tried to reduce what I’m spending because I have less to spend
I’ve thought more carefully about what I spend money on
I’ve bought more online37.9%
33.4%
36.9%
31.2%
36.7%
24.5%
27.3%
19.6%
23.2%
29.9%
22.9%
20.7%
18.4%
11.0%
15.3%
18.1%
9.6%
16.3%
5.8%
10.6%
Contrasting levels of behaviour change during the COVID-19 pandemic

51UK Customer Satisfaction Index | January 2021
28.4% of customers described their current well-being as poor or very poor on at least one dimension of either financial, mental or physical health
In this UKCSI we asked customers about their current level of financial, mental, physical well-being and whether they feel their well-being has deteriorated since March 2020. We also asked about whether they expect their personal financial situation to improve in the next 6 months.
9%
9%
8%
Other customers
Very poor / poor well-being on 1 of the 3 dimensions(�nancial, mental, physical)
Very poor / poor well-being on 2 out of the 3 dimensions(�nancial, mental, physical)
Very poor / poor well-being on all 3 dimensions(�nancial, mental, physical)
4.4%
7.6%
16.4%
71.7%
How would you describe your current financial, mental and physical well-being?

52 UK Customer Satisfaction Index | January 2021
Where each of the dimensions of well-being – financial, mental and physical health – are considered separately, at least 14% of customers say they are experiencing very poor or poor well-being.
% poor / very poor % average % very good / good
Your physical well-being
Your mental well-being
Your �nancial well-being
14.5% 37.3% 47.2%
15.2% 32.1% 51.7%
15.0% 33.7% 50.6%
How would you describe your current level of well-being?
53UK Customer Satisfaction Index | January 2021
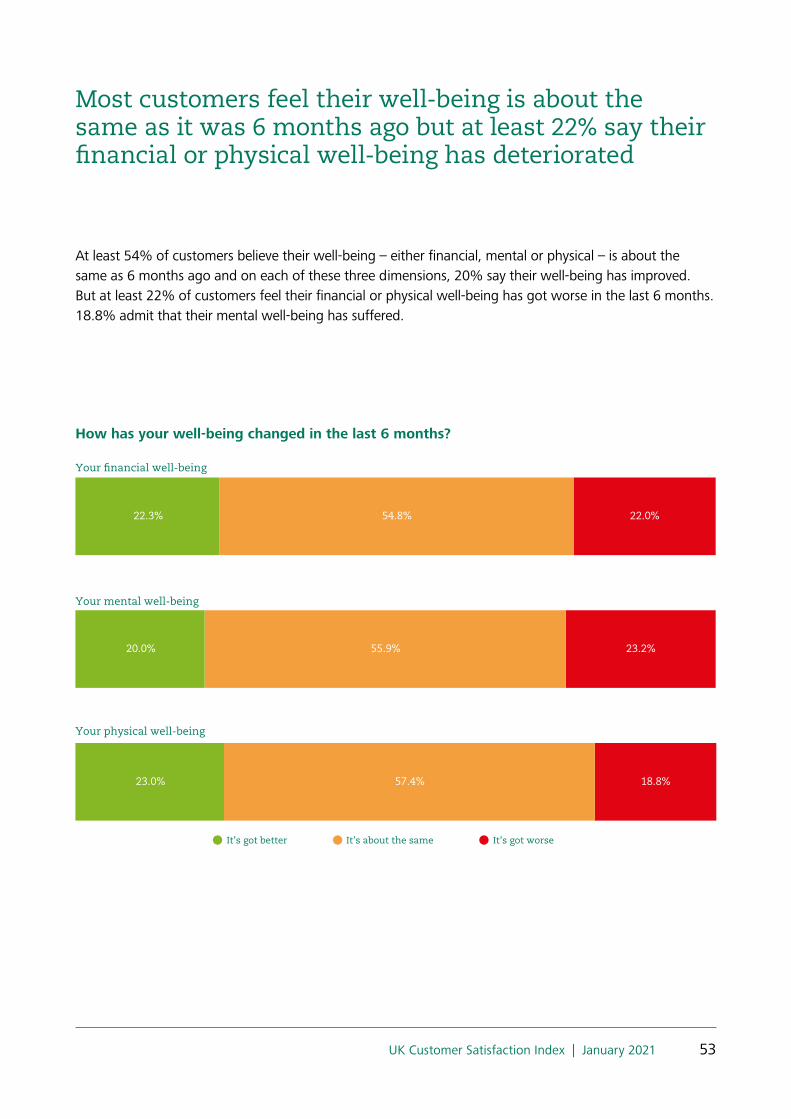
Most customers feel their well-being is about the same as it was 6 months ago but at least 22% say their financial or physical well-being has deteriorated
At least 54% of customers believe their well-being – either financial, mental or physical – is about the same as 6 months ago and on each of these three dimensions, 20% say their well-being has improved. But at least 22% of customers feel their financial or physical well-being has got worse in the last 6 months. 18.8% admit that their mental well-being has suffered.
How has your well-being changed in the last 6 months?
It’s got better It’s about the same It’s got worse
Your mental well-being
Your physical well-being
23.0% 57.4% 18.8%
20.0% 55.9% 23.2%
Your �nancial well-being
22.3% 54.8% 22.0%

54 UK Customer Satisfaction Index | January 2021
Changes in well-being have affected some groups of customers more severely than others
Across all age groups, income brackets and regions there is a spread of people whose financial, mental, or physical well-being has improved, remained stable or deteriorated during the COVID-19 pandemic. However, there is evidence that the impact of COVID-19 has sharpened polarisation and inequality in society. Certain age groups and levels of household income appear to have been particularly affected by changes in personal well-being.
Customers aged 18 – 44, and those with an annual household income of at least £50,000 are more likely than average to have better well-being than 6 months ago.
Customers aged 45 – 64 and those with an annual income below £20,000 are the most likely to say their financial or mental well-being has deteriorated in the last 6 months.
People with a disability or long-term health condition are more likely than average to have experienced a decline in their financial, physical and mental well-being.

55UK Customer Satisfaction Index | January 2021
At least 5 points better than average At least 5 points worse than average
Has your well-being got better or worse in the past 6 months?
Your financialwell-being
Your mentalwell-being
Your physicalwell-being
Better Worse Better Worse Better Worse
Overall 22.3% 22.0% 20.0% 23.2% 23.0% 18.8%
Aged 18 to 24 29.4% 26.6% 30.4% 25.4% 33.8% 20.8%
Aged 25 to 34 38.5% 19.0% 37.6% 19.8% 40.2% 14.0%
Aged 35 to 44 30.8% 21.0% 29.4% 21.9% 33.6% 16.3%
Aged 45 to 54 16.3% 27.0% 13.3% 28.7% 16.7% 21.2%
Aged 55 to 64 12.7% 27.0% 11.0% 26.6% 13.2% 22.5%
Aged 65 to 79 11.4% 15.3% 5.9% 19.1% 8.4% 18.9%
Aged 80 and above 11.8% 13.2% 6.6% 11.8% 9.2% 28.9%
Household income up to £20,000
23.5% 32.3% 23.1% 28.0% 24.5% 22.3%
Household income £20,001- 50,000
23.2% 24.7% 21.9% 24.8% 24.9% 18.3%
Household income £50,001 – 75,000
33.7% 15.5% 29.5% 17.5% 35.6% 12.7%
Household income £75,001 - £100,000
44.0% 14.7% 37.1% 16.1% 38.6% 12.3%
Household income More than £100,000
42.2% 8.7% 38.0% 14.4% 41.4% 9.1%
Customers with a disability or long- term health condition
19.6% 24.8% 16.1% 30.5% 16.8% 31.6%

56 UK Customer Satisfaction Index | January 2021
21.3% of customers predict they will be financially worse off in the next 6 months
15.1% of customers believe they will be financially better off in 6 months’ time. 21.3% fear they will be worse off. Most customers, 56%, believe that in 6 months their financial situation will be about the same as it is now.
People aged between 18 and 34 and the most affluent customers (with an annual household income exceeding £75,000) are the most likely to feel that they will be better off financially in the next 6 months.
Customers aged 45 – 64, those with an annual income under £20,000 and people with a disability of long-term health condition are more likely than average to feel that they will be financially worse off in 6 months.
Customers with a disability or long term health condition
More than £100,000
£75,001 - £100,000
£50,001 – 75,000
£20,001- 50,000
Up to £20,000
80 and above
65 to 79
55 to 64
45 to 54
35 to 44
25 to 34
18 to 24
Overall %
Better off The same Worse off Don’t know
15.1% 56.0% 21.3% 7.6%
24.9% 52.4% 14.3% 8.4%
23.9% 55.0% 13.7% 7.4%
17.2% 57.0% 18.5% 7.4%
13.0% 51.5% 26.3% 9.2%
8.2% 54.4% 28.4% 9.0%
10.0% 63.0% 21.9% 5.1%
9.2% 61.8% 23.7% 5.3%
17.4% 46.4% 27.5% 8.8%
15.1% 56.6% 22.0% 6.3%
16.1% 65.6% 14.0% 4.4%
25.7% 58.0% 13.4% 2.9%
34.2% 49.4% 13.3% 3.0%
13.2% 52.7% 25.6% 8.5%
Do you expect to be financially better off or worse off in the next 6 months?

57UK Customer Satisfaction Index | January 2021
More than 50% of people currently experiencing low financial well-being expect to be worse off in the next 6 months
Expect to be �nanciallybetter off
Expect my �nancial well-beingto be the same
Expect to be �nanciallyworse off
Don’t know
Customers whose current �nancial well-being is very poor or poor
Customers who describe their current �nancial well-being as "average"
Customers whose current �nancial being is very good / good
22.3% 64.0% 9.3% 4.3%
8.6% 56.8% 25.2% 9.3%
8.5% 30.2% 50.7% 10.6%
How do you expect your financial situation to change in the next 6 months?

58 UK Customer Satisfaction Index | January 2021
Making it easier to contact the right person to help, better website navigation, speed of response and more helpful, knowledgeable staff are key issues organisations should improve
Our research asked customers to identify the key issues that the organisation they interacted with should improve. Whether or not customers are experiencing low levels of financial, mental or physical well-being, they want organisations to make it easier to contact the right person to provide help, improve website navigation and develop helpful and knowledgeable staff. Customers who say their personal well-being is relatively low appear to be more likely than others to prioritise making it easier to contact the right person to help, speed of response / resolution and greater availability of staff.
UK average (all customers)
Customers with poor / very poorwell-being on at least 2 offinancial, mental,physcial dimensions
Transparency
Punctuality
Better choice of ways to contact them
Access to information on social media
Billing
Better App design
Product / service range
Have more staff available
Availability of product / service
Speed of response / resolution
Reliability of product / service
Quality of product / service
More knowledgeable staff
More friendly / helpful staff
Better website navigation
Make it easier to contact the right person to help me15.1%
13.5%
11.6%12.9%
10.4%12.2%
8.4%11.3%
8.7%10.1%
9.2%9.6%
11.3%9.1%
7.7%8.5%
8.7%7.8%
7.2%7.6%
6.8%7.5%
5.7%5.7%
5.0%5.5%
4.1%5.4%
4.9%5.1%
6.4%5.4%
What are the top 3 things the organisation you dealt with should improve?

59UK Customer Satisfaction Index | January 2021
Changing customer behaviour and well-being during the COVID-19 crisis: Key takeouts
• More than 30% of customers have made more online purchases and thought more carefully about how they spend during the COVID-19 pandemic
• Most customers feel their well-being is about the same as it was in March 2020 but at least 22% say their financial or physical well-being has deteriorated
• Customers aged 18 – 44, and those with an annual household income of at least £50,000 are more likely than average to have better well-being than in March 2020
• Customers aged 45 – 64 and those with an annual household income below £20,000 are more likely than average to say their financial or mental well-being has deteriorated since March 2020
• People with a disability or long-term health condition are more likely than average to have experienced a decline in their financial, physical and mental well-being.
• In the next 6 months, more customers predict that they will be financially worse off (21.3%) than better off (15.1%)
• More than 50% of people currently experiencing low financial well-being expect to be worse off in the next 6 months
• Customers who say their personal well-being is relatively low identify the key issues organisations should improve as making it easier to contact the right person to help, better website navigation, speed of response / resolution and developing more helpful, knowledgeable staff.

60 UK Customer Satisfaction Index | January 2021
Recommendations for organisations
5

61UK Customer Satisfaction Index | January 2021
Make it easy for customers to contact your organisation and access help1
Communicate and engageproactively with your customers2
Be responsive to customers’personal context3
Prioritise and plan for theneeds of vulnerable customers4
Develop a culture ofagility and innovation7
Assess your customers’changing priorities and needs8
Focus on short and long termrisk and performance9
Take care of employees’ well-being6
Maintain a focus ondelivery and logistics5 Maintain a focus ondelivery and logistics5
Our research concludes with 9 recommendations and key actions for organisations
to improve their customer service and respond to
changing customer needs and behaviours.

62 UK Customer Satisfaction Index | January 2021
1) Make it easy for customers to contact your organisation and access help
• Communicate proactively and transparently how best customers should communicate with you, about what kind of issue, and how you will keep them informed
• Provide the widest practical range of channels for customers to use. Consider the needs of customers who are less familiar with online or App-based contact methods
• Track the hand-offs between channels in a single customer journey. Diagnose “pain points” or inconsistencies that increase customer effort or prevent customers achieving their objectives
• Measure your speed of response, time to resolve customer issues and the number of experiences that are resolved right first time from the customer’s perspective
• Test and improve the quality and ease of use of your online experience
• Ensure your organisation is resourced to enable customers to access help when they need it
• Design customer journeys from a customer perspective, ensuring that there is always the opportunity to speak to a person when it is needed.
2) Communicate and engage proactively with your customers
• Provide clear information through all relevant channels about how to access services, support and advice, including any changes your organisation has put in place because of the COVID-19 crisis
• Ensure the tone of your communications is direct, straightforward, relevant and respectful. Avoid sounding either too corporate or overfamiliar
• Give customers the opportunity to provide feedback and raise concerns about their experiences with your organisation
• Set clear expectations about when and how you will keep customers informed about the progress of an issue. Make sure you honour a commitment to contact a customer
• Investigate opportunities to communicate content that helps customers better manage their relationship with your organisation and improve their well-being more broadly, especially during the COVID-19 pandemic.

63UK Customer Satisfaction Index | January 2021
3) Be responsive to customers' personal context
• Listen and empathise. Allow customers to explain their situation and how it has impacted them, especially if their personal circumstances have changed during the COVID-19 pandemic
• Be sensitive, respectful and reassuring. Acknowledge the feelings and emotions expressed by customers; demonstrate that you have heard and that you care
• Where appropriate, research a customer’s account history so that you have a full picture of their circumstances and interactions with you. If you need more information to reach a fair and appropriate outcome, encourage the customer to provide more information about their circumstances
• Focus on getting things right first time, both for customers and other colleagues, to avoid causing unnecessary effort or stress
• Use the flexibility that your organisation allows to reach outcomes and solutions that are tailored to an individual customer’s circumstances. Where necessary, challenge existing processes in order to generate solutions that meet customer needs and are commercially appropriate for your organisation
• Identify opportunities for personalising experiences that will make experiences easier for customers and enhance integration across channels.

64 UK Customer Satisfaction Index | January 2021
4) Prioritise and plan for the needs of vulnerable customers
• Take into account the needs of vulnerable customers in designing customer journeys, especially for changes in service put in place because of the COVID-19 crisis
• Publish transparent policies and guidance about the help available to vulnerable customers
• Provide guidance on sensitive issues, such as physical, mental or financial well-being that enable customers to self-serve and give them an option to identify themselves as being “vulnerable”
• Encourage customers to share information about their needs and personal circumstances so that your organisation is better able to help them and they will not need to repeat information in future
• Identify measures you will put in place,
such as deferred or reduced payments and employee authority levels, to recognise the exceptional circumstances affecting customers
• Enable vulnerable customers, or their delegated representative to register on a priority contact scheme in case essential services are disrupted
• Ensure processes, training and development is in place so that the needs of vulnerable customers are managed consistently across your organisation
• Make sure that employees have sufficient time to deal appropriately with customers and that this is reflected in performance management
• Where necessary, engage with external organisations such as specialist charities, to access training or inform and validate your approach.

65UK Customer Satisfaction Index | January 2021
5) Maintain a focus on delivery and logistics
• Continually update demand and resource forecasts so that you align resource to meet changes in customer needs and the volume of demand
• Develop collaborative partnership relationships with key suppliers
• Ensure you have processes to update customer data accurately and with timeliness
• Review resilience of your supply and delivery chain and identify contingency options
• Continually monitor reliability of your delivery to customers, identify issues and take rapid remedial action.

66 UK Customer Satisfaction Index | January 2021
6) Take care of employees’ well-being
• Maintain and update a risk assessment appropriate to your workplaces
• Promote personal hygiene and the facilities to enable it
• Communicate and consult proactively with employees about safety measures, changes to working arrangements and job roles
• Enable appropriate social distancing at your organisation’s premises and workplaces. Provide guidance about social distancing when employees are required to visit customers, suppliers or other organisations
• Maintain a schedule of regular one to one meetings and team meetings / briefings that is appropriate to your operational environment
• Maintain a dialogue with employees about issues that affect the customer experience or collaboration with colleagues. Where possible give employees a say on practical issues that affect them such as changes to shift patterns, allocation of tasks, or the best way of receiving communications
• Understand and engage with employees’ concerns about travelling to and from work. Where possible schedule work patterns so that employees don’t need to travel at peak times. Remind employees to maintain social distancing, if possible, during their journey and to wash or sanitise hands before and after travelling on public transport
• Ensure your organisation has guidance and processes in place to equip employees to deal appropriately with abusive customers
• Encourage employees proactively to manage their mental health and well-being. Make sure they are aware of the support your organisation provides including line manager support, information resources, an employee helpline or counselling service
• Give recognition for team and individual efforts, especially for those undertaking extra or new responsibilities. Be specific and genuine about your feedback and explain the benefits for customers, the team and the organisation.

67UK Customer Satisfaction Index | January 2021
7) Develop a culture of agility and innovation
• Recruit employees from diverse backgrounds
• Recruit for an appropriate mix of attitude, intellectual curiosity, experience and technical expertise
• Encourage employees to submit ideas to improve your service, generate savings or new opportunities. Respond to all ideas submitted by employees
• Develop your managers’ ability to listen, coach, give feedback and delegate
• Promote use of collaboration tools that enable employees to share problems, solutions and learnings
• Hold brainstorm / innovation sessions with diverse groups of employees, customers, trusted suppliers or partners
• Define the skills and capabilities your organisation requires to promote innovation and implement ideas
• Review how employees across the organisation access knowledge and data resources
• Enable employees to move between different areas or functions in the organisation as part of a development and career pathway
• Explore partnerships with schools, colleges or universities to nurture talent
• Look for ideas and examples of innovation from organisations both inside and outside your sector
• Involve customers in the concept, design and testing of new services or technologies.

68 UK Customer Satisfaction Index | January 2021
8) Assess your customers’ changing priorities and needs
• Understand how and why your customers interact with you and the extent to which they achieve their objectives
• Use a range of insight methods to understand your customers’ immediate and evolving needs and behaviours and how they influence their relationship with your organisation
• Define and map your customer experience and identify key gaps
• Test the customer experience your organisation provides, across different products and services and channels.

69UK Customer Satisfaction Index | January 2021
9) Focus on short and long term risk and performance
• Ensure your organisation’s purpose and customer service objectives are clear and understood across the organisation and by key partners and suppliers
• Prioritise the key actions required to maintain and improve your customer experience performance
• Assess the investment in resources and capabilities that your organisation will need to influence performance over the longer term
• Continually review the risks to your customer experience, operations and reputation and the plans in place to mitigate risk
• Measure the performance of your customer
experience and benchmark both within and outside your sector
• Measure the linkages between customer satisfaction, employee engagement and financial performance for your organisation
• Include customer satisfaction and employee engagement as key elements of your environmental, social and governance agenda and reporting.

70 UK Customer Satisfaction Index | January 2021
UKCSI Key facts
Number of years UKCSI has run. The UKCSI is published twice a year, normally in January and July.
Number of sectors the UKCSI covers, 11 in the private sector as well as the local and national public sectors. The Institute also publishes sector reports with a detailed breakdown of scores by sector and organisation.
Number of unique responses included in January 2021, from over 10,000 customers. Customers are geographically and demographically representative of the UK population and participate in the survey through an online panel. Customers are asked to provide a score for organisations based on their most recent interaction.
Number of responses per sector, except for Transport and Utilities, which have 6,000 responses each.
Number of individual organisations and organisation types which received a UKCSI rating. 259 named organisations which have exceeded a minimum sample size are scored in the 13 sector reports. In addition, scores are given for 12 generic providers including “your local Council”, “your local restaurant/takeaway” etc.
11
13
45,000
3,000
271

71UK Customer Satisfaction Index | January 2021
Organisations included in the January 2021 UKCSIAutomotive
Audi
BMW
Citroen
Dacia
Fiat
Ford
Honda
Hyundai
Jaguar
Kia
Land Rover
Lexus
Mazda
Mercedes-Benz
Mini
Mitsubishi
Nissan
Peugeot
Renault
Seat
Škoda UK
Suzuki
Toyota
Vauxhall
Volkswagen
Volvo
Banks & Building Societies
Bank of Scotland
Barclays
first direct
Halifax
HSBC
Lloyds
M & S
Nationwide
NatWest
RBS
Sainsbury's
Santander
Starling Bank
Tesco
The Co-operative Bank
TSB
Virgin Money
Yorkshire Bank
Insurance
AA Insurance
Admiral
Aviva
AXA
Budget
BUPA
Churchill
Co-op Insurance
Direct Line
Esure
Halifax
Hastings Direct Insurance
Legal and General
Lloyds
LV=
More Than
Nationwide Insurance
Petplan
Privilege
Prudential
RAC
RIAS
SAGA Insurance
Sainsbury's
Swinton
Tesco
Virgin Money
Leisure
Amazon Prime Video
Burger King
Caffe Nero
Cineworld
Costa Coffee
Domino's Pizza
Greggs
Harvester
JD Wetherspoon
KFC
Ladbrokes
McDonald's
Nando's
Netflix
Now TV
Odeon
Pizza Express
Pizza Hut
Spotify
Starbucks
Subway
TicketMaster
Toby Carvery
Vue Cinema
your local restaurant/takeaway
Public Services (Local)
GP surgery / health centre
Library
your Housing Association
your local Ambulance Service
your local Council
your local Fire Service
your local Police Service
Public Services (National)
Companies House
Disclosure and Barring Service
DVLA
Highways England
HM Passport Office
HMRC (Inland Revenue)
Jobcentre Plus
NHS / hospital service
Post Office
The university I attend
Retail (Food)
Aldi
ASDA
Co-op Food
Iceland
Lidl
M & S (food)
Morrisons
Ocado
Sainsbury's
Tesco
Waitrose
Retail (Non-food)
Amazon.co.uk
Apple
Argos
B&Q
Boots UK
Currys/PC World
Debenhams
Ebay
H&M
Halfords
Holland & Barrett
Home Bargains
Ikea
John Lewis
M & S
Next
Pets at Home
Poundland
Primark
Specsavers
Superdrug
TK Maxx
Wilko
Services
AA
Avis
British Gas Home Services
DHL
DPD
Green Flag
Halfords autocentre
Hermes
Homeserve
Kwik Fit
RAC
Royal Mail / Parcelforce
Timpson
TNT
Toni & Guy
Uber
Western Union
Yodel
your local solicitor
your local tradesman
Telecommunications & Media
BT
EE (including T-Mobile or Orange)
giffgaff
O2
Plusnet
Sky
Sky Mobile
TalkTalk
Tesco Mobile
Three
Virgin Media
Virgin Mobile
Vodafone
Tourism
booking.com
British Airways Holidays
Butlins
Center Parcs
Expedia
Haven Holidays
Hilton
Holiday Inn
Hoseasons
Hotels.com
Jet2holidays.com
Lastminute.com
Marriott
On the Beach
P&O Cruises
Premier Inn
SAGA Holidays
Trailfinders
Travel Republic
Travelodge
Trivago
TUI
Virgin Holidays
Transport
Abellio ScotRail
Arriva - Bus group
Avanti West Coast
British Airways
Brittany Ferries
CrossCountry
East Midlands Railway
easyJet
Eurotunnel
First Group - bus companies
Flybe
Gatwick Express
Grand Central
Great Northern
Great Western Railway
Greater Anglia
Heathrow Express
Jet2
London North Eastern Railway
London Northwestern Railway
London Underground
Manchester Metrolink
National Express
Northern / Northern Trains
P&O Ferries
Ryanair
South Western Railway
Southeastern (train operating
company)
Southern
Stagecoach (Bus)
Thameslink
The Trainline.com
TransPennine Express
Transport for Wales
TUI Airways
Virgin Atlantic
West Midlands Railway
Utilities
Affinity Water
Anglian Water
British Gas
Bulb
Dwr Cymru (Welsh Water)
E.ON (energy)
EDF Energy
Essex and Suffolk Water
M & S Energy
Northumbrian Water
npower
Octopus Energy
OVO Energy
Power NI
Scottish and Southern Energy
(SSE)
Scottish Gas
Scottish Power
Scottish Water
Severn Trent Water
Shell Energy
South East Water
South Staffordshire Water
South West Water
Southern Water
Thames Water
The Co-operative Energy
United Utilities (water)
Utilita
Utility Warehouse
Wessex Water
Yorkshire Water

72 UK Customer Satisfaction Index | January 2021
A barometer of customer satisfaction in the UK since 2008The UKCSI (UK Customer Satisfaction Index) provides insight into the state of customer satisfaction in the UK for 13 key sectors. The UKCSI is published twice a year, in January and July. Each UKCSI incorporates two sets of data to create a rolling measure of customer satisfaction. The January 2021 UKCSI includes responses from surveys conducted between 16 March to 13 April 2020 and 14 September to 12 October 2020.
Over 10,000 customers The UKCSI is based on an online survey of over 10,000 consumers, who are representative of the UK adult population by region, age and gender. The January 2021 UKCSI comprises 45,000 responses, 3,000 from each sector except for Transport and Utilities which include 6,000 responses each. Customers are asked to rate their experience of dealing with a specific organisation in the previous three months. Customers rate only one organisation per sector. Each customer can complete the survey for up to five different sectors.
Over 25 metrics of the quality of customers’ interactions and relationship with organisations Customers rate the quality of their experiences and relationship with organisations on over 25 metrics including employee professionalism, product / service quality, ease of dealing with an organisation, timeliness, complaint handling and attitudes towards trust, reputation, an organisation’s customer ethos and ethical behaviour.
Metrics reflect the priorities identified by customers, as well as attributes that show a strong relationship with overall customer satisfaction. The UKCSI also includes measures of customer effort and a Net Promoter Score (NPS). Customers rate organisations on a scale of 1 – 10 except for the question “how likely would you be to recommend xx to friends and family”, which is a scale of 0 – 10.
271 organisations received a UKCSI rating These include 259 named organisations and 12 generic providers including “your local Council”, “your local restaurant/takeaway” etc. Customers select an organisation to rate from a randomised list of leading and emerging players in each sector which is reviewed before each UKCSI. Customers can also select an organisation to rate that is not on the list. Organisations which exceed a minimum sample size are given a score and are named within one of the 13 sector reports.
How the UKCSI is calculated Index scores are expressed as a number out of 100. The UKCSI score for each organisation is the average of all of its customers’ satisfaction scores, multiplied by ten, with a weighting applied reflecting the priority score for each measure. The sector score is the mean average of all responses for that sector, multiplied by ten. The overall UKCSI is based on the mean average of each sector’s score.
* See Experiences, Emotions and Ethics: refreshing the customer priorities that underpin the UK Customer Satisfaction Index, available at www.instituteofcustomerservice.com/research. It is free to Institute organisational members and available for purchase by non members.
About the UKCSI

73UK Customer Satisfaction Index | January 2021
UKCSI sector reports*
* Two sector reports are available as a membership benefit to The Institute’s Trusted Advisory Network members; one report for Discovery Roadmap and Council members. For Corporate and Pathway members, discounts apply.
Sector reports are available for purchase by non members at www.instituteofcustomerservice.com or contact us at [email protected]
13 reports are available with sector-specific insight and recommendations
• Customer satisfaction performance of leading organisations on over 30 customer experience metrics• Channel use and satisfaction• Drivers of complaints and satisfaction with complaint handling• Links between satisfaction and future buying behaviours• Recommendations and opportunities to improve
Sector resource packs
• Key sector and organisational measures in spreadsheet format
• Sector satisfaction by age, region, gender• Key issues organisations should improve • Satisfaction by product type in the Banking,
Insurance and Telecommunications & Media sectors
Sub-sector customer experience measures
• Leisure (Quick Service Restaurants; Entertainment)
• Transport (Air; Rail; Coach / Bus)• Retail Non-food (Fashion retailers)• Utilities (Energy; Water)
Automotive
Banks & Building Societies
Insurance
Leisure
Public Services (Local)
Public Services (National)
Retail (Food)
Retail (Non-food)
Services
Telecommunications & Media
Tourism
Transport
Utilities

74 UK Customer Satisfaction Index | January 2021
Breakthrough research from The Institute
Are you connected? Recruiting, developing and retaining the skills for customer service excellence • Highlights the factors that are shaping requirements for customer
service skills
• Defines the key skills needed for customer service, from the perspectives of senior managers, employees and customers
• Examines effectiveness of current practice in recruitment, training and development
• Reviews best practice in engaging and retaining employees • Identifies 9 key enablers, with practical recommendations, for recruiting,
developing and retaining the skills for customer service excellence.
The Procurement Partnership: Developing relationships to deliver excellent customer service though procurement • Examines how organisations define requirements and evaluate and manage
supplier relationships that affect customer experience
• Draws on the perspectives of senior executives, procurement managers,
customer experience managers and contractors to give a multi-dimensional
view of issues influencing procurement in a service context
• Highlights the “hidden costs” of poor procurement and their impact on
customer experience and reputation and identifies 10 key enablers of
successful procurement.

75UK Customer Satisfaction Index | January 2021
To find out more about The Institute’s research programme, contact us at:T: 0207 260 2620
Upfront and Personal: Leveraging data to deliver a genuinely personalised omnichannel customer experience
• Explores customers’ attitudes towards use of personal data and experiences with organisations across different channels
• Assesses how effective organisations are in leveraging data to deliver a
genuinely personalised, omnichannel experience • Highlights seven key enablers, with practical recommendations to develop
customer-focused omnichannel and personalisation capabilities.
The Heart of Artificial Intelligence: Enabling the future of customer experience • Investigates how and why organisations are deploying artificial
intelligence in a customer experience context • Assesses customers’ current use of artificial intelligence and attitudes
towards its wider implementation • Examines employees’ experience of artificial intelligence and their
perceptions about how it affects the customer experience and their job role
• Identifies the key enablers for successful deployment of artificial
intelligence in a customer experience context.

76 UK Customer Satisfaction Index | January 2021
T: 020 7260 2620 E: [email protected] January 2021 instituteofcustomerservice.com
ISBN 978-1-913314-35-4
About The Institute of Customer Service
The Institute of Customer Service is the UK’s independent, professional body for customer service.
Our purpose is to enable organisations to achieve tangible business benefits through excellent customer service aligned to their business goals and to help individuals maximise their career potential and employability by developing their customer service skills.
We provide tools and services to support continuous customer service improvement and a framework for our members to share and learn from each other.
We are independent – setting standards so that our customers can improve their customers’ experiences and their business performance.
The Institute is the secretariat for the All Party Parliamentary Group on Customer Service.
Key Activities
• Research and reports on the latest customer service trends and thinking
• Publication of the UK Customer Satisfaction Index (UKCSI) twice a year
• Benchmarking customer experience to identify areas for improvement, drawing on the views of both customers and employees
• Bespoke customer insight and research
• Training and accreditation programmes for customer service professionals
• Professional qualifications for individuals at all stages of their career
• Public policy development.
For further information please visit www.instituteofcustomerservice.com