customized input sensing - cis solutions · standard single sensors @/'bac @/'bde...
TRANSCRIPT

Customized Input Sensing - CIS Solutions
Standard Single Sensors
Linear Potent iometer (Linpot) Sensors
High Dynamic Force Sensing Resistor Sensors

IEE develops Customized Input Sens-ing (CIS) solut ions for a variety of automotive, consumer and medical applicat ions, such as Human-Machine Interfaces (HMI) in cars, pressure sen-sors in shoes, or press buttons for con-sumer electronics such as cell phones.
Thanks to our Force Sensing Resistor (FSR) foil-type contact technology, we can create slim, pressure-act ivated sensors. The shape of each sensor can be adapted to suit any geometrical en-vironment. In addit ion, different sensor funct ionalit ies can be combined in the one device, providing a wider range of funct ions for the end-consumer.
By adapting substrates, spacer, cell form, inks and print geometry, this technology can be ideally adapted for a range of uses where space is limited and complex funct ionality is required.
Standard Sensors for Test ing
IEE produces standard, off-the-shelf sensors that can be used for test ing (both the technology and the business solut ion) without the need for made-to-order development. These allow you to quickly create init ial mock-ups or demonstrators.
FSR Technology
FSR uses variable resistance to detect pressure applied to a sensor cell. This technology is very reliable and can DG�KPEQTRQTCVGF�KPVQ�VJKP�CPF�ƃGZKDNG�applicat ions. FSR also allows a high degree of design freedom and adapts to a simple electronic interface.
Flexible, Intelligent and Tailor-made Solutions for your Smart Input Systems
All of our FSR Sensors:
r�Are simple and easy to integrate r�Have a highly repeatable force readingr�Are cost-effect iver�Are ultra thin
+P�VJKU�FCVC�UJGGV��[QW�YKNN�ƂPF�MG[�KP-formation, as well as scale diagrams, for the following standard CIS sensors:
Content Page
Standard Single Sensors 4
CP 149 9
CP 150 10
CP 151 11
CP 152 12
CP 153 13
CP 154 14
CP 174 15
Linear Potent iometer (Linpot) Sensor 16CP 155 21
High Dynamic FSR Sensors 22HD 001 29
HD 002 30
With our pressure sensing technology, we can create tailor-made solut ions in almost any shape and size, on a rela-t ively short t ime frame. If you require something other than our standard sensors for your project, please e-mail [email protected].
2 CIS

Housing (optional)
CR
IMP
FLE
X
Male crimp (optional)1 Top substrate male crimp
(opt ional)
2 Spacer substrate
3 Bottom substrate
4 Backing adhesive
(opt ional)
A - A
1
2
34
0.090mm
0.100mm
0.050mm
0.100mm
Options for Single Sensors
3 CIS

Standard Single Sensors
CP 149CP 150CP 151CP 152CP 153CP 154CP 174
4 CIS

Technology
Our standard FSR sensors:
r�Have an actuat ion force as low as 0.1 N
r�Have a sensit ivity range to 10 Nr�Are robust; up to 10 M actuat ions
Force Sensing Resistor (FSR)
Our standard CP sensors are available KP�FKHHGTGPV�EQPƂIWTCV KQPU��FGRGPFKPI�on the connection method and whether or not backing adhesive is present.
Sensor Configurations
Sensor Type Detect ion Area Dimension
Force Probe Diameter
Test Weight Load
Typical Resistance at Test Load
CP 149 circular, Ø 6 mm 4 mm 500 g ���Mŝ� �4.� ���Mŝ
CP 150 8.1 × 7.5 mm 6 mm 1,100 g ���Mŝ� �4.� ���Mŝ
CP 151 circular, Ø 12 mm 6 mm 1,100 g ���Mŝ� �4.� ���Mŝ
CP 152 circular, Ø 15.2 mm 6 mm 1,100 g ���Mŝ� �4.� ���Mŝ
CP 153 22.3 × 21.6 mm 6 mm 1,100 g ���Mŝ� �4.� ���Mŝ
CP 154 40.6 × 40.3 mm 6 mm 1,100 g ���Mŝ� �4.� ���Mŝ
CP 174 circular, Ø 24.8 mm 6 mm 1,100 g ���Mŝ� �4.� ���Mŝ
Standard Single Sensors 5 CIS
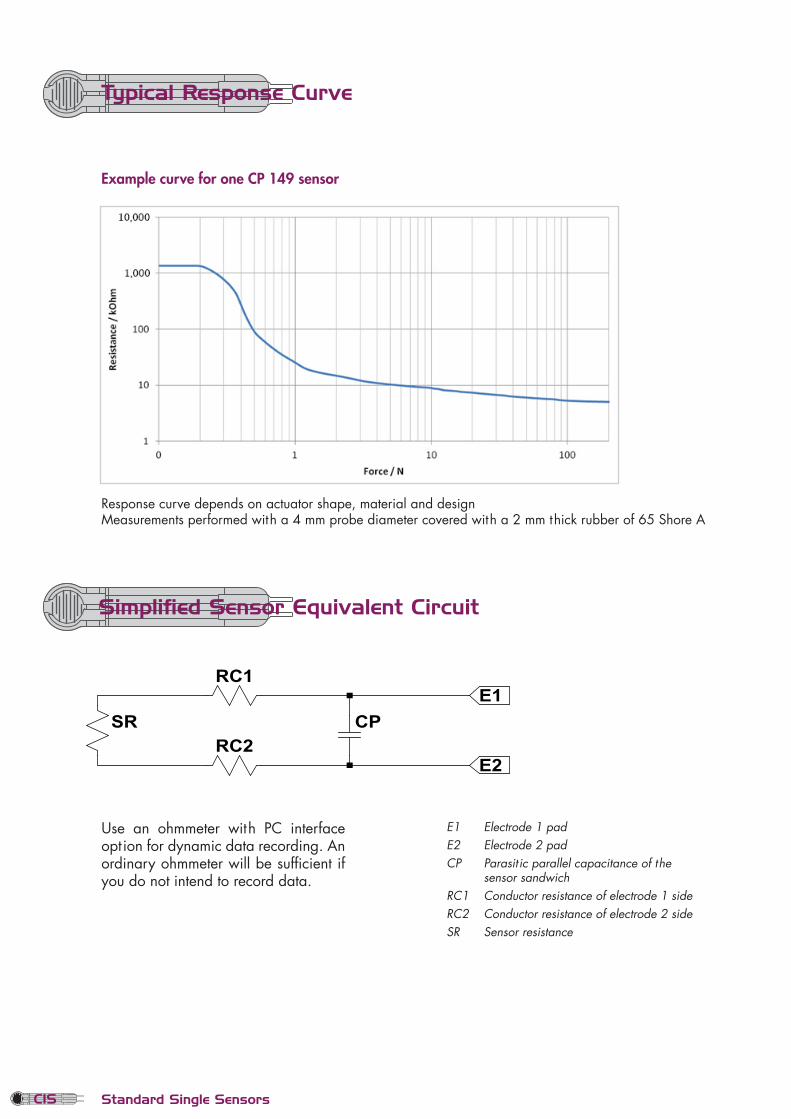
Response curve depends on actuator shape, material and design Measurements performed with a 4 mm probe diameter covered with a 2 mm thick rubber of 65 Shore A
Typical Response Curve
Simplified Sensor Equivalent Circuit
E1 Electrode 1 pad
E2 Electrode 2 pad
CP Parasit ic parallel capacitance of the
sensor sandwich
RC1 Conductor resistance of electrode 1 side
RC2 Conductor resistance of electrode 2 side
SR Sensor resistance
Use an ohmmeter with PC interface option for dynamic data recording. An QTFKPCT[�QJOOGVGT�YKNN�DG�UWHƂEKGPV�KH�you do not intend to record data.
SR CP
RC1
RC2
E1
E2
Standard Single Sensors
Example curve for one CP 149 sensor
6 CIS

Sensor Characteristics
Sensor Descript ion Sensor type Pressure Sensit ive Single Sensor Typical applicat ions/devices +PƂPKVGN[�XCTKCDNG�TGUKUV KXG�WUGT�KPVGTHCEG�Number of act ive areas/cells 1 Dimensions and available connectors See layout drawings on the following pages
Manufacturing Tolerances .GPIVJ�CPF�YKFVJ�VQNGTCPEGU� According DIN 7151 IT 14 Thickness Nominal value +/- 12 % Total manufacturing tolerance +/- 0.8 mm
Base Materials Topside substrate 2'6�ƂNO�.COKPCVKPI�CFJGUKXG� Acrylic Backside substrate 2'6�ƂNO�Backing adhesive (upon request) Acrylic
Operating Parameters Standby resistance (no load) 40.� ���/ŝ�Typical act ivat ion resistance range ��/ŝ� �4.� ���Mŝ�
for a pressure range of 0.5-100 N/cm2 (i.e. per cm2 of act ivated area)Typical conductor lead resistance Ű����ŝTypical lifet ime when used according to applicat ion advice
�����������E[ENGU�"���MI�EO2 and 1 Hz
Typical sensor response t ime on single act ivat ion
2-3 ms (mechanical)
Current density < 1 mA/cm2 (of act ivated area)Parasit ic capacitance < 1 nFPower dissipat ion < 1 mW/cm2 (of act ivated area)
Operating Condit ions Nominal operat ing voltage 1.5 V. Use pulsed voltage (duty cycle < 2 %) for extended
lifet ime and heavy duty condit ions Operat ing temperature range -40 to +85 °C (-40 to 185 °F) Operat ing humidity range Ű������4�*�
Standard Test Criteria at Time of Delivery Standby resistance 40.� ���/9�"�46�CPF���8�&%�Measuring device IEE load applicator (see table on page 5 for load values) Force probe surface material Rubber pad Thickness of pad 2 mm +/- 0.2 mm Rubber hardness 65 Shore A (+/- 10 Shore A)
Standard Single Sensors 7 CIS

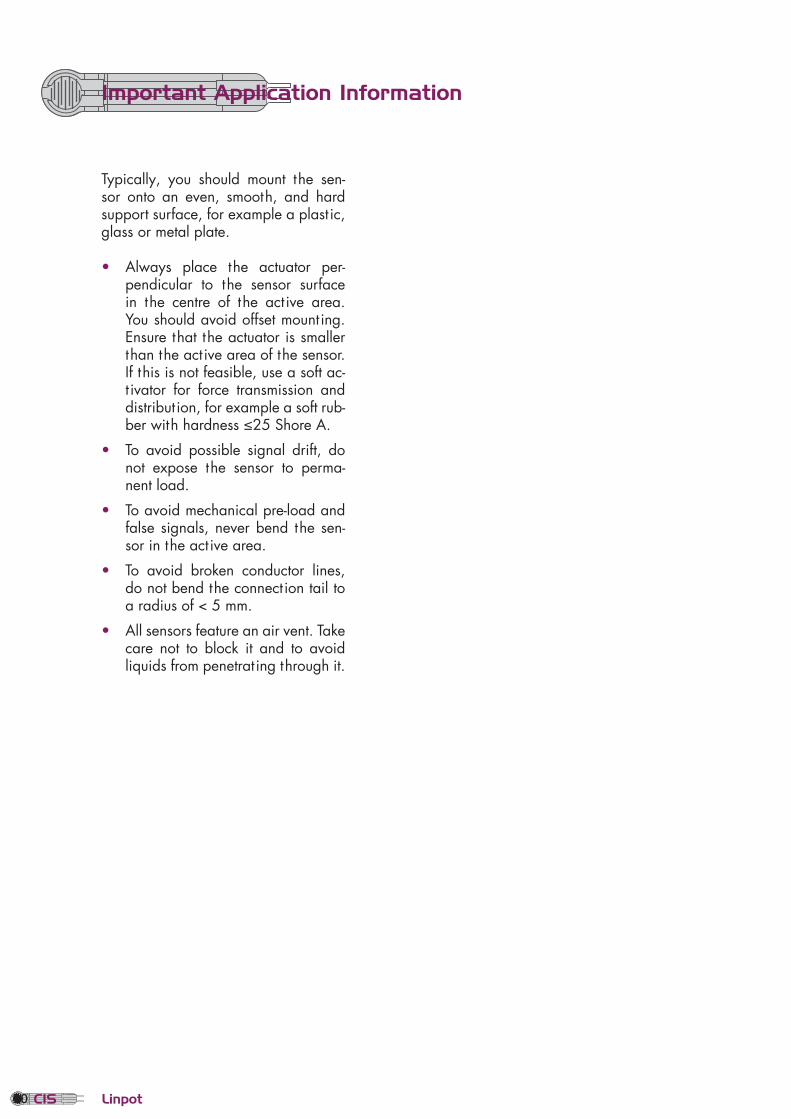
Typically, you should mount the sen-sor onto an even, smooth, and hard support surface, for example a plast ic, glass or metal plate.
r� Always place the actuator per-pendicular to the sensor surface in the centre of the act ive area. You should avoid offset mounting. Ensure that the actuator is smaller than the act ive area of the sensor. If this is not feasible, use a soft ac-t ivator for force transmission and distribut ion, for example a soft rub-DGT�YKVJ�JCTFPGUU����5JQTG�#�
r� To avoid possible signal drift, do not expose the sensor to perma-nent load.
r� To avoid mechanical pre-load and false signals, never bend the sen-sor in the act ive area.
r� To avoid broken conductor lines, do not bend the connect ion tail to a radius of < 5 mm.
r� All sensors feature an air vent. Take care not to block it and to avoid liquids from penetrat ing through it.
Important Application Information
Standard Single Sensors8 CIS

Single Sensor CP 149
A
A R4
R3
6,5
38
Sensor Reference Backing Adhesive Crimp Type Housing
CP 149 NN No No crimps No CP 149 NS No Male No CP 149 NH No Female Yes CP 149 AN Yes No crimps No CP 149 AS Yes Male No CP 149 AH Yes Female Yes
Standard Single Sensors
Active area = Radius 3 mm
9 CIS

Single Sensor CP 150
A
A
12.12
8
50
Sensor Reference Backing Adhesive Crimp Type Housing
CP 150 NN No No crimps No CP 150 NS No Male No CP 150 NH No Female Yes CP 150 AN Yes No crimps No CP 150 AS Yes Male No CP 150 AH Yes Female Yes
Standard Single Sensors10 CIS

Single Sensor CP 151
A
AR8
R6
7
50
Sensor Reference Backing Adhesive Crimp Type Housing
CP 151 NN No No crimps No CP 151 NS No Male No CP 151 NH No Female Yes CP 151 AN Yes No crimps No CP 151 AS Yes Male No CP 151 AH Yes Female Yes
Standard Single Sensors
Active area = Radius 6 mm
11 CIS

Single Sensor CP 152
A
A
R10
R8
8
55
Sensor Reference Backing Adhesive Crimp Type Housing
CP 152 NN No No crimps No CP 152 NS No Male No CP 152 NH No Female Yes CP 152 NF No Female No CP 152 AN Yes No crimps No CP 152 AS Yes Male No CP 152 AH Yes Female Yes CP 152 AF Yes Female No
Standard Single Sensors
Active area = Radius 8 mm
12 CIS

Single Sensor CP 153
A
A
27.522.32
6.5
26.3
5
21.5
9
65
Sensor Reference Backing Adhesive Crimp Type Housing
CP 153 NN No No crimps No CP 153 NS No Male No CP 153 NH No Female Yes CP 153 AN Yes No crimps No CP 153 AS Yes Male No CP 153 AH Yes Female Yes
Standard Single Sensors 13 CIS

Single Sensor CP 154
A
A
46
4640.64
40.2
68
85
Sensor Reference Backing Adhesive Crimp Type Housing
CP 154 NN No No crimps No CP 154 NS No Male No CP 154 NH No Female Yes CP 154 AN Yes No crimps No CP 154 AS Yes Male No CP 154 AH Yes Female Yes
Standard Single Sensors14 CIS

Single Sensor CP 174
A
A
R14.5
R12.5
8
65
Sensor Reference Backing Adhesive Crimp Type Housing
CP 174 NN No No crimps No CP 174 NS No Male No CP 174 NH No Female Yes CP 174 AN Yes No crimps No CP 174 AS Yes Male No CP 174 AH Yes Female Yes
Standard Single Sensors
Active area = Radius 12.5 mm
15 CIS

Linear Potentiometer (Linpot)
CP 155
16 CIS

Linear Potent iometer (Linpot)
IEE also offers a standard FSR-based linear potent iometer.
With this sensor, you can detect the act ivat ion pressure as well as the posi-t ion of a single act ivat ion point along the length of the sensor.
Our Linpot sensors:
r� Have an actuat ion force as low as 0.1 N
r� Have a sensit ivity range to 10 Nr� Are robust; up to 10 M actuat ionsr� Can detect posit ion and act ivat ion
force
Technology
Sensor Configurations
Sensor Type Detect ion AreaDimension
Force Probe Diameter
Test Weight Load
Typical Resistance at Test Load
CP 155 105 × 15 mm 6 mm 1100 g ���M9� �4.� ����M9
Linpot 17 CIS

Simplified Sensor Equivalent Circuit
Recommended sensor read out:
UREF+ High reference voltage74'(��� .QY�TGHGTGPEG�XQNVCIGB1 High impedance bufferR1 ResistorD1 Diode 1D2 Diode 2
6JG�ƂZ� TGUKUVQT� 4(+:���4(:�� �4(:���is connected to a high (VREF+) and a low (VREF-) reference voltage that is ident ical to the reference voltages of the AD-converter (ADC). The wiper is connected to the ADC input of the mi-croprocessor (MPU) through the high- impedance buffer (B1). The voltage readings of the ADC are proport ional to the posit ion of the center of gravity QH�VJG�HQTEG�ƂGNF�CRRNKGF�VQ�VJG�FGXKEG�
In order to measure the wiper resis-tance (SR) value, which is dependent on the pressure applied to the act ive CTGC��VJG�YKRGT�KU�ƂTUV�EQPPGEVGF�VQ�C�high and then to a low voltage for cur-rent inject ion through a resistor (R1). This current causes a voltage change at the wiper that is proport ional to the SR value. The two diodes (D1 and D2) make sure that no leakage current from the digital outputs of the micropro-EGUUQT� KU� ƃQYKPI� FWTKPI� VJG� RQUKV KQP�measurement.
The digital output state sequence is di-vided into three or four steps:
1. R1 not connected for posit ion meas-urement
2. Posit ive current inject ion for SR (pressure) measurement
3. R1 not connected for posit ion meas-urement (opt ional, could be omitted)
4. Negative current inject ion for SR (pressure) measurement
The voltage measured at the end of state (2) is temporarily stored in order to subtract the voltage from state (4) at the end of this cycle. This voltage difference is proport ional to the FSR-wiper resistance and inversely propor-t ional to the applied force.
The t ime delay between output state switching and ADC sampling must be long enough for voltage sett ling in the circuit capacitors. This delay should be 4 × R1 × CP for the resistance meas-urement during states (2) and (4), typi-cally 0.01 to 0.1 ms, where CP is the total capacitance of the sensor and the circuit. During the remaining t ime, typically 10 ms, the wiper carries no current (1) and the voltage stabilizes to a good accuracy for posit ion reading. The R1 × CP t ime constant can eas-ily be determined from the buffer (B1) output signal, displayed on an oscillo-scope. The update frequency is a func-t ion of the react ion t ime, required for the applicat ion. Over-sampling can be considered for noise suppression by PWOGTKECN�NQY�RCUU�ƂNVGTU�
Linpot Sensor:
E1 Electrode 1 pad
E2 Electrode 2 pad
E3 Electrode 3 pad
CP Parasit ic parallel
capacitance of the sen-
sor sandwich
RC1 Conductor resistance of
electrode 1 side
RC2 Conductor resistance of
electrode 2 side
RC3 Conductor resistance of
Electrode 3 side
SR Sensor resistance
RFX1 Resistance X1 of
RTKPVGF�ƂZGF�TGUKUVQTRFX2 Resistance X2 of
RTKPVGF�ƂZGF�TGUKUVQTRFIX Resistance of printed
ƂZGF�TGUKUVQT�YKVJ� RFIX = RFX1 + RFX2
Linpot18 CIS

Sensor Characteristics
Sensor Descript ion Sensor type Co-ordinate & Pressure Sensing SensorTypical applicat ions/devices 2TQRQTVKQPCN�KPRWV�EQPVTQNU�UQHVYCTG�FGƂPCDNG�MG[RCFU�Number of act ive areas/cells 1 Dimensions and available connectors See layout drawings on the following pages
Manufacturing Tolerances.GPIVJ�CPF�YKFVJ�VQNGTCPEGU� According to DIN 7151 IT 14 Thickness Nominal value +/- 12 % Total manufacturing tolerance +/- 0.8 mm Base MaterialsTopside substrate 2'6�ƂNO.COKPCVKPI�CFJGUKXG AcrylicBackside substrate 2'6�ƂNO�Backing adhesive (upon request) Acrylic Operating Parameters Standby resistance (no load) 40.� ���/ŝ�Typical act ivat ion resistance range ��/ŝ� �4.� ���Mŝ� for a pressure range of 0.5-100 N/cm2 (i.e. per cm2 of act ivated area)Typical Fix resistor value ��s����MŝTypical conductor lead resistance Ű����ŝ�Typical lifet ime when used according to applicat ion advice
�����������E[ENGU�"���MI�EO2 and 1 Hz
Typical sensor response time on single activation 2-3 ms (mechanical) Current density < 1 mA/cm2 (of act ivated area) Parasit ic capacitance < 1 nF Power dissipat ion < 1 mW/cm2 (of act ivated area)
Geometrical resolut ion < 0.1 mm (depending on actuator).KPGCTKV[ Better than 5% FS (depending on actuator)Operating Condit ions Nominal operat ing voltage 5 V, other driving voltages on demand Operat ing temperature range -40 to +70 °C (-40 to 158 °F) Operat ing humidity range Ű������4�*��JKIJ�JWOKFKV[�ITCFGU�QP�FGOCPF�
Standard Test Criteria at Time of Delivery Standby resistance 40.� ���/9�"�46�CPF���8�&%�Measuring device IEE load applicator (see table on page 17 for load values) Force probe surface material Rubber pad Thickness of pad 2 mm +/- 0.2 mm Rubber hardness 65 Shore A (+/- 10 Shore A)Force test posit ion Centre of detect ion areaFix resistor ���Mŝ� �4(+:� ���Mŝ�
Linpot 19 CIS
Typically, you should mount the sen-sor onto an even, smooth, and hard support surface, for example a plast ic, glass or metal plate.
r� Always place the actuator per-pendicular to the sensor surface in the centre of the act ive area. You should avoid offset mounting. Ensure that the actuator is smaller than the act ive area of the sensor. If this is not feasible, use a soft ac-t ivator for force transmission and distribut ion, for example a soft rub-DGT�YKVJ�JCTFPGUU����5JQTG�#�
r� To avoid possible signal drift, do not expose the sensor to perma-nent load.
r� To avoid mechanical pre-load and false signals, never bend the sen-sor in the act ive area.
r� To avoid broken conductor lines, do not bend the connect ion tail to a radius of < 5 mm.
r� All sensors feature an air vent. Take care not to block it and to avoid liquids from penetrat ing through it.
Important Application Information
Linpot20 CIS

Linear Potentiometer CP 155
Sensor Reference Backing Adhesive Crimp Type Housing
CP 155 NN No No crimps No CP 155 NS No Male No CP 155 NH No Female Yes CP 155 AN Yes No crimps No CP 155 AS Yes Male No CP 155 AH Yes Female Yes
Linpot 21 CIS

High Dynamic Force Sensing Resistor (HD-FSR)
HD 001HD 002
22 CIS

IEE’s high-dynamic FSR sensors are the newest generat ion of cells, and have an improved FSR cell performance. Several sensor cells can be combined in a number of variants.
This technology can be ideally adapt-ed for a range of uses where high sensor dynamic over a wide pressure range (from 100 mbar up to 7 bar) is required. The staggering of individual cell segments allows us to create a ho-mogeneous repeatable cell response along the axis of staggering.
Two IEE high-dynamic standard sensor shapes can be used for test ing. With VJG� JGNR� QH� C� UVCPFCTF� RTKPVGF� ƂZGF�resistor you can also compensate vari-CVKQP��FWG�VQ�GPXKTQPOGPVCN�KPƃWGPEGU��on the cell output.
Key Features
HD-FSR incorporates the FSR pressure detect ing technology with an individ-ual triangular cell segmentat ion. This allows you to measure a change in resistance over a wide pressure range (from 100 mbar to 7 bar).
Each triangular segment can be seen as an independent, fully-funct ioning part of the whole cell. This allows a high degree of design freedom and segment interconnect ion.
Our HD-FSR sensors:
r� Have an actuat ion force as low as 100 mbar
r� Have a sensit ivity range of up to 7 bar
r� Are robust; up to 1 M actuat ions under highest humidity condit ions (lifet ime variat ion < 15%)
Technology
r� Can be used in a slight ly bent po-sit ion
r� Can be individually calibrated using a three-point interpolat ion of the pressure response curve
r� Have a very low hysteresis compa-red with our standard sensors
With IEE’s foil-type contact technology, we can create slim, pressure-act ivated sensors. The shape of each sensor can be adapted to suit numerous geometri-cal environments, and different sensor segment interconnect ions can be com-bined in one device.
HD-FSR 23 CIS

High Dynamic Force Sensing Resistor (HD-FSR)
Depending on the cell dimension, HD-FSR sensors are available in different EQPƂIWTCV KQPU��
Sensor Configurations
Sensor Type
Detect ion Area Dimension
Pressure Load
4ƂZ Typical Resistance Value
Typical Value in Voltage Divider
HD 001 rectangular, 18.1 x 14.75 mm
500 mbar
2,000 mbar��Mŝ���4ƂZ�����Mŝ
���Mŝ���4.�������Mŝ�
��Mŝ���4.������Mŝ
�����8���8HUT��������8
0.56 V < Vfsr < 1.13 V
HD 002 rectangular, 31 x 14.75 mm
500 mbar
2,000 mbar��Mŝ���4ƂZ�����Mŝ
��Mŝ���4.������Mŝ
��Mŝ���4.������Mŝ
0.26 V < Vfsr < 0.53 V
0.67 V < Vfsr < 1.40 V
HD-FSR
Typical Response Curve
The typical response curve is based on the sensor equivalent circuit with a 3 V supply voltage (UBAT). The meas-urement voltage (UM) is shown in de-pendency of the applied pressure on
the sensor cell. Here the sensor cell is placed on a steel plate with the back-ing adhesive facing downwards. The overpressure is applied by a latex membrane bladder from the top.
24 CIS

Typical Response Curve
HD-FSR 25 CIS

Simplified Sensor Equivalent Circuit
RC2 Conductor resistance of electrode 2 side
RC3 Conductor resistance of electrode 3 side
SR Sensor resistance
4(+:�� 4GUKUVCPEG�QH�RTKPVGF�ƂZGF�TGUKUVQTUBAT Supply Voltage
UREF Reference Voltage
UM Measurement Voltage
The measurement voltage UM can be calculated
with the following formula:
7/���7$#6�Z�4(+:���4(+:� �54�Typical: UBAT = 3 V
Use an ohmmeter with PC interface option for dynamic data recording. An QTFKPCT[�QJOOGVGT�YKNN�DG�UWHƂEKGPV�KH�you do not intend to record data.
E1 Electrode 1 pad
E2 Electrode 2 pad
E3 Electrode 3 pad
CP Parasit ic parallel capacitance of the
sensor sandwich
RC1 Conductor resistance of electrode 1
side
Typical Sensor Robustness
The typical cell response during its life-t ime under the described condit ions
(1,000,000 cycles @ 7 bar, 1 Hz and ����T�*���KU�UJQYP�DGNQY�
HD-FSR26 CIS

Sensor Characteristics
Sensor Descript ion Sensor type Pressure Sensit ive High Dynamic Single Sensor Typical applicat ions/devices Dynamic user interface devices and high-dynamic
pressure sensors for in-shoe measurements Number of act ive areas/cells 1 Dimensions and available connectors See layout drawings on the following pages
Manufacturing Tolerances.GPIVJ�CPF�YKFVJ�VQNGTCPEGU� According to DIN 7151 IT 14 Thickness Nominal value +/- 12 % Total manufacturing tolerance +/- 0.8 mm
Base MaterialsTopside substrate 2'6�ƂNO.COKPCVKPI�CFJGUKXG AcrylicBackside substrate 2'6�ƂNO�Backing adhesive Acrylic
Operating Parameters Standby resistance (no load) 40.� ���/ŝ�DGVYGGP�'��CPF�'��Typical act ivat ion resistance range ��/ŝ� �4.� ���Mŝ� for a pressure range of 20 mbar - 7 bar. See Typical Response Curve on
page 24Typical conductor lead resistance Ű����ŝ�Typical lifet ime when used according to applica-t ion advice
�����������E[ENGU�"���DCT����*\�CPF�����T�*�
Typical sensor response t ime on single act ivat ion 2-3 ms (mechanical) Current density < 1 mA/cm2 (of act ivated area) Parasit ic capacitance < 1 nF Power dissipat ion < 1 mW/cm2 (of act ivated area)
Operating Condit ions Nominal operat ing voltage �8�CEEQTFKPI�VQ�UKORNKƂGF�UGPUQT�GSWKXCNGPV�EKTEWKV�Operating temperature range -40 to +85 °C (-40 to 185 °F) Operat ing humidity range Ű������4�*��
Standard Test Criteria at Time of Delivery Standby resistance 40.� ���/9�"�46�DGVYGGP�'��CPF�'��Measuring device IEE overpressure membrane tester
HD-FSR 27 CIS

Typically, you should mount the sensor onto an even and smooth support sur-face, for example a plast ic, glass or metal plate. Unlike the standard cells, the HD-FSR can also be mounted on slight ly bent rubber or foam layers.
r� To avoid mechanical pre-load and false signals, do not bend the sen-sor in the act ive area to a radius of < 120 mm.
r� To avoid broken conductor lines, do not bend the connect ion tail to a radius of < 5 mm.
r� All sensors feature an air vent. Take care not to block it and to avoid liquids from penetrat ing through it.
r� All sensors feature a backing ad-hesive with a release liner. If you need to remove the liner, take care that surface and material proper-t ies match the backing adhesive.
Important Application Information
The sensor can be read out with or with-out calibrat ion, depending on the type of use and the accuracy required:
r� To avoid addit ional process costs for individual cell calibrat ion, all sensors can be read out without calibrat ion by using the typical response curves shown on pages 24 and 25. This may be useful if you have a high vol-ume market.
r� To ensure high sensor accuracy and repeatability, all sensors can be calibrated by three-point pressure response curve interpolat ion. Thanks to the very high environmental and mechanical robustness of the new HD sensor, no recalibrat ion is needed during the sensor’s lifet ime.
The sensor shows a very low hysteresis in the pressure response curve compared with the standard single cells described on pages 4 - 15 (about 20 %):
r� Hysteresis for HD 001: 3 %
r� Hysteresis for HD 002: 8 %
6JKU� KU� C� UKIPKƂECPV� CFXCPVCIG� HQT� CR-plicat ions where the pressure changes need to be monitored in a high frequency (e.g. monitoring of movements, impacts).
HD-FSR28 CIS

Single Sensor HD 001
A
A
24.75
61.5
10.5417.3
R7
R2
R6.15
R2
R2
Sensor Reference Backing Adhesive Crimp Type Housing
HD 001 AN Yes No crimps No HD 001 AS Yes Male No
HD-FSR
HD 001 AN-4
29 CIS

Single Sensor HD 002
7285
12-X
X S
YY
A
A
A
24.75
74.4
10.5417.3
R7
R2
R6.15
R2
R2
Sensor Reference Backing Adhesive Crimp Type Housing
HD 002 AN Yes No crimps No HD 002 AS Yes Male No
HD-FSR
For an indicat ion of the construct ion of HD 002
AN-4, please refer to the image of HD 001
AN-4 on the previous page.
30 CIS