cut scores to illinois standards achievement test
TRANSCRIPT

Cut Scores to Illinois Standards Achievement Test
Based on 2010 Scores Ben Ditkowsky, Ph.D.
For questions contact [email protected]
Curriculum Based Measures (CBMs) have been around for more than thirty
years. For at least the last decade schools around the country have been using Cut
Scores derived from CBM to predict which students are likely to struggle in school,
or meet standards on a high stakes test. In Illinois, Measured Effects Inc. has
provided Cut Scores to ISAT for the past seven years. This document provides Cut
Scores for Key Tests of Early Literacy and Reading Curriculum - Based Measurement
predictive of success on the Illinois Standards Achievement Test. The first table,
Table 1 provides Cut Scores that predict success upon entry of third grade based on
an R-CBM score of 75 to 80 Words Read Correctly. The second table, Table 2,
provides Cut Scores that were directly linked to the ISAT for the same year, 2010.
There are many valid ways in which Cut Scores may be used. In general, the
Cut Scores function very well. They were derived from data from thousands of
individually administered measures, furnished from school districts across the state
of Illinois, including data from rural, suburban and urban school districts. The Cut
Scores do not provide a perfect prediction. When we think about it, it is remarkable
to think that a one minute sample of oral reading in September, January or May
would be able to predict the results of a test lasting more than two hours
administered over two to three days in March, but it does. The benefits of CBM are
far more widespread than the simple use of Cut Scores, In the document below, I
have summarized some of the ways in which Cut Scores can be used.
Cut Scores to Illinois Standards Achievement Test
Based on 2010 Scores Ben Ditkowsky, Ph.D.
For questions contact [email protected]
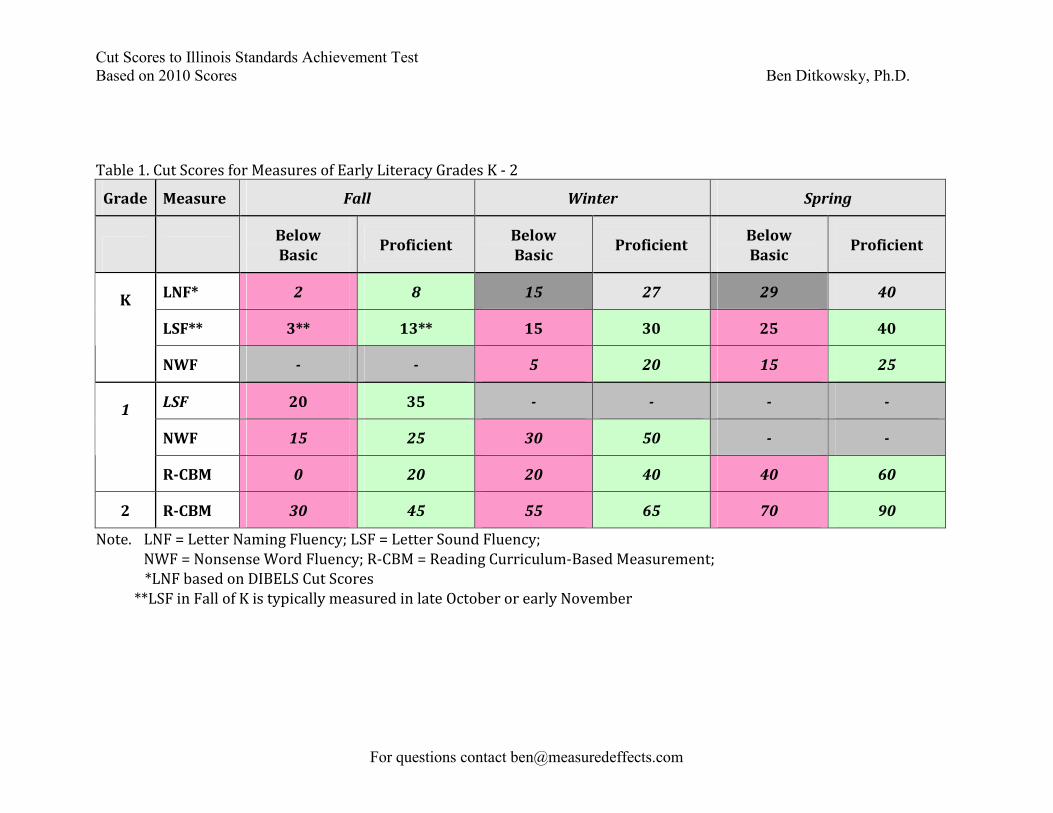
Table 1. Cut Scores for Measures of Early Literacy Grades K - 2
Grade Measure Fall Winter Spring
Below
Basic Proficient
Below
Basic Proficient
Below
Basic Proficient
LNF* 2 8 15 27 29 40
LSF** 3** 13** 15 30 25 40
K
NWF - - 5 20 15 25
LSF 20 35 - - - -
NWF 15 25 30 50 - -
1
R-CBM 0 20 20 40 40 60
2 R-CBM 30 45 55 65 70 90
Note. LNF = Letter Naming Fluency; LSF = Letter Sound Fluency;
NWF = Nonsense Word Fluency; R-CBM = Reading Curriculum-Based Measurement;
*LNF based on DIBELS Cut Scores
**LSF in Fall of K is typically measured in late October or early November
Cut Scores to Illinois Standards Achievement Test
Based on 2010 Scores Ben Ditkowsky, Ph.D.
For questions contact [email protected]
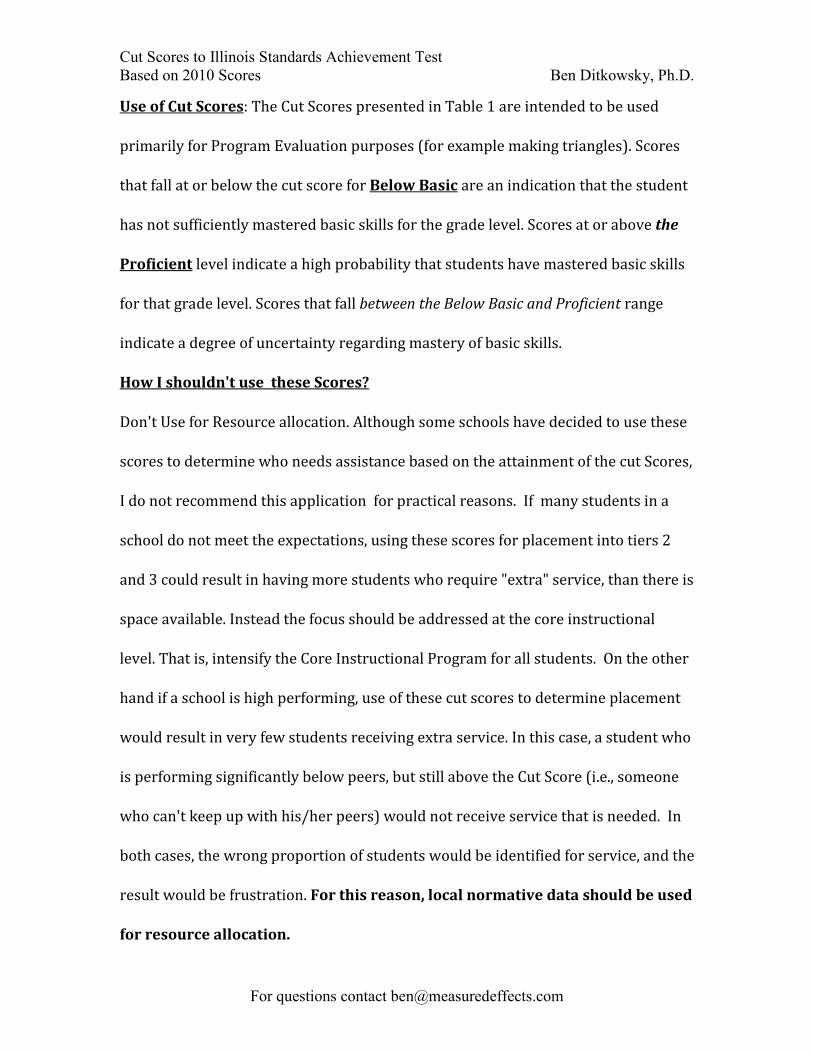
Use of Cut Scores: The Cut Scores presented in Table 1 are intended to be used
primarily for Program Evaluation purposes (for example making triangles). Scores
that fall at or below the cut score for Below Basic are an indication that the student
has not sufficiently mastered basic skills for the grade level. Scores at or above the
Proficient level indicate a high probability that students have mastered basic skills
for that grade level. Scores that fall between the Below Basic and Proficient range
indicate a degree of uncertainty regarding mastery of basic skills.
How I shouldn't use these Scores?
Don't Use for Resource allocation. Although some schools have decided to use these
scores to determine who needs assistance based on the attainment of the cut Scores,
I do not recommend this application for practical reasons. If many students in a
school do not meet the expectations, using these scores for placement into tiers 2
and 3 could result in having more students who require "extra" service, than there is
space available. Instead the focus should be addressed at the core instructional
level. That is, intensify the Core Instructional Program for all students. On the other
hand if a school is high performing, use of these cut scores to determine placement
would result in very few students receiving extra service. In this case, a student who
is performing significantly below peers, but still above the Cut Score (i.e., someone
who can't keep up with his/her peers) would not receive service that is needed. In
both cases, the wrong proportion of students would be identified for service, and the
result would be frustration. For this reason, local normative data should be used
for resource allocation.

Cut Scores to Illinois Standards Achievement Test
Based on 2010 Scores Ben Ditkowsky, Ph.D.
For questions contact [email protected]
How I should use these Scores?
The Cut Scores are useful as a guide to determine if groups of students are on-track
at a given point in the school year. In figure 2 below examples of how to use Cut
Scores to ISAT are listed.
Readiness for Core
Program
Season
Compare
current students
to Previous
cohort
Determine if
there is
sufficient
Growth
Goal Setting
for Tier 2
intervention
Identify
students
for
accelerati
on
Intensify
the Core
Enhance
the Core
Fall x x x x x
Winter x x x x x X
Spring x x x x x X
Figure 2. Examples Of How To Use Cut Scores To ISAT
In the fall, the Cut Scores are useful for predictive purposes. For example, one might
use Cut Scores to determine if incoming students are ready for the standard
curriculum, as is, without modification or if the core program may need to be
intensified. Along the same lines, calculation of the proportion of students who fall
within a band (i.e., below basic, proficient) will provide teachers with a general idea,
whether the class this year is higher or lower performing than classes in previous
years.
In Table 2 an additional category, Confidently Proficient has been added.
Students who score in this range may also need something different from the Core
Instructional Program, but instead of remedial assistance, these students are
typically ready to move ahead at a faster rate, delving deeper into the curriculum
Cut Scores to Illinois Standards Achievement Test
Based on 2010 Scores Ben Ditkowsky, Ph.D.
For questions contact [email protected]
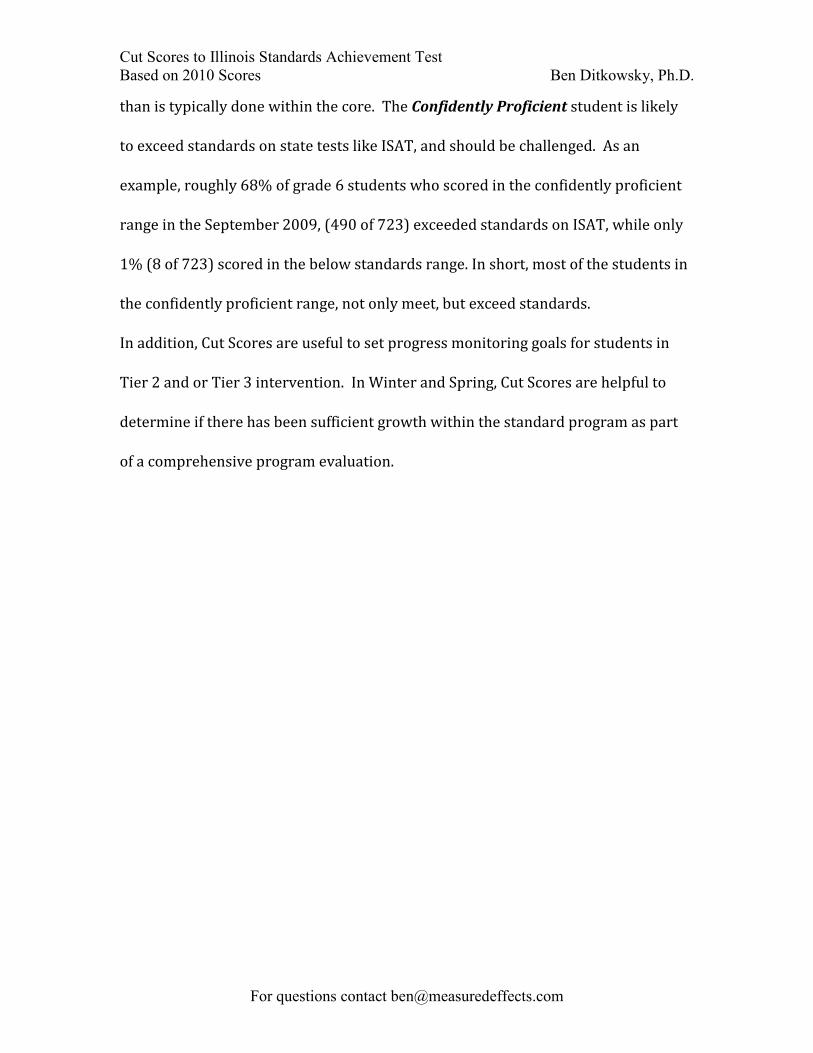
than is typically done within the core. The Confidently Proficient student is likely
to exceed standards on state tests like ISAT, and should be challenged. As an
example, roughly 68% of grade 6 students who scored in the confidently proficient
range in the September 2009, (490 of 723) exceeded standards on ISAT, while only
1% (8 of 723) scored in the below standards range. In short, most of the students in
the confidently proficient range, not only meet, but exceed standards.
In addition, Cut Scores are useful to set progress monitoring goals for students in
Tier 2 and or Tier 3 intervention. In Winter and Spring, Cut Scores are helpful to
determine if there has been sufficient growth within the standard program as part
of a comprehensive program evaluation.

Cut Scores to Illinois Standards Achievement Test
Based on 2010 Scores Ben Ditkowsky, Ph.D.
For questions contact [email protected]
Table 2. Cut Scores to the Illinois Standards Achievement Test (ISAT)
Fall Winter Spring
Grade Measure Below
Basic Proficient
Confidently
Proficient
Below
Basic Proficient
Confidently
Proficient
Below
Basic Proficient
Confidently
Proficient
118 140 158
75 100 119 3 R-CBM
48 73 92
134 153 169
94 113 127 4 R-CBM
69 89 102
148 165 181
107 125 141 5 R-CBM
80 97 113
170 185 198
118 133 143 6 R-CBM
89 105 111
187 199 213
131 142 152 7 R-CBM
103 114 123
207 219 228
120 132 140 8 R-CBM
94 105 114
Note R-CBM = Reading Curriculum-Based Measurement;
Based on N paired CBM and ISAT scores; Grade 3,N~3400; Grade 4, N ~3300; Grade 5, N ~3400; Grade 6, N~2600; Grade
7, N ~ 2300; Grade 8, N ~ 2300.

Cut Scores to Illinois Standards Achievement Test
Based on 2010 Scores Ben Ditkowsky, Ph.D.
For questions contact [email protected]
Cut Scores for the ISAT presented in Table 2 were derived using data from the 2009-
10 school year and ISAT in March 2010. Scores at-or below values of below basic
indicate justification for concern. Scores at or above the Confidently Proficient
level indicate we can be confident that the student has mastered basic skills, and in
most cases have exceeded expectations for the grade level (i.e., likely to exceed
standards on ISAT). Scores above the Proficient level but below the Confidently
Proficient level indicate a high probability that students have mastered basic skills
for that grade level. Scores that fall between the Below Basic and Proficient range
indicate a degree of uncertainty regarding mastery of basic skills. Scores that fall at
or below the cut score for Below Basic are an indication that the student has not
sufficiently mastered basic skills for the grade level.
Stability of Validity Coefficients: Performance of cut scores across years and
districts has been stable +/- 10% including revised ISAT 05-06, 06-07, 07-08, 09-10
for grade 3. Cut-scores are approximated with a combination of logistic regression
and discriminant function analysis with the criterion measure being the state test
for Illinois (ISAT). Bootstrap resampling of repeated logistic regressions of third
grade data revealed asymmetric 95% empirical confidence intervals within 4 WRC.
Specifically, the 2007-08 Fall cut score for Below Basic of 51 ranged from 51 to 54
WRC; The Fall Proficient Cut Score of 77 ranged from 76 to 80.
Receive Operator Characteristic Curve (ROC) and the Area Under the Curve
Cut Scores to Illinois Standards Achievement Test
Based on 2010 Scores Ben Ditkowsky, Ph.D.
For questions contact [email protected]
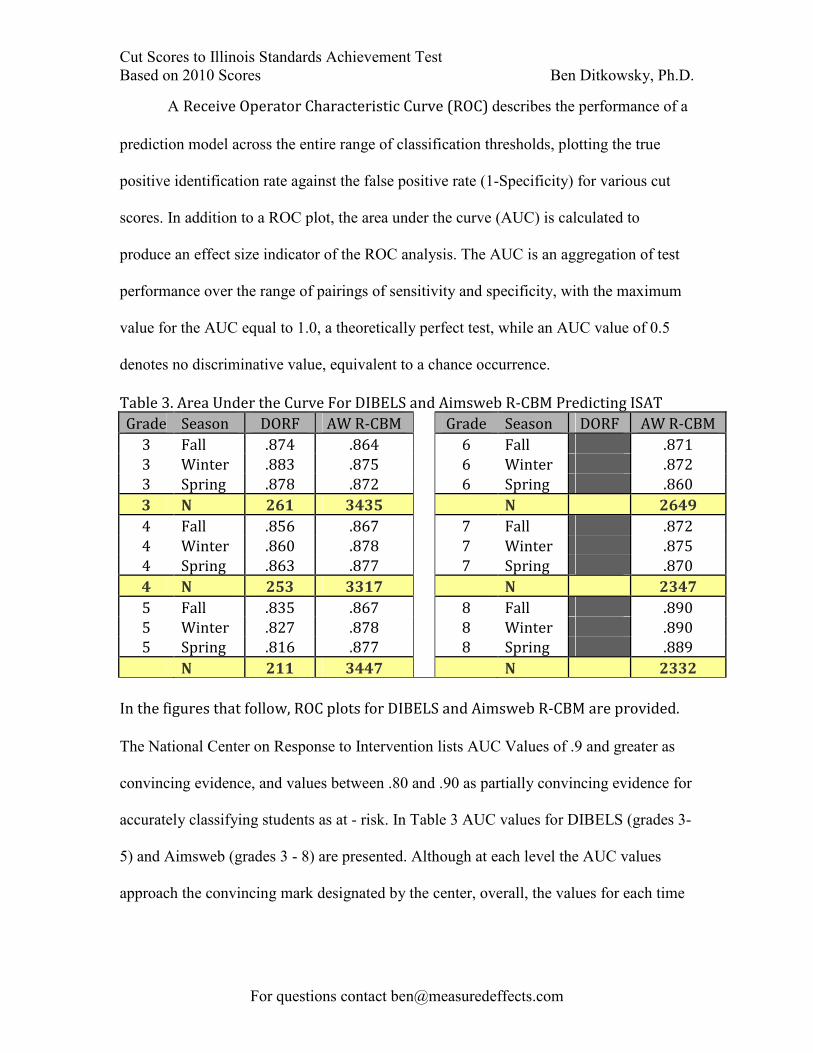
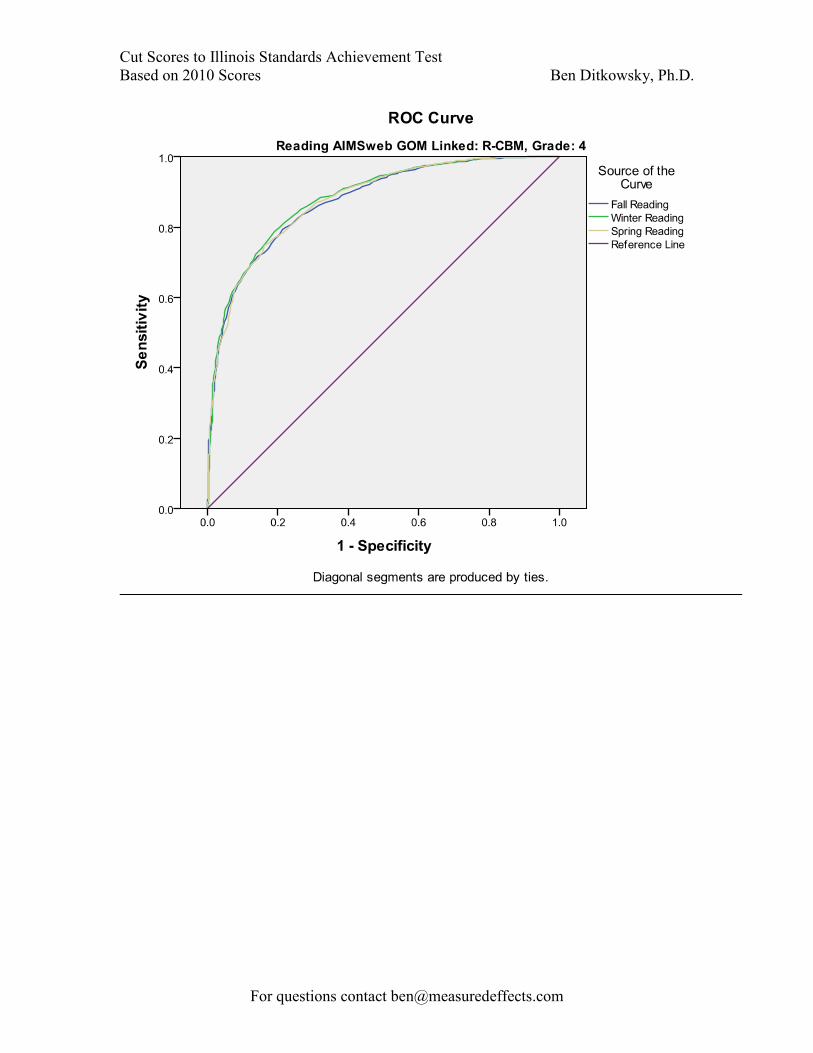
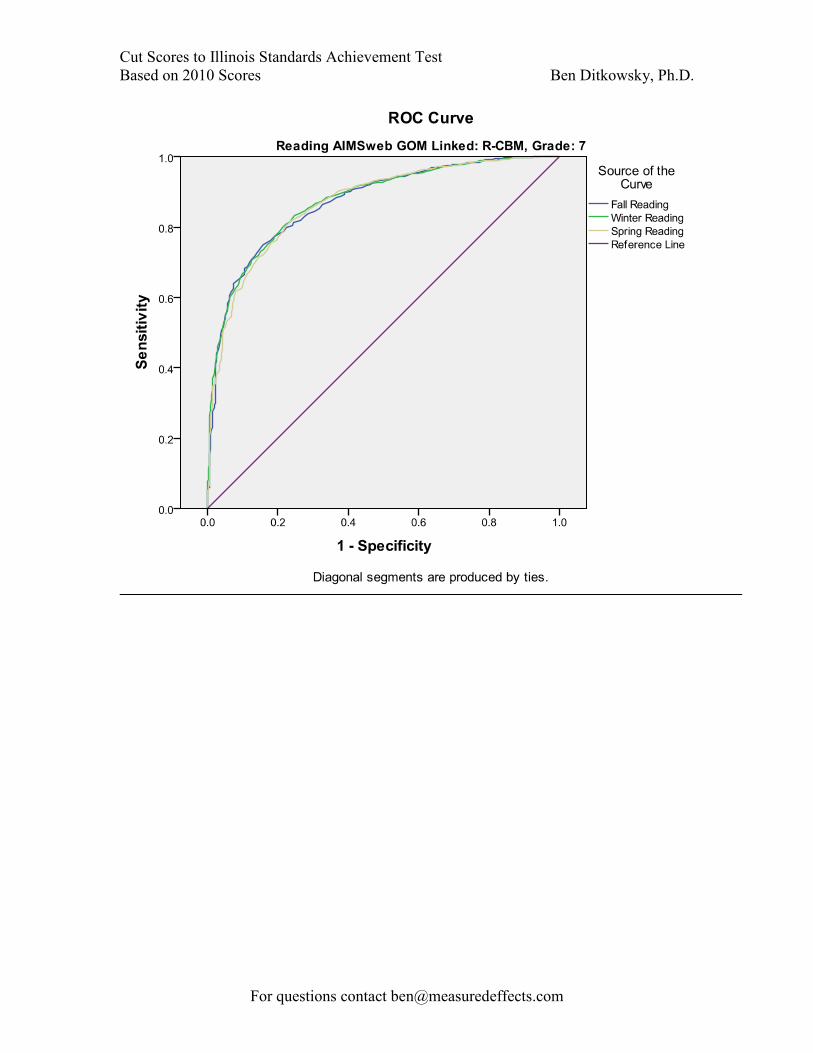
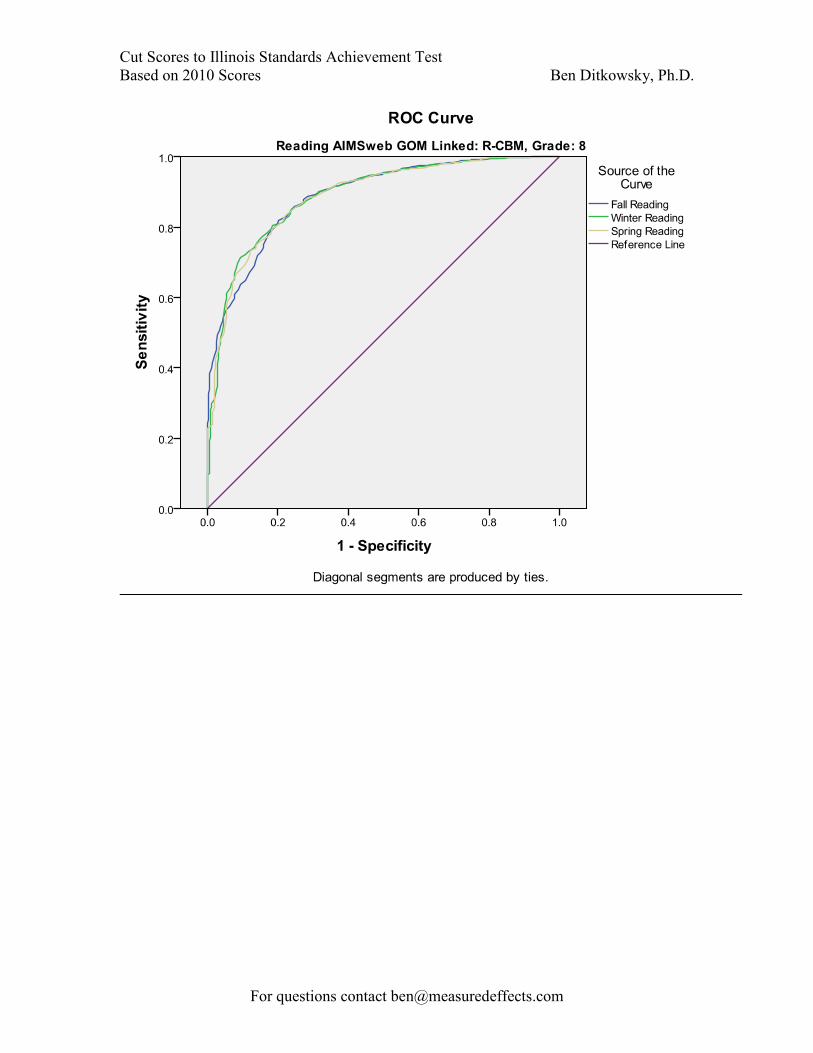
A Receive Operator Characteristic Curve (ROC) describes the performance of a
prediction model across the entire range of classification thresholds, plotting the true
positive identification rate against the false positive rate (1-Specificity) for various cut
scores. In addition to a ROC plot, the area under the curve (AUC) is calculated to
produce an effect size indicator of the ROC analysis. The AUC is an aggregation of test
performance over the range of pairings of sensitivity and specificity, with the maximum
value for the AUC equal to 1.0, a theoretically perfect test, while an AUC value of 0.5
denotes no discriminative value, equivalent to a chance occurrence.
Table 3. Area Under the Curve For DIBELS and Aimsweb R-CBM Predicting ISAT
Grade Season DORF AW R-CBM Grade Season DORF AW R-CBM
3 Fall .874 .864 6 Fall .871
3 Winter .883 .875 6 Winter .872
3 Spring .878 .872 6 Spring .860
3 N 261 3435 N 2649
4 Fall .856 .867 7 Fall .872
4 Winter .860 .878 7 Winter .875
4 Spring .863 .877 7 Spring .870
4 N 253 3317 N 2347
5 Fall .835 .867 8 Fall .890
5 Winter .827 .878 8 Winter .890
5 Spring .816 .877 8 Spring .889
N 211 3447 N 2332
In the figures that follow, ROC plots for DIBELS and Aimsweb R-CBM are provided.
The National Center on Response to Intervention lists AUC Values of .9 and greater as
convincing evidence, and values between .80 and .90 as partially convincing evidence for
accurately classifying students as at - risk. In Table 3 AUC values for DIBELS (grades 3-
5) and Aimsweb (grades 3 - 8) are presented. Although at each level the AUC values
approach the convincing mark designated by the center, overall, the values for each time

Cut Scores to Illinois Standards Achievement Test
Based on 2010 Scores Ben Ditkowsky, Ph.D.
For questions contact [email protected]
period and at every grade level provide partially convincing evidence.

Cut Scores to Illinois Standards Achievement Test
Based on 2010 Scores Ben Ditkowsky, Ph.D.
For questions contact [email protected]

Cut Scores to Illinois Standards Achievement Test
Based on 2010 Scores Ben Ditkowsky, Ph.D.
For questions contact [email protected]

Cut Scores to Illinois Standards Achievement Test
Based on 2010 Scores Ben Ditkowsky, Ph.D.
For questions contact [email protected]
Cut Scores to Illinois Standards Achievement Test
Based on 2010 Scores Ben Ditkowsky, Ph.D.
For questions contact [email protected]

Cut Scores to Illinois Standards Achievement Test
Based on 2010 Scores Ben Ditkowsky, Ph.D.
For questions contact [email protected]

Cut Scores to Illinois Standards Achievement Test
Based on 2010 Scores Ben Ditkowsky, Ph.D.
For questions contact [email protected]
Cut Scores to Illinois Standards Achievement Test
Based on 2010 Scores Ben Ditkowsky, Ph.D.
For questions contact [email protected]
Cut Scores to Illinois Standards Achievement Test
Based on 2010 Scores Ben Ditkowsky, Ph.D.
For questions contact [email protected]

Cut Scores to Illinois Standards Achievement Test
Based on 2010 Scores Ben Ditkowsky, Ph.D.
For questions contact [email protected]
Predictive Validity. Fall, Winter and Spring Reading Curriculum-Based
Measurement scores for students from grades 3 - 8 were compared to scores from
the Illinois Standards Achievement Test. For each grade and time period the number
of scores varied, however for each grade level and time period no fewer than 2500
pairs of scores were considered (for grades 3 - 8 the approximate number of paired
scores was 4300, 4200, 4400, 3300, 3000, 3000 respectively. Concurrent, Criterion
- Related Validity was computed for each Fall, Winter and Spring Session with R-
CBM as the predictor variable and the Illinois Standards Achievement Test as the
Criterion measure.) were consistently though larger than predictive coefficients.
Table 4. Criterion - related Validity of R-CBM and ISAT
R-CBM
Grad
e Source Fall Winter Spring
3 .70 .72 .72
4 ISAT .70 .71 .70
5 Reading .70 .71 .70
6 Scale .69 .69 .66
7 Score .67 .67 .64
8 .67 .67 .64
Obtained validity coefficients reveal that between 41 and 52% of the variance in
ISAT scores is explained by CBM. Not too bad when we consider that we are saying
that 50% of the variance in scores on a two hour test is predicted by a one minute
sample of oral reading!