cytokine kinetics in febrile neutropenic children...
TRANSCRIPT

Research ArticleCytokine Kinetics in Febrile Neutropenic Children:Insights on the Usefulness as Sepsis Biomarkers, Influence ofFilgrastim, and Behavior of the IL-23/IL-17 Pathway
Orlei Ribeiro de Araujo,1 Reinaldo Salomão,2 Milena Karina Coló Brunialti,2
Dafne Cardoso Bourguignon da Silva,1 Andreza Almeida Senerchia,1
Fabianne Altruda de Moraes Costa Carlesse,1 and Antonio Sergio Petrilli1
1Grupo de Apoio ao Adolescente e à Criança com Câncer (GRAACC), Instituto de Oncologia Pediatrica (IOP), Sao Paulo FederalUniversity (UNIFESP), Rua Pedro de Toledo 572-Vila Clementino, 04039-001 São Paulo, SP, Brazil2Division of Infectious Diseases, Department of Medicine, Escola Paulista de Medicina, Sao Paulo Federal University (UNIFESP),Rua Pedro de Toledo 669, 10th Floor, 04039-001 São Paulo, SP, Brazil
Correspondence should be addressed to Orlei Ribeiro de Araujo; [email protected]
Received 19 January 2017; Revised 4 May 2017; Accepted 5 June 2017; Published 9 July 2017
Academic Editor: Teresa Zelante
Copyright © 2017 Orlei Ribeiro de Araujo et al. This is an open access article distributed under the Creative Commons AttributionLicense, which permits unrestricted use, distribution, and reproduction in any medium, provided the original work isproperly cited.
Background. The study aimed to describe the kinetics of various cytokines from day 1 to day 14 of the onset of fever in neutropenicchildren and to evaluate their performances as discriminators of sepsis in the first 24 hours of fever, the possible influence offilgrastim, and the functioning of the IL-23/IL-17 axis. Methods. IL-1β, TNF-α, IL-10, IL-12/23p40, IL-21, IL-6, IL-8, IL-17,G-CSF, and GM-CSF were measured in plasma on days 1, 2, 3, 5, and 14 from the onset of fever in 35 patients. Results. Thirteenpatients (37.1%) developed sepsis. In mixed models, IL-6, IL-8, IL-10, and G-CSF showed higher estimated means in septicpatients (P < 0 005), and IL-12/23p40 and IL-17 in nonseptic patients (P < 0 05). On day 1, IL-6, IL-8, and IL-10 appearedupregulated in patients who received filgrastim. Only IL-6, IL-8, IL-10, and procalcitonin were useful as discriminators of sepsis.Associating the markers with each other or to a risk assessment model improved performance. Conclusions. Cytokines kineticsshowed proinflammatory and anti-inflammatory responses similar to what is described in nonneutropenic patients. IL-8, IL-6,IL-10, and procalcitonin are useful as early biomarkers of sepsis. Filgrastim upregulates expression of these markers, and weobserved deficiency in the IL-23-IL-17 axis accompanying sepsis.
1. Introduction
The complex interactions that initiate the inflammatoryresponse in sepsis can be triggered by molecules expressedby pathogens (PAMPs or pathogen-associated molecularpatterns) or derived from the injured tissues themselves(DAMPs or damage-associated molecular patterns). Inflam-matory processes that originate from bacterial infectionscan be similar, in terms of fever and expression of mediators,to the ones arising from traumatic tissue injury and tumors[1, 2]. Diagnosing bacterial infections in children with cancercan pose difficulties, due to inflammation already present byintermittent exposure to signaling DAMPs released from
normal or malignant cells destroyed by cytotoxic treatment.These children often present signs of systemic inflammatoryresponse syndrome (SIRS), such as fever and tachycardia inthe absence of infection (sterile inflammation). However,the rapid diagnosis of infections in these patients is criticalbecause the delay in the administration of appropriateantibiotics is associated with high mortality. Furthermore,chemotherapy is postponed in the presence of infection.Thus, differentiating sterile inflammation from infection isalso important to avoid interruptions in treatment [3–5].
Information on proinflammatory and anti-inflammatoryimmune responses has increased in the recent years, demon-strating sepsis as a highly dynamic biological process, with
HindawiMediators of InflammationVolume 2017, Article ID 8291316, 10 pageshttps://doi.org/10.1155/2017/8291316

immunosuppression signals coexisting with the inflamma-tion from the initial stages [6]. One of the immunosuppres-sive mechanisms is deficient production of inflammatorycytokines, such as IL-1β, IL-12, TNF-α, and IL-6, withoutreduction or with increase in production of anti-inflammatory cytokines such as IL-10, by macrophages, andby monocytes undergoing reprogramming [7, 8]. Thesemechanisms augment the immunosuppression already pres-ent in the patient with cancer. Inflammatory signs and symp-toms are usually described as attenuated in infections offebrile neutropenic patients [9], assuming that inflammatoryresponse is also attenuated, but which is in fact understudied.Although mediators such as IL-8 and IL-6 have been evalu-ated in febrile neutropenic children as risk markers for severeinfections, the kinetics of cytokines during the time of feveror occurrence of sepsis has been rarely studied [10]. Wefound no data, for example, about the behavior of theIL-23/IL-17 axis, associated with protective immunity at muco-sal surfaces [11], a decisive factor in bacterial translocation inpatients undergoing chemotherapy. In addition, there are nodata on potential pro- or anti-inflammatory effects of filgras-tim, an analogue of cytokine granulocyte colony-stimulatingfactor (G-CSF) widely used in the treatment of neutropenia.
The main objectives of this study were to investigate thedynamics of the inflammatory and anti-inflammatoryresponses in febrile neutropenic children, throughout theprogression of intercurrent sepsis and recovery of leukocytes,by means of the measurement of circulating cytokines(IL-1β, TNF-α, IL-10, IL-12/23p40, IL-21, IL-6, IL-8, IL-17,G-CSF, and GM-CSF) in plasma. Also, we aimed to evaluatethe performance of these cytokines as sepsis discriminatorscompared with procalcitonin (PCT) and a clinical/laboratorymodel for risk assessment on the first day of fever. Secondaryobjectives were to assess the possible influence of filgrastimon the expression of these markers and the proper function-ing of IL-17/IL-23 axis in these patients.
2. Methods
The protocol was approved by the local Ethics Committee.After informed consent was obtained from parents, patientsaged up to 18 years (incomplete) were sequentially included,according to the following criteria: presence of an oncologicdisease and low- or high-risk for febrile neutropenia (accord-ing to a high-risk assessment model based on clinical dataand CRP; Table 1). Patients were followed for 60 days. Sepsiswas defined according to the 2005 consensus [12]. Bloodsamples (2mL) were collected from patients on the first dayof fever in children with neutropenia and then on days 2, 3,5, and 14. After centrifugation and separation of plasma,samples were frozen initially at −20°C and posteriorly at−80°C. IL-1β, TNF-α, IL-10, IL-12/23p40, IL-21, IL-6, IL-8,IL-17, G-CSF, and GM-CSF were measured using the Cyto-metric Bead Array (CBA) Flex Set from Becton & Dickinson(BD Biosciences, San Jose, CA, USA). PCT was measured byELISA (Human Procalcitonin ELISA, Biovendor, Brno,Czech Republic). Additional blood samples (2mL) werecollected in EDTA tubes for blood cell analyses, which wereperformed in automated counter (Cell-Dyn Ruby, Abbott,
Illinois, USA), with microscopic examination of blood smearby the hematologist when necessary.
Data were analyzed with SPSS 20.0 software (IBM Corp.,Armonk, NY, USA) and Minitab 17 (Minitab Inc., StateCollege, PA, USA). The variables were described as mediansand interquartile ranges. The value of significance wasP < 0 05. Differences between groups were evaluated usingthe Mann–Whitney U test. Correlations were assessed bythe Spearman test and linear regression. Bootstrap was usedto determine the confidence intervals and the standard errorwith resampling of at least 1000 tables. ROC curves were usedto assess usefulness of markers as discriminators of sepsis.Optimal cutoff points were determined by the Youden Jindex (J= {maximum sensitivity + specificity− 1}) [13]. Like-lihood ratios were calculated to assess the possible influenceof the tests in clinical decisions [14].
3. Results
We included 35 patients, whose epidemiological character-istics are shown in Table 2. Circulating cytokine, PCT, andCRP levels at admission and during follow-up are shownin Table 3.
Table 1: Definition of febrile neutropenia and risk assessmentmodel for serious infections.
Definition of low-risk febrile neutropenia
(i) Neutrophil count (<500 cells/μL)(ii) Fever (one axillary temperature >38°C, or 3 measures >37.5
and <38°C, with a 4-hour interval between measurements, in24 hours)
(iii) Solid tumors without comorbidities (see below)
(iv) Acute lymphoblastic leukemia (ALL) in remission withoutcomorbidities
(v) Lymphomas in remission without comorbidities(vi) C-reactive protein (CRP) (<90mg/L)
(vii) Treatment: outpatient (daily monitoring until the end ofantibiotic therapy)
Definition of high-risk febrile neutropenia
(i) Neutrophil count (<500 cells/μL)(ii) Fever (one axillary temperature >38°C, or 3 measures >37.5
and <38°C, with a 4-hour interval between measurements, in24 hours)
(iii) Acute myeloid leukemia (AML) in activity or remission
(iv) Solid tumors with comorbidities (see below) or treated withhigh-dose chemotherapy
(v) Acute lymphoblastic leukemia in activity or comorbidities
(vi) Lymphomas in activity or comorbidities
(vii) CRP >90mg/L
(viii) Treatment: in hospital
Comorbidities
(i) Meningitis, pneumonia, diarrhea or vomiting, mucositisgrade 3 or 4, hypotension, signs of sepsis or bacteremia,metabolic changes, disease activity with medullary invasion,age <3 years, suspected catheter-related infections, severeabdominal pain or abdominal distension, radiologic findingssuggestive of typhlitis, perianal abscess
2 Mediators of Inflammation

Thirteen patients (37.1%) developed sepsis within 72hours after diagnosis of febrile neutropenia. Of these, sixshowed clinical signs of severe sepsis and four had septicshock. Nine of the thirteen patients who developed sepsiswere initially categorized as high risk. Bacteria were foundin ten septic patients: in eight patients via blood culture (fourcatheter-drawn and four venipuncture) and in two patientsvia urine cultures. Blood cultures were positive for threecoagulase-negative staphylococci (two Staphylococcus epider-midis, one Staphylococcus caprae), one Enterococcus raffino-sus, two E. coli, and one Enterobacter sp. In one case, thesame bacterium (Pseudomonas oryzihabitans) was isolatedboth in peripheral and catheter blood cultures. Two urinecultures were positive for Klebsiella pneumoniae. In threepatients with signs of shock, no bacteria were recovered.There were no deaths within 60 days after enrollment. Sixpatients (17.1%) were admitted to the intensive care unit(ICU). The kinetics of cytokines in septic and nonsepticpatients is shown in Figure 1.
3.1. Factor Analysis.Cytokines were included in a factor anal-ysis model comprising the five moments of measurement.The cumulative total variance explained by the model was94.1%, with a Kaiser–Meyer–Olkin measure of sampling ade-quacy of 0.85 and Bartlett’s sphericity test with P < 0 0001.The model reduced the 10 variables to three factors, whoseloadings are shown in Table 4. G-CSF presented communal-ity <0.4 and was removed.
The scores computed for factors 1, 2, and 3 were analyzedby mixed models with repeated measurements and sepsis asfixed effects. Factor 2, representing IL-6, IL-8, and IL-10loadings, showed different estimated means between sepsisand nonsepsis (−0.34 and 0.33; P = 0 000) and negativelycorrelated (Spearman) with number of neutrophils (coeffi-cient: −0.56; P = 0 000), lymphocytes (−0.36; P = 0 001),
and monocytes (−0.43; P = 0 000). Factor 1, representingIL-1β, IL-17, IL-12/23p40, IL-17, IL-21, and TNF-α loadings,showed a negative correlation (coefficient: −0.39; P = 0 013)with CRP and positive with the number of neutrophils (coef-ficient: 0.36; P = 0 001) and monocytes (coefficient: 0.23;P = 0 035). Factor 3, comprising GM-CSF loading, showeda negative correlation with the total number of monocytes(coefficient: −0.23; P = 0 037). Factors 1 and 3 showed nodifferences in estimated means for sepsis.
3.2. Mixed Models for Individual Markers. IL-6 showedsignificant temporal variation (negative slope) between day1 and day 3 (estimated mean difference: −209 pg/mL;P = 0 000), between day 1 and day 5 (mean difference:−173.7; P = 0, 02), and between day 1 and day 14 (−242.5;P = 0 000). In the evaluation of sepsis as a fixed effect, theestimated means were 181.1 pg/mL for septic patients and24.8 for the others (P = 0 000).
IL-8 showed different estimated means for patients whodeveloped sepsis (265.9 pg/mL) and patients who did not(40.9; P = 0 0000). It also showed significant temporal varia-tion with negative slope between day 1 and day 3 (estimatedmean difference: −364 pg/mL; P = 0 002), between day 1 andday 5 (−363.5 pg/mL; P = 0 003), and between day 1 and day14 (−434.7; P = 0 000).
For IL-10, the estimated means were also differentbetween patients with sepsis and nonseptic patients (8.5 pg/mL and 1.9; P = 0 004). There was significant temporal vari-ation, with negative slope between day 1 and day 2 (estimatedmean difference: −11.5; P = 0 038), between day 1 and day 3(−14; P = 0 011), between day 1 and day 5 (difference: −14.9;P = 0 007), and between day 1 and day 14 (−15.6; P = 0 005).Figure 2 shows the fitting lines for IL-6, IL-8, and IL-10, forseptic and nonseptic patients.
IL-12/23p40 had higher estimated means for the nonoc-currence of sepsis (263.3 pg/mL versus 93.5 for sepsis;P = 0 044). There was no significant temporal variation.
IL-17 also showed no significant temporal variation. Forpatients who developed sepsis, the estimated means were2.22 pg/mL, and for the others, 26.5 pg/mL (P = 0 04). Thecorrelation between IL-17 and IL-12/23p40 was linear withR2 = 0.88 (P = 0 000). Figure 3 shows the fitting lines ofIL-12/23p40 and IL-17 along the measurements and theirlinear regression.
There was no significant temporal variation of IL-1β. Forpatients with sepsis, the estimated means were 7.7, and fornonseptic patients, 0.41 pg/mL (P = 0 11). IL-21 showedexpression in only one nonseptic patient on day 1, witherratic expression in a few other patients along the days,and was not analyzed in mixed models.
GM-CSF showed estimated means of 1.3 and 1.8 pg/mLfor patients with sepsis or not (P = 0 15). There was nosignificant temporal variation.
TNF-α had estimated means of 1.44 pg/mL for patientswith sepsis, and 4.6 (P = 0 16) for nonseptic patients, alsowith no significant temporal variation.
Leukocytes (total counts) showed significant temporalvariation (positive slope), with a mean difference of +1369cells/μL between day 1 and day 5 (P = 0 003) and +3059
Table 2: General data (N, %). IQR: interquartile range.
N 35
Age (years, median, IQR) 5.84 (3.7–10.3)
Male 10 (28.6%)
Received antibiotics 35 (100%)
Diagnoses
Acute lymphocytic leukemia 6 (17.1%)
Acute myelogenous leukemia 3 (8.6%)
Non-Hodgkin’s lymphoma 6 (17.1%)
Wilms’ tumor 4 (11.4%)
Primitive neuroectodermal tumor (PNET) 2 (5.7%)
Retinoblastoma 2 (5.7%)
Ewing’s sarcoma 2 (5.7%)
Chronic myeloid leukemia 1 (2.9%)
Other solid tumors 9 (25.7%)
Received filgrastim 19 (54.2%)
Days receiving filgrastim before day 1of the study (mean, range)
4.5 (1–7)
Low risk 11 (31.5%)
High risk (hospitalized) 24 (68.5%)
3Mediators of Inflammation

cells/μL between day 1 and day 14. For septic patients, themean estimated leukocyte counts were 1608 cells/μL versus2067 cells/μL for nonseptic patients (P = 0 3). For neutro-phils, the estimated means were 967 and 745 cells/μL forseptic patients or nonseptic patients (P = 0 46). There wasan increase along the days (mean difference: +1850 cells/μLto day 14; P = 0 036). Lymphocytes also showed an increaseup to day 14 (+745 cells/μL; P = 0 02). For septic patientsor nonseptic patients, the estimated means were 483.1 and292.2 cells/μL (P = 0 08). Figure 4 shows the temporalvariation in the number of leukocytes.
Monocytes showed significant temporal variationbetween day 1 and day 3 (positive slope, mean difference:235 cells/μL; P = 0 03), between day 1 and day 5 (+371.8
cells/μL; P = 0 03), and between day 1 and day 14 (+592cells/μL; P = 0 001). For septic patients or nonseptic patients,the estimated means were 347 and 391 cells/μL (P = 0 63).When the occurrence of positive blood cultures was addedto the model, the estimated means were 107.8 and 257.8cells/μL for septic or nonseptic patients (P = 0 017).
Platelets decreased between the days 1 and 2 (meandifference: −46,827 platelets/μL; P = 0 027), increasing untilday 14 (+48,361 platelets/μL; P = 0 028). There were nosignificant differences related to the occurrence of sepsis.
The CRP showed estimated means of 106.1mg/L forseptic and 52.9 for nonseptic patients (P = 0 14), withsignificant temporal variation from days 1 to 5 (negativeslope, mean difference: −141.5).
Table 3: Values of biomarkers in the 5 days of measurements in median and interquartile ranges (25–75 percentiles).
Day Median IQR p25–75 Median IQR p25–75
IL-8 (pg/mL) IL-12/23p40 (pg/mL)
1 89.9 32.8–243.2 63.7 30.6–203.8
2 46.2 19.2–133.4 67.3 10.4–110.9
3 24.9 13.5–58.6 77.2 34.5–162.8
5 20.5 13.5–50.7 66.2 26.3–128.5
14 16.3 8.9–24.6 132.6 51–191.9
IL-6 (pg/mL) IL-10 (pg/mL)
1 57.3 31–198.2 2.2 0.6–10.2
2 21.6 10.1–49.9 2.6 0.1–5.4
3 12.7 5.9–36 1.8 0.8–3.3
5 11.9 4.7–35.6 1.1 0–1.7
14 6.3 3.8–7.7 0.4 0–1.7
IL-21 (pg/mL) TNF-α (pg/mL)
1 0 0-0 0 0–2.65
2 0 0-0 0 0–1.5
3 0 0-0 0.6 0–2.5
5 0 0-0 0.3 0–1.7
14 0 0-0 1.7 0–2.8
IL-1β (pg/mL) G-CSF (pg/mL)
1 0 0-0 2182.7 282.7–5739.5
2 0 0 2350.2 356–4793.9
3 0 0 947.9 139.9–4125
5 0 0-0.5 177 31–2232.4
14 0 0 28.1 15.5–50
IL-17 (pg/mL) GM-CSF (pg/mL)
1 0 0–2.6 0.1 0–2.8
2 0.5 0–3.7 0.9 0–3.4
3 1.1 0–4.9 0.6 0–2.4
5 1.6 0–2.8 0.6 0–1.9
14 2.8 0.5–6.4 1.6 0.4–2
C-reactive protein (mg/L) Procalcitonin (pg/mL)
1 56 28.9–98 149.1 0–909.6
2 78.5 61.8–95.3
3 87.2 54.2–130.6
5 47.7 16.2–87.5
14 7.7 5.7–7.2
4 Mediators of Inflammation

3.3. Filgrastim and Cytokine Levels. Among the patientsincluded, 19 were receiving filgrastim at the time of inclusionin accordance with chemotherapy protocols. Eight (42%) ofthese patients developed sepsis. On the first day of fever,IL-6, IL-8, IL-10, and G-CSF showed differences in the distri-bution or in the medians of patients who received filgrastimand those who did not. For IL-6, IL-8, and G-CSF, the differ-ences on the Mann–Whitney U test remained significantafter removal of septic patients: for IL-8, P = 0 042, 99% CI0.037–0.047; IL-6, P = 0 006, 99% CI 000.3–0.006; andG-CSF, P = 0 000. Despite the higher median of PCT inthe patients who received filgrastim, the difference was notsignificant (Table 5).
In the mixed model, G-CSF presented different estimatedmeans between septic and nonseptic patients (2685.76 and
1509.6; P = 0 009). The temporal variation was significant(negative slope), with a mean difference of −1608 betweenday 1 and day 5 and −3191 between day 1 and day 14.
3.4. Analysis of the Biomarkers as Sepsis Discriminators.Septic and nonseptic patients showed significant differ-ences at day 1 by the Spearman test for IL-8, IL-6,IL-10, and PCT. These markers were tested with ROCcurves as discriminators of sepsis, and their performancesare shown in Table 6. The performances of the cutoffvalues of the biomarkers, their combinations, and thecomparison with the high-risk assessment model areshown in Table 7.
Optimal cutoff points were determined by the Youden Jindex, ranging from 0 (zero—no accuracy) and 1 (perfecttest) [13]. For LR+, values >10 have a great impact on diag-nosis; between 5 and 10, moderate impact; and between 2and 5, low impact. For LR−, values <0.1 have a great impact.The impact is moderate for values between 0.1 and 0.2 andlow for values between 0.2 and 0.5. For both, values equalto 1 show no impact [14].
The use of filgrastim caused minor changes in the areasunder the ROC curves of IL-8 (0.88; P = 0 04) and IL-6(0.78; P = 0 037) for sepsis discrimination. For patientswho did not receive filgrastim, the AUC was 0.83 for IL-8(P = 0 034) and 0.9 for IL-6 (P = 0 009).
IL-8 and PCT correlated with the duration of fever by lin-ear regression (IL-8: P < 0 0001, R2 = 0 42; PCT: P < 0 0001,R2 = 0 45). IL-6 also showed a correlation with the time offever, but only on Spearman’s test (P = 0 001).
Nonseptic patients
800.00
600.00
400.00M
ean
200.00
0.00
1 2 3 5 14 1Days
2 3 5 14
Septic patients
IL-8IL-6IL-17
IL-12/23p40IL-10TNF-�훼
GM-CSFIL-1�훽
Figure 1: Kinetics of cytokines (observed means in pg/mL) on days 1, 2, 3, 5, and 14 of fever in febrile neutropenic patients. For bettervisualization, IL-21 (near absent expression) and G-CSF (very high levels due to filgrastim administration) were not shown.
Table 4: Factor analysis loadings of the three factors of the solution.Loadings > 0.7 (in bold) confirm that variables are represented byeach factor.
1 2 3
IL-8 −0.04 0.95 0.19
IL-6 −0.04 0.91 0.23
IL-21 0.99 −0.02 0.02
IL-17 0.98 −0.03 0.00
IL-12/23p40 0.96 −0.06 −0.02IL-10 0.01 0.89 −0.24TNF-α 0.99 0.00 0.02
GM-CSF 0.03 0.11 0.98
IL-1β 0.99 −0.02 0.02
5Mediators of Inflammation

4. Discussion
In our septic patients, the cytokines with a greater expressionwere IL-6 and IL-8, which are produced by multiple types ofcells, and were apparently spared by chemotherapy. IL-6 isproduced by lymphocytes, macrophages, dendritic cells,endothelial cells, fibroblasts, and smooth muscle cells inresponse to stimulation with LPS, IL-1, and TNF-α. IL-6levels tend to remain high in sepsis, and one of its biologicaleffects is the induction of fever [15, 16]. IL-8 also is producedby fibroblasts and epithelial, mesothelial, and endothelialcells, in addition to monocytes and neutrophils [17]. TNF-αand IL-1β, produced primarily by activated macrophages,had little expression. The peaks of systemic release of TNF-αand IL-1β occur quickly (90min after endotoxin administra-tion in human volunteers for TNF and 180min for IL-1β)[18]. In addition, both do not show consistent patterns ofgene expression and are highly variable between individuals,and their expression is downregulated by IL-6 and IL-10 [16].The inflammatory response in sepsis of febrile neutropeniaappears to be similar to that in the nonneutropenic patients[19]. In our study, the anti-inflammatory response, charac-terized by IL-10 expression, accompanied IL-8 and IL-6
variance in time, showing that pro- and anti-inflammatoryresponses occur early and simultaneously. The sharedvariance of IL-8, IL-6, and IL-10 (factor 2 in factor analysis)was correlated with the development of sepsis. The sharedvariance of IL-21, IL-17, IL-12/23p40, TNF-α, and IL-1β(factor 1) correlated positively with neutrophil and lympho-cyte counts and negatively with CRP, suggesting that thisvariance may be related to homeostasis regarding sterileinflammation, because CRP means decreased toward day 5,as leukocytes recovered.
The kinetics of cytokines observed in the mixed modelsshowed that there was initially a “storm” of IL-6 and IL-8,which was sustained on the first 2 days, correlating with thetime of fever and decreasing on the third day, in a proinflam-matory response similar to what is described in nonneutro-penic patients [20]. The concomitant anti-inflammatoryresponse of IL-10 also decreases sharply after the secondday. The fitting lines show that the expression of thesecytokines becomes similar between nonseptic and septicpatients at approximately day 10.
IL-12 and IL-23 share the subunit p40, and it was thissubunit that was measured in this study. Therefore, it is notpossible to determine the individual contribution of IL-12
10000.00
1000.00
IL-6 100.00
10.00
1.000.00
0 2 4 6Days
8 10 12 14
10000.00
1000.00
IL-8 100.00
10.00
1.000.00
100.00
IL-1
0
10.00
1.00
0.000 2 4 6
Days8 10 12 14 0 2 4 6
Days8 10 12 14
Figure 2: Fitting lines of IL-6, IL-8, and IL-10 (base-10 log scale) for the occurrence of sepsis (dashed line and diamonds) or not (solid lineand circles) on days 1, 2, 3, 5, and 14 of the onset of fever.
10000.00
IL-1
2/23
p40
IL-1
2/23
p40
1000.00
100.00
10.00
1.000.00
1000.00
IL-1
7
100.00
10.00
1.000.00
0 2 4 6 8Days
10 12 14 0 2 4 6 8Days
10 12 14 0.00
0.00
500.00
1000.00
1500.00
2000.00
2500.00
3000.00
100.00 200.00 300.00 400.00 500.00IL-17
Figure 3: Fitting lines for sepsis (dashed line and diamonds) or not (solid line and circles) for IL-12/23p40 (right) and IL-17 (center), in base-10log scale. On the left, the linear regression between values of IL-12/23p40 and IL-17 (R2 = 0 88).
6 Mediators of Inflammation

or IL-23. However, the linear relationship between the mea-surements of IL-12/23p40 and IL-17 (R2 = 0 88) suggests thatwe have been dealing almost exclusively with IL-23, which isthe inducer of IL-17, and that observed fluctuations mustbelong to axis IL-23/Th17. IL-12 and IL-23 are secretedmainly by resident tissue macrophages and dendritic cells.Whereas IL-12 promotes differentiation of naïve CD4 cellsin Th1 producing interferon (IFN-γ) cells, IL-23 does notpromote Th differentiation directly due to the absence orlow expression of IL-23 receptors (IL-23R) in naïve lympho-cytes. In mice, the transforming growth factor beta (TGF-β),IL-1, and IL-6 induce the expression of retinoic acid-relatedorphan receptor gamma (ROR-γt), a lineage-specific tran-scription factor that induces the transcription of IL-17Aand IL-17F, encoding genes in CD4+ naïve cells [21, 22].The later stages of Th17 differentiation (clonal expansion,phenotypic stabilization with IL-17 production) apparentlydepend on IL-23 expression [23]. Although the IL-23/Th17axis has been described as the orchestrator of the recruitmentand activation of neutrophils and a key player in chronic
inflammation and autoimmunity, recent evidence suggeststhat the effector cytokines Th17 (IL-17 and IL-22) play a cru-cial role in maintaining mucosal immunity, protectingagainst extracellular bacteria and fungi. This includes theintestinal lining, where these cytokines assist in maintainingthe physical barrier intact and induce the expression of anti-microbial peptides to prevent invasion by luminal bacteria[24]. It is well known that the intestinal flora is a majorsource of serious infections in patients undergoing chemo-therapy [25]. Our nonseptic patients had higher IL-12/23p40 and IL-17 means, suggesting integrity of the IL-23/Th17 axis, which is not apparent in the septic patients. Fiveof the eight isolates from blood cultures in our septic patientswere intestinal bacteria. The low expression of IL-17 can beexplained by depletion and impairment of naïve Th cells aftercytotoxic chemotherapy and by the reduction in absolutenumbers of lymphocytes producing IL-17 in septic patients[26, 27]. Depletion of CD4+ cells may also explain thealmost-absent expression of IL-21, another cytokine involvedin Th17 differentiation: IL-6 induces IL-21 expression, whichin turn amplifies an autocrine loop to induce more IL-21 andIL-23 receptors in naïve CD4+ cells. Both IL-21 and IL-23together with TGF-β can induce IL-17 expression irrespec-tive of IL-6 [28]. This deficiency in the IL-23/Th17 axismay be an important immunosuppressant factor in febrileneutropenic sepsis. It is not possible, however, to establishcausal relationships.
Various authors have studied the role of biomarkers fordiagnosing bacterial infections in children with febrile neu-tropenia. Stryjewski et al. evaluated IL-6, IL-8, and PCT fordiscrimination of bacterial sepsis in neutropenic childrenand observed an excellent discriminating power of PCT 24hours after admission. For IL-6 and IL-8, the power of dis-crimination was considered good after 24 and 48 hours afteradmission, and the best observed result was the combinationof IL-8 and PCT (sensitivity 94% and specificity 90% for PCT>500 and IL-8 >20 pg/mL) [29]. Urbonas et al. described anIL-10 sensitivity of 73% and a specificity of 92% (cut-off:18 pg/mL) for discrimination of sepsis or bacteremia infebrile neutropenic children [30]. In our study, we tried toevaluate the usefulness of other cytokines as discriminatorsof sepsis on admission, within the first 24 hours of fever,when clinical signs of severe infections can still be subtle orabsent in neutropenic children. We confirmed the observa-tions of other authors about the good performance of IL-6,IL-8, IL-10, and PCT. We also demonstrated that the
Table 5: Medians of biomarkers (pg/mL) on the day 1 of fever inpatients receiving filgrastim or not. ∗Mann–Whitney and mediantests; ‡Mann–Whitney test; †determined by Monte Carlosimulation with 10,000 tables.
Filgrastim No filgrastim P P 99% CI†
G-CSF 5838 302.9 0.000∗ 0.000-0.000
IL-8 155.4 58.2 0.011‡ 0.006–0.011
IL-6 132 39.5 0.007∗ 0.003–0.007
IL-10 5.51 1.2 0.004‡ 0.002–0.04
PCT 223.3 98.1 0.07‡ 0.06–0.08
Table 6: Performance of IL-6, IL-8, PCT, and IL-10 fordiscrimination of sepsis on day 1 of fever. AUC: area under theROC curve.
AUCStandarderror
P95% CI(sample)
95% CI(Bootstrap)
Youden(J)
IL-6 0.87 0.062 0.000 0.75–0.99 0.76–0.8 0.65
IL-8 0.86 0.074 0.000 0.72–1 0.83–0.87 0.7
PCT 0.89 0.054 0.000 0.78–0.99 0.87–0.90 0.64
IL-10 0.83 0.08 0.001 0.67–0.98 0.79–0.83 0.6
0.00
1 2 3Days
5 14
1000.00
2000.00
NeutrophilsLymphocytesMonocytes
Mea
n
3000.00
4000.00
Figure 4: Temporal evolution of leukocytes along the days(in means, cells/μL).
7Mediators of Inflammation
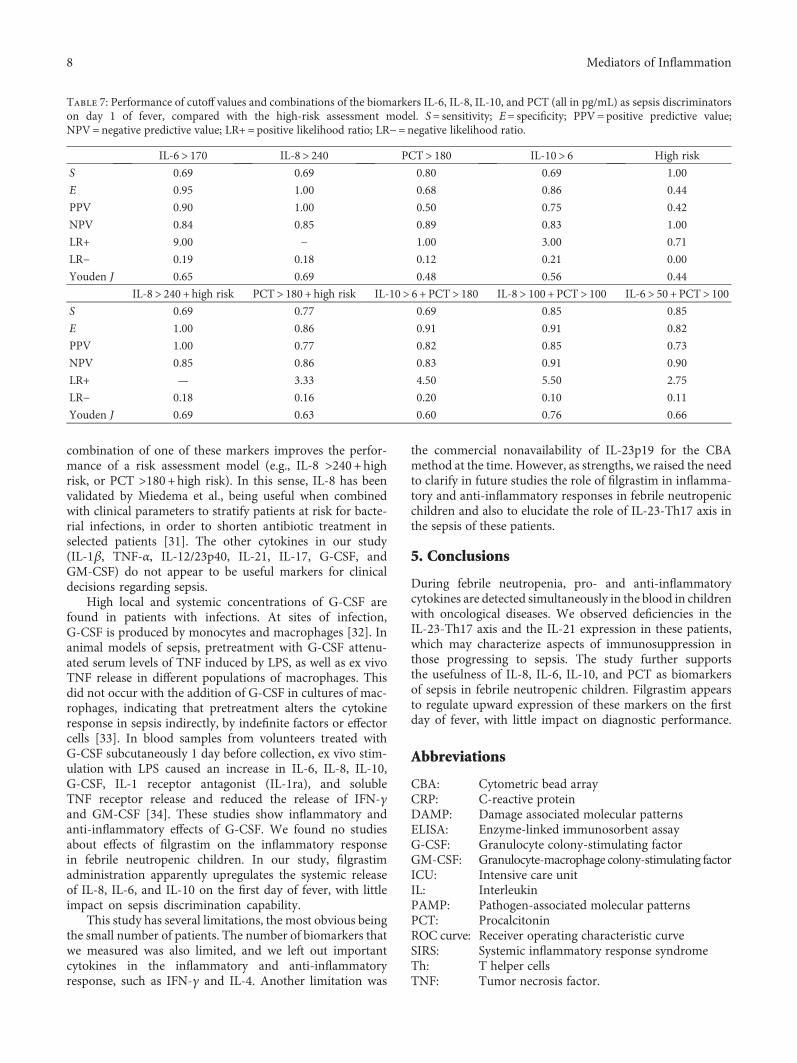
combination of one of these markers improves the perfor-mance of a risk assessment model (e.g., IL-8 >240+highrisk, or PCT >180+high risk). In this sense, IL-8 has beenvalidated by Miedema et al., being useful when combinedwith clinical parameters to stratify patients at risk for bacte-rial infections, in order to shorten antibiotic treatment inselected patients [31]. The other cytokines in our study(IL-1β, TNF-α, IL-12/23p40, IL-21, IL-17, G-CSF, andGM-CSF) do not appear to be useful markers for clinicaldecisions regarding sepsis.
High local and systemic concentrations of G-CSF arefound in patients with infections. At sites of infection,G-CSF is produced by monocytes and macrophages [32]. Inanimal models of sepsis, pretreatment with G-CSF attenu-ated serum levels of TNF induced by LPS, as well as ex vivoTNF release in different populations of macrophages. Thisdid not occur with the addition of G-CSF in cultures of mac-rophages, indicating that pretreatment alters the cytokineresponse in sepsis indirectly, by indefinite factors or effectorcells [33]. In blood samples from volunteers treated withG-CSF subcutaneously 1 day before collection, ex vivo stim-ulation with LPS caused an increase in IL-6, IL-8, IL-10,G-CSF, IL-1 receptor antagonist (IL-1ra), and solubleTNF receptor release and reduced the release of IFN-γand GM-CSF [34]. These studies show inflammatory andanti-inflammatory effects of G-CSF. We found no studiesabout effects of filgrastim on the inflammatory responsein febrile neutropenic children. In our study, filgrastimadministration apparently upregulates the systemic releaseof IL-8, IL-6, and IL-10 on the first day of fever, with littleimpact on sepsis discrimination capability.
This study has several limitations, the most obvious beingthe small number of patients. The number of biomarkers thatwe measured was also limited, and we left out importantcytokines in the inflammatory and anti-inflammatoryresponse, such as IFN-γ and IL-4. Another limitation was
the commercial nonavailability of IL-23p19 for the CBAmethod at the time. However, as strengths, we raised the needto clarify in future studies the role of filgrastim in inflamma-tory and anti-inflammatory responses in febrile neutropenicchildren and also to elucidate the role of IL-23-Th17 axis inthe sepsis of these patients.
5. Conclusions
During febrile neutropenia, pro- and anti-inflammatorycytokines are detected simultaneously in the blood in childrenwith oncological diseases. We observed deficiencies in theIL-23-Th17 axis and the IL-21 expression in these patients,which may characterize aspects of immunosuppression inthose progressing to sepsis. The study further supportsthe usefulness of IL-8, IL-6, IL-10, and PCT as biomarkersof sepsis in febrile neutropenic children. Filgrastim appearsto regulate upward expression of these markers on the firstday of fever, with little impact on diagnostic performance.
Abbreviations
CBA: Cytometric bead arrayCRP: C-reactive proteinDAMP: Damage associated molecular patternsELISA: Enzyme-linked immunosorbent assayG-CSF: Granulocyte colony-stimulating factorGM-CSF: Granulocyte-macrophage colony-stimulating factorICU: Intensive care unitIL: InterleukinPAMP: Pathogen-associated molecular patternsPCT: ProcalcitoninROC curve: Receiver operating characteristic curveSIRS: Systemic inflammatory response syndromeTh: T helper cellsTNF: Tumor necrosis factor.
Table 7: Performance of cutoff values and combinations of the biomarkers IL-6, IL-8, IL-10, and PCT (all in pg/mL) as sepsis discriminatorson day 1 of fever, compared with the high-risk assessment model. S= sensitivity; E= specificity; PPV= positive predictive value;NPV=negative predictive value; LR+= positive likelihood ratio; LR−=negative likelihood ratio.
IL-6> 170 IL-8> 240 PCT> 180 IL-10> 6 High risk
S 0.69 0.69 0.80 0.69 1.00
E 0.95 1.00 0.68 0.86 0.44
PPV 0.90 1.00 0.50 0.75 0.42
NPV 0.84 0.85 0.89 0.83 1.00
LR+ 9.00 − 1.00 3.00 0.71
LR− 0.19 0.18 0.12 0.21 0.00
Youden J 0.65 0.69 0.48 0.56 0.44
IL-8> 240 + high risk PCT> 180 + high risk IL-10> 6 + PCT> 180 IL-8> 100 + PCT> 100 IL-6> 50 + PCT> 100S 0.69 0.77 0.69 0.85 0.85
E 1.00 0.86 0.91 0.91 0.82
PPV 1.00 0.77 0.82 0.85 0.73
NPV 0.85 0.86 0.83 0.91 0.90
LR+ — 3.33 4.50 5.50 2.75
LR− 0.18 0.16 0.20 0.10 0.11
Youden J 0.69 0.63 0.60 0.76 0.66
8 Mediators of Inflammation

Ethical Approval
The study was approved by the Ethics Committee fromUniversidade Federal de Sao Paulo, Sao Paulo, Brazil, no.184.665/2013.
Consent
All parents gave their written informed consent forparticipation.
Conflicts of Interest
The authors declare that they have no competing interests.
Authors’ Contributions
Orlei Ribeiro de Araujo, Reinaldo Salomão, Antonio SergioPetrilli, Dafne Cardoso Bourguignon da Silva, and AndrezaAlmeida Senerchia conceived and designed the study.Andreza Almeida Senerchia, Dafne Cardoso Bourguignonda Silva, and Fabianne Altruda de Moraes Costa Carlessecollected the data. Milena Karina Colo Brunialti processedthe samples and performed the flow cytometry. OrleiRibeiro de Araujo wrote the manuscript and analyzed thedata. Reinaldo Salomão and Milena Karina Colo Brunialticritically reviewed the manuscript. All authors assisted inediting the final version and agree to be accountable forall aspect of the work. All authors read and approved thefinal manuscript.
Acknowledgments
This work was supported by the Fundação de Amparo aPesquisa do Estado de Sao Paulo (FAPESP)—Grant no.2011/20401-4, and by the grants from GRAACC/Institutode Oncologia Pediátrica.
References
[1] R. Salomao, M. K. Brunialti, M. M. Rapozo, G. L. Baggio-Zappia, C. Galanos, and M. Freudenberg, “Bacterial sensing,cell signaling, and modulation of the immune responseduring sepsis,” Shock, vol. 38, no. 3, pp. 227–242, 2012.
[2] C. Wennerås, L. Hagberg, R. Andersson et al., “Distinctinflammatory mediator patterns characterize infectious andsterile systemic inflammation in febrile neutropenichematology patients,” PloS One, vol. 9, no. 3, article e92319,2014.
[3] H. Kono and K. L. Rock, “How dying cells alert the immunesystem to danger,” Nature Reviews. Immunology, vol. 8,pp. 279–289, 2008.
[4] C. M. Robertson and C. M. Coopersmith, “The systemicinflammatory response syndrome,” Microbes and Infection,vol. 8, pp. 1382–1389, 2006.
[5] G. P. Bodey, “The changing face of febrile neutropenia-frommonotherapy to moulds to mucositis. Fever and neutropenia:the early years,” The Journal of Antimicrobial Chemotherapy,vol. 63, Supplement 1, pp. i3–13, 2009.
[6] M. F. Osuchowski, F. Craciun, K. M. Weixelbaumer, E. R.Duffy, and D. G. Remick, “Sepsis chronically in MARS:
systemic cytokine responses are always mixed regardless ofthe outcome, magnitude, or phase of sepsis,” Journal ofImmunology, vol. 189, no. 9, pp. 4648–4656, 2012.
[7] S. S. Santos, A. M. Carmo, M. K. Brunialti et al., “Modulationof monocytes in septic patients: preserved phagocytic activity,increased ROS and NO generation, and decreased productionof inflammatory cytokines,” Intensive Care Medicine Experi-mental, vol. 4, no. 1, p. 5, 2016.
[8] S. K. Biswas and E. Lopez-Collazo, “Endotoxin tolerance: newmechanisms, molecules and clinical significance,” Trends inImmunology, vol. 30, no. 10, pp. 475–487, 2009.
[9] A. G. Freifeld, E. J. Bow, K. A. Sepkowitz et al., “Clinical prac-tice guideline for the use of antimicrobial agents in neutrope-nic patients with cancer: 2010 update by the InfectiousDiseases Society of America,” Clinical Infectious Diseases,vol. 52, no. 4, pp. e56–e93, 2011.
[10] A. Engel, W. V. Kern, G. Mürdter, and P. Kern, “Kinetics andcorrelation with body temperature of circulating interleukin-6,interleukin-8, tumor necrosis factor alpha and interleukin-1beta in patients with fever and neutropenia,” Infection,vol. 22, no. 3, pp. 160–164, 1994.
[11] K. J. Maloy and M. C. Kullberg, “IL-23 and Th17 cytokines inintestinal homeostasis,” Mucosal Immunology, vol. 1, no. 5,pp. 339–349, 2008.
[12] B. Goldstein, B. Giroir, and A. Randolph, “Internationalpediatric sepsis consensus conference: definitions for sepsisand organ dysfunction in pediatrics,” Pediatric Critical CareMedicine, vol. 6, no. 1, pp. 2–8, 2005.
[13] M. D. Ruopp, N. J. Perkins, B. W. Whitcomb, and E. F.Schisterman, “Youden index and optimal cut-point estimatedfrom observations affected by a lower limit of detection,”Biometrical Journal, vol. 50, no. 3, pp. 419–430, 2008.
[14] S. R. Hayden and M. D. Brown, “Likelihood ratio: a powerfultool for incorporating the results of a diagnostic test intoclinical decision making,” Annals of Emergency Medicine,vol. 33, no. 5, pp. 575–580, 1999.
[15] D. B. Kuhns, W. G. Alvord, and J. I. Gallin, “Increasedcirculating cytokines, cytokine antagonists, and E-selectinafter intravenous administration of endotoxin in humans,”Journal of Infectious Diseases, vol. 171, no. 1, pp. 145–152, 1995.
[16] W. Schulte, J. Bernhagen, and R. Bucala, “Cytokines in sepsis:potent immunoregulators and potential therapeutic target-s—an updated view,” Mediators of Inflammation, vol. 2013,Article ID 165974, 16 pages, 2013.
[17] K. Matsushima and J. J. Oppenheim, “Interleukin 8 andMCAF: novel inflammatory cytokines inducible by IL 1 andTNF,” Cytokine, vol. 1, no. 1, pp. 2–13, 1989.
[18] J. G. Cannon, R. G. Tompkins, J. A. Gelfand et al., “Circulatinginterleukin-1 and tumor necrosis factor in septic shock andexperimental endotoxin fever,” The Journal of InfectiousDiseases, vol. 161, no. 1, pp. 79–84, 1990.
[19] C. J. Regazzoni, M. Khoury, C. Irrazabal et al., “Neutropeniaand the development of the systemic inflammatory responsesyndrome,” Intensive Care Medicine, vol. 29, no. 1, pp. 135–138, 2003.
[20] R. S. Hotchkiss, G. Monneret, and D. Payen, “Immunosup-pression in sepsis: a novel understanding of the disorder anda new therapeutic approach,” The Lancet Infectious Diseases,vol. 13, no. 3, pp. 260–268, 2013.
[21] I. I. Ivanov, B. S. McKenzie, L. Zhou et al., “The orphan nuclearreceptor RORγt directs the differentiation program of
9Mediators of Inflammation

proinflammatory IL-17+ T helper cells,” Cell, vol. 126, no. 6,pp. 1121–1133, 2006.
[22] M. W. Teng, E. P. Bowman, J. J. McElwee et al., “IL-12 andIL-23 cytokines: from discovery to targeted therapies forimmune-mediated inflammatory diseases,” Nature Medicine,vol. 21, no. 7, pp. 719–729, 2015.
[23] M. Bosmann and P. A. Ward, “Therapeutic potential oftargeting IL-17 and IL-23 in sepsis,” Clinical andTranslational Medicine, vol. 1, no. 1, p. 4, 2012.
[24] J. L. Rendon and M. A. Choudhry, “Th17 cells: criticalmediators of host responses to burn injury and sepsis,” Journalof Leukocyte Biology, vol. 92, no. 3, pp. 529–538, 2012.
[25] D. E. Peterson and A. Cariello, “Mucosal damage: a majorrisk factor for severe complications after cytotoxic therapy,”Seminars in Oncology, vol. 3, Supplement 8, pp. 35–44, 2004.
[26] A. Heitger, P. Winklehner, P. Obexer et al., “DefectiveT-helper cell function after T-cell-depleting therapy affectingnaïve and memory populations,” Blood, vol. 99, no. 11,pp. 4053–4062, 2002.
[27] M. K. Brunialti, M. C. Santos, O. Rigato, F. R. Machado,E. Silva, and R. Salomao, “Increased percentages of Thelper cells producing IL-17 and monocytes expressingmarkers of alternative activation in patients with sepsis,”PloS One, vol. 7, no. 5, article e37393, 2012.
[28] L. Zhou, I. I. Ivanov, R. Spolski et al., “IL-6 programs T(H)-17cell differentiation by promoting sequential engagement of theIL-21 and IL-23 pathways,” Nature Immunology, vol. 8, no. 9,pp. 967–974, 2007.
[29] G. R. Stryjewski, E. S. Nylen, M. J. Bell et al., “Interleukin-6,interleukin-8, and a rapid and sensitive assay for calcitoninprecursors for the determination of bacterial sepsis in febrileneutropenic children,” Pediatric Critical Care Medicine,vol. 6, no. 2, pp. 129–135, 2005.
[30] V. Urbonas, A. Eidukaitė, and I. Tamulienė, “Increasedinterleukin-10 levels correlate with bacteremia and sepsis infebrile neutropenia pediatric oncology patients,” Cytokine,vol. 57, no. 3, pp. 313–315, 2012.
[31] K. G. Miedema, W. J. Tissing, F. C. Abbink et al.,“Risk-adapted approach for fever and neutropenia inpaediatric cancer patients—a national multicentre study,”European Journal of Cancer, vol. 53, pp. 16–24, 2016.
[32] L. J. Quinton, S. Nelson, D. M. Boe et al., “The granulocytecolony-stimulating factor response after intrapulmonary andsystemic bacterial challenges,” The Journal of InfectiousDiseases, vol. 185, pp. 1476–1482, 2002.
[33] H. T. Gorgen, M. Leist, M. Niehorster et al., “Granulocytecolony-stimulating factor treatment protects rodents againstlipopolysaccharide-induced toxicity via suppression ofsystemic tumor necrosis factor-a,” Journal of Immunology,vol. 149, p. 918, 1992.
[34] T. Hartung, W. D. Döcke, F. Gantner et al., “Effect of granulo-cyte colony-stimulating factor treatment on ex vivo bloodcytokine response in human volunteers,” Blood, vol. 85,no. 9, pp. 2482–2489, 1995.
10 Mediators of Inflammation

Submit your manuscripts athttps://www.hindawi.com
Stem CellsInternational
Hindawi Publishing Corporationhttp://www.hindawi.com Volume 2014
Hindawi Publishing Corporationhttp://www.hindawi.com Volume 2014
MEDIATORSINFLAMMATION
of
Hindawi Publishing Corporationhttp://www.hindawi.com Volume 2014
Behavioural Neurology
EndocrinologyInternational Journal of
Hindawi Publishing Corporationhttp://www.hindawi.com Volume 2014
Hindawi Publishing Corporationhttp://www.hindawi.com Volume 2014
Disease Markers
Hindawi Publishing Corporationhttp://www.hindawi.com Volume 2014
BioMed Research International
OncologyJournal of
Hindawi Publishing Corporationhttp://www.hindawi.com Volume 2014
Hindawi Publishing Corporationhttp://www.hindawi.com Volume 2014
Oxidative Medicine and Cellular Longevity
Hindawi Publishing Corporationhttp://www.hindawi.com Volume 2014
PPAR Research
The Scientific World JournalHindawi Publishing Corporation http://www.hindawi.com Volume 2014
Immunology ResearchHindawi Publishing Corporationhttp://www.hindawi.com Volume 2014
Journal of
ObesityJournal of
Hindawi Publishing Corporationhttp://www.hindawi.com Volume 2014
Hindawi Publishing Corporationhttp://www.hindawi.com Volume 2014
Computational and Mathematical Methods in Medicine
OphthalmologyJournal of
Hindawi Publishing Corporationhttp://www.hindawi.com Volume 2014
Diabetes ResearchJournal of
Hindawi Publishing Corporationhttp://www.hindawi.com Volume 2014
Hindawi Publishing Corporationhttp://www.hindawi.com Volume 2014
Research and TreatmentAIDS
Hindawi Publishing Corporationhttp://www.hindawi.com Volume 2014
Gastroenterology Research and Practice
Hindawi Publishing Corporationhttp://www.hindawi.com Volume 2014
Parkinson’s Disease
Evidence-Based Complementary and Alternative Medicine
Volume 2014Hindawi Publishing Corporationhttp://www.hindawi.com