d omino’s pizza group plc annual report & accounts...
TRANSCRIPT

Dom
ino’s Pizza Group plc A
nnual Report &
Accounts 20
17
Domino’s Pizza Group plcAnnual Report & Accounts 2017
Domino’s Pizza Group plc Annual Report & Accounts 2017A
STRATEGIC REPORT02 Chairman’s statement04 Group at a glance06 The market08 Chief Executive Officer’s review13 Our goal and strategic pillars14 Business model16 Chief Financial Officer’s review20 Key performance indicators22 Risk management27 Viability statement28 Corporate social responsibility report
CORPORATE GOVERNANCE34 Board of Directors36 Corporate governance42 Nomination Committee report43 Audit Committee report46 Directors’ remuneration report65 Directors’ report68 Statement of Directors’ responsibilities
FINANCIAL STATEMENTS69 Independent auditor’s report77 Group income statement78 Group statement of
comprehensive income79 Group balance sheet80 Group statement of changes in equity81 Group cash flow statement82 Notes to the Group financial statements125 Company balance sheet126 Company statement of changes in equity127 Notes to the Company
financial statements 132 Five-year financial summaryIBC Shareholder information
THE OFFICIALFOOD OF SQUADSTHE OFFICIALFOOD OF SQUADSTHE OFFICIALFOOD OF SQUADSTHE OFFICIALFOOD OF SQUADSTHE OFFICIALFOOD OF SQUADSTHE OFFICIALFOOD OF SQUADSTHE OFFICIALFOOD OF SQUADSTHE OFFICIALFOOD OF SQUADSTHE OFFICIALFOOD OF SQUADSTHE OFFICIALFOOD OF SQUADSTHE OFFICIALFOOD OF SQUADSTHE OFFICIALFOOD OF SQUADSTHE OFFICIALFOOD OF SQUADSTHE OFFICIALFOOD OF SQUADSTHE OFFICIALFOOD OF SQUADSTHE OFFICIALFOOD OF SQUADSTHE OFFICIALFOOD OF SQUADSTHE OFFICIALFOOD OF SQUADSTHE OFFICIALFOOD OF SQUADSTHE OFFICIALFOOD OF SQUADSTHE OFFICIALFOOD OF SQUADSTHE OFFICIALFOOD OF SQUADSTHE OFFICIALFOOD OF SQUADSTHE OFFICIALFOOD OF SQUADSTHE OFFICIALFOOD OF SQUADSTHE OFFICIALFOOD OF SQUADSTHE OFFICIALFOOD OF SQUADSTHE OFFICIALFOOD OF SQUADSTHE OFFICIALFOOD OF SQUADSTHE OFFICIALFOOD OF SQUADSTHE OFFICIALFOOD OF SQUADSTHE OFFICIALFOOD OF SQUADSTHE OFFICIALFOOD OF SQUADSTHE OFFICIALFOOD OF SQUADSTHE OFFICIALFOOD OF SQUADSTHE OFFICIALFOOD OF SQUADSTHE OFFICIALFOOD OF SQUADSTHE OFFICIALFOOD OF SQUADSTHE OFFICIALFOOD OF SQUADSTHE OFFICIALFOOD OF SQUADSTHE OFFICIALFOOD OF SQUADSTHE OFFICIALFOOD OF SQUADSTHE OFFICIALFOOD OF SQUADSTHE OFFICIALFOOD OF SQUADSTHE OFFICIALFOOD OF SQUADSTHE OFFICIALFOOD OF SQUADSTHE OFFICIALFOOD OF SQUADSTHE OFFICIALFOOD OF SQUADSTHE OFFICIALFOOD OF SQUADSTHE OFFICIALFOOD OF SQUADSTHE OFFICIALFOOD OF SQUADSTHE OFFICIALFOOD OF SQUADSTHE OFFICIALFOOD OF SQUADSTHE OFFICIALFOOD OF SQUADSTHE OFFICIALFOOD OF SQUADSTHE OFFICIALFOOD OF SQUADSTHE OFFICIALFOOD OF SQUADSTHE OFFICIALFOOD OF SQUADSTHE OFFICIALFOOD OF SQUADSTHE OFFICIALFOOD OF SQUADSTHE OFFICIALFOOD OF SQUADSTHE OFFICIALFOOD OF SQUADSTHE OFFICIALFOOD OF SQUADSTHE OFFICIALFOOD OF SQUADSTHE OFFICIALFOOD OF SQUADSTHE OFFICIALFOOD OF SQUADSTHE OFFICIALFOOD OF SQUADSTHE OFFICIALFOOD OF SQUADSTHE OFFICIALFOOD OF SQUADSTHE OFFICIALFOOD OF SQUADSTHE OFFICIALFOOD OF SQUADSTHE OFFICIALFOOD OF SQUADSTHE OFFICIALFOOD OF SQUADSTHE OFFICIALFOOD OF SQUADSTHE OFFICIALFOOD OF SQUADSTHE OFFICIALFOOD OF SQUADSTHE OFFICIALFOOD OF SQUADSTHE OFFICIALFOOD OF SQUADSTHE OFFICIALFOOD OF SQUADSTHE OFFICIALFOOD OF SQUADSTHE OFFICIALFOOD OF SQUADSTHE OFFICIALFOOD OF SQUADSTHE OFFICIALFOOD OF SQUADSTHE OFFICIALFOOD OF SQUADSTHE OFFICIALFOOD OF SQUADSTHE OFFICIALFOOD OF SQUADSTHE OFFICIALFOOD OF SQUADSTHE OFFICIALFOOD OF SQUADSTHE OFFICIALFOOD OF SQUADSTHE OFFICIALFOOD OF SQUADSTHE OFFICIALFOOD OF SQUADSTHE OFFICIALFOOD OF SQUADSTHE OFFICIALFOOD OF SQUADSTHE OFFICIALFOOD OF SQUADSTHE OFFICIALFOOD OF SQUADSTHE OFFICIALFOOD OF SQUADSTHE OFFICIALFOOD OF SQUADSTHE OFFICIALFOOD OF SQUADSTHE OFFICIALFOOD OF SQUADSTHE OFFICIALFOOD OF SQUADSTHE OFFICIALFOOD OF SQUADSTHE OFFICIALFOOD OF SQUADSTHE OFFICIALFOOD OF SQUADS

CORPORATE GOVERNANCE FINANCIAL STATEMENTSSTRATEGIC REPORT
Annual Report & Accounts 2017 Domino’s Pizza Group plc 01
Financial highlights • Group system sales are £1,179.6m,
on a 52 week basis growth is 15.1% • UK like-for-like sales up 4.8% • Strong system sales growth in
Republic of Ireland (+11.3%) and Switzerland (+17.1%), on a 52 week basis
• Group underlying operating profit is £95.9m, on a 52 week basis growth is 9.1%
• Group underlying PBT is £96.2m, on a 52 week basis growth is 10.2%
• Operating cash flow up 65% to £104.2m • Basic earnings per share of 13.8p, up 3.1%
on a 52 week basis
Strategic highlights • Strong market positions in six countries,
after acquisitions of majority stakes in Nordics6 and Dolly Dimple’s chain in Norway
• Platform to grow market share in London, with acquisition of largest London franchisee
• Record 95 new stores opened in the UK • Significant investment in future UK capacity
through the development of the Warrington supply chain centre
• Dividend growth track record continued; an additional £36.6m of excess capital returned to shareholders via share purchases
• Underlying PBT excludes non-underlying4 charge of £15.0m relating to historic share scheme, acquisition expenses, store conversions costs and an impairment, partial offset by a net gain on the step acquisition in the Nordics
1 System sales represent the sum of all sales made by both franchised and corporate stores in the United Kingdom, Republic of Ireland, Switzerland and Nordics to consumers.
2 Like-for-like sales system sales are defined as system sales from stores that were opened before 27 December 2015 and have not been impacted by donating territory to a new store (Split), compared to the corresponding 52-week period in the prior year.
3 Underlying performance measures are defined as statutory performance measures excluding amounts relating to and discontinued operations and non-underlying items.
4 Non-underlying items are defined as being items that are material in size, unusual or infrequent in nature, and are disclosed separately as non-underlying items in the notes to the accounts.
5 2016–2017 from continuing operations (2014–2015 restated; 2013 not restated).
6 Nordics comprises our operations in Sweden, Norway and Iceland.
7 2016–2017 from continuing operations (2013–2015 restated for the 3 for 1 sub-division of shares effective on 27 June 2016).
Use of non-GAAP measures: In addition to performance measures directly observable in the Group Financial Statements (IFRS measures), additional financial measures (described as non-GAAP) are presented that are used internally by management as key measures to assess performance. Non-GAAP measures are either not defined under IFRS or are adjusted IFRS figures. Further explanation in relation to these measures can be found on pages 90 and 92, and reconciliations to IFRS figures, where they have been adjusted, are on page 95.
GROUP SYSTEM SALES1
£m
£1,179.6m2017 1,179.6
2016 1,004.2
2015 877.2
2014 757.8
2013 668.8
UK LIKE-FOR-LIKE SYSTEM SALES2 GROWTH % (52 weeks)
4.8%2017 4.8
2016 9.8
2015 13.4
2014 13.1
2013 8.8
UNDERLYING3 OPERATING PROFIT5 £m
£95.9m2017 95.9
2016 86.2
2015 73.2
2014 62.8
2013 47.9
BASIC EARNINGS PER SHARE7 p
13.8p2017 13.8
2016 13.1
2015 11.9
2014 9.9
2013 8.0See more online at http://investors.dominos.co.uk

STRATEGIC REPORT
Domino’s Pizza Group plc Annual Report & Accounts 201702
Chairman’s statement
RAPID AND ENCOURAGING
PROGRESS • Continued strong growth despite a tougher environment for our customers
• Resilient UK performance is a testament to the quality of our franchisees
• International expansion provides growth potential on many fronts
• Your Board’s approach to capital allocation balances immediate returns with investment in the longer term sustainability of growth
OverviewI am pleased to report that Domino’s has achieved another year of good growth, despite a more challenging market environment. The UK remains one of the leading franchises across the Domino’s network worldwide, and our franchisees are rightly considered to be among the very best anywhere in the world. Between them, they increased our UK network by a record 95 outlets and at the end of 2017 we traded from 1,045 stores in the UK. We also took the opportunity to acquire a majority stake in the largest franchisee in the London area. This will be a platform for more rapid growth in the currently under-developed London market, and for the development of innovation in technology, pricing and menus.
Outside our home market, progress has been encouraging. In the Republic of Ireland, we opened our first stores for six years in response to the strong economic recovery in that market. We are seeing an acceleration in growth in Switzerland, driven by changes to menu pricing and a very strong online performance.
CORPORATE GOVERNANCE FINANCIAL STATEMENTSSTRATEGIC REPORT
Annual Report & Accounts 2017 Domino’s Pizza Group plc 03
In our newer markets we took majority ownership in Iceland, Norway and Sweden during the year, and accelerated our growth plans in Norway by acquiring Dolly Dimple’s, the number three player. Just before the year end we announced plans to move to 95% ownership in Iceland. In Germany, where we are a 33% shareholder, Domino’s agreed terms to acquire the largest remaining independent pizza chain, Hallo Pizza. We are confident of the prospects for all of these markets, which offer a further exciting stage of growth for Domino's shareholders.
Group at a glance page 04
Capital allocation and returns to shareholdersOne of the most distinctive aspects of the Domino’s business model is its strong cash generation. The Board has a rigorous approach to capital allocation – making sure that existing businesses are invested in to maintain and grow competitive advantage, appraising new growth opportunities, and returning cash to shareholders, all within an appropriate capital structure.
In this regard, 2017 has been a notable year. In respect of organic investment, we substantially completed our single biggest ever capital project, the new supply chain centre in Warrington, with a total budget of nearly £40m. In terms of expansionary growth opportunities, we made or announced £57.7m of acquisitions to strengthen and accelerate our ambition in several overseas markets, as described above.
Cash returns to shareholders during the year totalled £77.0m, including £36.6m of share buybacks. We maintained our strong growth track record for the ordinary dividend, raising it by 12.5% to give a total dividend for the year of 9.00p. The proposed final dividend of 5.25p per share will, subject to shareholder approval at the Annual General Meeting on 19th April 2018, be paid on 24th April 2018 to shareholders on the register at the close of business on 16th March 2018.
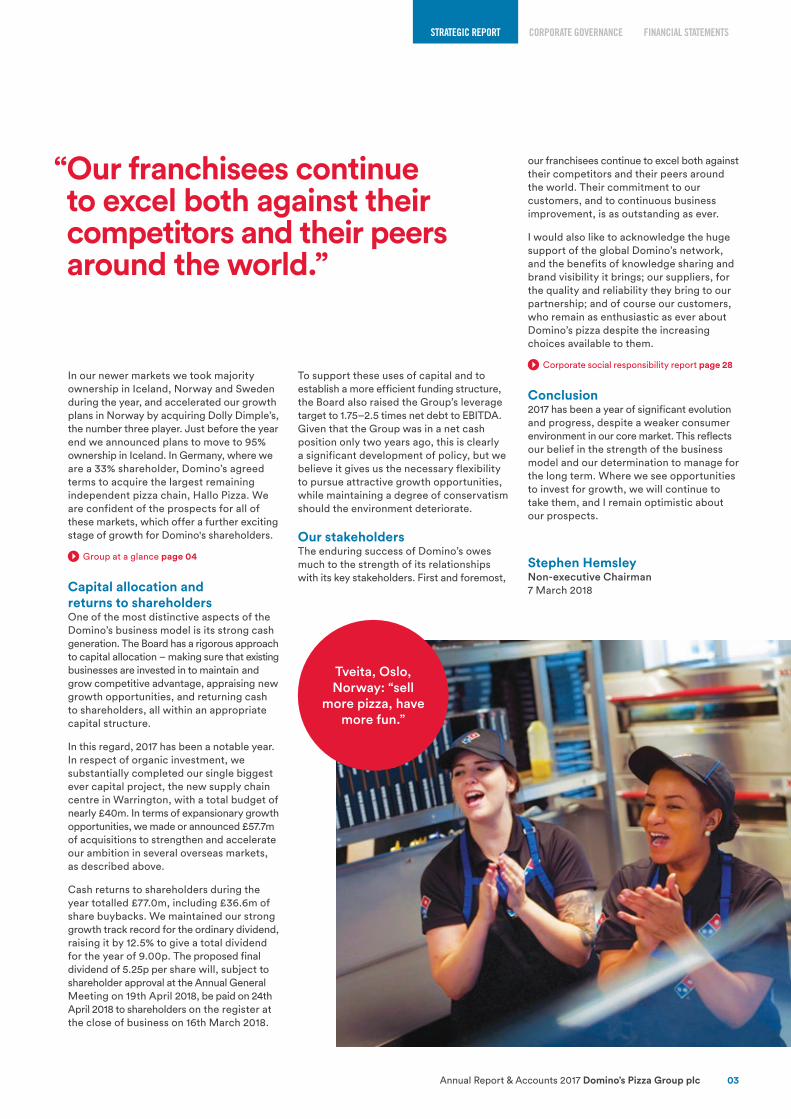
Tveita, Oslo, Norway: “sell
more pizza, have more fun.”
To support these uses of capital and to establish a more efficient funding structure, the Board also raised the Group’s leverage target to 1.75–2.5 times net debt to EBITDA. Given that the Group was in a net cash position only two years ago, this is clearly a significant development of policy, but we believe it gives us the necessary flexibility to pursue attractive growth opportunities, while maintaining a degree of conservatism should the environment deteriorate.
Our stakeholdersThe enduring success of Domino’s owes much to the strength of its relationships with its key stakeholders. First and foremost,
our franchisees continue to excel both against their competitors and their peers around the world. Their commitment to our customers, and to continuous business improvement, is as outstanding as ever.
I would also like to acknowledge the huge support of the global Domino’s network, and the benefits of knowledge sharing and brand visibility it brings; our suppliers, for the quality and reliability they bring to our partnership; and of course our customers, who remain as enthusiastic as ever about Domino’s pizza despite the increasing choices available to them.
Corporate social responsibility report page 28
Conclusion2017 has been a year of significant evolution and progress, despite a weaker consumer environment in our core market. This reflects our belief in the strength of the business model and our determination to manage for the long term. Where we see opportunities to invest for growth, we will continue to take them, and I remain optimistic about our prospects.
Stephen HemsleyNon-executive Chairman7 March 2018
“ Our franchisees continue to excel both against their competitors and their peers around the world.”

STRATEGIC REPORT
Domino’s Pizza Group plc Annual Report & Accounts 201704
We are part of the global Domino’s system, the biggest pizza delivery operator in the world. We make, sell and deliver pizza and a range of other dishes under the Domino’s brand from 1,192 stores across six European markets. We also have a one-third interest in Domino’s Germany.
We hold the exclusive master franchise rights in these six markets under long-term agreements with Domino’s Pizza International Franchising Inc., the international arm of Domino’s Pizza Inc which is listed on the New York Stock Exchange and which owns the Domino’s brand across the globe.
In the UK and Republic of Ireland, we are the clear number one pizza delivery business. Our market share in the UK is 46%. Customers love Domino’s because it tastes great, and is fast and convenient. We operate stores almost entirely through franchisee partners. We manufacture dough and act as a scale and expert wholesaler of other food and non-food supplies to our franchisees. We invest in technology to develop the ordering platform, making it easy for customers and improving franchisees’ operations, and we market the brand and plan national promotions.
Our franchisees open and run stores, and earn a return from the margin they make on making and selling pizza. They employ, train and develop their own teams, set prices locally and invest in local marketing.
In our other markets, we mainly run the stores ourselves. We will look to franchise out stores in most markets as we achieve greater scale and profitability through a larger network. Profitability and returns can be further enhanced over time through investment in dough manufacturing capacity and our supply chain.
Our goal and strategic pillars page 13
Group at a glance
We aim to be the number one pizza company in every neighbourhood in each market in which we operate, through a commitment to offering the best product, service and quality to our customers.
WHAT WE DO AND HOW WE DO IT
STORES
1,1922017
2016
2015
2014
2013
1,192
1,013
931
872
835
UK MATURE1 AVERAGE SALES PER ADDRESS (‘ASPA’)2 £
£0.822017
2016
2015
2014
2013
0.82
0.78
0.70
0.62
0.56
UK 88% ROI 5% SWITZERLAND 2% OTHER 5%
SYSTEM SALES
FRANCHISED 91% CORPORATE 9%
STORES
GROUP SYSTEM SALES
£m
£1,179.6m2017 1,179.6
2016 1,004.2
2015 877.2
2014 757.8
2013 668.8
1 Stores that have traded for two full corporate years or more.
2 Sales per week per address in catchment.

CORPORATE GOVERNANCE FINANCIAL STATEMENTSSTRATEGIC REPORT
Annual Report & Accounts 2017 Domino’s Pizza Group plc 05
WHERE WE DO BUSINESSICELAND23
stores
30 store potential
51% owned
£40m annualised system sales
£37k average weekly unit sales
#1 market position
ROI49
stores
75 store potential
100% owned
£60m annualised system sales
£24k average weekly unit sales
#1 market position
SWITZERLAND18
stores
100 store potential
100% owned
£19m annualised system sales
£24k average weekly unit sales
#2 market position
GERMANY33% investment in
Domino’s Germany
NORWAY51
stores
75 store potential
71% owned
£38m annualised system sales
£18k average weekly unit sales
#3 market position
SWEDEN6
stores
125 store potential
71% owned
£3m annualised system sales
£18k average weekly unit sales
start up
UK1,045 stores
1,600 store potential
100% owned
£1,019m annualised system sales
£21k average weekly unit sales
#1 market position
All figures as at 31 December 2017

STRATEGIC REPORT
Domino’s Pizza Group plc Annual Report & Accounts 201706
The market
The Group has a very strong position in the UK food delivery market, which is experiencing continued growth and in which pizza is the most popular cuisine. There are a number of ongoing secular drivers for the market which give us confidence in its sustained long-term growth.
On the other hand, we have seen a rise in competition from new business models which provide customers with increased choice and alternative ways to order delivered food. In the short term, our franchisees are also experiencing cost pressures from inflation in labour and food. Finally, the broader economic environment is also putting pressure on customers’ spending power. Each of these factors is analysed in more detail below. In summary, our scale, brand and operational excellence continue to confer a significant competitive advantage.
The focus of the analysis is the UK market as that represents the vast majority of our revenue and profitability, but we see similar long-term trends for delivered food in our other markets.
UK delivered food marketThe UK delivered food market is worth £6.2 billion and was estimated to grow at 11% in 2016–2017, and grew at a compound rate of 14% between 2014 and 2016. The main drivers of this growth have been technology, convenience and choice. In our annual survey, among the nearly 40% of respondents who were ordering delivered food more often:
• 40% cited ease of ordering
• 33% said it was more convenient than going out
• 24% liked the wider variety of options available
• 24% admitted to having less time to cook at home
According to the survey, this growth is migrating in broadly equal measure from cooking in and ready meals on the one hand, and dining out and takeaways on the other. We anticipate all of these trends to continue, leading to further growth in the market.
One additional factor in the strength of the delivered food market is the rise in home entertainment: big screen televisions, catch-up TV, streaming services and interactive gaming have all increased the number of occasions when households “order in”.
Pizza deliveryPizza is the single biggest cuisine within the delivered food market, accounting for £2.1bn of sales (including “pre-order carry-out”, or collection sales). Pizza has been a very successful delivered food for many years because it appeals to a wide range of tastes, it is quick to cook fresh, it travels easily while retaining its heat, and it has a relatively high margin because of its mix of ingredients.
Pizza continues to grow, albeit at a lower rate than the overall market for delivered food. This reflects the recent increased availability of a wider range of cuisines for delivery. However, Domino’s growth has kept pace with the wider market over the last three years, as we have continued to take share in the pizza segment.
£2.1bnOF PIZZA SALES WITHIN THE DELIVERED FOOD MARKET(including “pre-order carry-out”, or collection sales)
46%DOMINO’S MARKET SHARE OF THE UK PIZZA DELIVERY MARKET
£6.2bn
UK DELIVERED FOOD MARKET
£2.1bn
UK PIZZA DELIVERY MARKET
£1.0bn
DOMINO’S PIZZA MARKET
The delivered food market is booming, stimulated by the growth in home entertainment, the increased choice of cuisines and the rise of digital ordering. Pizza remains the most popular choice, offering great tasting food, speed, convenience and value for money.
Source: Parthenon study 2017
PIZZA 27% INDIAN 15% CHINESE 20% OTHER 38%
DELIVERED FOOD
MARKET

CORPORATE GOVERNANCE FINANCIAL STATEMENTSSTRATEGIC REPORT
Annual Report & Accounts 2017 Domino’s Pizza Group plc 07
Broader economic driversThere has always been a strong correlation between the rate of economic growth and the level of spending in the restaurant and food delivery sectors. Food delivery tends to be more insulated than dining out because it can act as a “trading down” option when consumers are being more cost conscious. This year has witnessed not only slower economic growth, but also wage inflation lagging broader cost inflation, reducing consumers’ disposable income.
Our annual consumer survey clearly highlighted the increasing importance of value for money as a consideration for customers. Of those customers surveyed who ordered pizza less frequently this year, 44% said it was because pizza was less good value for money than other cuisines.
While all our analysis shows that pizza continues to be the most cost-effective way of feeding a family with delivered food, the pizza market model of higher menu prices and big promotional discounts can make it harder to compare with other cuisines in value terms and may affect value perception as a result. This is something we began to address during 2017 through clearer pricing communication, and will continue to focus on in 2018.
The collection marketWhile the traditional takeaway or collection market has seen a shift towards delivery over time, this remains a core segment. The attractions of collection for customers are that it is a source of quick, convenient hot food during the daytime, and in the evening it can be picked up on the way home. As a result, it often serves the impulse market as well. Given the lack of delivery costs for restaurants, the deals and promotions on offer for collection are particularly strong.
For Domino’s, collection is a core part of our growth strategy. Increasingly our stores are located in high visibility, easy access locations close to other shops and businesses. Furthermore, it is our belief that customers who live within a mile of a Domino’s have a higher propensity for collection, and that this business is incremental to delivery orders.
The competitive landscapeCompetition in delivered food splits broadly between the more traditional pizza delivery businesses, and online aggregators enabling newer entrants offering different cuisines via a single online or app-based portal.
Within the UK pizza market, we estimate our 2017 market share to be around 46%. Our two main branded competitors, Papa John’s and Pizza Hut, have a combined market share of 20–25%. The rest of the market comprises small local chains and independent operators. Our growth in market share has been driven by our brand, our scale, our growing store network and the
quality and consistency of our pizzas. We expect these drivers to continue to support further share growth for Domino’s.
In recent years a number of new businesses have launched which give customers easier access to a much wider range of options for ordering delivered food online. There are two distinct business models. A pure “aggregator”, such as Just Eat, enables customers to place online orders with a wide range of local restaurants, with a focus on smaller chains and independents; these restaurants then deliver the order themselves. Businesses such as Deliveroo focus more on branded restaurant chains and also take care of delivery.
These developments have increased choice for customers and offer the convenience of ordering a range of cuisines through a single app. This has also grown awareness of delivered food, and the combination of greater convenience and wider publicity has stimulated market growth. Our own investment in our digital platform has been a key response to this, driving significant online participation and increasing order sizes and repeat business.
Domino’s will continue to enjoy two very important competitive advantages: first, the inherent benefits of pizza as a delivered food discussed above; and second, the control of the end-to-end customer experience, from the ordering platform, through the food procurement and the cooking of the pizza, to the delivery itself.
Changing tastes and health considerationsObesity and related health problems are quite rightly a major factor in public policy. The promotion of a balanced diet with fewer processed foods, as well as the introduction in 2018 of the “sugar tax”, serve to raise broader awareness and influence consumer behaviour. Takeaway and delivered food does from time to time come under the spotlight.
Our customers on average order from Domino’s five times a year, making pizza an occasional treat rather than a central part of their diet. Our pizzas are baked using fresh dough, 100% mozzarella cheese and other carefully sourced, high quality ingredients.
We introduced our Italiano pizza range in 2016, with thinner crust and more exclusive toppings, which have fewer calories overall than the equivalent traditional Domino’s pizza. Our low fat mozzarella cheese has 33% less fat than our regular mozzarella. We also offer gluten-free bases and a range of chicken sides and salads, to appeal to those customers who want a higher protein or lower carbohydrate option.
Labour and food costsThe two biggest cost drivers in the broader restaurant market are labour and food. For our franchisees, these costs typically account for nearly 60% of revenue.
Labour costs have experienced significant inflation over the last two years with increases to the UK National Living Wage. In 2015 the hourly rate for someone aged 25 was £6.70, since when it has increased by 12% to £7.50. We have also seen a tighter labour market, created by high levels of employment and increased demand for delivery drivers from the new entrants described above.
The Group and our franchisees are well positioned to absorb these rises relative to other operators in the market, given the very strong economics of our stores. Our franchisees also differentiate themselves from delivery service companies by offering full employment terms to drivers rather than flexible contracts.
Food costs, particularly dairy, are volatile in nature. Supply capacity inevitably lags price moves both up and down, thus exaggerating any movements in the market. Foreign exchange movements also play a significant role as most foodstuffs are easily traded across the European Union.
After a prolonged period of price deflation in 2015–2016, prices rose strongly from mid-2016 as a result of the EU referendum result which saw sterling fall heavily against the euro. We expect food inflation to continue into 2018.
MILK PRICES per litre
31.39p2017
2016
2015
2014
31.39
22.75
25.65
34.15

STRATEGIC REPORT
Domino’s Pizza Group plc Annual Report & Accounts 201708
OverviewIt has been a year of excellent operational and strategic development for Domino’s Pizza Group, with continued organic growth in established markets enhanced by an increasing presence in a number of newer markets. We are seeking to build a portfolio of assets at different stages of maturity which together provide long-term, sustainable growth.
Our strategy across all of our markets remains simple and clear. We aim to be the number one pizza company in each neighbourhood, through a commitment to offering the best product and service to our customers.
UKThe UK market moderated this year, after three years of very strong like-for-like growth. Consumers were more cautious and value conscious, and incomes were squeezed as wage inflation lagged broader cost inflation. The competitive environment continued to evolve, with delivery service companies continuing to invest heavily in growing scale.
Despite these dynamics, Domino’s achieved another good performance. On a 52 week basis system sales were up 8.6%, driven by growth from order volume of 6.5% and 1.9% on average order value. Like for like sales growth (excluding effect of splitting territories) was 4.8%. We continued to take share in the pizza delivery market, thanks to our scale, our physical expansion, the strength of our brand and the quality of our product; and we held our share of the overall delivered food market, which continues to grow strongly.
New store growth was the key driver of our performance in the year. After 81 new openings in 2016, our franchise partners opened a further 95 in 2017. With 1,045 stores now across the UK, we are confident of reaching our target of 1,600.
Around two-thirds of new store openings are coming in existing territories, where franchisees are realising the significant customer service and financial benefits of splitting territories.
The inherent profitability of the system and the strength of the brand are also enabling franchisees to make attractive returns in increasingly small standalone catchment areas. For example, in market towns of no more than 10,000 households, a Domino’s store is likely to be the only branded quick service restaurant or food delivery business, leading to a disproportionate market share.
Chief Executive Officer’s review
COMMITTED TO OFFERING
THE BEST • Group system sales of £1,179.6m, on a 52 week basis growth is 15.1%
• UK & ROI system sales of £1,101.5m, on a 52 week basis growth is 9.2%
• A leading digital business: 75% of UK sales ordered online
• Franchisee profitability maintained, despite a tougher market
• £20.1m invested in international growth markets; £81m of annualised sales
• Underlying PBT of £96.2m, on a 52 week basis growth is 10.2%

CORPORATE GOVERNANCE FINANCIAL STATEMENTSSTRATEGIC REPORT
Annual Report & Accounts 2017 Domino’s Pizza Group plc 09
While the sales growth drivers of our business can be simplified down to new openings and like-for-like growth from existing stores, these factors and the overall profitability of the system are in turn underpinned by the operational areas of focus discussed below.
Customer value and experienceWe operate in a highly competitive marketplace. Technology and new business models have given customers more choice than ever, both in terms of the range of cuisines available and the number of ways they can order. At the same time, they have become much more value conscious over the last year as incomes are squeezed by inflation. This became most evident to us early in 2017, when our Winter Survival deal performed poorly compared to previous years as a result of a less compelling value proposition.
We believe pizza to be the best value delivered food, but it is not always perceived that way by customers. This is partly a result of the promotional nature of pizza delivery pricing: published menu prices appear high relative to some alternatives, but in fact in 2017, 87% of our orders in the UK were on some kind of promotion, and the average discount was 38%. As a result, many customers are still left with the false perception of high menu prices.
During the second half of the year, we worked with our franchisee partners to address customer value more directly. This included a decision to invest up to £4 million in absorbing food cost inflation on behalf of franchisees to ensure customers were getting the best value possible. In September we launched a national campaign focusing on the price of an individual pizza with our ‘Dine for £9.99’ offer, which was our most successful campaign of the year in terms of sales. Additionally, we have sought to push our value message harder in our collection business. In the Spring, we launched our ‘Walk in Wins’ campaign, a ‘Buy One Get One Free’ offer on collected pizza which has been running permanently since then.
“ With 1,045 stores now across the UK, we are very confident of reaching our target of 1,600.”
Our 1,000th store was opened in Overton, Hampshire.
We have also made it even easier for customers to see that they are getting the best deal available to them. The app and website landing pages now show all the current promotions, and our Deal Wizard automatically updates a customer’s basket for the best deal for their selections.
On the customer experience side, we continue to make the best use of our greatest competitive advantage: the Domino’s control of the end-to-end customer journey. This is a crucial differentiator from the delivery service companies or aggregators. Domino’s sources ingredients, runs the ordering platform, cooks your pizza fresh in a local store, and brings it to your door courtesy of Domino’s delivery drivers who are directly employed by franchisees.
We made further significant enhancements to our digital platform during the year. We have added voice ordering through Amazon Alexa and integrated Apple Pay as a payment option. Our major web releases throughout the year focused on continuous improvement to the customer journey, reducing page load times and
adding functionality such as saved card details and previous baskets. For the full year, 75.2% of sales by value were ordered online, up from 71.8% in 2016.
Throughout Domino’s, the customer service benefits of the “Golden Mile” are a strong driver for growth: the closer we are to customers, the quicker the pizza gets delivered and the higher volume of collection business we achieve. Quicker delivery significantly enhances the customer experience and leads to a higher level of repeat ordering. Our key ‘Delivered On Time’ metric measures what proportion of orders reach customers within 30 minutes. During the year, our % DOT fell very slightly, from 82.9% of orders to 81.8%, but still remains a key differentiator. Increased density of the store network also raises our brand visibility, with each store effectively acting as a billboard.
Our collection business performed strongly over the year, underpinned by new stores and territory splitting. Total collection sales were up 12.6% and represented 21.4% of system sales. For new and immature stores, collection represented 31% of sales.
Finally on customer experience, we introduced new food options to keep the menu up to date and cater for changing tastes. These include our Chipotle Pulled Pork pizza and a Chilli Cheese stuffed crust, both of which have been very popular with customers. We also extended our desserts range to include the Lotta-Chocca pizza and Cinni Dippers.
09

STRATEGIC REPORT
Domino’s Pizza Group plc Annual Report & Accounts 201710
Chief Executive Officer’s review continued
UK continuedBrandThe Domino’s brand is a highly significant asset for the Group and our franchisees. For many of our customers, ‘Domino’s’ has become synonymous with ‘pizza’ in a way that has no equivalent across other types of delivered food. In our detailed annual consumer survey, our unprompted awareness was 54%, compared to 31% for our closest pizza delivery competitor and 19% for the closest aggregator (source: Parthenon Study, 2017).
The growth in the overall system creates a virtuous circle. Franchisees contribute 4% of sales to the National Advertising Fund, which we then invest in brand marketing on their behalf, to drive both brand values and specific promotions. These investments drive greater sales, underpinning returns on new store openings for franchisees. New stores increase the visibility of the brand, improve customer service (as discussed above) and grow the top line, swelling the brand budget further.
Business model page 14
In September 2017 we launched our new brand campaign, “The Official Food of Everything”, which clearly positions Domino’s as an established category leader – a timely evolution from our previous challenger brand positioning. The impact of the campaign in brand recall has been very strong, with recognition of the positioning running at three times the level of previous campaigns, and unprompted awareness at 84% – our highest ever. We continued to support our above the line presence with the sponsorship of TV shows such as The Voice and Hollyoaks, targeting key audiences and family home entertainment events.
While the annual survey demonstrated continued strength in key areas such as great tasting food and convenience, we witnessed an emerging weakness in value for money perception, with prices being cited as the single biggest barrier to increased repeat ordering. This, combined with the weaker trading witnessed in the early months of 2017, informed our value for money communications strategy outlined above.
Franchisee profitability and alignmentOur franchisees remain some of the best entrepreneurs and operators in the Domino’s system worldwide. Our interests are aligned: we all benefit from increased scale, through the growing value of the brand, greater supply chain efficiency and the shared investment in new innovations to improve the customer experience continuously.
The 2014–2016 period was an extraordinary one for the system and for franchisees, with very strong order growth (supported by rapid online adoption and the secular trend towards in-home entertainment) combined with sustained deflation in food costs. Between 2013 and 2016, average per store EBITDA for franchisees increased very strongly.
2017 saw a return to more normalised sales growth rates, combined with cost pressures on both labour and food. Nonetheless, the combination of like-for-like sales growth with the procurement benefits of our scale saw franchisee EBITDA per store (excluding the impact of splitting territories) maintained year-on-year at just over £150,000. This figure remains significantly ahead of the average from 2011-2013, and provides a typical payback on a new store opening of around three years.
We want to help our franchisees maintain this rate of payback. As a result, not only have we provided support on food cost inflation as described above – to ensure that customers continue to get great value for money – but we have also developed a number of innovations to improve operating efficiency and drive down costs. Most recently
In September 2017 we launched our “The Official
Food of Everything” campaign.
we have started to introduce GPS across the store portfolio. This allows franchisees to track delivery drivers more effectively and leads to significant improvements in labour productivity. It is now operational in 471 stores, and we expect to complete roll-out by Q3 of 2018.
A further development of alignment with franchisees in 2017 came with our acquisition of a 75% interest in the largest franchisee in the London area, with 25 stores. Domino’s is significantly under-represented in London, a market which we believe accounts for 25% of delivered food in the UK but only 14% of our sales. We aim to grow this business more aggressively under direct ownership.
This is the first time for many years that the Group has taken control of a portfolio of stores in the UK, but it is common practice across the Domino’s system worldwide to have a small proportion of stores directly operated. Store ownership aligns us more closely with franchisees by making us operators as well as master franchise holders, and gives our management valuable operational experience. It also allows us to test pricing, menus and technology in a live environment and use the results to support and influence the franchisee network further.

CORPORATE GOVERNANCE FINANCIAL STATEMENTSSTRATEGIC REPORT
Annual Report & Accounts 2017 Domino’s Pizza Group plc 11
Supply chain and infrastructureOur supply chain in the UK is one of the most efficient in the Domino’s network. It is also a major source of differentiation versus our competitors, whether in the restaurant or aggregator space. The margin generated within the Domino’s system from being vertically integrated from dough manufacture, through value-added food and non-food distribution, to our own ordering platform and franchisees’ stores, allows both the Group and our franchisees to make excellent returns.
The rapid growth over the last few years and our future plans have led to our single biggest ever investment this year, with the development of a new supply chain centre in Warrington. The total cash investment in 2017 was £26.7m and on completion the programme will have cost £37m–£39m.
The facility is due to enter service in spring 2018, and will combine with our existing supply chain centres to give us capacity to serve at least the 1,600 stores we are targeting, at projected levels of store sales. Its scale and level of automation will deliver efficiencies of up to 10% cost per tray of dough in real terms by 2021. As indicated at the time of our interim results, there will be a short term impact of an additional £3m in operating costs and depreciation in 2018 as the plant ramps production.
“ We expect International to represent an increasing proportion of the Group’s profits and cash flow over the longer term.”
Online sales were up 28.8%
year-on-year and now represent 57%
of total sales.
ROIGrowth in the Republic of Ireland accelerated in 2017, buoyed by a recovering economy and by our own actions, particularly in digital. Local currency system sales on a 52 week basis were up 11.3%, with like-for-like growth of 10.8%. On a 52 week reported basis, system sales were up 19.9% to £60.1m, reflecting the weakness of sterling year-on-year.
Online sales were up 28.8% year-on-year in local currency, and now represent 56.9% of total sales. We opened our first new stores in ROI for six years, taking the total up by two to 49, with plans for further new stores in 2018.
We also plan to invest in extending our supply chain capacity to allow us to serve 75 stores in ROI as well as our stores in Northern Ireland.
InternationalOur controlled operations now comprise four markets: Switzerland, Iceland, Norway and Sweden and our associate in Germany. In each of these markets we see a clear opportunity to build strongly profitable businesses with local scale, adapted to their
markets but leveraging our proven expertise in supply chain, digital and franchisee management.
Consolidated system sales for the year from our International operations were £78.1m, with an underlying EBIT contribution of £0.8m.
We expect International to represent an increasing proportion of the Group’s profits and cash flow over the longer term, both from the development of our existing markets and entry into selected new markets with similar dynamics.
In Switzerland, we made significant progress during the year. Total system sales on a 52 week basis were up 17.1% in local currency, and up 15.7% like-for-like. There were two significant drivers of this acceleration: revised menu pricing and increased online participation.
(2013-2014 restated)
EBITDA £m
£97.7mSUPPLY CHAIN INVESTMENT £m
£30.1mUK + ROI ONLINE SALES £m (52 weeks)
£800.4m2017 2017 2017
2016 2016 2016
2015 2015 2015
2014 2014 2014
2013 2013 2013
97.7 30.1 800.4
90.7 10.6 698.5
80.0 0.5 560.8
69.3 1.1 432.5
27.9 1.5 329.0
STRATEGIC REPORT
Domino’s Pizza Group plc Annual Report & Accounts 201712
Chief Executive Officer’s review continued
International continuedIn H1, we lowered menu prices and introduced a delivery charge. As a result, we saw our average ticket price fall 13.2% but achieved order volume growth over the year of 34.9%. Online sales grew 56.6% and now account for 55.4% of total sales. We opened a new store in Q4 and have plans for several further openings in 2018, at a lower cost per store than our previous operating model in Switzerland.
IcelandSince we took majority ownership of Iceland in May 2017 total system sales were £28.9m. Sales growth was 10.8% in local currency on a pro forma basis. Domino’s Iceland is the leading quick service restaurant in the market and achieves weekly unit sales of over £37,000, comfortably the highest of any Domino’s operation worldwide. During the year we opened a further two stores, taking the total to 23.
In December 2017 we announced our intention to acquire a further 44.3% stake in Domino’s Iceland, taking our ownership to 95.3%. The transaction was completed in January 2018.
NorwayOur expansion in Norway accelerated significantly in 2017 with the acquisition of Dolly Dimple’s, the number three pizza operator in the market, with 39 stores. At the year end we had converted 9 stores to the Domino’s brand, giving a total portfolio of 27 Domino’s stores. Conversions are performing well, with weekly sales up around 50% on average compared to their previous runrate.
Pro forma system sales growth from the Domino’s branded chain was 94.6%, with like-for-like growth of 13.5%. We expect to complete another 10 conversions in 2018, as well as opening further greenfield sites. 7 Domino’s stores in the South of Oslo and Southern regions are franchised, and we will seek to identify further franchisee partners.
SwedenWe opened our first stores in Sweden in late 2016 and by the 2017 year end, we had 6 stores. Weekly sales of around £18,000 are an encouraging sign of the popularity of our pizza and indicate that we can grow a profitable business in Sweden. Further store openings are in the pipeline for 2018.
GermanyIn Germany, where we are a one-third associate partner in a joint venture with Domino’s Pizza Enterprises, the Australian-listed master franchisee, progress continues to be good. The integration of Joey’s, acquired in 2016, is complete, and in October 2017 we announced the acquisition of Hallo Pizza, another leading independent chain. Once the Hallo Pizza stores have been converted, we will operate a portfolio of over 300 stores in Germany, with significant opportunity for long-term growth in Europe’s largest economy.
The market page 06
PeopleThe Domino’s culture remains central to our success, and this is exemplified every day in the individual and combined efforts of both the Domino’s team and our franchisee community. Dedication, pride in the brand
“ Our excellent unit economics and our control of the customer experience are important differentiators.”
and a shared vision underpins everything we do. I’d like to extend my thanks and appreciation to all of them for their continued commitment.
OutlookI remain confident in the outlook for the Group, and the year has started in line with our expectations. It is not an accident that pizza is the most successful delivered food in the world. It is quick to make fresh, travels well while retaining its heat, enjoys a high margin thanks to its mix of ingredients, and has a sufficient ticket size to absorb the cost of delivery.
We will continue to grow in the UK, getting closer to new communities through a target of 65-75 new store openings in 2018, and providing ongoing enhancements to service through our investments in technology and our supply chain. We expect capex for 2018 to be around £30m. We will continue to face competitive threats from branded pizza delivery businesses and delivery service businesses, but our excellent unit economics and our control of the end-to-end customer experience are important and sustainable differentiators.
Internationally, we are still in the early stages of our development but all of our controlled markets benefit from strong sales per store already – a very encouraging sign for the future. We will focus on developing per store profitability, adding on supply chain margin when the scale justifies it, and building the brand to facilitate successful digital growth and regional roll-out. We will also review any opportunities to enter additional markets in Northern Europe. Finally, we will continue to balance the long-term needs of the business with returns of excess capital to shareholders, and plan to invest up to £50m in 2018 in our share buyback programme.
David WildChief Executive Officer7 March 2018
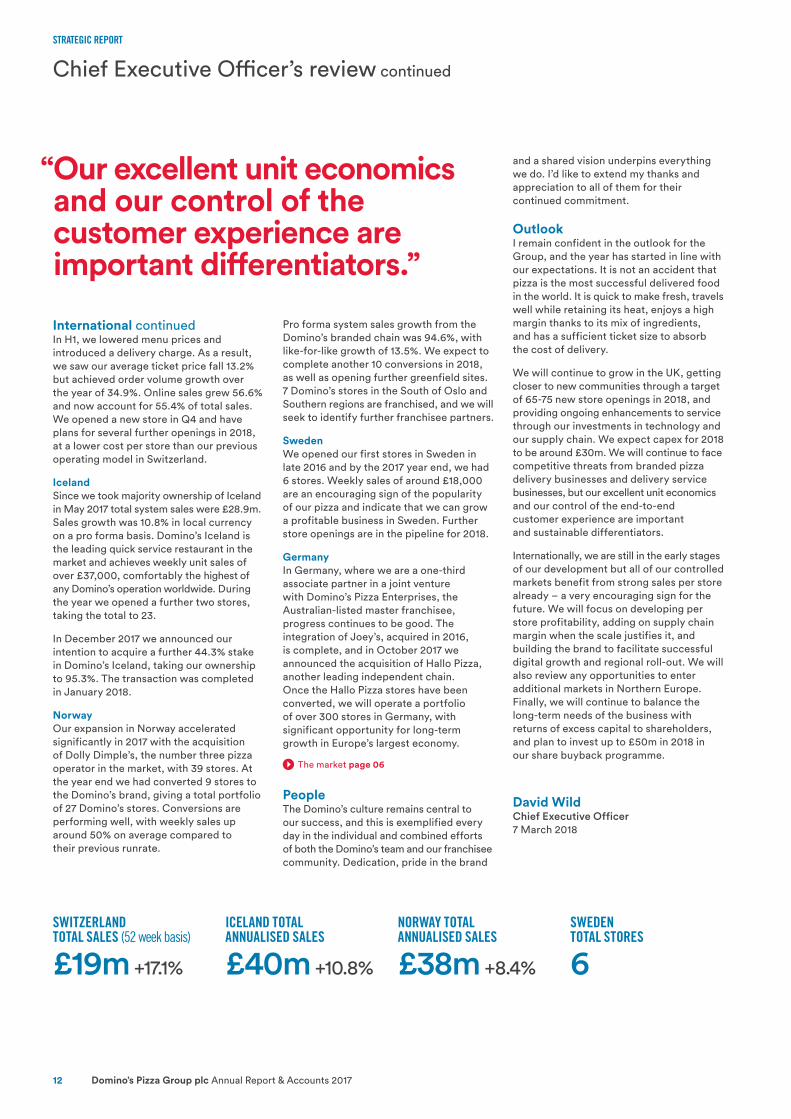
SWITZERLAND TOTAL SALES (52 week basis)
£19m +17.1%
ICELAND TOTAL ANNUALISED SALES
£40m +10.8%
NORWAY TOTAL ANNUALISED SALES
£38m +8.4%
SWEDEN TOTAL STORES
6

CORPORATE GOVERNANCE FINANCIAL STATEMENTSSTRATEGIC REPORT
Annual Report & Accounts 2017 Domino’s Pizza Group plc 13
Our goal and strategic pillars
Profitable, balanced and aligned franchise and corporate store network
Market-leading and innovative use of digital capability and data to drive customer interaction and franchise innovations
Highly productive and efficient manufacturer and supplier of food and non-food services
Engaged colleagues performing in a great and safe place to work
Strong financial foundations, rigorous capital allocation and efficient capital structure
To be the favourite takeaway and delivery brand
1
5
6
7
8
9
Easiest and best customer ordering
experience
2Superior end-to-end
customer service, value and product
3Great looking stores
within easy reach of all potential
customers
4
CUST
OMER
FAC
ING
ENAB
LERS
To be the #1 pizza company in every neighbourhood
The strategy “house” is the framework we use to bring structure and focus to our operational plan. It is unashamedly customer-facing: we believe the sustainability of financial growth and performance can only be underpinned by being first for customers, and constantly looking for ways to improve. Our scale and the cash-generative nature of the business allows us to reinvest at the right level to stay ahead of our competitors.

STRATEGIC REPORT
Domino’s Pizza Group plc Annual Report & Accounts 201714
Business model
We are different from most UK-listed restaurant businesses in that we operate a franchise model. This means we can grow with relatively low capital intensity, generating high returns. The dynamics of the business are much more akin to a branded food manufacturer and distributor, and our areas of investment reflect this.
DOMINO’S PIZZA INC. FRANCHISEES CUSTOMERS1
2
5
3 4DOMINO’S PIZZA GROUP PLC
SHAREHOLDERS
1 Domino’s Pizza International Franchising Inc. (‘DPI’) assigns an exclusive ten-year Master Franchise Agreement to the Group in each country. If we remain of good standing, we have a legal right to renew. We pay DPI a royalty fee of 2.7% of system sales, in return for which we have exclusive rights to the use of the Domino’s brand, and the benefit of the shared expertise of the Domino’s system worldwide.
2 We have historically generated a return on invested capital comfortably above our cost of capital, growing the intrinsic value of the business. We pay a progressive dividend while maintaining cover of 1.5–2x relative to earnings, and have a policy of returning excess capital to shareholders too, typically through share buybacks.
3 We make money by selling dough and other food and non-food products to our franchisees. They operate under a Standard Franchise Agreement for each territory that they manage. Franchisees meet the cost of new store openings, which enables us to grow our reach with limited capital intensity. In the UK, they pay us a royalty fee of 5.5% of system sales, and contribute a further 4% to the National Advertising Fund, which we invest in the brand on their behalf.
4 Franchisees make money by making and selling pizza and other food items to end customers. They supplement the national advertising budget with local marketing, and invest in labour to provide strong customer service. Franchisee profitability is an important driver of growth for Domino’s as it is a key variable in new store openings. Average opening costs are £300k and average mature store EBITDA in the UK for 2017 was £151k.
OUR KEY RELATIONSHIPS
BRAND
SUPPLY CHAIN
TECHNOLOGY
CORPORATE STORES

CORPORATE GOVERNANCE FINANCIAL STATEMENTSSTRATEGIC REPORT
Annual Report & Accounts 2017 Domino’s Pizza Group plc 15
BRANDWe are part of a global system covering 80
countries, with a brand that has become synonymous with delivered pizza in recent
years. We invest 4% of system sales on behalf of franchisees in national advertising,
TV sponsorship and other brand-building activity. We also build and protect the brand
through very high operating standards to which our franchisees need to adhere, a commitment
to high quality, fresh ingredients and continuous innovation to enhance service for customers.
SUPPLY CHAINWe make fresh dough and deliver it to our UK
stores three times a week, along with all the other food and supplies that franchisees need to make and sell great pizza. This is how we make money,
so this is where we make our biggest investments. In 2018 we will complete our new commissary and Supply Chain Centre in Warrington, at an expected budget of £40m. This will give us sufficient highly efficient capacity to produce dough for our target of 1,600 stores. Our franchisees benefit from the huge scale and logistics advantages we provide – giving cost economics that their competitors
are not able to replicate.
TECHNOLOGYOur investment in technology serves two main purposes – to make constant improvements to the customer ordering experience, and to help
franchisees maximise their own operating efficiency. Customers have a widening range of ways to order delivered food, and we need to be at the forefront of technology innovation to earn
and retain their loyalty. For franchisees, technology tools such as GPS help them to
manage labour costs and provide an even better service for customers. The scale of the Domino’s system allows us to spread the investment cost
effectively over a large franchisee base.
CORPORATE STORESWe have recently begun to invest in directly
operated stores – a new use of capital for the Group. This makes sense in new countries
where we need to build up store-level profitability before attracting franchisees to
take on the next stage of growth. We are also investing in our own stores in London, where our
market share is much lower than elsewhere in the UK. Other benefits include the operational experience it gives our management team, and
the ability to test new menus, pricing and technology in a live environment before
introducing them to the wider franchisee base.
5
INVESTMENT IN KEY ASSETSOur business is built on our ongoing investment
in key assets – our brand, technology and supply chain. These drive sales and profitability for our franchisees, increasing the scale of the system, generating cash for reinvestment and
thus creating a virtuous circle. We now also invest selectively in our own stores.

STRATEGIC REPORT
Domino’s Pizza Group plc Annual Report & Accounts 201716
IntroductionIn this section I cover all the financial aspects of the business – looking not only at performance but also at other significant value drivers such as capital allocation and structure, and return on capital employed. 2017 has witnessed a material evolution in our capital strategy which I cover in some detail below.
In any analysis of our performance, it is important to understand the difference between system sales and statutory revenue, and why we as a business focus more on the former as a driver of performance rather than statutory revenue.
System sales are the total sales to end customers through our network of stores. For stores owned and operated by franchisees, these are not in our statutory revenue but do drive revenue through food sales to franchisees and royalty fees. For stores which we own and operate ourselves (which we call “corporate stores”), these do appear in our statutory revenue. The vast majority of our store network is franchisee operated.
Statutory revenue consists of food and non-food sales to franchisees, royalties paid by franchisees, rental income and end-customer sales in our corporate stores (see above).
Statutory revenue is a more volatile indicator of our performance for two reasons. First, food wholesale prices are much more volatile than menu prices; this means that the unit price of goods we sell to franchisees fluctuates more than the prices paid by customers. As a result, system sales give a useful alternative reading over time of the health and growth of the business. Second, revenue contains items such as rental income which are only accounted for because we hold the head leases for our franchisees’ stores and then sub-let to them; these are not a driver of value.
From a performance perspective, we are also much more focused on operating margin as measured against system sales than against statutory revenue. The volatility of dairy prices means that we target a cash gross profit per unit from cheese, rather than a percentage gross margin. When prices are falling, our statutory margin percentage rises, and vice versa. However, this has little bearing on the system sales operating margin, which tends to iron out food price volatility.
Chief Financial Officer’s review
BALANCING GROWTH, SUSTAINABILITY AND
RETURNS • Statutory revenue of £474.6m, up 29.3% on a 52 week basis
• Underlying PBT is £96.2m, on a 52 week basis growth is 10.2%
• Underlying basic EPS of 16.0p, up 13.9% on a 52 week basis
• Total investments in capex and M&A of £91.1m
• Total cash returned to shareholders of £77.0m
• New five-year credit facility of £350m
• Target capital structure of 1.75-2.5x net debt/EBITDA reflects strong cash generation of the business
CORPORATE GOVERNANCE FINANCIAL STATEMENTSSTRATEGIC REPORT
Annual Report & Accounts 2017 Domino’s Pizza Group plc 17
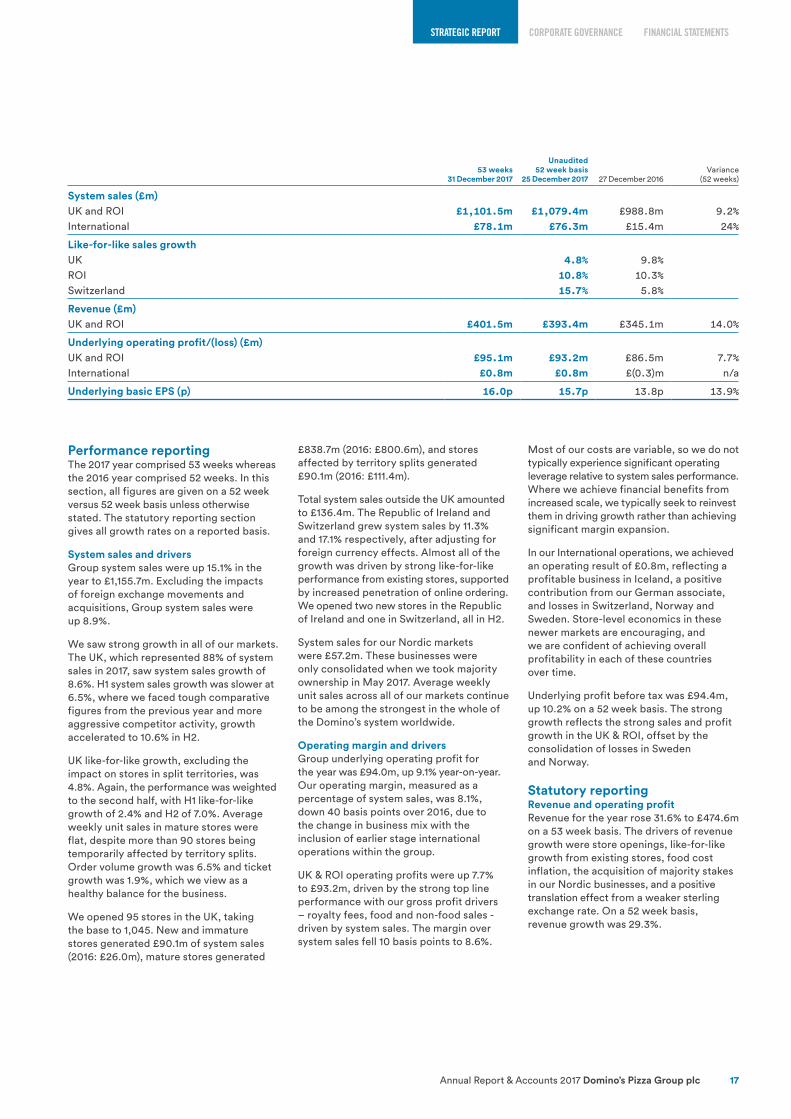
Performance reportingThe 2017 year comprised 53 weeks whereas the 2016 year comprised 52 weeks. In this section, all figures are given on a 52 week versus 52 week basis unless otherwise stated. The statutory reporting section gives all growth rates on a reported basis.
System sales and driversGroup system sales were up 15.1% in the year to £1,155.7m. Excluding the impacts of foreign exchange movements and acquisitions, Group system sales were up 8.9%.
We saw strong growth in all of our markets. The UK, which represented 88% of system sales in 2017, saw system sales growth of 8.6%. H1 system sales growth was slower at 6.5%, where we faced tough comparative figures from the previous year and more aggressive competitor activity, growth accelerated to 10.6% in H2.
UK like-for-like growth, excluding the impact on stores in split territories, was 4.8%. Again, the performance was weighted to the second half, with H1 like-for-like growth of 2.4% and H2 of 7.0%. Average weekly unit sales in mature stores were flat, despite more than 90 stores being temporarily affected by territory splits. Order volume growth was 6.5% and ticket growth was 1.9%, which we view as a healthy balance for the business.
We opened 95 stores in the UK, taking the base to 1,045. New and immature stores generated £90.1m of system sales (2016: £26.0m), mature stores generated
£838.7m (2016: £800.6m), and stores affected by territory splits generated £90.1m (2016: £111.4m).
Total system sales outside the UK amounted to £136.4m. The Republic of Ireland and Switzerland grew system sales by 11.3% and 17.1% respectively, after adjusting for foreign currency effects. Almost all of the growth was driven by strong like-for-like performance from existing stores, supported by increased penetration of online ordering. We opened two new stores in the Republic of Ireland and one in Switzerland, all in H2.
System sales for our Nordic markets were £57.2m. These businesses were only consolidated when we took majority ownership in May 2017. Average weekly unit sales across all of our markets continue to be among the strongest in the whole of the Domino’s system worldwide.
Operating margin and driversGroup underlying operating profit for the year was £94.0m, up 9.1% year-on-year. Our operating margin, measured as a percentage of system sales, was 8.1%, down 40 basis points over 2016, due to the change in business mix with the inclusion of earlier stage international operations within the group.
UK & ROI operating profits were up 7.7% to £93.2m, driven by the strong top line performance with our gross profit drivers – royalty fees, food and non-food sales - driven by system sales. The margin over system sales fell 10 basis points to 8.6%.
Most of our costs are variable, so we do not typically experience significant operating leverage relative to system sales performance. Where we achieve financial benefits from increased scale, we typically seek to reinvest them in driving growth rather than achieving significant margin expansion.
In our International operations, we achieved an operating result of £0.8m, reflecting a profitable business in Iceland, a positive contribution from our German associate, and losses in Switzerland, Norway and Sweden. Store-level economics in these newer markets are encouraging, and we are confident of achieving overall profitability in each of these countries over time.
Underlying profit before tax was £94.4m, up 10.2% on a 52 week basis. The strong growth reflects the strong sales and profit growth in the UK & ROI, offset by the consolidation of losses in Sweden and Norway.
Statutory reportingRevenue and operating profitRevenue for the year rose 31.6% to £474.6m on a 53 week basis. The drivers of revenue growth were store openings, like-for-like growth from existing stores, food cost inflation, the acquisition of majority stakes in our Nordic businesses, and a positive translation effect from a weaker sterling exchange rate. On a 52 week basis, revenue growth was 29.3%.
53 weeks31 December 2017
Unaudited52 week basis
25 December 2017 27 December 2016Variance
(52 weeks)
System sales (£m)UK and ROI £1,101.5m £1,079.4m £988.8m 9.2%International £78.1m £76.3m £15.4m 24%
Like-for-like sales growthUK 4.8% 9.8%ROI 10.8% 10.3%Switzerland 15.7% 5.8%
Revenue (£m)UK and ROI £401.5m £393.4m £345.1m 14.0%
Underlying operating profit/(loss) (£m)UK and ROI £95.1m £93.2m £86.5m 7.7%International £0.8m £0.8m £(0.3)m n/a
Underlying basic EPS (p) 16.0p 15.7p 13.8p 13.9%

STRATEGIC REPORT
Domino’s Pizza Group plc Annual Report & Accounts 201718
Statutory reporting continuedRevenue and operating profit continuedReported operating profit was £75.5m, down 9.0% year-on-year. This number includes our joint ventures in the UK and Germany, which are accounted for as associates and contributed £2.4m and £1.4m respectively.
InterestNet finance costs for 2017 was £(0.1)m (2016: £(0.5)m). The higher total interest expense reflects the higher average net debt through the year as a result of acquisitions and share buybacks. The total interest
expense was offset by £1.8m of finance income, of which £1.2m was a net foreign exchange gain.
Profit before taxStatutory profit before tax was £81.2m, down 2.0% year-on-year. Non-underlying items presented at the half year were a net gain of £1.6m. During the second half of the year we recognised a further gain of £1.0m and expenses of £(17.6)m, resulting in a net non-underlying expense of £(15.0)m for the full year (2016: £(3.1)m). These related to provisions for potential employment tax liabilities on a historic share scheme,
acquisition expenses, store conversion costs and an impairment, partly offset by a net gain on the step acquisitions in the Nordics.
TaxationThe underlying effective tax rate for 2017 was 18.3% (2016: 20.3%), reflecting the inclusion of our share of post tax profits from JVs and associates in underlying profit before tax, lower overseas losses, and current and deferred tax rate differences. The statutory effective tax rate was 17.8% (2016: 21.9%), reflecting the gain on the step acquisitions in the Nordics not being taxable.
Cash flows and capital allocationThe Group is highly cash generative and has many opportunities to invest for growth, while also returning excess cash to shareholders in a regular and structured way. During the year, we took the opportunity to revise our target capital structure, giving us a more efficient balance sheet through increased debt funding.
In 2017 we continued to generate very strong net cash flow from operating activities, rising 65.4% to £104.2m year-on-year. This was supported by a strong working capital performance, with a net inflow of £18.7m compared to an outflow of £10.7m in 2016.
We deployed a record £168.1m of capital during 2017. We run a rigorous capital allocation programme with clear prioritisations.
1. Capex. Our number one priority is to invest in the infrastructure of the business, to improve the customer experience and the efficiency of the system, and ensure sufficient capacity for future growth. This year we invested a record £46.6m in the business. Of this, £26.7m related to our new supply chain centre in Warrington, which will give us dough production capacity for our target of 1,600 UK stores. We also invested £6.2m in IT, both to support franchisees in providing service to customers and to upgrade our own technology platforms. Typically we recover our franchisee-related IT spend through fees over the following three years. £7.2m was invested in new stores and conversions, supporting our international growth.
2. Dividends. We returned £40.4m to shareholders through the ordinary dividend. From a cash perspective, this reflects the payments of the final dividend for 2016 and the interim dividend for 2017. On a declared basis, dividends per share for 2017 amounted to 9.00p (interim 3.75p, final 5.25p), up 12.5% on 2016’s 8.00p dividend (interim 3.50p, final 4.50p). Our policy is for ordinary dividends to be 1.7-2x covered by earnings per share.
3. Acquisitions. We invested £44.5m in M&A activity: £20.1m moving to majority ownership in Iceland, Norway and Sweden and acquiring Dolly Dimple’s, a Norwegian pizza chain, and £24.4m acquiring a 75% stake in our largest London franchisee. We will continue to look for opportunities to enter new, adjacent markets, build scale in existing markets, or add expertise to the Group.
4. Returns of excess capital. When we have excess capital relative to our target leverage ratio, we will look to return it to shareholders to maintain capital discipline and an efficient balance sheet. During the year we invested £36.6m in buying our own shares, at an average price of 339.9p. We assess the value of share buybacks by reference to the Board’s own view of intrinsic value as well as an internal rate of return calculation.
We ended the year with net debt of £89.2m, up from £34.6m at the end of 2016, giving us a leverage ratio of 0.83 x net debt/EBITDA. In December 2017, we raised our target leverage ratio to a range of 1.75 – 2.5 times net debt/EBITDA, giving the business scope to invest when opportunities arise while still retaining the ability to delever should market conditions deteriorate.
Chief Financial Officer’s review continued
21
34
£40mDIVIDENDS
£47mCAPEX
ACQUISITIONS
£45mSHARE PURCHASES
£37m
EFFICIENT BALANCE SHEETTarget net debt/EBITDA: 1.25x
Current net debt/EBITDA: 0.6x

CORPORATE GOVERNANCE FINANCIAL STATEMENTSSTRATEGIC REPORT
Annual Report & Accounts 2017 Domino’s Pizza Group plc 19
Earnings per shareUnderlying basic earnings per share for 2017 was 16.0p on a 53 week basis, representing 15.9% growth over last year (2016: 13.8p). On a 52 week basis, underlying basic earnings per share was 15.7p, up 13.9%. EPS growth was driven by strong sales growth, stable margins as a percentage of system sales, and a 1.4% reduction in the average share count as a result of share buybacks over the last two years.
On a statutory basis, basic earnings per share was 13.8p (2016: 13.1p) and diluted earnings per share was 13.6p (2016: 12.9p).
Capital employed and balance sheetNon-current assets have increased by £112.9m in the year; the main drivers of this are the acquisitions of London corporate stores and the controlling stake in the Nordic associates. Intangibles assets excluding goodwill of £40.8m were recognised on the Nordic acquisitions, being the Master Franchise Agreements for Iceland, Norway and Sweden, and intangibles of £4.5m for the Standard Franchise Agreement for the UK corporate stores. Goodwill totalling £47.8m was recognised on these transactions; £21.3m for the Nordics and £26.5m for the UK corporate stores. Property, plant and equipment additions of £38.1m included £28.9m for the new supply chain centre at Warrington.
Current assets have increased £11.6m with £5.5m reflecting the consolidation of the Nordic operations, £5.9m increase in cash and £3.9m NAF receivable balance as a result of a short term deficit offset by a £3.3m reduction in inventories within UK and Ireland.
Current liabilities have increased £50.9m with £27.1m increase in trade and other payables of which £17.9m is a result of the consolidation of the Nordic acquisitions, £8.9m reflects improved working capital within the UK and Ireland, an £8.3m increase in share buyback obligations and £5.6m gross put option liability that is held by the non-controlling interest for London corporate stores.
The increase in non-current liabilities are due to an additional £56.4m drawn on the RCF, which was used to fund acquisitions in the period, and £34.7m of gross put option liabilities that are held by the non-controlling interests in the Nordic entities. Provisions have increased predominantly due to the recognition of £11.0m for the reversionary share plan. Deferred tax liabilities have increased as deferred tax has been recognised on the MFAs acquired during the year.
The significant changes in equity are the corresponding entries for the £40.3m of gross put option liabilities held within other reserves, and non-controlling interests for the Nordic and London corporate store subsidiaries.
Treasury management In December 2017, the Group successfully re-negotiated and increased its unsecured revolving multi-currency facility to £350m. The facility is for five years with two further one-year extensions. The facility’s lower range remains at a margin of 75bps above LIBOR rising to 180bps with increased leverage, plus a utilisation fee of between 0-30% of the margin. The Group also completed a full bank tender for the UK and Ireland clearing bank and London corporate stores.
The Group monitors its overall level of financial gearing on a regular basis to ensure that it remains well within its targets and banking covenants. The Group monitors its cash resources centrally through short, medium and long-term cash forecasting. Surplus cash is swept into interest bearing accounts or placed on short-term money market deposits.
Under-pinning Treasury activity is a robust Treasury Policy and Strategy that aims to minimise financial risk. Foreign exchange movement arising from transactional activity is reduced by either agreeing fixed currency rates with suppliers or pre-purchasing the currency spend. Translation exposure is minimised by reducing overseas net assets.
Notes
1 New stores are stores which opened in the reported financial year. Stores are then classified as immature in the second reported financial year and mature in the third. For example, a store opened in November 2016 would be classified as “new” in the period to December 2016, “immature” in the period to December 2017, and “mature” in the period to December 2018 and subsequently.
Rachel OsborneChief Financial Officer7 March 2018
STRATEGIC REPORT
Domino’s Pizza Group plc Annual Report & Accounts 201720
Key performance indicators
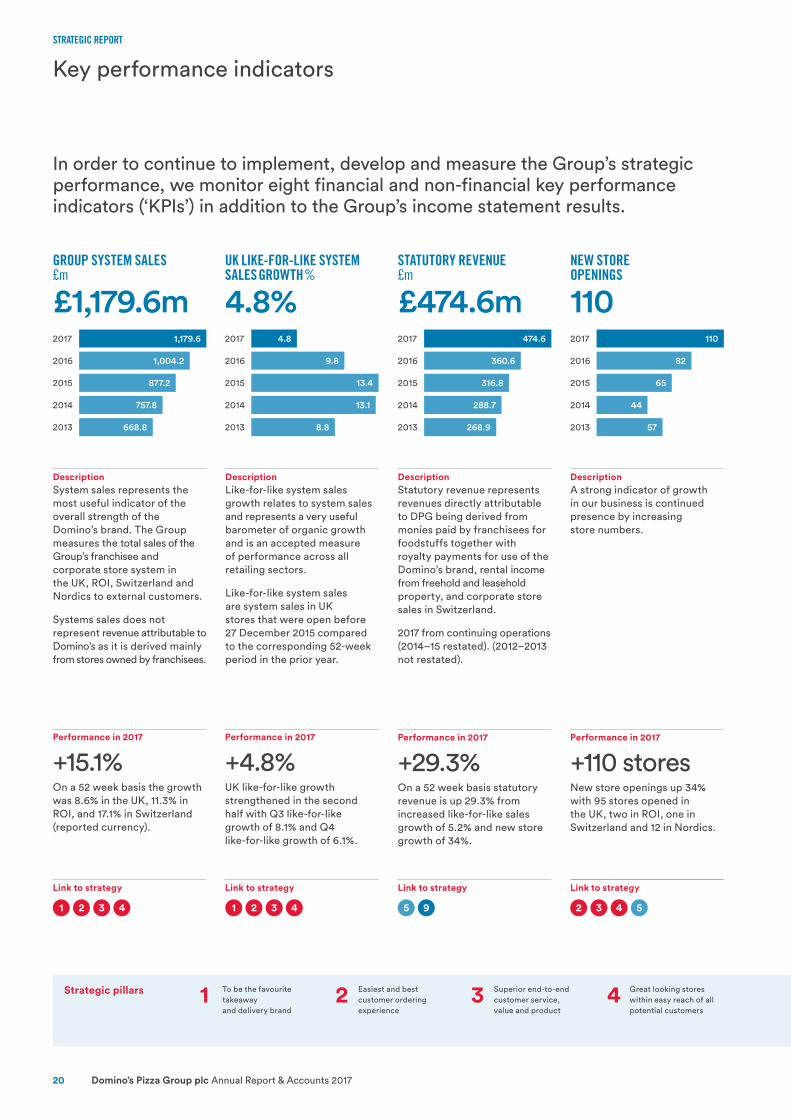
In order to continue to implement, develop and measure the Group’s strategic performance, we monitor eight financial and non-financial key performance indicators (‘KPIs’) in addition to the Group’s income statement results.
DescriptionLike-for-like system sales growth relates to system sales and represents a very useful barometer of organic growth and is an accepted measure of performance across all retailing sectors.
Like-for-like system sales are system sales in UK stores that were open before 27 December 2015 compared to the corresponding 52-week period in the prior year.
2017 2017
2016 2016
2015 2015
2014 2014
2013 2013
DescriptionSystem sales represents the most useful indicator of the overall strength of the Domino’s brand. The Group measures the total sales of the Group’s franchisee and corporate store system in the UK, ROI, Switzerland and Nordics to external customers.
Systems sales does not represent revenue attributable to Domino’s as it is derived mainly from stores owned by franchisees.
STATUTORY REVENUE £m
£474.6m474.6
360.6
316.8
288.7
268.9
DescriptionStatutory revenue represents revenues directly attributable to DPG being derived from monies paid by franchisees for foodstuffs together with royalty payments for use of the Domino’s brand, rental income from freehold and leasehold property, and corporate store sales in Switzerland.
2017 from continuing operations (2014–15 restated). (2012–2013 not restated).
NEW STORE OPENINGS
110110
82
65
44
57
DescriptionA strong indicator of growth in our business is continued presence by increasing store numbers.
Link to strategy
Performance in 2017
+4.8%UK like-for-like growth strengthened in the second half with Q3 like-for-like growth of 8.1% and Q4 like-for-like growth of 6.1%.
Performance in 2017
+15.1%On a 52 week basis the growth was 8.6% in the UK, 11.3% in ROI, and 17.1% in Switzerland (reported currency).
Link to strategy
Performance in 2017
+29.3%On a 52 week basis statutory revenue is up 29.3% from increased like-for-like sales growth of 5.2% and new store growth of 34%.
Link to strategy
Performance in 2017
+110 storesNew store openings up 34% with 95 stores opened in the UK, two in ROI, one in Switzerland and 12 in Nordics.
1 52 25 93 34 4
Strategic pillars 1 To be the favourite takeaway and delivery brand
2 Easiest and best customer ordering experience
3 Superior end-to-end customer service, value and product
4 Great looking stores within easy reach of all potential customers
UK LIKE-FOR-LIKE SYSTEM SALES GROWTH %
4.8%2017 4.8
2016 9.8
2015 13.4
2014 13.1
2013 8.8
GROUP SYSTEM SALES
£m
£1,179.6m2017 1,179.6
2016 1,004.2
2015 877.2
2014 757.8
2013 668.8
Link to strategy
1 2 3 4

CORPORATE GOVERNANCE FINANCIAL STATEMENTSSTRATEGIC REPORT
Annual Report & Accounts 2017 Domino’s Pizza Group plc 21
DescriptionUnderlying operating profit excludes the impact of costs of restructuring, acquisitions of JVs, associates and one-off items.
Underlying Group operating profit is a good indicator of the efficiency of the business model for the shareholders and franchisees alike.
2017 from continuing operations (2014–15 restated). (2013 not restated).
DescriptionProfit after tax divided by the number of total shares. Basic earnings per share (‘EPS’) represents profit for the year attributable to equity shareholders. EPS provides a comparable measure of shareholder return.
2017 from continuing operations (2013–2015 restated for the 3 for 1 sub-division of shares effective on 27 June 2016).
DIVIDEND PER SHARE p
9.0p2017
2016
2015
2014
2013
9.0
8.0
6.9
5.8
5.3
DescriptionThe interim dividend paid and the final dividend proposed divided by the number of shares eligible for dividends.
2017 from continuing operations (2013–2015 restated for the 3 for 1 sub-division of shares effective on 27 June 2016).
DELIVERED ON TIME
%
81.8%2017
2016
2015
2014
2013
81.8
82.9
82.0
82.0
82.8
DescriptionThe UK and ROI’s target is to safely deliver its product to its customer within 30 minutes of an order being placed.
This measure is important to maintaining the quality of our product to the consumer.
Link to strategy
Performance in 2017
+12.5%Dividend per share increase of 12.5% reflects improved returns for our shareholders.
Performance in 2017
(1.1)% ptsThe percentage of orders delivered within 30 minutes fell slightly but still remains a key differentiator.
Performance in 2017
+9.1%On a 52 week basis, underlying operating profit grew 9.1% achieved through strong store growth and like-for-like system sales.
Performance in 2017
+3.1%On a 52 week basis, EPS growth of 3.1% driven by strong underlying performance and profits on non-continuing operations.
Link to strategy
5 57 79 9
5 Profitable, balanced and aligned franchise and corporate store network
6 Market-leading and innovative use of digital capability and data to drive customer interaction and franchise innovations
7 Highly productive and efficient manufacturer and supplier of food and non-food services
8 Engaged colleagues performing in a great and safe place to work
9 Strong financial foundations, rigorous capital allocation and efficient capital structure
UNDERLYING OPERATING PROFIT £m
£95.9m2017 95.9
2016 86.2
2015 73.2
2014 62.8
2013 47.9
BASIC EARNINGS PER SHARE p
13.8p2017 13.8
2016 13.1
2015 11.9
2014 9.9
2013 8.0
Link to strategy Link to strategy
53 76 9

STRATEGIC REPORT
Domino’s Pizza Group plc Annual Report & Accounts 201722
Risk management
The Board has continued to identify, evaluate and monitor risks facing the Group and, during the year under review, a particular focus has been placed on assessing the likely impact that each identified risk could have on the business.
OUR APPROACHAll businesses choose to take considered risks in the expectation of earning a return for their shareholders. The Board has determined its risk appetite, stating the risks it seeks to take (or is prepared to face) within the Company’s business model and the adopted strategy, and has also defined the risks it is not prepared to take. The latter are avoided or eliminated as far as possible, or transferred to insurers.
The Board is responsible for overseeing management’s activities in identifying, evaluating and managing the risks facing the Group. Importantly, we treat identifying and managing risk as an integral part of managing the business, and not as an additional bureaucratic chore. Principal risks are recorded in the Group’s risk register and regularly reviewed and evaluated. Each risk has a business owner, responsible for managing that risk, implementing appropriate controls and mitigating actions and reporting on it to the leadership team. In turn, the principal risks are reported on to the Board.
As a sense-check on management’s actions, the Board undertakes its own assessment of principal risks in each year, which is then integrated into the risk register. These known risks are taken into account in developing the Group’s strategy and business plans.
BUSINESS OWNER
LEADERSHIP TEAMGROUP EXECUTIVE
IDENTIFY RISK
REGULARLY REVIEW AND
EVALUATE
UPDATE KEY RISK REGISTER
ASSESS RISK AND IMPACT
CREATE MITIGATION STRATEGY
THE BOARD
PRINCIPAL RISKS AND UNCERTAINTIESThe business faces a wide range of risks on a daily basis. The Board has undertaken a robust assessment of what it believes are the principal risks facing the Company, including those that would threaten its business model, future performance, solvency or liquidity. The table overleaf summarises these principal risks and how they are being managed or mitigated.
The risks in this table have been assessed on a residual basis according to our current view of the potential severity (being the combination of impact and probability) and
assume that existing controls are effective. We have linked the risks to the strategic pillars described on page 13. The environment in which we operate is constantly evolving: new risks may arise, the potential impact of known risks may increase or decrease and/or our assessment of these risks may change. The risks therefore represent a snapshot of what the Board believes are the principal risks and are not an exhaustive list of all risks the Company faces. In prior years we had included the implementation of our new ERP system as a principal risk. Following the successful implementation of the
system the Board no longer considers this to be a principal risk.
The Board has again considered the risk posed by Brexit and has noted that there are likely to be risks associated with increases in the cost of raw materials and potential labour cost increases for franchisees. At the present time, the Board does not consider Brexit to be a principal risk to the business model, but will continue to monitor and evaluate this risk and reassess the exposure as necessary.

CORPORATE GOVERNANCE FINANCIAL STATEMENTSSTRATEGIC REPORT
Annual Report & Accounts 2017 Domino’s Pizza Group plc 23
STRATEGIC RISKS
People-related risks
Link to strategic pillars
RiskThe business is overly dependent on key individuals (either at Executive level or in relation to specialist skills), possibly exacerbated by a failure to attract or retain the skilled and experienced people it needs.
Potential impactMedium
ProbabilityMedium
MitigationThe Board considers succession planning on a regular basis and has set the CEO a personal objective of developing multiple potential successors. Contingency plans are in place which could be implemented on a short-term basis should we suddenly lose a key Executive.
Nature of threatThese risks could have some impact on future performance, for a limited time.
Change from 2016
CommentaryThere has been considerable work undertaken this year to improve the HR operating model and to establish more robust processes for talent management and succession planning.
Failure to respond to and overcome competitive pressures
Link to strategic pillars
RiskThe business faces strong competition from a range of players, including those exploiting emerging technologies or new food options and new entrants into the UK market.
Potential impactHigh
ProbabilityLow
MitigationManagement keeps the competitive landscape under continual review and the Board also monitors the markets in which it operates, as well as KPI data on the current business. Strategy is reviewed and developed by the Board on at least an annual basis.
Nature of threatThese risks have the potential to compromise our future performance or, in an extreme scenario, even the business model.
Change from 2016
CommentaryThis risk has increased during the year due to increased market pressure and evidence of increased “value for money” awareness driving consumer choice. A number of initiatives have been undertaken during the year to maintain product competitiveness.
1 12 5 8 2 3 5 6
Strategic pillars
1 To be the favourite takeaway and delivery brand
2 Easiest and best customer ordering experience
3 Superior end-to-end customer service, value and product
4 Great looking stores within easy reach of all potential customers
5 Profitable, balanced and aligned franchise and corporate store network
6 Market-leading and innovative use of digital capability and data to drive customer interaction and franchise innovations
7 Highly productive and efficient manufacturer and supplier of food and non-food services
8 Engaged colleagues performing in a great and safe place to work
9 Strong financial foundations, rigorous capital allocation and efficient capital structure

STRATEGIC REPORT
Domino’s Pizza Group plc Annual Report & Accounts 201724
Risk management continued
STRATEGIC RISKS CONTINUED
Failure to achieve UK growth through new store openings
Link to strategic pillars
RiskFailure to meet store growth targets would be a breach of our Master Franchise Agreements (MFAs). Our ability to open new stores depends on our ability to lease or buy suitable premises, obtain the necessary planning approvals and identify a suitable franchisee to run the store.
Potential impactHigh
ProbabilityLow
MitigationBoard approval is needed for the targets contained within the MFAs, and the Board monitors the pipeline of proposed store openings on a continual basis. Franchisee development programmes are run and we employ surveyors to identify and secure appropriate premises.
Nature of threatThese risks could have an impact on future performance. In an extreme case an unremedied breach of the MFA could threaten the Company’s business model and liquidity.
Change from 2016
CommentaryThe overall risk remains the same as last year. The MFA targets have been agreed for the next ten years and are set at 350 new stores over the period (on a net basis).
Commercial leverage of large franchisees
Link to strategic pillars
RiskThe Group has a number of franchisees whose businesses run large numbers of stores and so enjoy some commercial leverage. The Group may be unable to persuade these franchisees to implement our preferred strategies, or to pass on cost increases in full or in part.
Potential impactHigh
ProbabilityMedium
MitigationOpen and transparent relationships with multi-site franchisees are managed at senior levels of the Group. We also explain the profit-sharing model to all franchisees, so that they understand that success is mutual. Numbers of stores managed by the large franchisees are monitored.
Nature of threatThese risks have the potential to compromise our future performance for a period of time.
Change from 2016
CommentaryThe assessed level of risk has increased during the year, largely due to some pressure on franchisee profitability. There is regular and ongoing dialogue with the franchisee community to mitigate this risk.
1 12 3 4 2 3 4 5 6
Inability to react to changes in the health debate and public desire for healthier food
Link to strategic pillars
RiskAs society’s expectations evolve, and governments act on public health concerns, we may need to change the products we offer and our approach to marketing.
Potential impactMedium
ProbabilityLow
MitigationManagement keeps consumers’ purchasing preferences under continual review and adjusts menus in response to these. We also engage, appropriately, with the government on the public health debate to ensure that our views are understood by policy makers and influencers.
Nature of threatThese risks have the potential to compromise our future performance or, in an extreme scenario, even the business model.
Change from 2016
CommentaryThe Group is continually reviewing its products to ensure they meet governmental guidelines. Improvements are being made to make product nutritional information more accessible and certain products may undergo reformulation to reduce sugar levels.
1 3 9

CORPORATE GOVERNANCE FINANCIAL STATEMENTSSTRATEGIC REPORT
Annual Report & Accounts 2017 Domino’s Pizza Group plc 25
Interruption of raw material supplies
Link to strategic pillars
RiskThe business relies on a number of third-party suppliers for pizza toppings, some of whom provide the sole source of an ingredient. These suppliers must make a commercial return to stay in business and reinvest in their operations. The Group would be vulnerable if a supplier decided to cease trading, suffered a major interruption or food safety incident, or was responsible for an ethical breach of such severity that the Group would no longer trade with them.
Potential impactHigh
ProbabilityLow
MitigationSuppliers who are selected through competitive tendering and appropriate due diligence processes supply the Group under long-term contracts. The economics of their businesses are kept under review and their performance against their obligations is monitored. We assess their compliance with acceptable business standards.
Nature of threatThese risks have the potential to compromise our future performance for a limited time.
Change from 2016
CommentaryA detailed review of suppliers has been undertaken and is ongoing and steps have been taken to reduce supplier dependency and improve security of supplies through dual sourcing.
Supply Chain Centres are unable to supply the stores
Link to strategic pillars
RiskWe distribute both the pre-proved dough we produce and third-party pizza toppings to our franchisees’ stores. In the event of physical damage to, or loss of, a Supply Chain Centre we would need to make urgent contingency arrangements wherever possible. However, the space required to hold dough whilst proving forms a critical constraint to our business.
Potential impactHigh
ProbabilityMedium
MitigationIn the event of the loss of a Supply Chain Centre, third-party ingredients could be delivered to stores direct, at an additional cost. The Group is considering developing additional dough proving facilities, which would mitigate this risk significantly. Loss of our dough production facilities would be more difficult to overcome, but contract production of dough would be possible, at an additional cost.
Nature of threatThese risks could have a significant impact on future performance and potentially liquidity, for a limited time.
Change from 2016
CommentaryThe level of risk has reduced since 2016 following the development of the Group’s new production facilities. Additionally, enhancements to the business continuity plan are expected to be implemented during 2018.
Food safety
Link to strategic pillars
RiskThere is the risk of contamination in either the pre-proved dough we produce at the Group’s Supply Chain Centres, or in the pizza topping ingredients we distribute to our franchisees’ stores. Where we operate corporate stores, and are responsible for finished products, this risk is exacerbated.
Potential impactHigh
ProbabilityMedium
MitigationThe business has implemented a rigorous regime of standards and food safety checks, working with the appropriate government regulator.
Nature of threatIf this risk materialised, it could have a significant impact on future performance and potentially liquidity, for a limited time. The reputational impact could have a longer-term effect on performance and, in an extreme case, threaten the business model.
Change from 2016
CommentaryThis risk has not changed materially during the year. The risk is monitored on a regular basis by a qualified in-house resource. The Board routinely receives reports on “food safety” risk controls.
OPERATIONAL RISKS
1 12 3 5 7 9 2 3 5 71 2 3 7 9

STRATEGIC REPORT
Domino’s Pizza Group plc Annual Report & Accounts 201726
Risk management continued
OPERATIONAL RISKS CONTINUED
Loss of personal data relating to customers, employees or others; loss of corporate data
Link to strategic pillars
RiskFor ease of use, our online ordering systems hold some customer data, the loss of which (whether accidental or following hacking) would cause disruption and cost to the Group. In addition, the Group’s own data on employees and suppliers is exposed to the same risks of loss.
Potential impactHigh
ProbabilityMedium
MitigationCyber-risk appears on the Board agenda and Audit Committee agenda on a regular basis and management keeps the security of data under its ownership or control under continual review. We do not hold customer credit card data on our systems. Franchisees are trained in their obligations in respect of personal data and are required to train their staff appropriately. Appropriate IT security is in place and kept under continual review.
Nature of threatThese risks have the potential to compromise our future performance. In an extreme scenario, the reputational damage could possibly threaten the business model if we suffered a total loss of consumer confidence.
Change from 2016
CommentaryCyber-risk remains a major threat. The cyber-security systems are regularly reviewed by the Group’s management and external advisers. Regular updates on cyber-security are provided to the Audit Committee.
1 2 3 6 9
Failure of online ordering systems for a prolonged or critical period
Link to strategic pillars
RiskOver 75% of delivered sales are now placed online, around half of which are using apps for mobile devices. As well as the reliance on data centres and our own software developed in-house, there is also a risk from malicious denial of service attacks.
Potential impactHigh
ProbabilityMedium
MitigationCyber-risk appears on the Board agenda and Audit Committee agenda on a regular basis and management reviews the performance of its IT infrastructure on a continual basis. Our systems are hosted by third-party specialists, with parallel processing across multiple sites and real-time replication and appropriate protection from malicious attempts to disrupt the availability of our sites.
Nature of threatThese risks could have some impact on future performance, for a limited time.
Change from 2016
CommentaryOn the whole, the level of risk has remained constant. The Group has maintained its compliance with PCI level 1 and continues to enhance its technical capability and resilience.
1 2 3 5 6 9

CORPORATE GOVERNANCE FINANCIAL STATEMENTSSTRATEGIC REPORT
Annual Report & Accounts 2017 Domino’s Pizza Group plc 27
Viability statement
The Company’s current positionThe Group’s business model has been shown to be robust since the business was formed. We operate under what is effectively a perpetual Master Franchise Agreement in each key territory, so our business model is long-term and effectively open-ended. The Group’s strategy and business model which is explained on pages 13 to 15, is well established and we have a market-leading position in the UK and ROI business and have successfully exploited the emergence of e-commerce as a sales channel. We continue to open new pizza stores and drive increases in like-for-like sales, and can demonstrate strong growth in system sales, and Group turnover and profitability, over many years. Our business is profitable and we successfully convert almost all of this into cash generation. At 31 December 2017, the Group has net debt of £89.2m and a committed £350m five-year multi-currency bank facility, which expires in July 2022.
The Board has considered its appetite for risk and there is a clearly articulated statement of this which forms the basis for the Group’s risk management activities.
Our strategic planning processThe CEO, supported by the leadership team, is responsible for the Group’s strategic planning process. This is an annual review of the current strategy, informed by monitoring of market trends and developments and in-house analysis, supported where necessary by external market research. This results in a draft strategic plan, supported by detailed financial modelling, which is debated by the Board at its annual strategy away-day. The Board’s role includes considering whether the plan appropriately factors in the changing external environment and whether the Group has access to the
financial, technical and human resources necessary to implement it successfully.
The resulting agreed strategic plan is generally prepared on a five-year basis, but both management and the Board are aware that we operate in a fast-moving environment.
The process of assessing our viability and key assumptions The strategic plan reflects the Directors’ best estimate of the future prospects of the business, but we have also assessed the potential impact on the Group of a number of scenarios based on each of the principal risks and uncertainties described in this section of the Annual Report. Those risks are “principal” because they could prevent the Group from delivering on its strategy. Although our strategic plans have a five-year horizon, we chose to model the impact of these risks over a period of three years in view of the dynamic nature of our business and the environment in which we operate, and also the inherent unreliability of some data when forecast five years in advance.
We have also explored the impact of “severe but plausible” combinations of these risks, in circumstances that we believe the Group could experience, including:
• only managing to open half of the planned number of new pizza stores, while simultaneously suffering an assumed 10% increase in the costs of sourcing food ingredients; and
• the complete failure of our e-commerce ordering systems in the busiest week of our trading year, while simultaneously suffering a breach of data security leading to additional costs, regulatory penalties and a 1% reduction in sales due to lost customer confidence.
The key assumption in this modelling of our strategy and the impact of the principal risks includes:
• while a number of industry commentators believe that there is a natural ceiling on the number of pizza stores we can open, the Group has consistently delivered growth ahead of these predictions. We continue to assume that the UK market, in particular, is capable of sustaining the growth in store numbers we anticipate.
This key assumption is linked to the Group’s principal risks regarding new store openings and explained further in the risk management section.
The results of this modelling showed that, due to the inherent strength and stability of our business, the Group should be able to withstand the impact should any of these scenarios materialise over the three-year period.
We also investigated whether “reverse stress-testing” would offer an alternative view. Although we have net debt and a committed bank facility, we could find no plausible scenario which had such an impact on the Group’s future performance, solvency or liquidity that it would lead to the Group’s financial failure. The most obvious risk which could have such an effect would be a breach of the Master Franchise Agreement, which is highly improbable.
Longer-term viability statementBased on their assessment of prospects and viability above, the Directors confirm that they have a reasonable expectation that the Group will be able to continue in operation and meet its liabilities as they fall due over the three-year period to the end of December 2020.

STRATEGIC REPORT
Domino’s Pizza Group plc Annual Report & Accounts 201728
In 2013, we began to develop a corporate social responsibility (‘CSR’) strategy by analysing our current business practices and devising a plan for the years to come. We have a successful business, built on a simple business model – deliver hot, freshly handcrafted pizza to our customers as quickly as is safely possible.
We have a responsibility to uphold the solid reputation our business has formed since we arrived in the UK in 1985. To ensure we build a sustainable business for the future, we have developed a responsible delivery plan, our CSR strategy.
FOODAchievements in 2017
• Removed nearly 1 tonne of salt as part of ongoing reduction programme.
• Validation of accuracy of nutritional data.
• Implementation of first Animal Welfare Policy.
We are proud of the food we serve. Every Domino’s pizza is bursting with great quality ingredients like hand-stretched fresh dough, Welsh mozzarella and vine-ripened tomatoes. This is why our pizzas can transform any occasion, from a relaxing evening at home to a big family party.
Healthy eatingAs customers’ tastes change, choice is becoming increasingly important. At Domino’s, we are passionate about innovation, so we are constantly looking for ways to improve our food. We follow the ongoing public debate on healthy eating closely. We have a dedicated internal steering group focused on ensuring we are making progressive changes to our food ahead of evolving customer expectations.
We want our customers to be in charge. They are able to choose the toppings, the crust, the type of cheese and, most importantly, the number of slices they eat. We generally recommend about three slices per person and continue to offer Delight Cheese with a third less fat than standard mozzarella.
We are proud to be one of the few pizza brands to offer a reduced fat mozzarella option. Since the beginning of 2012, we have removed over 40 tonnes of salt from our pizzas and reduced fat content in ingredients such as pepperoni and beef.
In August 2016, the government published its Childhood Obesity Strategy, which outlined requirements to reduce sugar across a range of product categories in the UK. Throughout 2017, we have worked with our suppliers to start the reformulation process to reduce the level of sugar in our cookies, which is currently our only remaining dessert that does not meet the voluntary guideline recommendations.
We continue to work with our suppliers to reduce the amount of salt in our products, and this year we launched a new sweetcorn with no added salt and sugar and also reformulated our tuna and tomato pizza sauce. Combined, these changes have helped us to remove nearly a tonne of salt from our products.
NutritionWe know it is possible to include pizza in a balanced diet, and we are committed to providing transparent nutritional information to enable our customers to make informed decisions.
To ensure this transparency, we provide calorie information on our website and via our app. We publish detailed nutritional profiles for more than 1,500 combinations
of regular pizzas and those made with our Delight Cheese.
We also have an ingredients bible listing any additives included in our products to help customers understand why they are present.
We are proud to state we continue not to use artificial colours or flavourings in any of our pizzas or side orders and removed trans fats several years ago. We also offer a gluten-free pizza base, which is becoming increasingly popular with our customers.
Product sourcing and animal welfareThe origin and quality of the food we offer our customers is paramount.
We have developed long-term relationships with our suppliers, many of whom have been in place for more than a decade. We also take great pride in ensuring the quality of our products and continually assess each of our suppliers.
Animal welfare is important to us and to our customers. In 2017, we published our first Annual Welfare Policy relating to our supply chain base in the UK and Republic of Ireland. This document sets out the standards we expect of our suppliers and the processes we have in place for ensuring compliance.
Corporate social responsibility report
Since the beginning of 2012, we have removed over 40 tonnes of
salt from our pizzas.
Community values have always been at our heart. There is more to being a responsible business than our charitable funding, namely the quality of our food, the impact we have on the environment and how we treat our employees.

CORPORATE GOVERNANCE FINANCIAL STATEMENTSSTRATEGIC REPORT
Annual Report & Accounts 2017 Domino’s Pizza Group plc 29
We demand suppliers comply with all EU, local and UK animal welfare legislation, irrespective of species or geographical location. We work closely with our suppliers to ensure animals are able to exhibit normal behaviour patterns, are properly supervised during transport, and are handled by trained stockman, slaughterhouse workers and hauliers. All animals are stunned prior to slaughter. We do not permit the use of antibiotics within our supply chain for anything other than treatment purposes. Medicines, including antibiotics should not be used for disease prevention or as a growth promoter.
In 2017, we held training courses to ensure colleagues, including those responsible for developing and procuring products, and for communicating with our customers, fully understand our principles within this area. Our programme of annual audits for meat
suppliers is ongoing to ensure compliance, including in the use of antibiotics. We continue to take steps to improve standards, agreeing specific targets and timelines for enhancements with suppliers. We remain committed to providing more information, so our stakeholders are aware of the measures we are taking in this important area.
Objectives for 2018 • Continue to reformulate products,
helping to further improve our health and quality credentials.
• All new products must follow strict nutritional criteria to ensure that they meet government guidelines on salt, sugar, calories and portion sizing.
• Introduce key performance indicators relating to animal welfare to track and monitor supplier performance.
ENVIRONMENTAchievements in 2017
• 3% reduction in GHG emissions despite an 8% increase in global production volumes.
• 19% reduction in emissions intensity ratio to 0.28 tCO2e per tonne of dough produced, down 37% since baseline.
• 9% reduction in owned vehicle emissions, with UK & ROI delivery fleet mileage reduced by over 500,000 miles.
• 91% recycling rate achieved across all operations.
Investment in energy efficiency In June 2017, work commenced on our new high specification supply chain facility in Warrington with production expected to go live in April 2018. Once operational, this facility will provide a very high level of control over energy management and resource consumption with all production activities supported by the latest innovations and technologies including:
• automated energy management system for electricity, natural gas and water;
• complete air management system using “duty standby” air compressors;
• internal and external LED lighting systems;
• occupancy control sensors;
• all machinery meets high EU energy efficiency standards; and
• increased water filtering and recycling for tray washing systems.
Reduction in delivery mileageSince opening our new depot in Highbridge in 2017 and the introduction of double-decker trailers, we continue to use these vehicles on trunking routes from West Ashland to Highbridge and from Penrith to Livingston. Despite an 8% increase in production volumes from UK operations, our improved fleet efficiency continues to deliver emissions savings and we are delighted to report a 15% reduction in UK delivery emissions alone.
The mileage saving in 2017 was 202,160
miles – a benefit versus 2016
of 149,360 miles.

STRATEGIC REPORT
Domino’s Pizza Group plc Annual Report & Accounts 201730
ENVIRONMENT CONTINUEDStriving for zero waste to landfillWe continue to strive towards achieving zero waste to landfill. 91% of the total waste produced was either recycled or recovered in 2016/17, down slightly from 94% reported in 2015/16.
Greenhouse gas emissions Intensity ratio We continue to track Greenhouse gas (GHG) emissions over time against the total volume of dough produced and our performance shows that we are becoming increasingly resource efficient. Reported scope 1 and 2 emissions for this reporting year are 0.28 tCO2e/tonne of dough produced, compared to our baseline figure of 0.44 tCO2e/tonne of dough produced. Our intensity ratio has decreased by 37%, well ahead of our relative reduction target of 25% by 2018. These indicators have been adjusted to reflect the acquisition of our Nordic operations in the reporting period.
Methodology We report on all emissions sources stipulated under the Companies Act 2006 (Strategic and Directors’ Reports) Regulations 2013.
The methodology used to compile this data is in accordance with the requirements of the following standards: the World Resources Institute’s Greenhouse Gas Protocol; Defra’s Environmental Reporting Guidelines: Including mandatory greenhouse gas emissions reporting guidance (June 2013); and ISO 14064 – part 1.
We continue to use a financial control approach to define our organisational boundary; as a result, we report GHG emissions from all six markets considered as part of the Group’s current financial consolidation: United Kingdom; Republic of Ireland; Switzerland; Iceland; Norway; and Sweden. Accountability for our overall environmental performance rests with our executive management.
Our franchisees’ emissions are excluded from our reporting on the basis that we do not have sufficiently accurate information to report on their impacts. Where data was incomplete (i.e. less than 12 months of data were available) GHG emissions were extrapolated from the available information
and references to the accounting and calculation methodologies for any assumptions, estimations and recalculations performed have been documented.
For more insight into our overall environmental performance, please access the Environment page on our corporate website, https://corporate.dominos.co.uk/Corporate-responsibility.
Objectives for 2018 • To roll out the automated energy
management system at our West Ashland facility.
• To maintain accreditation to ISO 50001.
• To continue to invest in energy-efficient products and services where financially viable.
• To continue our policy of reducing fuel consumption relative to tonnage delivered.
• To continue to focus on electricity reduction associated with lighting, refrigeration and motor replacement.
Corporate social responsibility report continued
Greenhouse gas emissions Our reporting period for GHG emissions is 1 October to 30 September1 and 2016/17 marks our fifth year of GHG emissions reporting. Our material GHG emissions from business activities in this period amount to 11,710 tCO2e, consisting of:
Emissionssource
Tonnes of CO2e 2
(baseline2012/13) 3
Tonnes of CO2e (2015/16)
Tonnes of CO2e (2016/17)
Percentage change (from
baseline)
Scope 1: CO2e from fuel combustion and operation of facilities
Natural gas 769 711 763 (1%)
Kerosene 100 47 116 17%
Refrigerant 189 — 6 (97%)Owned
vehicles 4 6,790 7,279 6,646 (9%)
Scope 2: CO2e from purchase of electricity, heat, steam or cooling by the Company for its own use5
Purchased electricity 6 4,284 4,355 4,179 (2%)
Total 12,132 12,392 11,710 (3%)
1 Our financial reporting year is the calendar year; however, we have set our reporting period back by a quarter to facilitate data collection.
2 We report all material GHG emissions, using “tonnes of CO2-equivalent” (‘tCO2e’) as the unit, to account for all GHG emissions which are attributable to human activity, as defined in section 92 of the Climate Change Act 2008(a).
3 These figures have been adjusted to reflect the acquisition of our Nordic operations.
4 Includes fuel consumed (petrol, diesel and red diesel) by our supply chain delivery fleet, company cars and corporate store delivery fleet.
5 This work is partially based on the country-specific CO2e emission factors developed by the International Energy Agency, © OECD/IEA 2017, but the resulting work has been prepared by Carbon Smart Limited and does not necessarily reflect the views of the International Energy Agency.
6 Our scope 2 emissions calculated using location-based emissions factors are 4,179 tCO2e. In line with WRI best practice, our scope 2 market-based emissions for 2016/17 are 10,184 tCO2e, calculated using UK tariff-specific emission factors and country residual mix factors.
A closer look at the numbersDue to rising customer demand, we experienced a 16% increase in production volumes in 2016/17 and reinstated our Kingston Supply Chain Facility at the start of the year. Work also commenced on a new facility in Warrington, which will likely lead to an increase in UK energy consumption in 2018.
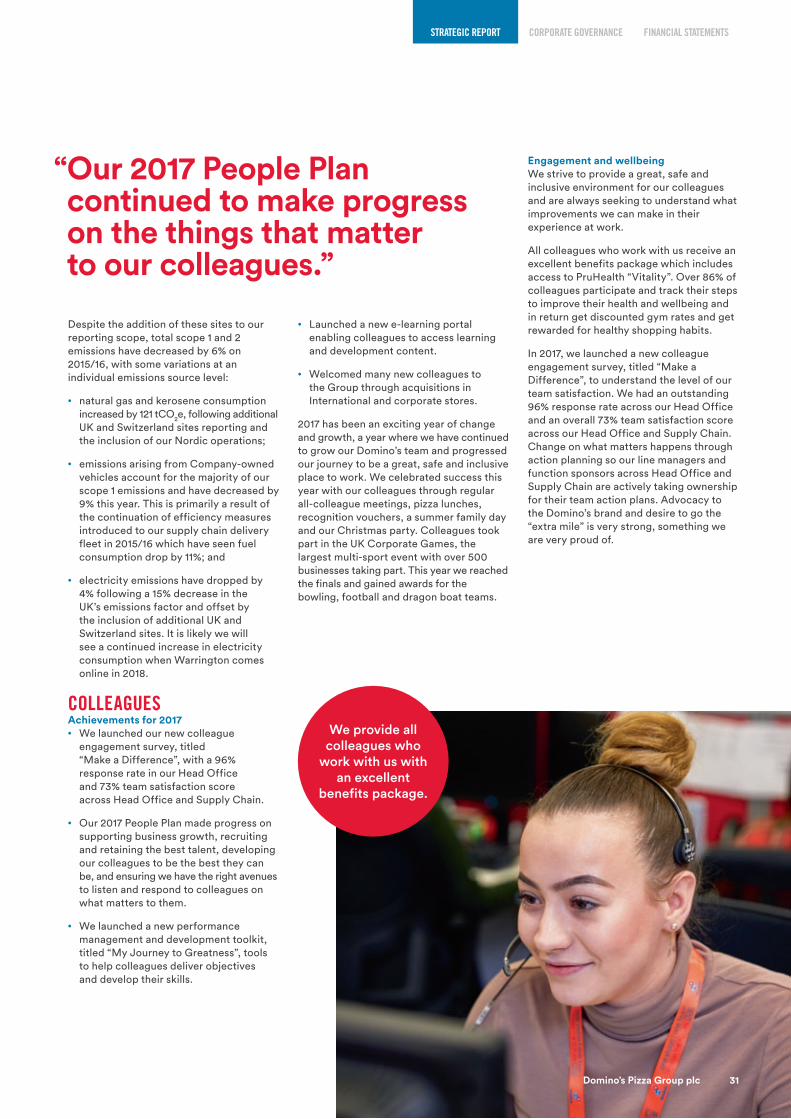
CORPORATE GOVERNANCE FINANCIAL STATEMENTSSTRATEGIC REPORT
31Domino’s Pizza Group plc
Despite the addition of these sites to our reporting scope, total scope 1 and 2 emissions have decreased by 6% on 2015/16, with some variations at an individual emissions source level:
• natural gas and kerosene consumption increased by 121 tCO2e, following additional UK and Switzerland sites reporting and the inclusion of our Nordic operations;
• emissions arising from Company-owned vehicles account for the majority of our scope 1 emissions and have decreased by 9% this year. This is primarily a result of the continuation of efficiency measures introduced to our supply chain delivery fleet in 2015/16 which have seen fuel consumption drop by 11%; and
• electricity emissions have dropped by 4% following a 15% decrease in the UK’s emissions factor and offset by the inclusion of additional UK and Switzerland sites. It is likely we will see a continued increase in electricity consumption when Warrington comes online in 2018.
COLLEAGUESAchievements for 2017
• We launched our new colleague engagement survey, titled “Make a Difference”, with a 96% response rate in our Head Office and 73% team satisfaction score across Head Office and Supply Chain.
• Our 2017 People Plan made progress on supporting business growth, recruiting and retaining the best talent, developing our colleagues to be the best they can be, and ensuring we have the right avenues to listen and respond to colleagues on what matters to them.
• We launched a new performance management and development toolkit, titled “My Journey to Greatness”, tools to help colleagues deliver objectives and develop their skills.
We provide all colleagues who
work with us with an excellent
benefits package.
• Launched a new e-learning portal enabling colleagues to access learning and development content.
• Welcomed many new colleagues to the Group through acquisitions in International and corporate stores.
2017 has been an exciting year of change and growth, a year where we have continued to grow our Domino’s team and progressed our journey to be a great, safe and inclusive place to work. We celebrated success this year with our colleagues through regular all-colleague meetings, pizza lunches, recognition vouchers, a summer family day and our Christmas party. Colleagues took part in the UK Corporate Games, the largest multi-sport event with over 500 businesses taking part. This year we reached the finals and gained awards for the bowling, football and dragon boat teams.
“ Our 2017 People Plan continued to make progress on the things that matter to our colleagues.”
Engagement and wellbeingWe strive to provide a great, safe and inclusive environment for our colleagues and are always seeking to understand what improvements we can make in their experience at work.
All colleagues who work with us receive an excellent benefits package which includes access to PruHealth “Vitality”. Over 86% of colleagues participate and track their steps to improve their health and wellbeing and in return get discounted gym rates and get rewarded for healthy shopping habits.
In 2017, we launched a new colleague engagement survey, titled “Make a Difference”, to understand the level of our team satisfaction. We had an outstanding 96% response rate across our Head Office and an overall 73% team satisfaction score across our Head Office and Supply Chain. Change on what matters happens through action planning so our line managers and function sponsors across Head Office and Supply Chain are actively taking ownership for their team action plans. Advocacy to the Domino’s brand and desire to go the “extra mile” is very strong, something we are very proud of.
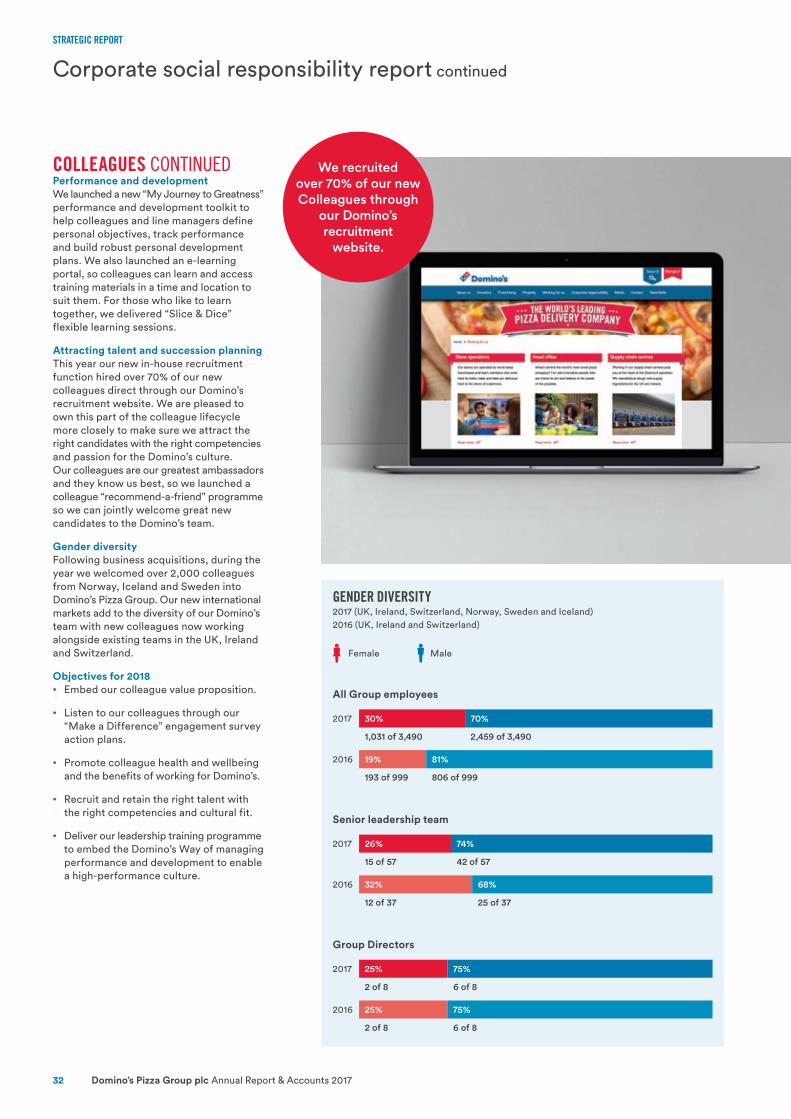
STRATEGIC REPORT
Domino’s Pizza Group plc Annual Report & Accounts 201732
COLLEAGUES CONTINUEDPerformance and developmentWe launched a new “My Journey to Greatness” performance and development toolkit to help colleagues and line managers define personal objectives, track performance and build robust personal development plans. We also launched an e-learning portal, so colleagues can learn and access training materials in a time and location to suit them. For those who like to learn together, we delivered “Slice & Dice” flexible learning sessions.
Attracting talent and succession planningThis year our new in-house recruitment function hired over 70% of our new colleagues direct through our Domino’s recruitment website. We are pleased to own this part of the colleague lifecycle more closely to make sure we attract the right candidates with the right competencies and passion for the Domino’s culture. Our colleagues are our greatest ambassadors and they know us best, so we launched a colleague “recommend-a-friend” programme so we can jointly welcome great new candidates to the Domino’s team.
Gender diversity Following business acquisitions, during the year we welcomed over 2,000 colleagues from Norway, Iceland and Sweden into Domino’s Pizza Group. Our new international markets add to the diversity of our Domino’s team with new colleagues now working alongside existing teams in the UK, Ireland and Switzerland.
Objectives for 2018 • Embed our colleague value proposition.
• Listen to our colleagues through our “Make a Difference” engagement survey action plans.
• Promote colleague health and wellbeing and the benefits of working for Domino’s.
• Recruit and retain the right talent with the right competencies and cultural fit.
• Deliver our leadership training programme to embed the Domino’s Way of managing performance and development to enable a high-performance culture.
Corporate social responsibility report continued
We recruited over 70% of our new Colleagues through
our Domino’s recruitment
website.
GENDER DIVERSITY2017 (UK, Ireland, Switzerland, Norway, Sweden and Iceland)2016 (UK, Ireland and Switzerland)
Female Male
Group Directors
2016
2017
25%
2 of 8
2 of 8
75%
6 of 8
25% 75%
6 of 8
Senior leadership team
2016
2017
32%
12 of 37
15 of 57
68%
25 of 37
26% 74%
42 of 57
All Group employees
2016
2017
19%
193 of 999
1,031 of 3,490
81%
806 of 999
30% 70%
2,459 of 3,490

CORPORATE GOVERNANCE FINANCIAL STATEMENTSSTRATEGIC REPORT
Annual Report & Accounts 2017 Domino’s Pizza Group plc 33
COMMUNITYAchievements in 2017Raised over £1.4m for charity:
• over £1m for Teenage Cancer Trust;
• over €15,600 for Barretstown;
• over £16,500 for the Northern Ireland Children’s Hospice; and
• over £406,000 for Pennies.
PenniesWe have a long-running partnership with the charity Pennies. Its digital charity box has enabled customers using our website and apps to round up their orders to the nearest pound. 2017 was a fantastic year for fundraising and, on behalf of the charities, we would like to pass on a big “thank you” to our customers who have embraced Pennies in their millions.
• On average, 170,000 customers donate via Pennies each month.
• The average weekly donation total was £7,000 in 2017.
• Domino’s customers have raised over £3.25m since 2010. In 2017 alone, they raised over £406,000 through almost 2 million micro-donations.
• Continued to boost fundraising by customers using Pennies in the Republic of Ireland for Barretstown.
We are proud to have been the landmark partner for Pennies and to have seen this trend of online donations grow considerably since it began in 2010.
Pennies receives 7.5% of all donations as a contribution to its charitable objectives and to drive the movement for the benefit of the charitable sector as a whole.
The full 92.5% of donations in Great Britain went to our 2017 beneficiary, Teenage Cancer Trust. In Northern Ireland, the Northern Ireland Children’s Hospice also received the full 92.5%, and in the Republic of Ireland, our newest charity partner Barretstown also began receiving 92.5% of customers’ donations from launch in September 2016.
Teenage Cancer Trust: We are almost at £2m!Teenage Cancer Trust was appointed as our charity partner of choice in England, Scotland and Wales in the summer of 2015, with a goal of raising £1m over a two-year period. To date, we have raised almost £2m, which could fund 44 Teenage Cancer
Trust specialist nurses for a year, who are responsible for leading nursing care of all the young people on a Teenage Cancer Trust unit and beyond.
Throughout 2017, Domino’s team members and franchisees took part in various fundraising challenges and customer-facing activities and provided pizza for “Unit Pizza Nights”.
Right now, for every young person Teenage Cancer Trust reaches, there is another they cannot. To reach every young person who needs them, Teenage Cancer Trust is expanding its team of expert Nurses to work in local hospitals and patients’ homes so that young people can receive the expert treatment they need, no matter where they live. They need to raise £20m a year by 2020 to make this happen, and Domino’s is proud be part of helping them get there.
Our social impact • To date, Domino’s has raised over £1.9m
for Teenage Cancer Trust. In 2017 alone, the fundraising total equated to over 16,000 hours of expert care from a specialist Nurse for a young person with cancer.
• Since our partnership began in 2009, Domino’s has raised over £120,000 for the Northern Ireland Children’s Hospice. The 2017 fundraising total equates to 4,000 nursing hours.
• Since our partnership began in 2004, Domino’s has raised over €265,000 for Barretstown. It costs €3,500 to bring a child to camp for eight days allowing them to take part in Barretstown’s unique Therapeutic Recreation programmes, designed to help them recover from the emotional trauma of serious illness.
Charity Objectives for 2018 • Evolve the charity programme in line
with fresh business priorities.
• Increase overall giving, aided by the recent introduction of Pennies into the Republic of Ireland.
• Continue to galvanise fundraising with our customers, franchisees, store teams and office colleagues.
Teenage Cancer Trust: We are
almost at £2m!

CORPORATE GOVERNANCE
Domino’s Pizza Group plc Annual Report & Accounts 201734
Board of Directors
AppointedStephen joined the Board as Finance Director in 1998, was appointed as Chief Executive in 2001 and as Executive Chairman in 2008 and became non‑executive Chairman in March 2010.
Experience Stephen is a chartered accountant by profession.
Other appointments Stephen is also executive chairman of AIM‑listed Franchise Brands plc and its subsidiary companies.
AppointedColin was appointed to the Board as non‑executive Vice‑Chairman in December 2007, prior to which he held a variety of senior Executive roles within the Group.
Experience Colin acquired the Domino’s Pizza Master Franchise Agreement for the UK and ROI in 1993 through International Franchise Systems Inc. In 1999, with Colin as Chairman, the Company was taken public and listed on AIM and subsequently moved to the Main Market in 2008.
Other appointments Colin is the managing director of HS Real Company LLC and Dayenn Limited and non‑executive director of several other companies.
AppointedDavid was appointed to the Board as a non‑executive Director in November 2013, became Interim Chief Executive Officer in January 2014 and was appointed as Chief Executive Officer on 30 April 2014.
ExperienceDavid was previously chief executive officer of Halfords Group plc and held senior roles within Walmart Stores Inc., Tesco Stores plc and RHM Foods Limited. He was also senior independent director of Premier Foods and a non‑executive director of Practicology Limited and The Bankers Investment Trust.
Other appointments David is senior independent director of Ten Entertainment Group plc.
AppointedRachel was appointed Chief Financial Officer in October 2016.
Experience Rachel is a chartered accountant who joined the Group from Vodafone, where she was CFO for group enterprise. Prior to this she was finance and strategy director for John Lewis and also held senior roles at Sodexo, Kingfisher and PepsiCo.
Other appointments Rachel is currently non‑executive director of HM Courts and Tribunals Service, an agency of the Ministry of Justice.
Stephen HemsleyNon-executive Chairman
Colin HalpernNon-executive Vice-Chairman
David WildChief Executive Officer
Rachel OsborneChief Financial Officer
N
Audit Committee memberA Remuneration Committee memberRNomination Committee memberN Committee Chairman

CORPORATE GOVERNANCE FINANCIAL STATEMENTSSTRATEGIC REPORT
Annual Report & Accounts 2017 Domino’s Pizza Group plc 35
AppointedSteve was appointed to the Board as a non‑executive Director in July 2015.
Experience Steve has almost 30 years’ experience in accountancy, principally with PricewaterhouseCoopers, where he was a senior partner, and also with Ernst & Young. He has also worked in industry, and was formerly the chief operating officer of Whitehead Mann, the finance director of Mirror Group plc and a non‑executive director of Next plc – where he also chaired the audit committee.
Other appointments Steve is a founder of The Objectivity Partnership, a member of the steering group of the Audit Quality Forum and a director of Fenwick Limited.
AppointedKevin was appointed to the Board as a non‑executive Director in September 2014.
Experience Kevin’s career spans more than 20 years in branded consumer foods in both Europe and the United States, and he has previously served as president of Burger King Europe, Middle East and Africa. Prior to his role with Burger King, Kevin served as general manager of Yum! Brands (Pizza Hut, KFC and Taco Bell) Europe and Russia Franchise Business Unit based in Switzerland. Earlier in his career he held executive roles with PepsiCo and Mars.
Other appointments Kevin is non‑executive chairman of Lunch Garden, a Belgian restaurant chain.
AppointedEbbe was appointed to the Board as a non‑executive Director in January 2014.
Experience Ebbe has wide experience of operating in Germany and other European countries, most recently with Delsey. He has been in retail all his working life and has pan‑EU retail knowledge with significant experience in franchising, multi‑site and single brand retail. He pioneered the introduction of US fast food chain Burger King into the Nordic countries in the 1970s and held the position of director and operating partner when the franchise was sold in 1985. Other significant retail experience includes having been CEO of IKEA in Germany, CEO of Delsey and CEO of Habitat.
Other appointments None
AppointedHelen was appointed to the Board in September 2011 and was appointed as the Senior Independent Director on 20 April 2016.
Experience Helen has over 20 years’ experience in travel, retail, consumer markets and telecoms, having held a number of other non‑executive directorships, including most recently at Majestic Wine. The majority of her executive career was spent at GE Capital and Vodafone, where she held various senior marketing roles.
Other appointments Helen is currently a non‑executive director of Communisis plc and Nichols plc and a trustee of the Shakespeare Birthplace Trust.
Steve BarberNon-executive Director
Kevin HigginsNon-executive Director
Ebbe JacobsenNon-executive Director
Helen KeaysNon-executive Director and Senior Independent Director
A A N AR R N R
Audit Committee memberA Remuneration Committee memberRNomination Committee memberN Committee Chairman
CORPORATE GOVERNANCE
Domino’s Pizza Group plc Annual Report & Accounts 201736
The Board is supported in its work by three Committees:
Compliance with the UK Corporate Governance CodeDomino’s Pizza Group plc (‘the Company’) is incorporated and has a premium listing in the UK. As a result, it is required to report on its compliance with the Code or explain why it has chosen not to comply. For the year ended 31 December 2017, it was subject to the edition of the Code published by the Financial Reporting Council in April 2016, which is available from www.frc.org.uk. The Company complied with Code in full throughout the year.
The Code contains 18 main principles, which are expanded on in supporting principles and detailed provisions. Together, these set out the key components of effective Board practice, and we explain in this report how we have applied these during the year. Where appropriate, some explanations are contained in the Nomination Committee report, the Audit Committee report, the Directors’ remuneration report and the Directors’ report.
Within the delegation framework described above, the Board retains certain key decision‑making responsibilities:
• setting and approving overall Group strategy;
• setting a risk appetite, within which management is required to operate;
• reviewing and approving business plans and budgets;
• reviewing and approving major business decisions;
• reviewing major risks and the implementation of mitigation strategies;
• reviewing the functioning of the internal control environment;
• monitoring operational and trading results against previously approved plans;
• reviewing and approving significant contractual and other commitments, including capital expenditure;
• reviewing corporate governance arrangements;
• reviewing succession plans for the Board and Executive Directors; and
• exercising its control by an annual review of “matters reserved” for the Board’s decision.
As noted above, the Board is responsible for determining the nature and extent of the principal risks it is willing to take in achieving its strategic objectives. It also retains oversight of the risk management and internal control systems with the aim that these are sound and protect shareholders’ interests.
Corporate governance
CHAIRMAN’S INTRODUCTIONI am pleased to introduce the review of corporate governance for 2017.
Effective corporate governance arrangements are critical in ensuring that the Board is able to:
• direct and control the Group;
• provide strategic leadership and effective oversight; and
• maintain a framework within which the Executive leadership team can conduct its day‑to‑day operational management of the business.
We are committed to maintaining a governance framework that is appropriate to the business and supports effective decision making coupled with robust oversight of risks and internal controls.
The Board works with Executive management to define and refine the Group’s values and to promote behaviours which contribute to a culture focused on the long‑term success of the business.
Our aim is to maintain a sustainable business model which creates value for shareholders and benefits the Group’s wider stakeholders.
The Board receives regular updates on emerging trends in corporate governance best practice and welcomes the FRC’s current review of the UK Corporate Governance Code (“the Code”). During 2018 we will be reviewing our existing governance framework in light of the revisions to the Code once it is published.
The following report sets out the how the Board has applied the principles of good governance during the year.
Stephen HemsleyNon-executive Chairman7 March 2018
THE BOARD
NOMINATION COMMITTEE
REMUNERATION COMMITTEEAUDIT COMMITTEE
Terms of reference for these Committees, which are regularly reviewed by the Board, are available on the Company’s investor relations website (http://investors.dominos.co.uk) as is the formal schedule of matters reserved for the Board’s decision.
Audit Committee reportpage 43
Nomination Committee reportpage 42
Directors’ remuneration reportpage 46

CORPORATE GOVERNANCE FINANCIAL STATEMENTSSTRATEGIC REPORT
Annual Report & Accounts 2017 Domino’s Pizza Group plc 37
Leadership – our governance frameworkThe Company is led by the Board, whose members are collectively responsible for the long‑term success of the Company. Day‑to‑day management of the business is delegated to management, led by the Chief Executive Officer. The role of the Board can be summarised as follows:
Decide on the longer-term aims • Agree the Company’s business model.
• Agree an appetite for risk.
• Set values and standards for the Company.
• Provide entrepreneurial leadership.
• Appoint the Executive Directors.
Decide on the short-term goals • Review and approve strategy, providing
constructive challenge as necessary.
• Ensure the necessary financial and human resources are in place.
• Agree business plans and budgets.
• Review the risk management process and internal control environment.
Monitor and manage performance • Monitor management’s performance
in delivering the strategy, and challenge or support as necessary.
• Approve major expenditure and other commitments.
• Monitor the risk environment in which the Company operates and review internal controls.
• Determine the remuneration of Executive Directors and senior management.
• Oversee the governance of the Company and Group to ensure shareholders’ interests are protected.
Report to, and engage with, shareholders • Monitor the integrity of financial
information and the reporting of performance generally.
• Report to shareholders on business performance.
• Ensure other external obligations are met, including reporting to other stakeholders.
• Understand shareholders’ views and act as necessary.
Audit CommitteeThe Audit Committee assists the Board in discharging its responsibilities for the integrity of the financial statements, reviewing the internal control environment and risk management systems, managing the relationship with the external auditor and monitoring the effectiveness and objectivity of the external and internal auditors.
Nomination CommitteeThe Nomination Committee oversees the recruitment of the Directors and advises on matters relating to the Board’s membership and Committee appointments, including reviewing succession plans. The Nomination Committee also regularly reviews and monitors the overall skills and experience of the Board.
Remuneration CommitteeThe Remuneration Committee determines the terms and conditions of employment, remuneration and rewards of the Executive Directors, the Chairman and the leadership teams. The Remuneration Committee aims to offer an appropriate balance of fixed and performance‑related, immediate and deferred remuneration, but without overpaying or creating the risk of rewards for failure.
Board compositionThe Board’s preferred structure is to be led by a non‑executive Chairman, to have high calibre Executive Directors to drive the performance of the business under the leadership of a Chief Executive Officer, and to have a number of non‑executive Directors drawn from a range of backgrounds, whose role is to provide constructive challenge. Our aim is that the independent non‑executive Directors always constitute at least half of the Board. This structure and the integrity of the individual Directors should ensure that no single individual or group dominates the decision‑making process. There is a common purpose of promoting the overall success of the Group with a unified vision of the definition of success, the core strategic principles, and the understanding, alignment and mitigation of risk.
Non‑executive Directors are appointed for three‑year terms (subject to annual re‑election by shareholders) and the offer of any further term of appointment after year six would be weighed carefully by the Nomination Committee, which keeps the need for progressive refreshing of the Board (particularly to maintain an appropriate balance of skills and experience) and orderly succession to key appointments under continual review.
IndependenceThe Board reviews the independence of its non‑executive Directors annually. In assessing the independence of each Director, the Board considers whether each is independent in character and judgement and whether there are relationships or circumstances which are likely to affect, or could appear to affect, the Director’s judgement.
Board roles and responsibilitiesThere is a clear separation between the roles of the Chairman and the Chief Executive Officer, which is recorded in a document approved by the Board in September 2015 and summarised below. In essence, the Chairman manages the Board and the Chief Executive Officer manages the business. Importantly, no one individual has unfettered powers of decision.
The Chairman meets with the Chief Executive Officer at least once a month, including visits to pizza stores, and they are in contact between these occasions as required. The Chairman also has separate discussions with the non‑executive Directors.
ChairmanThe role of the Chairman is:
• providing leadership to and ensuring the effectiveness of the Board;
• ensuring that agendas emphasise strategic, rather than routine, issues and that the Directors receive accurate and clear information well ahead of the time when a decision is required;
• promoting a culture of openness and constructive debate, and facilitating an effective contribution by the non‑executive Directors;
• arranging informal meetings of the Directors, including meetings of the non‑executive Directors;
• ensuring effective communication by the Group with its shareholders;
• arranging for the Chairs of the Committees to be available to answer questions at the AGM and for all Directors to attend; and
• taking the lead in providing a properly constructed, full, formal and tailored induction programme and ongoing development for new Directors.

CORPORATE GOVERNANCE
Domino’s Pizza Group plc Annual Report & Accounts 201738
Board compositionThe eight continuing members of the Board on 31 December 2017 were drawn from a range of backgrounds and gained their experience in a range of relevant industry sectors:
Leadership – our governance framework continuedBoard roles and responsibilities continuedChief Executive OfficerThe role of the Chief Executive Officer is:
• leading the development of the Group’s strategic direction and objectives;
• identifying and executing acquisitions and disposals and leading geographic diversification initiatives;
• reviewing the Group’s organisational structure and recommending changes as appropriate;
• identifying and executing new business opportunities;
• overseeing risk management and internal control;
• managing the Group’s risk profile, including the health and safety performance of the Group;
• implementing the decisions of the Board and its Committees;
• building and maintaining an effective Group leadership team; and
• ensuring the Chairman and the Board are alerted to forthcoming complex, contentious or sensitive issues affecting the Group.
Senior Independent Director (SID)The SID focuses on:
• meeting regularly with the independent non‑executive Directors;
• providing a sounding board for the Chairman and acting as an intermediary for other Directors;
• being available to shareholders if they have concerns which contact through the normal channels of Chairman or Chief Executive Officer has failed to address or would be inappropriate; and
• holding annual meetings with non‑executive Directors without the Chairman present.
Non-executive DirectorThe role of a non‑executive Director is:
• providing creative contribution to the Board by way of constructive criticism;
• bringing independence, impartiality, experience, specialist knowledge and a different perspective to the Board;
• providing guidance on matters of concern and strategy;
• overseeing risk management and internal control;
• protecting shareholder and stakeholder interests;
• constructively challenging the Executive Directors and monitoring Executive performance;
• supporting the Executive team in shaping and delivering the strategic goals of the business;
• optimising shareholder return and protection of shareholder assets; and
• ensuring the Board is able to work together effectively and make maximum use of its time.
DiversityThe Board’s policy on diversity is explained in the Nomination Committee report on page 42.
Leadership in actionThis section of the corporate governance report explains how the Board has fulfilled its duties and obligations during the year under review.
Board membership The Board currently comprises the non‑executive Chairman, the Chief Executive Officer, the Chief Financial Officer, a non‑executive Vice‑Chairman and four independent non‑executive Directors, one of whom acts as the Senior Independent Director. The names and biographical details of the serving Directors, and the offices held by them, can be found on pages 34 and 35.
We believe that the Board is of sufficient size that the requirements of the business and good governance can be met and normal succession challenges managed, but is not so large as to be unwieldy.
Corporate governance continued
CONSUMER RETAIL 4 FOOD RETAIL 3 PROFESSIONAL
SERVICES 1
PRIMARY EXPERIENCE
MALE 6 FEMALE 2
GENDER BALANCE
ACCOUNTING 3 RETAIL MANAGEMENT 4 MARKETING 1
PROFESSIONAL SKILLS
Steve Barber
3
Kevin Higgins
4
Ebbe Jacobsen
4
Helen Keays
6
Stephen Hemsley1
8
Colin Halpern2
10
The current non‑executive Directors’ tenure reflects our approach of progressively refreshing the Board.
CURRENT YEAR OF NON-EXECUTIVE TENURE, AT 31 DECEMBER 2017
1 Stephen Hemsley was appointed as non‑executive Chairman in March 2010. However, he was first appointed to an Executive Director role in 1998 and as a Director of the Company on incorporation in 1999. Full details of Stephen’s history with the Company can be found in the Directors’ biographies on page 34.
2 Colin Halpern acquired the Domino’s Pizza Master Franchise for the UK and Ireland in 1993 and has held a variety of senior Executive roles within the Group. He became a non‑executive Director in December 2007. Full details of Colin’s history with the Company can be found in the Directors’ biographies on page 34.
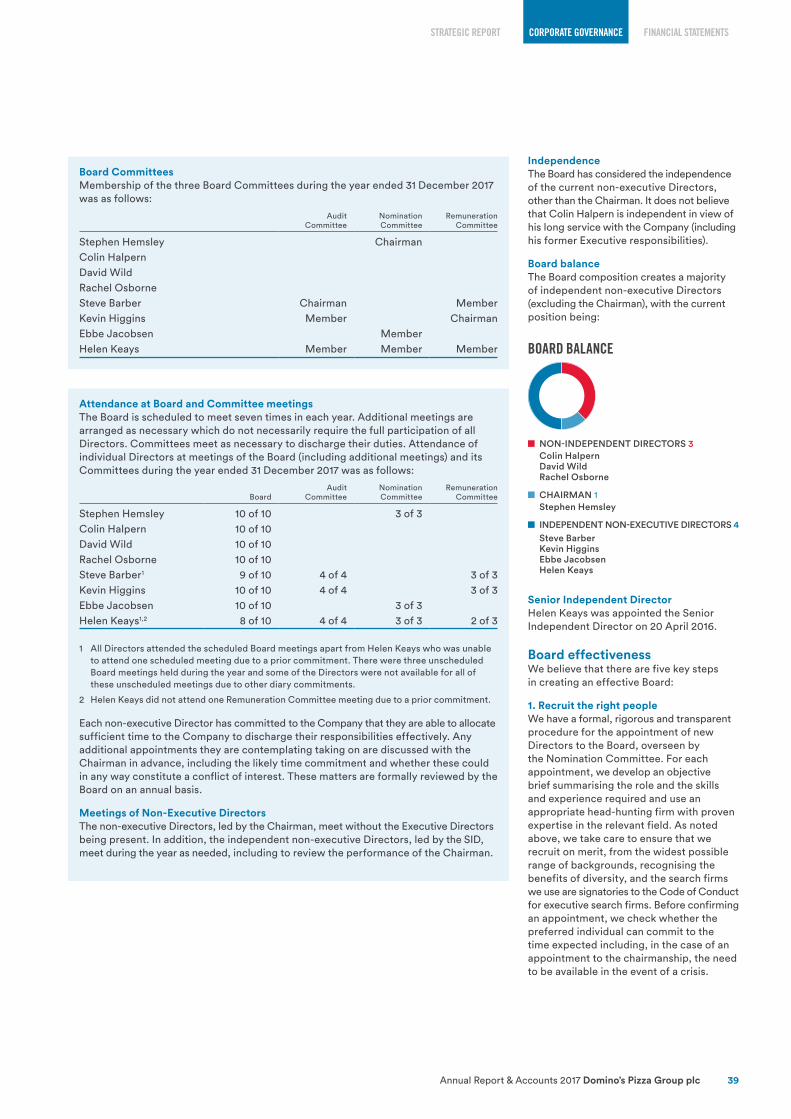
CORPORATE GOVERNANCE FINANCIAL STATEMENTSSTRATEGIC REPORT
Annual Report & Accounts 2017 Domino’s Pizza Group plc 39
BOARD BALANCE
NON-INDEPENDENT DIRECTORS 3 Colin Halpern David Wild Rachel Osborne
CHAIRMAN 1 Stephen Hemsley
INDEPENDENT NON-EXECUTIVE DIRECTORS 4 Steve Barber Kevin Higgins Ebbe Jacobsen Helen Keays
IndependenceThe Board has considered the independence of the current non‑executive Directors, other than the Chairman. It does not believe that Colin Halpern is independent in view of his long service with the Company (including his former Executive responsibilities).
Board balanceThe Board composition creates a majority of independent non‑executive Directors (excluding the Chairman), with the current position being:
Senior Independent DirectorHelen Keays was appointed the Senior Independent Director on 20 April 2016.
Board effectivenessWe believe that there are five key steps in creating an effective Board:
1. Recruit the right peopleWe have a formal, rigorous and transparent procedure for the appointment of new Directors to the Board, overseen by the Nomination Committee. For each appointment, we develop an objective brief summarising the role and the skills and experience required and use an appropriate head‑hunting firm with proven expertise in the relevant field. As noted above, we take care to ensure that we recruit on merit, from the widest possible range of backgrounds, recognising the benefits of diversity, and the search firms we use are signatories to the Code of Conduct for executive search firms. Before confirming an appointment, we check whether the preferred individual can commit to the time expected including, in the case of an appointment to the chairmanship, the need to be available in the event of a crisis.
Board CommitteesMembership of the three Board Committees during the year ended 31 December 2017 was as follows:
AuditCommittee
NominationCommittee
RemunerationCommittee
Stephen Hemsley ChairmanColin HalpernDavid WildRachel OsborneSteve Barber Chairman Member Kevin Higgins Member ChairmanEbbe Jacobsen Member Helen Keays Member Member Member
Attendance at Board and Committee meetingsThe Board is scheduled to meet seven times in each year. Additional meetings are arranged as necessary which do not necessarily require the full participation of all Directors. Committees meet as necessary to discharge their duties. Attendance of individual Directors at meetings of the Board (including additional meetings) and its Committees during the year ended 31 December 2017 was as follows:
BoardAudit
CommitteeNominationCommittee
RemunerationCommittee
Stephen Hemsley 10 of 10 3 of 3Colin Halpern 10 of 10David Wild 10 of 10Rachel Osborne 10 of 10Steve Barber1 9 of 10 4 of 4 3 of 3Kevin Higgins 10 of 10 4 of 4 3 of 3Ebbe Jacobsen 10 of 10 3 of 3Helen Keays1,2 8 of 10 4 of 4 3 of 3 2 of 3
1 All Directors attended the scheduled Board meetings apart from Helen Keays who was unable to attend one scheduled meeting due to a prior commitment. There were three unscheduled Board meetings held during the year and some of the Directors were not available for all of these unscheduled meetings due to other diary commitments.
2 Helen Keays did not attend one Remuneration Committee meeting due to a prior commitment.
Each non‑executive Director has committed to the Company that they are able to allocate sufficient time to the Company to discharge their responsibilities effectively. Any additional appointments they are contemplating taking on are discussed with the Chairman in advance, including the likely time commitment and whether these could in any way constitute a conflict of interest. These matters are formally reviewed by the Board on an annual basis.
Meetings of Non-Executive DirectorsThe non‑executive Directors, led by the Chairman, meet without the Executive Directors being present. In addition, the independent non‑executive Directors, led by the SID, meet during the year as needed, including to review the performance of the Chairman.
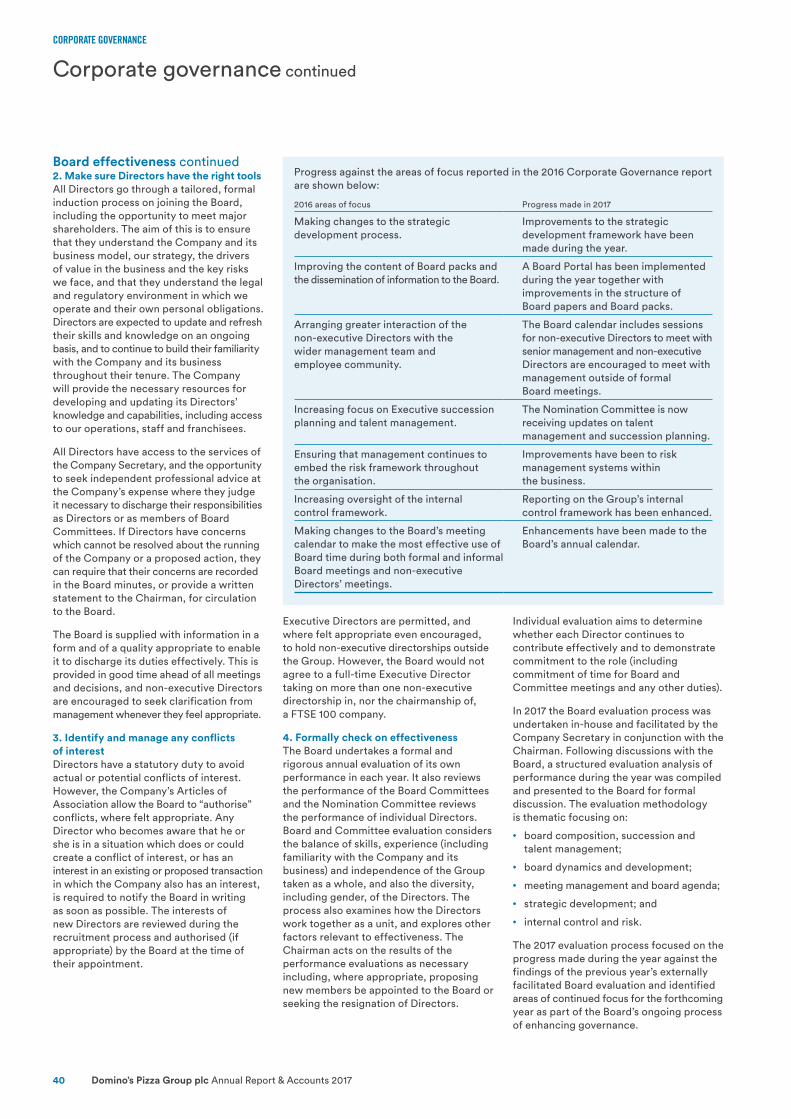
CORPORATE GOVERNANCE
Domino’s Pizza Group plc Annual Report & Accounts 201740
Board effectiveness continued2. Make sure Directors have the right toolsAll Directors go through a tailored, formal induction process on joining the Board, including the opportunity to meet major shareholders. The aim of this is to ensure that they understand the Company and its business model, our strategy, the drivers of value in the business and the key risks we face, and that they understand the legal and regulatory environment in which we operate and their own personal obligations. Directors are expected to update and refresh their skills and knowledge on an ongoing basis, and to continue to build their familiarity with the Company and its business throughout their tenure. The Company will provide the necessary resources for developing and updating its Directors’ knowledge and capabilities, including access to our operations, staff and franchisees.
All Directors have access to the services of the Company Secretary, and the opportunity to seek independent professional advice at the Company’s expense where they judge it necessary to discharge their responsibilities as Directors or as members of Board Committees. If Directors have concerns which cannot be resolved about the running of the Company or a proposed action, they can require that their concerns are recorded in the Board minutes, or provide a written statement to the Chairman, for circulation to the Board.
The Board is supplied with information in a form and of a quality appropriate to enable it to discharge its duties effectively. This is provided in good time ahead of all meetings and decisions, and non‑executive Directors are encouraged to seek clarification from management whenever they feel appropriate.
3. Identify and manage any conflicts of interestDirectors have a statutory duty to avoid actual or potential conflicts of interest. However, the Company’s Articles of Association allow the Board to “authorise” conflicts, where felt appropriate. Any Director who becomes aware that he or she is in a situation which does or could create a conflict of interest, or has an interest in an existing or proposed transaction in which the Company also has an interest, is required to notify the Board in writing as soon as possible. The interests of new Directors are reviewed during the recruitment process and authorised (if appropriate) by the Board at the time of their appointment.
Executive Directors are permitted, and where felt appropriate even encouraged, to hold non‑executive directorships outside the Group. However, the Board would not agree to a full‑time Executive Director taking on more than one non‑executive directorship in, nor the chairmanship of, a FTSE 100 company.
4. Formally check on effectivenessThe Board undertakes a formal and rigorous annual evaluation of its own performance in each year. It also reviews the performance of the Board Committees and the Nomination Committee reviews the performance of individual Directors. Board and Committee evaluation considers the balance of skills, experience (including familiarity with the Company and its business) and independence of the Group taken as a whole, and also the diversity, including gender, of the Directors. The process also examines how the Directors work together as a unit, and explores other factors relevant to effectiveness. The Chairman acts on the results of the performance evaluations as necessary including, where appropriate, proposing new members be appointed to the Board or seeking the resignation of Directors.
Individual evaluation aims to determine whether each Director continues to contribute effectively and to demonstrate commitment to the role (including commitment of time for Board and Committee meetings and any other duties).
In 2017 the Board evaluation process was undertaken in‑house and facilitated by the Company Secretary in conjunction with the Chairman. Following discussions with the Board, a structured evaluation analysis of performance during the year was compiled and presented to the Board for formal discussion. The evaluation methodology is thematic focusing on:
• board composition, succession and talent management;
• board dynamics and development;
• meeting management and board agenda;
• strategic development; and
• internal control and risk.
The 2017 evaluation process focused on the progress made during the year against the findings of the previous year’s externally facilitated Board evaluation and identified areas of continued focus for the forthcoming year as part of the Board’s ongoing process of enhancing governance.
Corporate governance continued
Progress against the areas of focus reported in the 2016 Corporate Governance report are shown below:
2016 areas of focus Progress made in 2017
Making changes to the strategic development process.
Improvements to the strategic development framework have been made during the year.
Improving the content of Board packs and the dissemination of information to the Board.
A Board Portal has been implemented during the year together with improvements in the structure of Board papers and Board packs.
Arranging greater interaction of the non‑executive Directors with the wider management team and employee community.
The Board calendar includes sessions for non‑executive Directors to meet with senior management and non‑executive Directors are encouraged to meet with management outside of formal Board meetings.
Increasing focus on Executive succession planning and talent management.
The Nomination Committee is now receiving updates on talent management and succession planning.
Ensuring that management continues to embed the risk framework throughout the organisation.
Improvements have been to risk management systems within the business.
Increasing oversight of the internal control framework.
Reporting on the Group’s internal control framework has been enhanced.
Making changes to the Board’s meeting calendar to make the most effective use of Board time during both formal and informal Board meetings and non‑executive Directors’ meetings.
Enhancements have been made to the Board’s annual calendar.

CORPORATE GOVERNANCE FINANCIAL STATEMENTSSTRATEGIC REPORT
Annual Report & Accounts 2017 Domino’s Pizza Group plc 41
The Chairman reviewed the performance of the individual Directors, and the Senior Independent Director undertook a review of the Chairman’s performance, providing feedback to him.
The agreed principal areas of activity for 2018 include:
• further progress on the Group’s succession planning systems for the Board and management;
• increased focus on the corporate culture; and
• ensuring that recent progress in improving risk management and internal controls is maintained.
5. Ask shareholders to confirm appointmentsUltimately, the Directors’ main responsibility is to promote the long‑term success of the Company, acting in shareholders’ best interests. All of our Directors submit themselves for re‑election at each AGM and we provide shareholders with sufficient information in the meeting papers for them to decide whether their commitment and performance warrant a further year in office. At the 2017 AGM, each serving Director was re‑elected, with votes in favour exceeding 97% of those cast in all cases.
Accountability to shareholdersThe Board has established formal and transparent arrangements for considering how they apply the principles of sound corporate reporting, risk management and internal control and how the Company and Board maintain an appropriate relationship with the Company’s auditor. These responsibilities are overseen by the Audit Committee and are explained in its report from page 43 onwards.
The Board considers that the 2017 Annual Report & Accounts, taken as a whole, is fair, balanced and understandable and provides the information necessary for shareholders to assess the Company’s position and performance, business model and strategy. Details of how we do this are also explained in the Audit Committee’s report.
RemunerationThere are formal and transparent procedures for developing policy on Executive remuneration and for fixing the remuneration packages of individual Directors, which are overseen by the Remuneration Committee and are explained in its report from page 46 onwards. This report explains how Executive Directors’ remuneration is designed to promote the long‑term success of the Company and shows how the performance‑related elements are transparent, stretching and rigorously applied.
Relations with shareholdersWe maintain an active dialogue with our shareholders and potential investors, which we intend to be based on a mutual understanding of objectives. The CEO and CFO routinely engage with analysts, institutional and retail shareholders and potential investors, through results presentations, roadshows and one‑off meetings. The Chairman and Senior Independent Director are available for meetings with shareholders on request.
In years in which there is a significant change to the Executive remuneration policy or there is a binding vote on remuneration at the AGM, the Chairman, the Chair of the Remuneration Committee and the Company Secretary meet with major shareholders to discuss remuneration and any other governance issues.
Our aim is to ensure we build and maintain strong relationships, and that we communicate our strategy and performance against it in a clear and consistent way. In turn, we seek to understand the views of our investors through regular dialogue, and feedback is provided to the Board as a whole to give an additional context for strategic decision making and capital allocation.
The regular CFO report to the Board includes a detailed update on all investor relations matters, including movements in the share register, recent meetings with investors, summaries of analysts’ reports and key discussion topics. In addition, our brokers are invited to provide an independent view on matters of strategic importance such as potential acquisitions and share buybacks.
2017 IR activityOver the last 18 months we have increased our commitment to our investor relations programme in a number of ways:
• In November 2016 we hosted a Capital Markets Day. In addition to presentations from the CEO and CFO, investors and analysts had the opportunity to hear other members of the leadership team present in detail about growth opportunities, property, technology and other key topics.
• Early in 2017 we appointed a dedicated Head of IR for the first time, whose responsibility is to develop a broad shareholder communications strategy while ensuring a responsive, fair and transparent service to all investors and analysts.
• We spent more time on results roadshows and at investor conferences than in previous years, including over 20 days seeing investors in the UK, ten days in the US and four days at conferences.
• In addition to our results presentations for the full year and interim results, we also hosted conference calls for our Q3 trading update in October 2017 and the acquisition of an increased stake in Domino’s Iceland in December 2017.
One of the outcomes of this increased activity is that we have seen a significant change in our shareholder base. At the end of 2017, around 56% of our shares were owned by investors based in North America – up from around 43% at the start of the year.
Key discussion topics in 2017The key topics discussed with shareholders during 2017 included:
• the competitive environment in the United Kingdom, particularly with respect to the rising popularity of online aggregators;
• franchisee profitability and the outlook for new store openings;
• the broader UK consumer environment and the value perception of Domino’s pizza;
• our investments in our own stores and in supply chain capacity;
• international growth prospects; and
• our target leverage ratio and the potential for returns of excess capital to shareholders.
The AGMThe AGM is treated as an opportunity to communicate with all of our shareholders, and their participation is encouraged. The Chairs of all Board Committees attend the AGM and are available to answer questions. An explanatory circular containing the notice of meeting is sent to shareholders at least 20 working days beforehand, with separate votes being offered on each substantive issue. All proxy votes received are counted with the balance for and against and any votes withheld announced at the meeting and published on the Company’s investor relations website after the meeting. This website, http://investors.dominos.co.uk, also contains a host of up‑to‑date information on the Group.

CORPORATE GOVERNANCE
Domino’s Pizza Group plc Annual Report & Accounts 201742
Chairman’s overviewThe principal purpose of the Nomination Committee is to ensure that the Company has the right leadership, both on the Board and in the ranks of senior management. This is a combination of continual review and monitoring of, and also responding to, specific situations as needed.
The Company Secretary attends meetings in his capacity as Secretary of the Nomination Committee and the Chief Executive Officer is expected to attend whenever necessary.
The majority of members of the Nomination Committee are independent non‑executive Directors. While the Chairman of the Board chairs the Nomination Committee in normal circumstances, he would abstain in matters relating to the appointment of a successor to the chairmanship.
The number of meetings held in the year and attendance at those meetings is shown on page 39.
Activities in 2017During the year the Committee met to consider the following key matters:
• the review of the performance of all the non‑executive Directors seeking re‑election at the 2017 AGM;
• to consider and make recommendations to the Board with regards to extending the appointments of Ebbe Jacobsen, Helen Keays and Kevin Higgins for further terms of three years each;
• to consider and make a recommendation to the Board on a diversity policy applicable to Board‑level appointments; and
• receiving reports from management on talent management and succession planning.
PurposeThe Nomination Committee has four principal duties:
• to ensure that plans are in place for orderly succession for appointments to the Board and to senior management, so as to maintain an appropriate balance of skills and experience within the Company and on the Board and to ensure progressive refreshing of the Board;
• to lead the process for Board and Committee appointments and make recommendations to the Board;
• where external recruitment is required, to evaluate the balance of skills, experience, independence and knowledge on the Board and, in light of this evaluation, prepare a description of the role and capabilities required for a particular appointment. The Nomination Committee would then oversee the selection process with the aim of ensuring that this results in an appointment made on merit, against objective criteria and with due regard for the benefits of diversity on the Board, including gender; and
• to undertake formal performance evaluation of non‑executive Directors who are standing for re‑election and to ascertain whether the individual’s performance continues to be effective and they demonstrate sufficient commitment to the role.
The terms of reference of the Nomination Committee were updated in February 2017 and reviewed by the Committee during the year. These terms of reference are available on the Company’s investor relations website.
Policy on diversityThe Board recognises the importance of having Directors with the appropriate balance of skills, experience, independence and knowledge of the Company to enable them to discharge their respective duties and responsibilities effectively. They play a key governance role in protecting shareholders’ interests by ensuring that the Board and management are challenged, constructively and effectively, and it is important that they do so from a range of perspectives.
An important factor in achieving this effectiveness is drawing members from a range of backgrounds, which has been shown to help avoid “group think”. We are proud of the diversity in our business and we recruit and develop people regardless of their gender, race or any other characteristic. We are of the view that it is in the interests of the Company to recruit and develop the very best people, drawn from the widest pool of talent. The policy of the Board on recruitment is always to seek to appoint the best candidate to each role. 25% of our Board positions are held by women and we aim to maintain at least this level of female participation on the Board. Details of the Group‑wide diversity data are shown on page 32.
Stephen HemsleyChairman of the Nomination Committee7 March 2018
Nomination Committee report
CHAIRStephen Hemsley
Ebbe Jacobsen
MEMBERS
Helen Keays

CORPORATE GOVERNANCE FINANCIAL STATEMENTSSTRATEGIC REPORT
Annual Report & Accounts 2017 Domino’s Pizza Group plc 43
Audit Committee report
Steve Barber is a chartered accountant with considerable experience and the Board has determined he has recent and relevant financial experience which qualifies him to chair the Audit Committee. Both Kevin Higgins and Helen Keays have considerable business experience which enables them to make a positive contribution to the Audit Committee. The Board is satisfied that, as a whole, the Committee has competence relevant to the sector in which it operates.
Meetings of the Audit Committee have been attended by the Chairman of the Board, the Chief Executive Officer, the Chief Financial Officer, the external auditor, the Company Secretary (as Secretary to the Audit Committee) and other Directors and members of management by invitation. The number of meetings held in the year and attendance at those meetings is shown on page 39.
The Audit Committee has direct access to members of management and the external auditor. It is able to seek further professional advice at the Company’s cost if deemed necessary.
Significant accounting issuesThe Audit Committee’s reviews of the half and full year financial statements focused on the following areas of significance:
• the recognition and amount of a potential liability in respect of employee share schemes – as explained in last year’s report, no provision had previously been made in respect of any potential liability in respect of certain share based compensation arrangements. This was based upon advice received from the group’s tax advisors. As more fully explained in note 2 to the financial statements, the board received updated legal advice during the year which has guided the board to make a provision of £11.0m in respect of these share schemes. The committee and management met with the legal advisors and the external auditors and were satisfied that the provision represents the current best estimate and considered the related disclosures appropriate. No benefit has been assumed in respect of the indemnities from the beneficiaries of these schemes in view of the uncertainty of recovery and the potentially protracted period over which any claims may be settled.
• the accounting for and valuation of the put options granted to third party shareholders in the Group’s investments in Iceland, Norway, Sweden and London corporate stores – the Group has recognised liabilities of £40.3m in respect of these options, representing the estimated present value of the expected cash consideration to be paid upon exercise. The Committee reviewed the assumptions underlying the calculations and consider the provisions to be appropriate.
• the valuation of the Market Access Fee receivable from the majority owner of the group’s German associate together with the accounting treatment for conversion costs by the German associate – in 2016 the Committee received a third‑party valuation of the market access fee and management’s assessment of the quantum and treatment of the conversion costs; see note 29 for more details. The Committee received an updated assessment of the fair value of the Market Access Fee and the treatment of residual conversion costs from management as at the period end, The Committee continues to consider the underlying assumptions in both the valuation and the treatment of conversion costs to be reasonable, supported by the performance of the German business.
• the acquisition of controlling interests in Iceland, Norway and Sweden – the accounting for these business combinations achieved in stages was complex and required consideration of when control was secured by the Group and the valuation of the consideration paid and assets and liabilities acquired. The Committee received reports from management outlining the key accounting assumptions which were reviewed and approved.
• the carrying value of goodwill and other intangible assets – with a net book value of £114.2m, following the significant increase in the year arising from acquisitions, goodwill and intangible assets now make up the most significant proportion of the Group’s assets. The Committee reviewed projections for the relevant businesses and was satisfied that no impairments were considered necessary.
• the classification of non-underlying items – totalling £15.0m net before tax, these represent significant non‑trading items and have been shown as non‑underlying. The Committee reviewed these costs and agreed the appropriateness of their classification in order to present a comparable and continuing basis of measurement of underlying earnings.
CHAIRSteve Barber
Kevin Higgins
MEMBERS
Helen Keays

CORPORATE GOVERNANCE
Domino’s Pizza Group plc Annual Report & Accounts 201744
not expected to have a significant impact on the Group’s revenues. The majority of the Group’s statutory revenues are derived from sales to and fees from franchisees and the new standard is not expected to impact the recording of these. The Group has determined that the new standard does not impact the treatment of the National Advertising Fund.
IFRS 9, the new financial instruments standard will be effective for the year ending in December 2018. Initial estimates are that the overall impact is not expected to be material.
Presentations from management and professional advisersThe Audit Committee received a number of presentations from management and professional advisers, including:
• IT and cyber security – the Group’s system sales are highly dependent on its e‑commerce IT systems, particularly apps for mobile devices. There can be no guarantee as to the resilience of the Group’s systems to outside attack and the Committee commissioned a report on cyber security from Deloitte which identified a number of areas requiring attention. These are being addressed and the Committee receives regular updates from management on progress.
• risks and controls – in view of the Group’s rapid growth over the past few years, it does not have a formalised internal audit function. The Group’s internal control environment has until recently been informal and often undocumented. The implementation of the Group’s new Enterprise Resource Planning system (‘ERP’) during the past two years has required a wholesale change in processes and controls. The Group continues to develop and formalise its internal control environment which is expected to be consistent with the COSO Internal Controls Framework. The Committee received presentations regarding improvements to controls and whistleblowing as well as approving a revision of the Group’s treasury management policy. Documentation and processes to support the Board’s assessment of principal risks have been in place throughout the year and a
project was initiated in the year to improve the Group’s operational risk management processes. Work continues to embed further controls and risk management processes into the Group’s operations and this will be a major focus during 2018;
• enterprise resource planning system – a new ERP system went live in September 2016 and has been built upon during 2017. The new system is designed to assist in delivering operational efficiency gains, improve controls and accommodate the continued growth of the business. Throughout the year, the Committee has received updates on progress with the implementation of the system. Management continue to evaluate the operation of the new system and modify the processes and controls based on experience gained from operating the systems.
• taxation – the Committee received a report from FTI, the Group’s tax advisors, providing a summary of the Group’s tax strategy and tax attributes, and approved, the Group’s tax strategy statement. A copy of this can be found on the Group’s website.
BrexitAs we reported last year, the impact of the UK’s vote to leave the European Union is difficult to quantify. Raw materials purchased by the Group are affected by changes in commodity prices and exchange rate fluctuations. We have experienced some increases in raw material prices as a result of the weakening in the value of sterling against the Euro since the UK’s Brexit vote but it is not possible to estimate the impact this may have on consumer demand.
Internal auditAs noted above, the Group does not have a formal internal audit department. The Committee has previously concluded that the most appropriate model for internal audit would be to engage a third‑party provider and it was agreed that such a review would be deferred until the conclusion of the tender of the external audit; our aim is to appoint an outsourced internal audit provider in 2018. The Group’s operational auditors continue to regularly audit franchisees to support compliance with franchise agreements and brand standards.
Significant accounting issues continued
• the impact of post year-end events on the group’s balance sheet – two significant transactions with a combined cash outflow of £37.6m were completed in January 2018 and an irrevocable share buyback of up to £20.0m was entered into prior to the year‑end but only completed in February 2018. The impact of these transactions, which have increased the group’s net debt to over £150m since the year end, are described in the Post Balance Sheet Events note to the financial statements and in the report of the Chief Financial Officer. The committee reviewed the Viability Statement in conjunction with these events and was satisfied that the Group’s conclusion as to its viability were appropriate.
These issues were discussed with the external auditor at both the planning and execution stages of the external audit and there were no significant differences between management’s and the external auditor’s conclusions.
New accounting standardsAs mentioned last year, the impact on the financial statements of the new accounting standard for leasing (IFRS 16), which will be effective for the year ending in December 2020, will have no net cash flow impact but could significantly change the composition of the consolidated balance sheet and phasing of the relevant charges in the Income Statement. However, the full impact assessment has yet to be completed. In view of the intermediary nature of the majority of the Group’s store leases (from landlords and then sub‑lease to franchisees), the Audit Committee is advised that the impact may not be as great as initially anticipated. The Group has yet to determine whether to adopt the new standard on a full retrospective or modified retrospective basis and the Audit Committee will report next year on the expected method of adoption together with the anticipated impact of the standard on the financial statements.
The impact of the new accounting standard for revenue recognition (IFRS 15), effective for the year ending in December 2018, is
Audit Committee report continued
CORPORATE GOVERNANCE FINANCIAL STATEMENTSSTRATEGIC REPORT
Annual Report & Accounts 2017 Domino’s Pizza Group plc 45
External auditorThe Audit Committee has reviewed the independence, objectivity and effectiveness of the external auditor, Ernst & Young LLP (‘EY’), and considers that EY continues to possess the skills and experience required to fulfil its duties effectively and efficiently. The Audit Committee’s review of the effectiveness of EY as the external auditor is based on discussions with the senior finance team, the robustness of the audit, the quality of reporting to the Audit Committee and reports published by the FRC.
EY has confirmed that in its professional judgement it is independent within the meaning of regulatory and professional requirements and the objectivity of the audit engagement partner and audit staff is not impaired.
The Audit Committee has held meetings with the external auditor without management and there is regular dialogue with the audit partner.
The Audit Committee agrees the fees for the external auditor and has strict policies regarding the provision of non‑audit services by the external auditor which can be found on the Company’s website. These include specific pre‑approvals for proposed work and fees, a prohibition on certain services and a restriction on total non‑audit fees as a percentage of the total audit and audit‑related services, except in exceptional circumstances.
During the year, the level of non‑audit fees payable to EY for 2017 are as set out below:
£000
Total audit and audit‑related fees 520
Non‑audit fees:Market survey 119Other services 20
Total non‑audit services 139
The market survey was performed by an affiliate of EY which was best placed to perform that work as it had provided similar services in prior years and was able to undertake the assignment cost effectively by building on work undertaken during the previous assignments.
The Audit Committee believes that the non‑audit fees were appropriate in the circumstances, particularly as EY has considerable knowledge of the Group’s business.
Audit TenderIn the 2016 annual report, the Committee reported that it intended to conduct a competitive tender of the Group’s external audit.
The tender process was undertaken in the second half of 2017. The Committee had overall oversight and control of the tender process, with day‑to‑day management of the tender delegated to the Company Secretary. Five firms, including EY, were invited to submit tender proposals based on the Group’s audit requirements and assessment criteria, which were set out in a formal tender request proposal. Introductory meetings were held between the bid teams from each of the firms and the Group’s senior management and function heads as well as the chairman of the Audit Committee. Following the introductory meetings and submission of written tender documents, a decision was made to identify three firms that would be invited to make formal presentations to an Audit Tender Committee (comprising the Audit Committee, the Chief Financial Officer, Company Secretary and Group Financial Controller as well as the group Chairman and Chief Executive by invitation). The Audit Tender Committee undertook a formal and structured evaluation of the presentations and tender submissions of each of the candidate firms based on objective evaluation criteria. Based on this evaluation, the Audit Committee recommended two potential external audit firms to the Board with a preference for the appointment of PricewaterhouseCoopers LLP (“PwC”), with effect from the financial year ending on 29 December 2019 in order to facilitate an orderly handover from EY and to coincide with the rotation of the EY audit partner.
The Board considered the Audit Committee’s recommendation and subsequently announced its intention to appoint PwC as the Group’s auditor with effect from the 2019 financial year.
At the 2018 AGM, shareholders will be requested to approve the reappointment of EY as the external auditor in respect of the 2018 financial year. A resolution to appoint PwC as external auditor will be presented to shareholders at the 2019 AGM.
Going concern and viability statementOn behalf of the Board, the Audit Committee reviewed the Group’s projected cash flows, facilities and covenants as well as reviewing the assumptions underlying the viability statement and concluded that it could recommend to the Board that it should be able to make the relevant statements.
Fair, balanced, understandable and comprehensive reportingThe Audit Committee has provided advice to the Board on whether the Annual Report and Accounts, taken as a whole, is fair, balanced and understandable and provides the information necessary for shareholders to assess the Group’s financial position and performance, business model and strategy. Each Director was also asked to provide this confirmation. When doing so, both the Committee and the individual Directors were provided by management with a formal assessment of the key messages included in the annual report. The assessment was designed to test the quality of reporting and to enable the Directors to satisfy themselves that the levels of disclosure were appropriate.
Terms of referenceThe terms of reference for the Audit Committee were revised in February 2017 and further reviewed by the Committee during the year. The Committee’s terms of reference are available on the Company’s investor relations website.
Steve BarberChairman of the Audit Committee7 March 2018

CORPORATE GOVERNANCE
Domino’s Pizza Group plc Annual Report & Accounts 201746
CHAIRMAN’S SUMMARY STATEMENTDear shareholder,I am pleased to present, on behalf of the Board, the Directors’ remuneration report for the year ended 31 December 2017. In this report, we review the Group’s performance in the year and explain the pay which resulted for the Executive Directors, we explain the fees we paid to the non‑executive Directors and we also set out how we intend to implement our remuneration policy in 2018.
Performance and remuneration for 20172017 was a year of continued operational and strategic progress. Despite a more challenging consumer backdrop, we continued to achieve a good rate of growth in our core UK market, particularly in the second half of the year. UK like‑for‑like growth was slower than in recent years, but we opened a record 95 new stores, supported by the attractive returns for franchisees. We also took significant steps to build the platform for future profitable growth: we completed the bulk of our investment in our new Supply Chain Centre in Warrington, providing capacity for our 1,600 UK store target; we took majority ownership in all of our Nordic markets; and we accelerated our plans for Norway with the acquisition of the number three pizza operator, Dolly Dimple’s.
Reflecting 2017’s trading performance, the PBT element of the annual bonus (being 70% of the total for the CEO and 80% of the total for the CFO) was met partially and the Remuneration Committee assessed that the personal performance objectives (being the balancing 30% of the total for the CEO and the balancing 20% of the total for the CFO) were partially achieved for the CEO and partially achieved for the CFO. This resulted in a payment of 50.91% of the maximum for the CEO and 41.3% of the maximum for the CFO. This will result in a bonus of £259,663 becoming payable in cash to
David Wild, CEO and a bonus of £167,906 becoming payable to Rachel Osborne, CFO, two‑thirds of which will be settled in cash and the remaining one‑third settled in shares and deferred for two years.
In 2015, LTIP awards were made to David Wild over 227,679 Ordinary shares (after adjustment for the three‑for‑one sub‑division of shares effective on 27 June 2016). The LTIP awards were subject to stretching performance targets, with 50% of the award being subject to EPS growth and 50% subject to a TSR target. Over the performance period, underlying EPS grew by 75.5% and the Company’s share price performance was above the median relative to the constituents of the FTSE 250 Index (excluding investment trusts). Accordingly the performance conditions for the award were met partially and will result in 90.945% of the awards vesting, subject to continued employment to the vesting date.
As Rachel Osborne joined as Chief Financial Officer in October 2016, she received an LTIP award to compensate her for share‑based incentives forfeited from her previous employer as a consequence of joining Domino’s Pizza. The award comprised two tranches. The first tranche of this award vested in November 2017 and was not subject to any performance conditions. The second tranche was subject to the same performance criteria that applied to the 2015 LTIP awards that were made to David Wild. Therefore, 90.945% of the second tranche of the award will vest in June 2018, subject to continued employment.
The Committee is satisfied that the remuneration outcomes for David and Rachel for the 2017 financial year are fully justified, in light of the business and individual performance during the year, and are in the best interests of the Company and shareholders.
Directors’ remuneration report
CHAIRKevin Higgins
Steve Barber
MEMBERS
Helen Keays

CORPORATE GOVERNANCE FINANCIAL STATEMENTSSTRATEGIC REPORT
Annual Report & Accounts 2017 Domino’s Pizza Group plc 47
INTRODUCTIONThis report sets out the Company’s policy on Directors’ remuneration as well as information on remuneration paid to Directors in the financial year ended 31 December 2017. The report complies with the requirements of the Large and Medium‑sized Companies and Groups (Accounts and Reports) (Amendment) Regulations 2013 (‘the Regulations’) and has been prepared in line with the recommendations of the Code and the UK Listing Authority Listing Rules (‘the Listing Rules’).
The report has been divided into two sections:
• Directors’ remuneration policy – the revised policy was approved at the 2016 AGM and became effective on that date. The substantive terms of the approved remuneration policy have been included for ease of reference; and
• Annual report on remuneration – this, together with the Chairman’s annual statement, will be subject to a single advisory vote at the 2018 AGM. The report sets out the remuneration paid or payable in relation to the year ended 31 December 2017 and how we intend to implement the policy for the year ahead.
Those parts of the report which have been audited by Ernst & Young LLP are clearly identified.
Remuneration policy reportThis part of our Directors’ remuneration report sets out the remuneration policy for the Company which was approved by shareholders at the 2016 AGM on 20 April 2016.
Policy overviewIn setting the remuneration policy for the Executive Directors, the Remuneration Committee took into account the following:
• the need to set appropriate remuneration policies and packages which will attract, retain and motivate Executive Directors and senior management acting in the long‑term interests of the Company but avoid paying more than is necessary;
• setting base salary at or below comparable market rates but weighting a significant proportion of total remuneration towards variable pay with an above‑market incentive opportunity linked to the delivery of truly exceptional performance;
• having demanding short and long‑term performance targets that are specific, measurable and aligned fully with the Company’s business objectives to provide strong linkage between remuneration and performance;
• creating a strong alignment between the interests of senior Executives and the delivery of value to shareholders;
• avoiding creating excessive risks in the achievement of performance targets; and
• conducting periodic external comparisons to examine current market trends and practices and equivalent roles in similar companies, taking into account their size, business complexity, international scope and relative performance.
Implementation of remuneration for 2018The Company’s current remuneration policy was approved by shareholders at the 2016 AGM and will continue to apply for the 2018 financial year. The policy will be implemented as follows in 2018:
• the CEO’s base salary, which is frozen for the three‑year policy period, remains at £510,000 p.a.; the Chief Financial Officer’s salary shall remain at £325,000, her salary at the date of appointment, until 2019;
• the annual bonus opportunity remains at 100% of salary for the CEO and 125% of salary for the CFO;
• the CEO will not receive an award due to the single up‑front grant of performance shares in 2016 under the 2016 LTIP, which replaces three annual grants over the period 2016–2018. The first tranche capable of vesting shall be in 2019; and
• the CFO will receive an award under the 2012 LTIP with a face value of 125% of salary in 2018. This award shall vest subject to stretching EPS and TSR performance targets and continued employment.
Shareholders’ viewsThe Committee continues to take an active interest in shareholders’ views and looks forward to maintaining an open and transparent dialogue in the future. We look forward to your support at the 2018 AGM and welcome any feedback from the Company’s shareholders.
Kevin HigginsChairman of the Remuneration Committee7 March 2018

CORPORATE GOVERNANCE
Domino’s Pizza Group plc Annual Report & Accounts 201748
Remuneration policy report continuedExecutive Director policy tableElement and maximum Purpose and link to strategy Operation Maximum Performance targets
Base salary • Reflects the responsibility level and complexity of the role
• Reflects skills and experience over time
• Provides an appropriate level of basic fixed income avoiding excessive risk arising from over‑reliance on variable income
• Salaries will typically be reviewed annually with the exception of the CEO whose salary will be frozen at £510,000 until 2019 (for the three‑year duration of the policy) following his participation in the 2016 LTIP
• Salary levels take periodic account of pay levels in companies with similar characteristics and sector comparators
• Set in the context of pay and employment conditions in the Group
• Salaries will typically be targeted at or below the relevant market rate
• Salaries will typically be eligible for increases on an annual basis (except for David Wild, CEO, as explained in the Operation column) with the rate of increase (in percentage terms) typically linked to those of the wider workforce
• If there are significant changes in responsibility, a change of scope in a role, a material sustained change in the size and/or complexity of the Company or very strong performance may merit base salary increases beyond those of the wider workforce
• If pay is set at a discount to the Company’s normal policy on appointment, it may be appropriate to phase an individual towards an appropriate rate using increases above those of the wider workforce based on performance and experience
• n/a
Pension • Provides market‑competitive, yet cost‑effective retirement benefits
• Opportunity for Executives to contribute to their own retirement plan
• Defined contribution or cash supplement
• HMRC‑approved salary sacrifice arrangement
• Salary sacrifice for employee contribution
• Monthly employer contribution to a pension arrangement or payment of a cash allowance in lieu of a pension up to 15% of basic salary
• n/a
Other benefits • Provide cost‑effective insured benefits to support the individual and their family
• Access to company car to facilitate effective travel
• Benefits are provided through third‑party providers and include medical and life insurance
• Company cars or cash equivalents provided
• The Committee may offer Executive Directors other employee benefits from time to time on broadly the same terms as provided to the wider workforce
• Family‑level private medical insurance cover provided
• Life insurance cover of four times multiple of salary
• Company car or cash allowance in lieu
• The value of insured benefits will vary from year to year, based on the cost from third‑party providers
• n/a
Annual performance bonus • Incentivise annual delivery of financial and operational goals linked to the Company’s strategy
• Up to two‑thirds of the annual bonus is paid in cash and one‑third deferred into shares that will vest after two years and are subject to forfeiture, with the exception of participants in the 2016 LTIP whose bonus will be settled entirely in cash
• Dividends which accrue on vested shares may be payable
• Not pensionable
• Clawback provisions apply
• Stretching targets drive operational efficiency and influence the level of returns that should ultimately be delivered to shareholders through share price and dividends
• The maximum bonus opportunity is 150% of salary, but David Wild’s bonus opportunity is 100% of salary as he participated in the 2016 LTIP
• The CFO has a maximum bonus opportunity of 125% of salary
• Bonuses will be subject to a combination of financial and strategic targets that are set by the Committee on an annual basis
• The majority of the bonus will be measured against financial metrics (e.g. underlying PBT) with a graduated scale set around the target
• A minority of the bonus may be set based on strategic targets which are aligned to the key objectives from year to year
• A minority of each element will be payable for achieving the threshold performance level. In relation to financial targets, 20% of this part of the bonus becomes payable for achieving the threshold performance target. In relation to any strategic or individual measures used, it is not always practicable to set a sliding scale for each objective. Where it is, a similar proportion of the bonus becomes payable for achieving the threshold performance level as for financial targets
• Details of the bonus measures and targets operated each year will be included in the relevant Directors’ remuneration report
2012 Long Term Incentive Plan (‘2012 LTIP’)
• Participating in the 2016 LTIP will preclude eligibility for future grants under the 2012 LTIP, until 2019
• Aligned to main strategic objectives of delivering sustained profitable growth
• Aids retention of senior management
• Creates alignment with shareholders and provides focus on increasing the Company’s share price over the medium term
• Annual grant of market value options or performance shares
• Subject to performance conditions measured over three years
• Clawback provisions apply
• Dividends which accrue may be paid on vested shares
• Maximum annual opportunity of 200% of salary in performance shares
• The normal policy is to grant annual awards of performance shares at up to 175% of salary to each Executive Director
• Long‑term incentive awards vest based on three‑year performance against a challenging range of financial targets and relative TSR performance set and assessed by the Committee at its discretion
• Financial targets will determine vesting in relation to at least 50% of a performance share award
• A maximum of 15% of any award vests for achieving the threshold performance level with 100% of the awards being earned for maximum performance (there is graduated vesting between these points)
• The performance period for financial targets and relative TSR targets is not less than three financial years
Directors’ remuneration report continued

CORPORATE GOVERNANCE FINANCIAL STATEMENTSSTRATEGIC REPORT
Annual Report & Accounts 2017 Domino’s Pizza Group plc 49
Remuneration policy report continuedExecutive Director policy tableElement and maximum Purpose and link to strategy Operation Maximum Performance targets
Base salary • Reflects the responsibility level and complexity of the role
• Reflects skills and experience over time
• Provides an appropriate level of basic fixed income avoiding excessive risk arising from over‑reliance on variable income
• Salaries will typically be reviewed annually with the exception of the CEO whose salary will be frozen at £510,000 until 2019 (for the three‑year duration of the policy) following his participation in the 2016 LTIP
• Salary levels take periodic account of pay levels in companies with similar characteristics and sector comparators
• Set in the context of pay and employment conditions in the Group
• Salaries will typically be targeted at or below the relevant market rate
• Salaries will typically be eligible for increases on an annual basis (except for David Wild, CEO, as explained in the Operation column) with the rate of increase (in percentage terms) typically linked to those of the wider workforce
• If there are significant changes in responsibility, a change of scope in a role, a material sustained change in the size and/or complexity of the Company or very strong performance may merit base salary increases beyond those of the wider workforce
• If pay is set at a discount to the Company’s normal policy on appointment, it may be appropriate to phase an individual towards an appropriate rate using increases above those of the wider workforce based on performance and experience
• n/a
Pension • Provides market‑competitive, yet cost‑effective retirement benefits
• Opportunity for Executives to contribute to their own retirement plan
• Defined contribution or cash supplement
• HMRC‑approved salary sacrifice arrangement
• Salary sacrifice for employee contribution
• Monthly employer contribution to a pension arrangement or payment of a cash allowance in lieu of a pension up to 15% of basic salary
• n/a
Other benefits • Provide cost‑effective insured benefits to support the individual and their family
• Access to company car to facilitate effective travel
• Benefits are provided through third‑party providers and include medical and life insurance
• Company cars or cash equivalents provided
• The Committee may offer Executive Directors other employee benefits from time to time on broadly the same terms as provided to the wider workforce
• Family‑level private medical insurance cover provided
• Life insurance cover of four times multiple of salary
• Company car or cash allowance in lieu
• The value of insured benefits will vary from year to year, based on the cost from third‑party providers
• n/a
Annual performance bonus • Incentivise annual delivery of financial and operational goals linked to the Company’s strategy
• Up to two‑thirds of the annual bonus is paid in cash and one‑third deferred into shares that will vest after two years and are subject to forfeiture, with the exception of participants in the 2016 LTIP whose bonus will be settled entirely in cash
• Dividends which accrue on vested shares may be payable
• Not pensionable
• Clawback provisions apply
• Stretching targets drive operational efficiency and influence the level of returns that should ultimately be delivered to shareholders through share price and dividends
• The maximum bonus opportunity is 150% of salary, but David Wild’s bonus opportunity is 100% of salary as he participated in the 2016 LTIP
• The CFO has a maximum bonus opportunity of 125% of salary
• Bonuses will be subject to a combination of financial and strategic targets that are set by the Committee on an annual basis
• The majority of the bonus will be measured against financial metrics (e.g. underlying PBT) with a graduated scale set around the target
• A minority of the bonus may be set based on strategic targets which are aligned to the key objectives from year to year
• A minority of each element will be payable for achieving the threshold performance level. In relation to financial targets, 20% of this part of the bonus becomes payable for achieving the threshold performance target. In relation to any strategic or individual measures used, it is not always practicable to set a sliding scale for each objective. Where it is, a similar proportion of the bonus becomes payable for achieving the threshold performance level as for financial targets
• Details of the bonus measures and targets operated each year will be included in the relevant Directors’ remuneration report
2012 Long Term Incentive Plan (‘2012 LTIP’)
• Participating in the 2016 LTIP will preclude eligibility for future grants under the 2012 LTIP, until 2019
• Aligned to main strategic objectives of delivering sustained profitable growth
• Aids retention of senior management
• Creates alignment with shareholders and provides focus on increasing the Company’s share price over the medium term
• Annual grant of market value options or performance shares
• Subject to performance conditions measured over three years
• Clawback provisions apply
• Dividends which accrue may be paid on vested shares
• Maximum annual opportunity of 200% of salary in performance shares
• The normal policy is to grant annual awards of performance shares at up to 175% of salary to each Executive Director
• Long‑term incentive awards vest based on three‑year performance against a challenging range of financial targets and relative TSR performance set and assessed by the Committee at its discretion
• Financial targets will determine vesting in relation to at least 50% of a performance share award
• A maximum of 15% of any award vests for achieving the threshold performance level with 100% of the awards being earned for maximum performance (there is graduated vesting between these points)
• The performance period for financial targets and relative TSR targets is not less than three financial years
CORPORATE GOVERNANCE
Domino’s Pizza Group plc Annual Report & Accounts 201750
Directors’ remuneration report continued
Element and maximum Purpose and link to strategy Operation Maximum Performance targets
2016 Long Term Incentive Plan (‘2016 LTIP’)
• Aligned to main strategic objectives of delivering sustained profitable long‑term growth
• Aids retention of senior management
• Creates alignment with shareholders and provides focus on increasing earnings and the Company’s share price over the medium term
• Single grant of performance shares to cover three years of normal annual grants of performance shares in 2016, 2017 and 2018
• Awards vest in three tranches three, four and five years after the start of the performance period
• Subject to: (i) performance conditions measured over three, four and five years; and (ii) the absolute TSR underpin mechanism
• Clawback provisions apply
• Dividends which accrue may be paid on vested shares up to their vesting date and on vested shares that are subject to a holding period
• A holding period applies which prevents the sale of any vested shares before the fifth anniversary of the start of the performance period (except to fund tax or similar obligations)
• Individual limit of 1,602,000 performance shares covering the life of the policy
• One‑third of each tranche will vest subject to a relative TSR condition measured against the FTSE 250 (excluding investment trusts). 15% of this element will vest for median performance rising up to full vesting for an upper quartile ranking or better
• One‑third will be set against stretching EPS targets and the final third against super‑stretch EPS targets, all using 2015 EPS as the base year
• For threshold levels of performance, 10% of stretch EPS‑linked awards and 0% of super‑stretch EPS‑linked awards will vest
• Once the potential vesting outcomes are known, an underpin mechanism will apply which only permits the release of vested awards in proportion to the extent that TSR has increased in absolute terms, up to a 100% absolute TSR target. Awards will only be released in full if our absolute TSR has increased by 100%. The underpin will be reviewed every six months over the seven‑year life of the award
Share ownership guidelines • To provide alignment between Executives and shareholders
• To encourage a focus on sustainable long‑term performance
• Executives are expected to retain shares from the vesting of options and awards (on an after‑tax basis) to build and maintain a shareholding equivalent to the guideline multiple of salary within five years of joining
• At least 150% of salary holding for Executive Directors, with 200% for participants in the 2016 LTIP
• n/a
Non-executive Director policy tableElement and maximum Purpose and link to strategy Operation Maximum
Non-executive Director fees • Reflects the value of the individual’s skills and experience
• Recognises expected time commitments and responsibilities
• Chairman’s fee set by the Remuneration Committee. Non‑executive Directors’ fees set by the Board
• Fees are normally reviewed biennially, effective 1 January
• Takes into account periodic external reviews against companies with similar characteristics and sector comparators
• Set in the context of time commitments and responsibilities
• A base fee is provided to all non‑executive Directors with supplemental fees payable for chairing the sub‑Committees and for holding the Senior Independent Director position
• Non‑executive Directors do not participate in any annual bonus, share incentive plans or pension arrangements
• Non‑executive Directors shall be reimbursed for any expenses (on a gross of tax basis) incurred in the course of carrying out their role which are deemed to be taxable by HMRC (or equivalent body)
• The fee levels are reviewed on a periodic basis, with reference to the time commitment of the role and market levels in companies of comparable size and complexity
• The fee levels will be eligible for increases during the three‑year period that the remuneration policy operates from the effective date to ensure they appropriately recognise the time commitment of the role, increases to fee levels for non‑executive Directors in general and fee levels in companies of a similar size and complexity
• Flexibility is retained to go over the above fee levels, if necessary to do so, to appoint a new Chairman or non‑executive Director of an appropriate calibre
Remuneration policy report continuedExecutive Director policy table continued
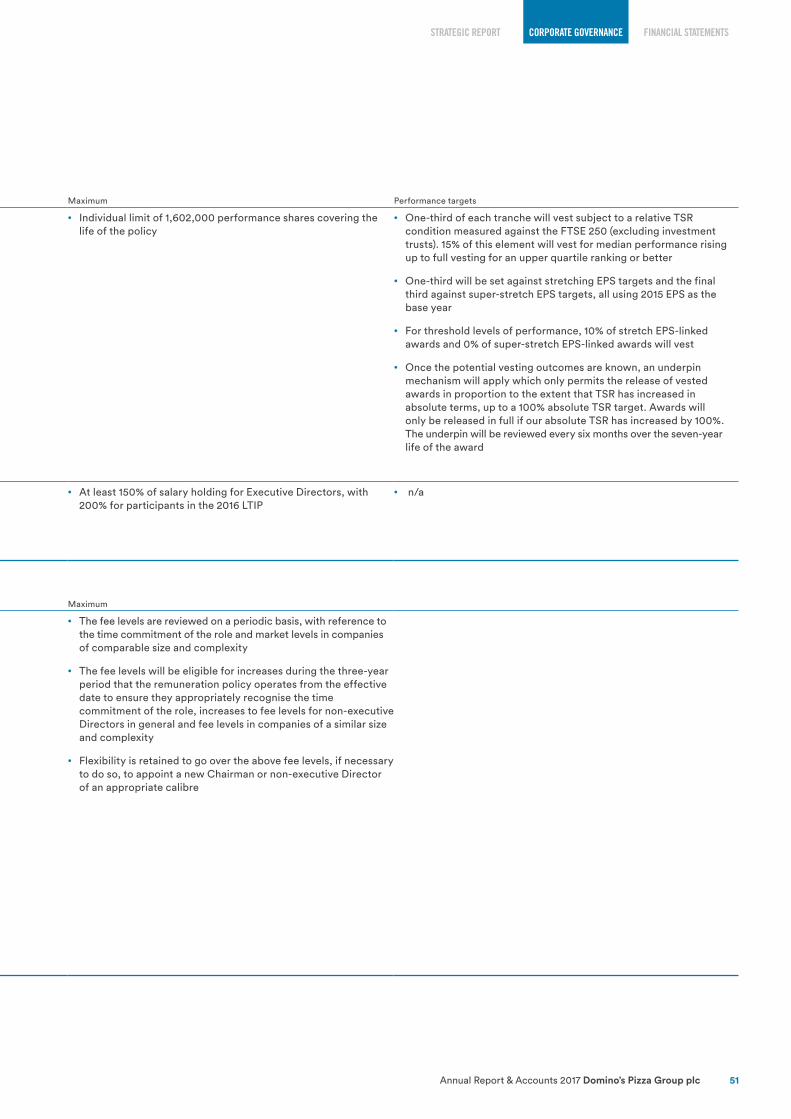
CORPORATE GOVERNANCE FINANCIAL STATEMENTSSTRATEGIC REPORT
Annual Report & Accounts 2017 Domino’s Pizza Group plc 51
Element and maximum Purpose and link to strategy Operation Maximum Performance targets
2016 Long Term Incentive Plan (‘2016 LTIP’)
• Aligned to main strategic objectives of delivering sustained profitable long‑term growth
• Aids retention of senior management
• Creates alignment with shareholders and provides focus on increasing earnings and the Company’s share price over the medium term
• Single grant of performance shares to cover three years of normal annual grants of performance shares in 2016, 2017 and 2018
• Awards vest in three tranches three, four and five years after the start of the performance period
• Subject to: (i) performance conditions measured over three, four and five years; and (ii) the absolute TSR underpin mechanism
• Clawback provisions apply
• Dividends which accrue may be paid on vested shares up to their vesting date and on vested shares that are subject to a holding period
• A holding period applies which prevents the sale of any vested shares before the fifth anniversary of the start of the performance period (except to fund tax or similar obligations)
• Individual limit of 1,602,000 performance shares covering the life of the policy
• One‑third of each tranche will vest subject to a relative TSR condition measured against the FTSE 250 (excluding investment trusts). 15% of this element will vest for median performance rising up to full vesting for an upper quartile ranking or better
• One‑third will be set against stretching EPS targets and the final third against super‑stretch EPS targets, all using 2015 EPS as the base year
• For threshold levels of performance, 10% of stretch EPS‑linked awards and 0% of super‑stretch EPS‑linked awards will vest
• Once the potential vesting outcomes are known, an underpin mechanism will apply which only permits the release of vested awards in proportion to the extent that TSR has increased in absolute terms, up to a 100% absolute TSR target. Awards will only be released in full if our absolute TSR has increased by 100%. The underpin will be reviewed every six months over the seven‑year life of the award
Share ownership guidelines • To provide alignment between Executives and shareholders
• To encourage a focus on sustainable long‑term performance
• Executives are expected to retain shares from the vesting of options and awards (on an after‑tax basis) to build and maintain a shareholding equivalent to the guideline multiple of salary within five years of joining
• At least 150% of salary holding for Executive Directors, with 200% for participants in the 2016 LTIP
• n/a
Non-executive Director policy tableElement and maximum Purpose and link to strategy Operation Maximum
Non-executive Director fees • Reflects the value of the individual’s skills and experience
• Recognises expected time commitments and responsibilities
• Chairman’s fee set by the Remuneration Committee. Non‑executive Directors’ fees set by the Board
• Fees are normally reviewed biennially, effective 1 January
• Takes into account periodic external reviews against companies with similar characteristics and sector comparators
• Set in the context of time commitments and responsibilities
• A base fee is provided to all non‑executive Directors with supplemental fees payable for chairing the sub‑Committees and for holding the Senior Independent Director position
• Non‑executive Directors do not participate in any annual bonus, share incentive plans or pension arrangements
• Non‑executive Directors shall be reimbursed for any expenses (on a gross of tax basis) incurred in the course of carrying out their role which are deemed to be taxable by HMRC (or equivalent body)
• The fee levels are reviewed on a periodic basis, with reference to the time commitment of the role and market levels in companies of comparable size and complexity
• The fee levels will be eligible for increases during the three‑year period that the remuneration policy operates from the effective date to ensure they appropriately recognise the time commitment of the role, increases to fee levels for non‑executive Directors in general and fee levels in companies of a similar size and complexity
• Flexibility is retained to go over the above fee levels, if necessary to do so, to appoint a new Chairman or non‑executive Director of an appropriate calibre

CORPORATE GOVERNANCE
Domino’s Pizza Group plc Annual Report & Accounts 201752
Remuneration policy report continuedOperation of the annual bonus plan and LTIP policyThe Committee will operate the annual bonus plan, the 2012 LTIP and the 2016 LTIP scheme in accordance with their respective rules and in accordance with the Listing Rules and HMRC requirements where relevant.
Within these rules, the Remuneration Committee is required to retain a number of discretions to ensure an effective operation and administration of these plans. These discretions are consistent with standard market practice and include (but are not limited to):
• who participates in the plans; • when awards are granted and/or paid; • the size of an award and/or a payment
(subject to the limits stated in the policy table above);
• how to determine the level of vesting; • how to deal with a change of control
or restructuring of the Group; • how to determine a good/bad leaver
for incentive plan purposes; • how to determine any adjustments
required in certain circumstances (e.g. rights issues, corporate restructuring, events and special dividends); and
• reviewing the performance conditions (range of targets, measures and weightings) for the annual bonus plan and LTIP from year to year.
If certain events occur, such as a material acquisition or the divestment of a Group business, the original performance conditions may no longer be appropriate. Therefore, the Remuneration Committee retains the discretion to make adjustments to the targets and/or set different measures and alter weightings as they deem necessary to ensure the conditions achieve their original purpose, are appropriate in the revised circumstances and, in any event, are not materially less difficult to satisfy.
Any use of the above discretions would, where relevant, be explained in the Directors’ remuneration report and may, where appropriate, be the subject of prior consultation with the Company’s major shareholders.
Share‑settled incentive awards and any arrangements agreed prior to the effective date of this policy will remain eligible to vest or pay out based on their original award terms. This includes any awards granted under the Deferred Share Bonus Plan (‘DSBP’) or the 2012 LTIP scheme. In addition, all arrangements previously disclosed in prior years’ Directors’ remuneration reports will remain eligible to vest or become payable on their original terms.
Balance between fixed and variable payThe performance‑related elements of remuneration are dependent upon the achievement of outcomes that are important drivers of sustainable growth for the business and therefore the creation of value for shareholders. The remuneration package offered to Executive Directors by the Company is therefore more heavily performance related than that operated in comparatively sized leisure companies and companies in the upper half of the FTSE 250 more generally, particularly at higher levels of performance.
Illustration of remuneration scenariosThe chart below illustrates the total remuneration for the Chief Executive Officer and Chief Financial Officer based on the current policy under three different scenarios – minimum, target and maximum. Given that the 2016 LTIP covers three grants, we have applied a value to each tranche to arrive at an annualised value.
AssumptionsMinimum – comprises fixed pay being the value of 2018 base salary, 2017 benefits and a pension contribution in line with the approved policy.
Target – for David Wild, minimum plus a bonus payout of 50% of the maximum (50% of salary) plus threshold vesting of one tranche of the 2016 LTIP under the relative TSR and stretch EPS parts of the award. It assumes no vesting under the super‑stretch EPS targets. The absolute TSR underpin mechanism assumes 75% vesting is achieved. For Rachel Osborne, minimum plus a bonus payout of 50% of the maximum (62.5% of salary) and threshold vesting under the LTIP.
Maximum – minimum plus maximum bonus. For David Wild, it assumes full vesting of one tranche of the 2016 LTIP and achievement of the absolute TSR underpin. For Rachel Osborne, it assumes full vesting of an LTIP with a face value of 125% of salary.
This has been modelled at a share price of 345.7p, being that in force on the last day of the 2017 financial year. No account has been taken of any prospective share price changes.
Directors’ remuneration report continued
Choice of performance metricsThe Company is a growth business, and our investments in supply chain, digital innovation and the customer experience are all designed to improve the profitability of the overall system, reach new customers and drive repeat business from existing customers. However, neither system sales nor statutory revenue are appropriate performance measures, because the former is significantly influenced by franchisees, and the latter is affected by the volatility of food costs. As a result, underlying profit before tax is used as the main performance metric in the annual bonus plan, as this captures both the growth and the efficiency of the business. A combination of relative TSR and growth in EPS are used for the 2012 LTIP, as we believe these are the longer term performance metrics that are most relevant to shareholders.
Underlying EPS measures the Company’s success in delivering long‑term profit growth, a key contributor to the Company’s valuation, and is considered by the Committee to be the
most appropriate measure of long‑term financial performance. It is also used by the Board to determine success in executing our strategy.
Relative TSR helps align management’s and shareholders’ interests, since the Executives will only be rewarded to the extent that the Company delivers a return to shareholders above the median company of comparable size, with full vesting on this measure requiring top quartile performance.
Absolute TSR helps address the issue of being the best performer in a falling market, by requiring that there has been a positive growth in TSR over the measurement period.
All incentives are capped in order that inappropriate risk taking is neither encouraged nor rewarded. For financial targets, a sliding scale is applied, with a very modest amount being payable for threshold levels of performance.
0
£500
£1,000
£1,500
£2,000
£2,500
£3,000
£000
Fixed pay Bonus LTIP
£3,500
Below target Target Maximum
100%
£575
61% 20%
CEO – David Wild
27%
£945
12%17%
63%
£2,931
Below target Target Maximum
100% 60% 32%
CFO – Rachel Osborne
£39031%
9%
£654
34%
34%
£1,203

CORPORATE GOVERNANCE FINANCIAL STATEMENTSSTRATEGIC REPORT
Annual Report & Accounts 2017 Domino’s Pizza Group plc 53
A number of the Company’s non‑financial strategic objectives have been incorporated into the annual bonus for Executive Directors and will be applied on an individual basis for a minority of the overall bonus opportunity. These objectives will also be measured on a sliding scale of performance.
The Committee will review the continued appropriateness of the annual bonus (and, if applicable, 2012 LTIP) performance conditions on an annual basis to ensure that they remain aligned to the Company’s strategy. The Committee will make necessary changes to the weightings of measures and/or introduce new measures which they believe would provide a closer link to the business strategy within the confines of the policy detailed above. Shareholder dialogue would take place, as appropriate, should there be any material change of emphasis in relation to current practices.
How employees’ pay is taken into accountPay and conditions elsewhere in the Group were considered when finalising the current policy for the Executive Directors. In particular, the Committee is updated on salary increases for the general employee population, Company‑wide benefit provision, level of annual bonuses and staff participation in long‑term incentive schemes, so it is aware of how the total remuneration of the Executive Directors compares with the average total remuneration of employees generally.
The Committee does not formally or directly consult with employees on Executive pay but does receive periodic updates from the Group HR Director. The Committee is also informed of the results of employee engagement surveys, which do not contain any specific questions related to Executive Director remuneration, but the most recent of which indicated that most employees show high levels of engagement and feel that reward is an important attribute of their job.
How the Executive Directors’ remuneration policy relates to the GroupThe remuneration policy described above provides an overview of the structure that operates for the most senior Executives in the Group, with a significant element of remuneration dependent on Company and individual performance.
A lower aggregate level of incentive payment applies below Executive Director level, driven by market comparatives, internal relativities and the potential impact of the role. The vast majority of the Group’s employees participate in an annual bonus plan, with the limits and performance conditions varying according to job grade.
The Committee believes that broad‑based employee share ownership provides a key element in retention and motivation in the wider workforce. Long‑term incentives are provided through the Group’s discretionary share schemes to selected Executives and managers. The Company also offers an HMRC‑registered savings‑related share option scheme for all UK‑based employees with more than six months’ service, including Executive Directors.
In the UK and Ireland, all newly appointed employees, including Executive Directors, are eligible to join a defined contribution pension plan, whereby they make a contribution to the nominated plan, with the Company typically contributing double the amount paid by the employee. In other territories, pension provision varies and can be contributions to state schemes, occupational plans or personal pension arrangements in which the employing company makes contributions.
How is risk managed in relation to short and long-term incentives?The Committee believes that the consideration and management of risk is important when formulating and then operating appropriate remuneration structures (notably the performance criteria) for senior management. All of the members of the Committee are also members of the Audit Committee, whose Chairman is also a member of the Remuneration Committee. The Remuneration Committee has a good understanding of the key risks facing the business and the relevance of these to the remuneration strategy, most particularly when setting targets for performance‑related pay.
In line with the Investment Association’s Guidelines on Responsible Investment Disclosure, the Remuneration Committee ensures that the incentive structure for Executive Directors and senior management will not raise environmental, social or governance (‘ESG’) risks by inadvertently motivating irresponsible behaviour and remuneration design can be flexed to address ESG issues when appropriate. The Committee has due regard to issues of general operational risk when structuring incentives.
The clawback provisions in respect of annual bonuses and long‑term share plans also provide the Committee with a mechanism to recover monies in certain circumstances, for example, if a misstatement of results is identified. Share ownership guidelines and the design of the 2012 LTIP and 2016 LTIP help to ensure that the Executive Directors have a strong personal focus on long‑term sustainable performance, heavily driven by the relative and absolute returns delivered to shareholders.
How shareholders’ views are taken into accountThe Committee considers shareholder feedback received around the AGM and analyses the votes cast on the relevant items of business. This feedback, plus views received during meetings with institutional shareholders and their representative bodies, is considered as part of the Company’s annual review of remuneration policy. The Remuneration Committee also consults with its key shareholders whenever appropriate. A comprehensive consultation exercise was undertaken during early 2016 with shareholders’ views being reflected in the revised policy, which has been in effect since the 2016 AGM. The Committee values feedback from its shareholders and seeks to maintain a continued open dialogue. Investors who wish to discuss remuneration issues should contact the Company Secretary.
Service contracts and policy on exitThe Committee reviews the contractual terms for new Executive Directors to ensure that these reflect best practice.
Service contracts are normally entered into on a rolling basis, with notice periods given by the employing company limited to 12 months or less. Should notice be served by either party, the Executive can continue to receive basic salary, benefits and pension for the duration of their notice period, during which time the relevant Group company may require the individual to continue to fulfil their current duties or may assign a period of garden leave. An Executive Director’s service contract may be terminated without notice and without any further payment or compensation, save for sums accrued up to the date of termination, on the occurrence of certain events of gross misconduct. If the Company terminates the employment of an Executive Director in breach of contract, compensation is limited to salary due for any unexpired notice period and any amount assessed by the Committee as representing the value of other contractual benefits which would have been received during the unexpired notice period.
The policy for any new Executive Director would be based on terms that are consistent with these provisions but will also include the ability for the Company to make a payment in lieu of notice (limited to a maximum value of 12 months’ base salary, pension and benefits). Payments in lieu of notice may be made in monthly instalments and would reduce proportionately to the extent that alternative employment income was received (i.e. phased payments, subject to mitigation).

CORPORATE GOVERNANCE
Domino’s Pizza Group plc Annual Report & Accounts 201754
Remuneration policy report continuedService contracts and policy on exit continuedDavid Wild, the Chief Executive Officer, has a rolling contract dated 30 April 2014. Rachel Osborne, the Chief Financial Officer, has a rolling contract dated 10 October 2016. Both Executives’ contracts are terminable on six months’ notice from either party and include payment in lieu of notice provisions as per the policy detailed on page 53.
Payments in lieu of notice are not pensionable. In the event of a change of control of the Group, there is no enhancement to contractual terms.
In summary, the contractual provisions for the Executive Directors are as follows:
Provision Detailed terms
Notice period 12 months or less
Maximum termination payment Base salary plus benefits and pension, subject to mitigation for new Directors
Remuneration entitlements A pro rata bonus may also become payable for the period of active service along with vesting for outstanding share awards (in certain circumstances – see below)In all cases performance targets would apply
Change of control As on termination
Any share‑based entitlements granted to an Executive Director under the Company’s LTIP schemes or bonus entitlement under the annual performance bonus will be determined based on the relevant plan rules.
With regard to the circumstances under which the Executive Directors might leave service, these are described below with a description of the anticipated payments:
Remuneration element “Bad” leaver (e.g. resignation)
Departure on agreed terms (e.g. asked to leave due to revised skill sets required for role) “Good” leaver (e.g. ill health, retirement)
Salary in lieu of notice period
Salary for proportion of notice period served
Treatment will normally fall between good leaver and bad leaver treatment, subject to the discretion of the Remuneration Committee and the terms of any termination agreement
Up to a maximum of 100% of salary
Pension and benefits Provided for proportion of notice period served
Up to one year’s worth of pension and benefits (e.g. redundancy)
Possible payment of pension and insured benefits triggered by the leaver event (this would be governed by the terms of the benefits provided)
Bonus If resigns, reduced pro rata to reflect proportion of bonus year employed (provided performance conditions met) at the discretion of the Remuneration Committee. If dismissed for cause, none payable
Reduced pro rata to reflect proportion of bonus year elapsed (provided performance conditions met)
Long‑term incentive entitlements (2012 LTIP)
Lapse Up to full vesting, based on performance tested over the full performance period (or to the date of cessation at the discretion of the Committee)
Where awards are granted as market value options, the award may also be reduced pro rata (at the discretion of the Committee) to reflect the proportion of the performance period elapsed to the date of cessation
Where awards are granted as performance shares, awards will be subject to a pro rata reduction unless the Committee determines otherwise
Long‑term incentive entitlements (2016 LTIP)
Lapse Awards will normally continue to be capable of vesting subject to performance measured at the normal calculation date (or until the absolute TSR condition has been satisfied prior to the award’s expiry) and a pro rata reduction by reference to the proportion of the relevant three, four and five‑year performance periods that have expired, unless the Remuneration Committee determines otherwise, on an exceptional basis
Other payments None Disbursements such as legal costs and outplacement and redundancy entitlements
Directors’ remuneration report continued

CORPORATE GOVERNANCE FINANCIAL STATEMENTSSTRATEGIC REPORT
Annual Report & Accounts 2017 Domino’s Pizza Group plc 55
Non-executive Director remunerationThe non‑executive Directors are not employed under service contracts and do not receive compensation for loss of office. With the exception of Colin Halpern, who is nominated to the Board pursuant to a contractual agreement, each of the non‑executive Directors is appointed for a fixed term of three years, renewable for a further three‑year term if agreed and subject to annual re‑election by shareholders.
The following table shows details of the terms of appointment for the non‑executive Directors:
Appointment dateDate most recentterm commenced
Expected date ofexpiry of current term
Stephen Hemsley 1 January 2008(as Executive Chairman)
30 March 2016(as non‑executive Chairman)
30 March 2019
Colin Halpern 15 November 1999 Rolling annual n/aHelen Keays 20 September 2011 20 September 2017 20 September 2020Ebbe Jacobsen 31 January 2014 31 January 2017 31 January 2020Kevin Higgins 8 September 2014 8 September 2017 8 September 2020Steve Barber 1 July 2015 1 July 2015 1 July 2018
Recruitment and promotion policyWhen facilitating an external recruitment or an internal promotion the Committee will apply the following principles:
Remuneration element Policy
Base salary Salary levels will be set based on the experience, knowledge and skills of the individual and in the context of market rates for equivalent roles in companies of a similar size and complexity. The Committee will also consider Group relativities when setting base salary levels
The Committee may set initial base salaries below the perceived market rate with the aim to make multi‑year staged increases to achieve the desired market position over time. Where necessary these increases may be above those of the wider workforce, but will be subject to continued development in the role
Benefits Benefits will be as provided to current Executive Directors
The Committee will consider meeting the cost of certain reasonable relocation expenses and legal fees as necessary
Pension A defined contribution or cash supplement at a level no more (as a percentage of salary) than current Executive Directors
Annual bonus The annual bonus would be operated in line with that set out in the policy table for current Executive Directors
For a new joiner, the bonus would be pro‑rated for the period of service
Due to the timing or nature of the appointment, the Committee may determine it necessary to set different modified performance conditions for the first year of appointment
Long-term incentives Participation will be in accordance with the information set out in the policy table
Awards may be made shortly after an appointment, subject to prohibited periods
Any new appointment would be eligible to participate in the all‑employee share option arrangements on the same terms as all other employees
For internal promotions, existing awards will continue over their original vesting period and remain subject to their terms as at the date of grant
Additional incentives on appointment
The Committee will assess whether it is necessary to buy out remuneration which would be forfeited from a previous employer
The Committee will, where possible, seek to offer a direct replacement award taking into account the structure, quantum, time horizons and relevant performance conditions which would impact on the expected value of the remuneration to be forfeited
The Committee will use the existing remuneration plans where possible, although it may be necessary to grant outside of these schemes using exemptions permitted under the Listing Rules
External appointmentsThe Committee recognises that Executive Directors may be invited to become non‑executive Directors in other companies and that these appointments can enhance their knowledge and experience to the benefit of the Company. Subject to pre‑agreed conditions, and with prior approval of the Board, each Executive Director is permitted to accept one appointment as a non‑executive director in another listed company. The Executive Director is permitted to retain any fees paid for such service.
CORPORATE GOVERNANCE
Domino’s Pizza Group plc Annual Report & Accounts 201756
Annual report on remunerationRole and membershipThe Committee is responsible for the Chairman’s and the Executive Directors’ remuneration and also oversees the remuneration packages of other senior Executives. The remuneration and terms of appointment of the non‑executive Directors are determined by the Board as a whole.
The Chairman and the Chief Executive Officer are consulted on proposals relating to the remuneration of relevant senior Executives and, when appropriate, are invited by the Remuneration Committee to attend meetings but are not present when their own remuneration is considered.
The Company Secretary acts as Secretary to the Remuneration Committee.
The role of the Remuneration Committee is set out in its terms of reference, which are reviewed annually and can be found on the Group’s website, http://investors.dominos.co.uk. The Remuneration Committee normally meets up to four times in each year and additionally as circumstances dictate.
During the year, the members of the Remuneration Committee and their attendance at the meetings were:
Name Member since Attendance
Kevin Higgins (Chairman) 22 September 2014 3Helen Keays 22 September 2014 2Steve Barber 16 September 2015 3
External advisersThroughout the year, New Bridge Street (‘NBS’), a trading name of Aon plc, was retained by the Remuneration Committee to provide it with relevant consultancy services. NBS was selected on an arm’s length basis and appointed by the Remuneration Committee. NBS is a signatory to the Remuneration Consultants’ Code of Conduct and did not provide any other services to the Company except in relation to senior management remuneration matters. The total fees for NBS services in the year were £42,368 excluding VAT. The Remuneration Committee reviews its relationship with external advisers on a regular basis and, noting that NBS does not provide any other services to the Group, continues to believe that there are no conflicts of interest.
What has the Remuneration Committee done during the year?The Remuneration Committee met three times during the year to consider and, where appropriate, approve key remuneration items including the following:
A) Management of individual remuneration • reviewed and approved Executive Directors’ and senior management base salaries and benefits;
• reviewed year‑end business performance and performance‑linked rewards in order to determine annual bonus payouts and vesting of long‑term incentives;
• approved long‑term incentive awards made in 2017 under the 2012 LTIP; and
• reviewed the Chairman’s fees.
B) Governance of the remuneration programme • reviewed and approved the Directors’ remuneration report;
• amendments to 2012 LTIP to implement a two‑year holding period post vesting and more stringent recovery and withholding provisions;
• monitored guidance and directional themes from institutional shareholder bodies in relation to new reporting requirements;
• reviewed 2017 AGM results and feedback from institutional shareholders; and
• confirmed that the remuneration arrangements are not anticipated to inadvertently encourage any undue risk taking.
Implementation of remuneration policy for 2018Base salaryAs disclosed in last year’s remuneration report and agreed as part of the 2016 remuneration policy approval, the salary for the Chief Executive Officer will be frozen at £510,000 until 2019. The Chief Financial Officer’s salary shall remain at £325,000, her salary at the date of appointment in October 2016, until 2019.
Annual performance bonus (‘APB’)As the CEO participates in the 2016 LTIP, his maximum bonus opportunity for 2018 will be 100% of salary. The CFO’s maximum bonus will be 125% of salary.
The APB provides a focus on the delivery of the stretching targets that are set by the Committee following consideration of the Company’s annual operating plan by the Board each year and there is a threshold level of performance below which no award is paid.
Directors’ remuneration report continued

CORPORATE GOVERNANCE FINANCIAL STATEMENTSSTRATEGIC REPORT
Annual Report & Accounts 2017 Domino’s Pizza Group plc 57
The performance conditions for the APB for the 2018 financial year will be based both on achieving and exceeding the Group’s underlying PBT growth targets set by the Board (70% of bonus for the CEO and 80% of bonus for the CFO) and on achieving individual business objectives (30% of bonus for the CEO and 20% of bonus for the CFO) which support the business plan.
The underlying PBT measure is based on internally set targets and pays out 20% at threshold (95% of target) rising on a pro rata basis to 50% payout at target with full payment only due if we achieve 110% of target.
For 2018, strategic objectives will be set by the Committee linked to the Company’s strategic goals. None of the strategic element of the bonus may be earned unless a threshold level of Group underlying PBT has been achieved. Where appropriate, individual objectives are also set on a sliding scale based around a target.
The Committee considers that the performance targets in relation to the APB are commercially sensitive and therefore will not be disclosed on a prospective basis, but intends that the targets and outcomes are disclosed in the Directors’ remuneration report once they are no longer considered sensitive, as has been its practice in recent years.
The CEO’s bonus will be payable in cash as he participates in the 2016 LTIP. For the CFO, two‑thirds of any bonus payments will be made in cash, with the remaining third deferred into Company shares, which will vest after two years during which time they remain subject to forfeiture. Dividend equivalents may be payable on vested shares.
Long-term incentivesThe CEO’s participation in the 2016 LTIP (which replaces three annual grants over the period 2016–2018) means that he is not eligible for an LTIP grant in 2018.
It is intended that the CFO will receive an award of performance shares under the 2012 LTIP with a face value of 125% of salary. Awards will vest after three years subject to two independent performance metrics.
50%: earnings per share growth
Three‑year underlying EPS growth (over 2017 base year)
Vesting(% of EPS part
of award)
Below 30% 0%30% 10%40% 45%50% 80%60% 100%
Straight-line vesting in between the performance points aboveThe above underlying EPS targets are considered to be appropriately demanding given the quantum of the awards proposed, current market expectations of the Company and internal long‑term planning.
50%: relative TSR performanceThe remaining half of the award will vest in accordance with the following vesting schedule based on the Company’s TSR performance against the constituents of the FTSE 250 Index, excluding investment trusts, over three financial years.
Ranking of the Company’s TSR
Vesting(% of TSR part
of award)
Below median 0%Median 15%Upper quartile or higher 100%
Straight-line vesting in between the performance points aboveIn choosing underlying EPS and TSR as the metrics, the Committee has sought to provide a balance between incentivising delivery against our key measure of success in delivering profitable growth (underlying EPS) and aligning the CFO and senior management with shareholders through a TSR measure.
Benefits and supplementsBenefits in kind provided for Executive Directors are principally Company car provision or an allowance in lieu of Company car, mobile telephone, life insurance cover and private health cover for Executive Directors and their family. Benefits in kind are not pensionable and are not taken into account when determining base salary for performance‑related remuneration.
PensionThe Committee reviews the pension arrangements for Executive Directors to ensure that the benefits provided are consistent with those provided by other similar companies and take account of changes in relevant legislation.
The Company does not offer a defined benefit pension scheme. Instead, the Company contributes to the Executive Directors’ personal pensions or provides a cash supplement at a rate of up to 15% of base salary.
The Committee approves the pension arrangements and contributions made by the Group on behalf of the Executive Directors. The Company does not contribute to any pension arrangements for the non‑executive Directors.

CORPORATE GOVERNANCE
Domino’s Pizza Group plc Annual Report & Accounts 201758
Annual report on remuneration continuedImplementation of remuneration policy for 2018 continuedNew appointmentsThe remuneration arrangements for any new appointments to the Board will be consistent with the Company’s approved remuneration policy and policy table.
Non-executive Directors’ fees Non‑executive Directors’ fees are reviewed biennially and the last review was carried out in March 2018.
The fee structure for the Chairman and other non‑executive Directors for 2018 and 2019 is as follows:
• Chairman – £230,000;
• Non‑executive Director base fee – £50,000;
• Audit Committee Chairman fee – £10,000;
• Remuneration Committee Chairman fee – £10,000;
• Nomination Committee Chairman fee – £5,000; and
• Senior Independent Director fee – £10,000.
The fee levels have been updated following a benchmarking exercise which reviewed companies of comparable size and complexity and took account of the time commitment of the roles.
Statement of shareholder voting at AGMAt the AGM held on 20 April 2017 the Directors’ remuneration report was put to a shareholder vote.
The voting results were as follows:
Annual report on remuneration
Total number of votes % of votes cast
For 346,779,670 92.35%Against 28,743,537 7.65%
Total votes cast (for and against) 375,523,207 100%Votes withheld* 2,025,419 —
Total votes cast (including withheld votes) 377,548,626 —
* A vote withheld is not a vote in law and is not counted in the calculation of the proportion of votes cast “For” and “Against” a resolution.
Single total remuneration figure for each Director (audited)53 weeks ended 31 December 2017
£000
Fixed pay Performance-related payTotal
remunerationin 2017Salary
Benefits1 andsupplements Pension Subtotal Bonus
LTIPvesting 6
DSBPvesting 7 Subtotal
Executives David Wild 510 14 51 575 260 751 11 1,022 1,597Rachel Osborne 325 17 49 391 168 25 — 193 584
Non-executives Stephen Hemsley 230 2 — 232 — — — — 232 Colin Halpern 140 31 — 171 — — — — 171 Helen Keays 54 — — 54 — — — — 54Ebbe Jacobsen 47 — — 47 — — — — 47Kevin Higgins 57 — — 57 — — — — 57Steve Barber 57 — — 57 — — — — 57
Total 1,420 64 100 1,584 428 776 11 1,215 2,799
Directors’ remuneration report continued
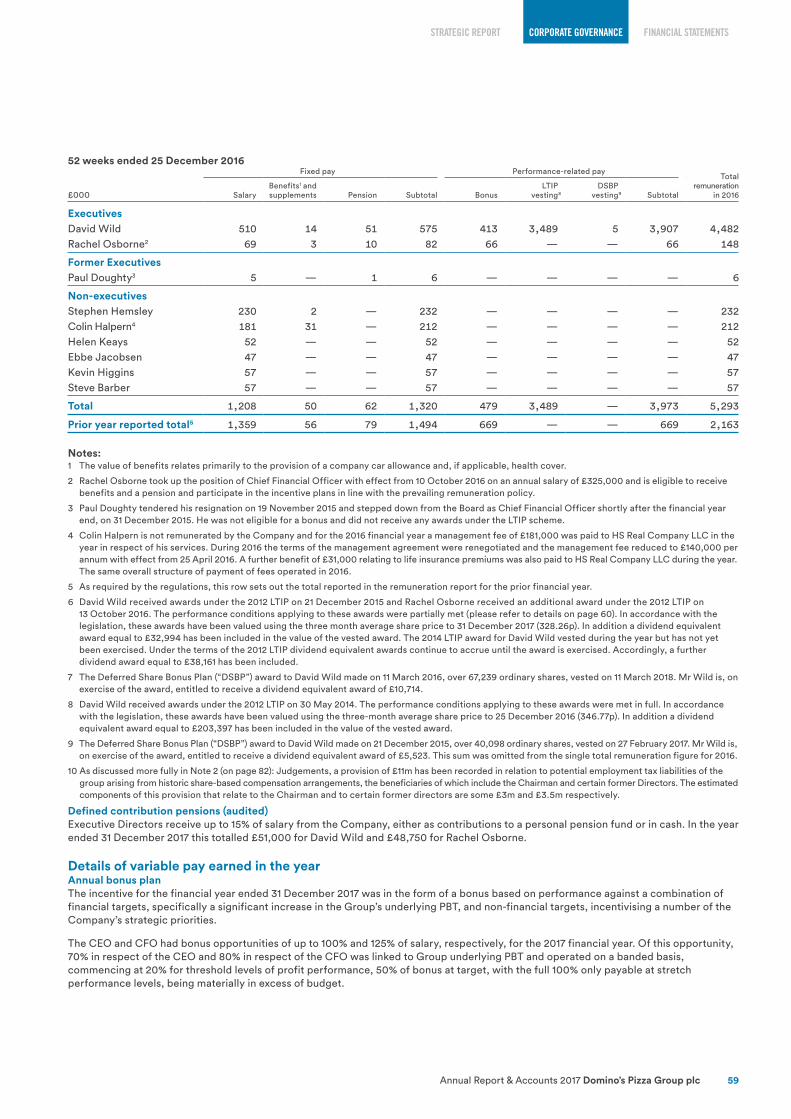
CORPORATE GOVERNANCE FINANCIAL STATEMENTSSTRATEGIC REPORT
Annual Report & Accounts 2017 Domino’s Pizza Group plc 59
52 weeks ended 25 December 2016
£000
Fixed pay Performance‑related payTotal
remunerationin 2016Salary
Benefits1 andsupplements Pension Subtotal Bonus
LTIPvesting 8
DSBPvesting 9 Subtotal
Executives David Wild 510 14 51 575 413 3,489 5 3,907 4,482Rachel Osborne2 69 3 10 82 66 — — 66 148
Former ExecutivesPaul Doughty3 5 — 1 6 — — — — 6
Non-executives Stephen Hemsley 230 2 — 232 — — — — 232Colin Halpern4 181 31 — 212 — — — — 212Helen Keays 52 — — 52 — — — — 52Ebbe Jacobsen 47 — — 47 — — — — 47Kevin Higgins 57 — — 57 — — — — 57Steve Barber 57 — — 57 — — — — 57
Total 1,208 50 62 1,320 479 3,489 — 3,973 5,293
Prior year reported total5 1,359 56 79 1,494 669 — — 669 2,163
Notes:1 The value of benefits relates primarily to the provision of a company car allowance and, if applicable, health cover.
2 Rachel Osborne took up the position of Chief Financial Officer with effect from 10 October 2016 on an annual salary of £325,000 and is eligible to receive benefits and a pension and participate in the incentive plans in line with the prevailing remuneration policy.
3 Paul Doughty tendered his resignation on 19 November 2015 and stepped down from the Board as Chief Financial Officer shortly after the financial year end, on 31 December 2015. He was not eligible for a bonus and did not receive any awards under the LTIP scheme.
4 Colin Halpern is not remunerated by the Company and for the 2016 financial year a management fee of £181,000 was paid to HS Real Company LLC in the year in respect of his services. During 2016 the terms of the management agreement were renegotiated and the management fee reduced to £140,000 per annum with effect from 25 April 2016. A further benefit of £31,000 relating to life insurance premiums was also paid to HS Real Company LLC during the year. The same overall structure of payment of fees operated in 2016.
5 As required by the regulations, this row sets out the total reported in the remuneration report for the prior financial year.
6 David Wild received awards under the 2012 LTIP on 21 December 2015 and Rachel Osborne received an additional award under the 2012 LTIP on 13 October 2016. The performance conditions applying to these awards were partially met (please refer to details on page 60). In accordance with the legislation, these awards have been valued using the three month average share price to 31 December 2017 (328.26p). In addition a dividend equivalent award equal to £32,994 has been included in the value of the vested award. The 2014 LTIP award for David Wild vested during the year but has not yet been exercised. Under the terms of the 2012 LTIP dividend equivalent awards continue to accrue until the award is exercised. Accordingly, a further dividend award equal to £38,161 has been included.
7 The Deferred Share Bonus Plan (“DSBP”) award to David Wild made on 11 March 2016, over 67,239 ordinary shares, vested on 11 March 2018. Mr Wild is, on exercise of the award, entitled to receive a dividend equivalent award of £10,714.
8 David Wild received awards under the 2012 LTIP on 30 May 2014. The performance conditions applying to these awards were met in full. In accordance with the legislation, these awards have been valued using the three‑month average share price to 25 December 2016 (346.77p). In addition a dividend equivalent award equal to £203,397 has been included in the value of the vested award.
9 The Deferred Share Bonus Plan (“DSBP”) award to David Wild made on 21 December 2015, over 40,098 ordinary shares, vested on 27 February 2017. Mr Wild is, on exercise of the award, entitled to receive a dividend equivalent award of £5,523. This sum was omitted from the single total remuneration figure for 2016.
10 As discussed more fully in Note 2 (on page 82): Judgements, a provision of £11m has been recorded in relation to potential employment tax liabilities of the group arising from historic share‑based compensation arrangements, the beneficiaries of which include the Chairman and certain former Directors. The estimated components of this provision that relate to the Chairman and to certain former directors are some £3m and £3.5m respectively.
Defined contribution pensions (audited)Executive Directors receive up to 15% of salary from the Company, either as contributions to a personal pension fund or in cash. In the year ended 31 December 2017 this totalled £51,000 for David Wild and £48,750 for Rachel Osborne.
Details of variable pay earned in the year Annual bonus planThe incentive for the financial year ended 31 December 2017 was in the form of a bonus based on performance against a combination of financial targets, specifically a significant increase in the Group’s underlying PBT, and non‑financial targets, incentivising a number of the Company’s strategic priorities.
The CEO and CFO had bonus opportunities of up to 100% and 125% of salary, respectively, for the 2017 financial year. Of this opportunity, 70% in respect of the CEO and 80% in respect of the CFO was linked to Group underlying PBT and operated on a banded basis, commencing at 20% for threshold levels of profit performance, 50% of bonus at target, with the full 100% only payable at stretch performance levels, being materially in excess of budget.
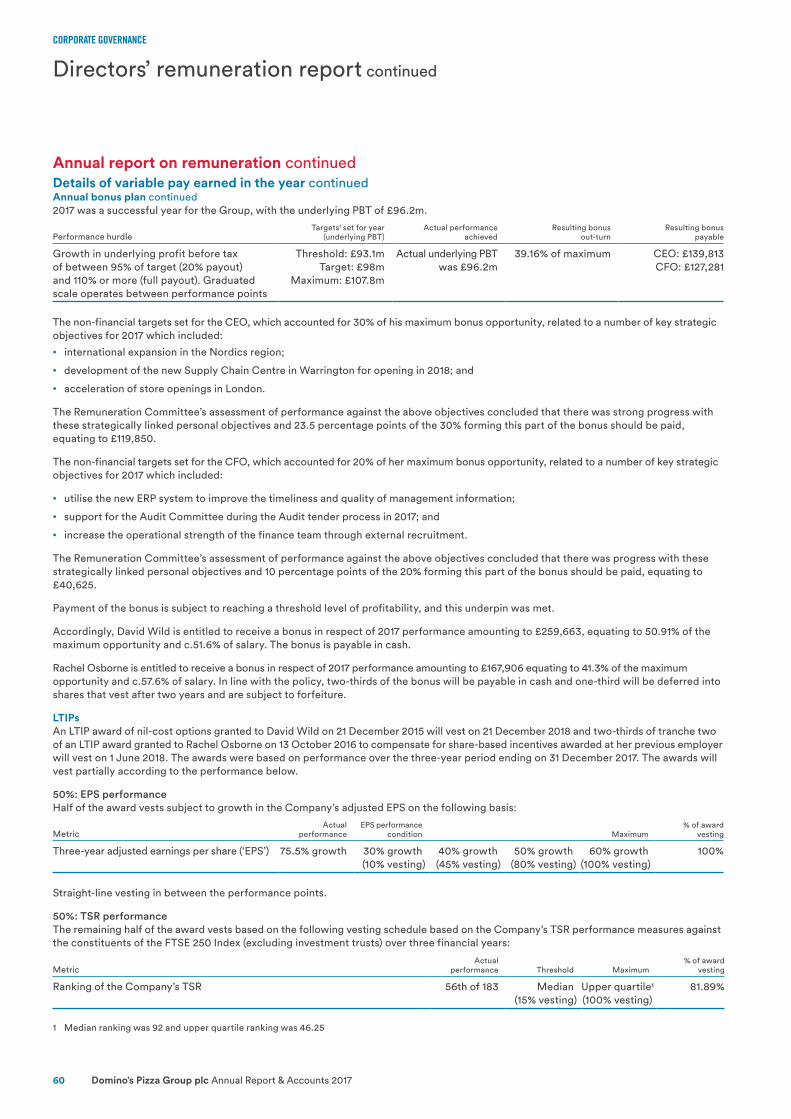
CORPORATE GOVERNANCE
Domino’s Pizza Group plc Annual Report & Accounts 201760
Annual report on remuneration continuedDetails of variable pay earned in the year continuedAnnual bonus plan continued2017 was a successful year for the Group, with the underlying PBT of £96.2m.
Performance hurdleTargets1 set for year
(underlying PBT)Actual performance
achievedResulting bonus
out‑turnResulting bonus
payable
Growth in underlying profit before tax of between 95% of target (20% payout) and 110% or more (full payout). Graduated scale operates between performance points
Threshold: £93.1mTarget: £98m
Maximum: £107.8m
Actual underlying PBT was £96.2m
39.16% of maximum CEO: £139,813CFO: £127,281
The non‑financial targets set for the CEO, which accounted for 30% of his maximum bonus opportunity, related to a number of key strategic objectives for 2017 which included:
• international expansion in the Nordics region;
• development of the new Supply Chain Centre in Warrington for opening in 2018; and
• acceleration of store openings in London.
The Remuneration Committee’s assessment of performance against the above objectives concluded that there was strong progress with these strategically linked personal objectives and 23.5 percentage points of the 30% forming this part of the bonus should be paid, equating to £119,850.
The non‑financial targets set for the CFO, which accounted for 20% of her maximum bonus opportunity, related to a number of key strategic objectives for 2017 which included:
• utilise the new ERP system to improve the timeliness and quality of management information;
• support for the Audit Committee during the Audit tender process in 2017; and
• increase the operational strength of the finance team through external recruitment.
The Remuneration Committee’s assessment of performance against the above objectives concluded that there was progress with these strategically linked personal objectives and 10 percentage points of the 20% forming this part of the bonus should be paid, equating to £40,625.
Payment of the bonus is subject to reaching a threshold level of profitability, and this underpin was met.
Accordingly, David Wild is entitled to receive a bonus in respect of 2017 performance amounting to £259,663, equating to 50.91% of the maximum opportunity and c.51.6% of salary. The bonus is payable in cash.
Rachel Osborne is entitled to receive a bonus in respect of 2017 performance amounting to £167,906 equating to 41.3% of the maximum opportunity and c.57.6% of salary. In line with the policy, two‑thirds of the bonus will be payable in cash and one‑third will be deferred into shares that vest after two years and are subject to forfeiture.
LTIPs An LTIP award of nil‑cost options granted to David Wild on 21 December 2015 will vest on 21 December 2018 and two‑thirds of tranche two of an LTIP award granted to Rachel Osborne on 13 October 2016 to compensate for share‑based incentives awarded at her previous employer will vest on 1 June 2018. The awards were based on performance over the three‑year period ending on 31 December 2017. The awards will vest partially according to the performance below.
50%: EPS performanceHalf of the award vests subject to growth in the Company’s adjusted EPS on the following basis:
MetricActual
performanceEPS performance
condition Maximum% of award
vesting
Three‑year adjusted earnings per share (‘EPS’) 75.5% growth 30% growth(10% vesting)
40% growth(45% vesting)
50% growth(80% vesting)
60% growth(100% vesting)
100%
Straight‑line vesting in between the performance points.
50%: TSR performanceThe remaining half of the award vests based on the following vesting schedule based on the Company’s TSR performance measures against the constituents of the FTSE 250 Index (excluding investment trusts) over three financial years:
MetricActual
performance Threshold Maximum% of award
vesting
Ranking of the Company’s TSR 56th of 183 Median(15% vesting)
Upper quartile1(100% vesting)
81.89%
1 Median ranking was 92 and upper quartile ranking was 46.25
Directors’ remuneration report continued

CORPORATE GOVERNANCE FINANCIAL STATEMENTSSTRATEGIC REPORT
Annual Report & Accounts 2017 Domino’s Pizza Group plc 61
Straight‑line vesting occurs between these points.
For reporting purposes the awards were valued using the three‑month average share price to 31 December 2017 (328.26p) plus a dividend equivalent award of £32,994.
Non-performance-related LTIP awardsTranche one of the LTIP award granted on 13 October 2016 to Rachel Osborne vested on 1 November 2017. This tranche was not subject to any performance criteria as agreed as part of Mrs Osborne’s compensation for forfeited awards from her former employment on joining the Company.
Share awards granted during the year (audited)Deferred Share Bonus PlanFor Rachel Osborne, the bonus in respect of 2016 performance was settled two‑thirds in cash and one‑third in shares, the receipt of the latter being deferred for two years.
The award granted in 2017 represents one‑third of the gross bonus due to Rachel Osborne for the financial year ended 25 December 2016.
DSBP Basis of award Face value * Number of shares Vesting date
Rachel Osborne 33.33% of ABP value £22,037 6,779 17/03/2019
* Based on a share price of 325.05p per share, being the average mid‑market price of the Company’s shares on 15 March 2017 and 16 March 2017.
This award, which is structured as a nil‑cost option, vests subject to continuous employment and no other performance criteria.
LTIP awards Details of the LTIP grant made on 15 August 2017 to Rachel Osborne are summarised below:
Executive Date of grant Type of awardNumber of
awards grantedFace value
of award *
Face value ofaward (as a %
of salary)Vesting %
at thresholdPerformance
periodPerformance
conditions
Rachel Osborne 15 August 2017 Conditionalaward of share
149,356 £406,248 125% 10–15% Three financialyears from
2017 to 2019
50%: EPSgrowth
50%: RTSR
* Based on a share price of 272p per share being the mid‑market price of the Company’s shares on 14 August 2017.
50%: earnings per share growth
Three‑year underlying EPS growth (over 2016 base year)Vesting
(% of EPS part of award)
Below 30% 0%30% 10%40% 45%50% 80%60% 100%
Straight-line vesting in between the performance points aboveThe above underlying EPS targets are considered to be appropriately demanding given the quantum of the awards proposed, current market expectations of the Company and internal long‑term planning.
50%: relative TSR performanceThe remaining half of the award will vest in accordance with the following vesting schedule based on the Company’s TSR performance against the constituents of the FTSE 250 Index, excluding investment trusts, over three financial years.
Ranking of the Company’s TSRVesting
(% of TSR part of award)
Below median 0%Median 15%Upper quartile or higher 100%
Straight-line vesting in between the performance points aboveIn choosing underlying EPS and TSR as the metrics, the Committee has sought to provide a balance between incentivising delivery against our key measure of success in delivering profitable growth (underlying EPS) and aligning the CFO and senior management with shareholders through a TSR measure.

CORPORATE GOVERNANCE
Domino’s Pizza Group plc Annual Report & Accounts 201762
Annual report on remuneration continuedDetails of variable pay earned in the year continuedAwards held in the year (audited)Details of options and conditional awards over shares held by Directors who served during the year are as follows:
Plan
Outstandingshares at
25 December 2016 1
Granted/awarded in
2017 (number)Exercised/
vested (number)Lapsed
(number)
Outstandingshares at
31 December 2017
Exerciseprice
(pence) Date of grant
Date from whichexercisable/
capableof vesting
David Wild2012 LTIP 541,515 — — — 541,515 n/a 30/05/14 30/05/172012 LTIP (additional award) 406,137 — — — 406,137 n/a 30/05/14 30/05/17Sharesave 8,448 — — — 213 29/04/15 01/06/18DSBP 40,098 — — — 40,098 n/a 21/12/15 27/02/172012 LTIP 227,679 — — — 227,679 n/a 21/12/15 21/12/18
DSBP 67,239 — — — 67,239 n/a 11/03/16 11/03/18
2016 LTIP all tranches 1,602,000 — — — 1,602,000 n/a 22/04/16 22/04/23
Rachel Osborne 2012 LTIP 68,953 — — — 68,953 n/a 13/10/16 13/10/192012 LTIP (additional award) 8,486 — — — 8,486 n/a 13/10/16 01/06/182012 LTIP (additional award) 37,482 — 37,482 — — n/a 13/10/16 01/11/17
2012 LTIP — 149,356 — — 149,356 n/a 15/08/17 15/08/20
DSBP — 6,779 — — 6,779 n/a 17/03/17 17/03/19
1 The 2012 LTIP rules were amended on 21 July 2017. The amendments provide that awards made under this scheme on or after 21 July 2017 are subject to a two‑year holding period and are subject to more stringent recovery and withholding provisions. The amendments enable the Committee to scale back (including to nil) the extent to which an award will vest prior to vesting (malus) and (i) extend the clawback period to three years after vesting, (ii) enable clawback in the event of gross misconduct that could have warranted summary dismissal from employment, and (iii) provide the ability to reduce the number of vested awards that remain subject to a holding period requirement.
Vesting of LTIP awards is subject to the achievement of performance conditions and continued employment. DSBP and Sharesave awards vest subject to continued employment only.
Dilution limitsThe Company operates within best practice guidelines published by the Investment Association. These broadly provide that where new issue shares are used to satisfy awards made under employee share schemes, the aggregate number of shares placed under award (disregarding any awards which have lapsed) across all such schemes operated by the Company should not exceed 10% of the Company’s issued share capital in any ten‑year rolling period.
Termination payments (audited)No payments were made to former Directors and there were no payments for loss of office during the year.
Directors’ shareholdings (audited)To reinforce the linkage between senior Executives and shareholders, the Company has adopted a shareholding policy that applies to Executive Directors under its long‑term incentive arrangements. The Executive Directors are required to retain sufficient shares from the vesting of awards to build up and retain a personal shareholding worth an equivalent of a minimum of 150% of base salary for Rachel Osborne and 200% of base salary for David Wild. It is expected that the required shareholding will be built up over a maximum of five years. The Committee has discretion to waive the shareholding requirement in exceptional circumstances. Once attained, a subsequent fall below the required level may be taken into account by the Committee when determining the grant of future awards.
Directors’ remuneration report continued

CORPORATE GOVERNANCE FINANCIAL STATEMENTSSTRATEGIC REPORT
Annual Report & Accounts 2017 Domino’s Pizza Group plc 63
The Committee has decided that awards made under the DSBP shall count (assuming the sale of sufficient shares to fund the employee’s tax and NI obligations) towards this target.
Legally ownedshares at
31 December 2017 (or earlier date of cessation)
Legally ownedshares at
25 December 2016 (or earlier date of cessation)
Conditional sharessubject to
performanceconditions
(2012 LTIP and 2016 LTIP)
Share optionsnot subject toperformance
conditions(DSBP/Sharesave)
Market valueof shareholdingas a % of salary 1
Executive DirectorsDavid Wild 13,650 13,650 2,777,331 115,785 48%Rachel Osborne 19,821 — 226,795 6,779 25%
Non-executive DirectorsStephen Hemsley2 1,800,000 1,800,000 — — n/aColin Halpern3 1,673,700 1,673,700 — — n/aHelen Keays — — — — n/aEbbe Jacobsen — — — — n/aKevin Higgins — — — — n/aSteve Barber — — — — n/a
Notes:
1 Based on a share price of 345.7p prevailing at the end of the financial year and the number of shares in which the Director has a beneficial interest and calculated on the salary paid in the year.
2 1,800,000 Ordinary shares (2016: 1,800,000) are held by The Stephen Hemsley No. 5 Trust, a discretionary trust of which Stephen Hemsley and his family are potential beneficiaries.
3 1,673,700 Ordinary shares (2016: 1,673,700) are held by HS Real LLC. HS Real LLC is owned by a discretionary trust, the beneficiaries of which are the adult children of Colin and Gail Halpern.
External appointmentsDuring the year, David Wild was appointed as senior independent director at Ten Entertainment Group and subsequently retired as a non‑executive director from the board of The Bankers Investment Trust PLC on 21 February 2018. David Wild retained fees from his external appointments which amounted to £62,424 (2016: £24,748).
CEO remuneration
Year ended Chief Executive Officer
Totalremuneration
£000Annual bonus
(% of max)LTIP vesting
(% of max)
31 December 2017 David Wild 1,597 50.91% 90.95%25 December 20161 David Wild 4,482 81% 100%27 December 2015 David Wild 1,243 87.5% —28 December 2014 David Wild 864 58.6% —29 December 20132 Lance Batchelor 532 0% —30 December 2012 Lance Batchelor 852 50% —25 December 2011 Lance Batchelor 256 60% —25 December 2011 Chris Moore 630 60% 100%26 December 2010 Chris Moore 809 100% 100%
1 The first LTIP awards granted to the current CEO that become capable of vesting based on performance ending in FY16 were in 2014 and these have been included in the above table.
2 Lance Batchelor resigned as CEO on 16 March 2014. David Wild assumed the position of Interim CEO on 31 January 2014 and his appointment as the Group’s CEO was formally confirmed on 30 April 2014. For comparative purposes the total remuneration shown for the year ended 28 December 2014 includes remuneration received in both roles.
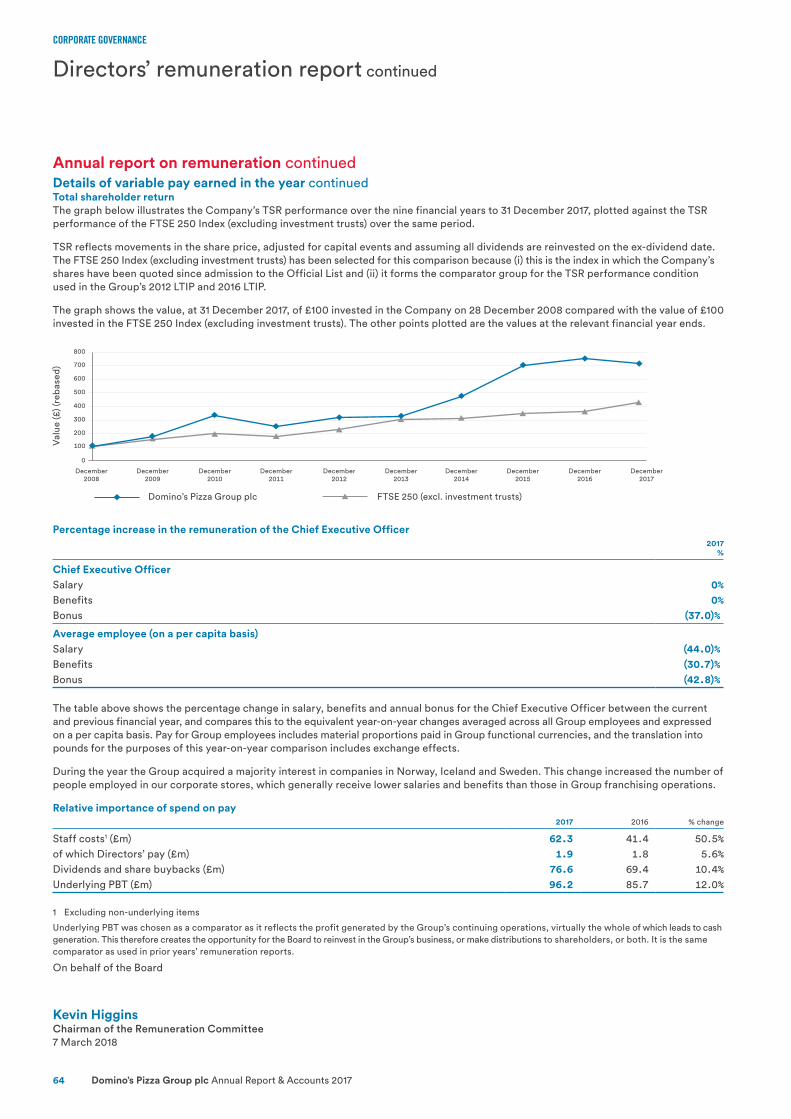
CORPORATE GOVERNANCE
Domino’s Pizza Group plc Annual Report & Accounts 201764
Annual report on remuneration continuedDetails of variable pay earned in the year continuedTotal shareholder returnThe graph below illustrates the Company’s TSR performance over the nine financial years to 31 December 2017, plotted against the TSR performance of the FTSE 250 Index (excluding investment trusts) over the same period.
TSR reflects movements in the share price, adjusted for capital events and assuming all dividends are reinvested on the ex‑dividend date. The FTSE 250 Index (excluding investment trusts) has been selected for this comparison because (i) this is the index in which the Company’s shares have been quoted since admission to the Official List and (ii) it forms the comparator group for the TSR performance condition used in the Group’s 2012 LTIP and 2016 LTIP.
The graph shows the value, at 31 December 2017, of £100 invested in the Company on 28 December 2008 compared with the value of £100 invested in the FTSE 250 Index (excluding investment trusts). The other points plotted are the values at the relevant financial year ends.
Percentage increase in the remuneration of the Chief Executive Officer2017
%
Chief Executive OfficerSalary 0%Benefits 0%Bonus (37.0)%
Average employee (on a per capita basis)Salary (44.0)%Benefits (30.7)%Bonus (42.8)%
The table above shows the percentage change in salary, benefits and annual bonus for the Chief Executive Officer between the current and previous financial year, and compares this to the equivalent year‑on‑year changes averaged across all Group employees and expressed on a per capita basis. Pay for Group employees includes material proportions paid in Group functional currencies, and the translation into pounds for the purposes of this year‑on‑year comparison includes exchange effects.
During the year the Group acquired a majority interest in companies in Norway, Iceland and Sweden. This change increased the number of people employed in our corporate stores, which generally receive lower salaries and benefits than those in Group franchising operations.
Relative importance of spend on pay2017 2016 % change
Staff costs1 (£m) 62.3 41.4 50.5%of which Directors’ pay (£m) 1.9 1.8 5.6%Dividends and share buybacks (£m) 76.6 69.4 10.4%Underlying PBT (£m) 96.2 85.7 12.0%
1 Excluding non‑underlying items
Underlying PBT was chosen as a comparator as it reflects the profit generated by the Group’s continuing operations, virtually the whole of which leads to cash generation. This therefore creates the opportunity for the Board to reinvest in the Group’s business, or make distributions to shareholders, or both. It is the same comparator as used in prior years’ remuneration reports.
On behalf of the Board
Kevin HigginsChairman of the Remuneration Committee7 March 2018
Directors’ remuneration report continuedV
alue
(£) (
reb
ased
)
800
700
600
500
400
300
200
100
0
December 2008
December 2009
December 2010
December 2011
December 2012
December 2013
December 2014
December 2015
December 2016
December 2017
Domino’s Pizza Group plc FTSE 250 (excl. investment trusts)

CORPORATE GOVERNANCE FINANCIAL STATEMENTSSTRATEGIC REPORT
Annual Report & Accounts 2017 Domino’s Pizza Group plc 65
The Directors have pleasure in presenting the statutory financial statements for the Group for the 53 weeks ended 31 December 2017.
The Company has chosen in accordance with section 414C(11) of the Companies Act 2006 to include the disclosure of likely future developments in the strategic report (on pages 2 to 33), which includes the following:
• the Chairman’s statement on pages 2 and 3;
• a description of the market on pages 6 and 7;
• the Chief Executive Officer’s review on pages 8 to 12;
• a description of the business structure, model and strategy on pages 13 to 15;
• the Chief Financial Officer’s review on pages 16 to 19;
• the key performance indicators on pages 20 and 21;
• the discussion of risk management, the table of principal risks and uncertainties and the longer‑term viability statement on pages 22 to 27; and
• the corporate social responsibility report on pages 28 to 33.
Together, this information is intended to provide a fair, balanced and understandable analysis of the development and performance of the Group’s business during the year, and its position at the end of the year, its strategy, likely developments and any principal risks and uncertainties associated with the Group’s business.
The sections of the Annual Report dealing with corporate governance, the reports of the Nomination Committee and Audit Committee and the Directors’ remuneration report set out on pages 36 to 64 inclusive are hereby incorporated by reference into this Directors’ report.
For the purposes of compliance with DTR 4.1.5R(2) and DTR 4.1.8R, the required content of the “management report” can be found in the strategic report and Directors’ report including the sections of the Annual Report & Accounts incorporated by reference.
For the purposes of LR 9.8.4CR, the information required to be disclosed by LR 9.8.4R can be found in the following locations:
Section topic Location
(1) Interest capitalised Note 16 to the accounts(2) Publication of unaudited financial information Not applicable(4) Details of long‑term incentive schemes Remuneration report(5) Waiver of emoluments by a Director Not applicable(6) Waiver of future emoluments by a Director Not applicable(7) Non‑pre‑emptive issues of equity for cash Not applicable(8) Item (7) in relation to major subsidiary undertakings Not applicable(9) Parent participation in a placing by a listed subsidiary Not applicable(10) Contracts of significance Directors’ report(11) Provision of services by a controlling shareholder Not applicable(12) Shareholder waivers of dividends Directors’ report(13) Shareholder waivers of future dividends Directors’ report(14) Agreements with controlling shareholders Not applicable
All the information cross‑referenced above is hereby incorporated by reference into this Directors’ report.
Directors’ report
Group resultsThe Group profit for the period from continuing operations after taxation was £66.8m (2016: £65.2m). This is after a taxation charge of £14.4m (2016: £17.3m) representing an underlying effective tax rate of 18.3% (2016: 20.3%). The financial statements setting out the results of the Group for the 53 weeks ended 31 December 2017 are shown on pages 77 to 132.
Dividends The Directors recommend the payment of a final dividend of 5.25p per Ordinary share, to be paid on 24 April 2018 to members on the register at the close of business on 16 March 2018 (ex‑dividend date 15 March 2018), subject to shareholder approval. Together with the interim dividend of 3.75p per Ordinary share paid on 1 September 2017, the total dividend in respect of the period will be 9.0p compared with 8.0p for the previous year, an increase of 12.5%.
Dividends are recognised in the accounts in the year in which they are paid or, in the case of the final dividend, when approved by shareholders. Therefore, the amount recognised in the 2017 accounts, as described in note 14 on page 101, comprises the 2016 final dividend and the 2017 interim dividend.
Share capitalAs at 31 December 2017, the Company’s authorised share capital was £4,000,000 divided into a single class of 768,000,000 Ordinary shares of 25/48p each and there were 486,834,530 Ordinary shares in issue. All issued Ordinary shares are fully paid up.
The Ordinary shares are listed on the London Stock Exchange and can be held in certificated or uncertificated form.
Holders of Ordinary shares are entitled to attend and speak at general meetings of the Company, to appoint one or more proxies and, if they are corporations, corporate representatives who are entitled to attend general meetings and to exercise voting rights.
On a show of hands at a general meeting of the Company every holder of Ordinary shares present in person or by proxy and entitled to vote shall have one vote, unless the proxy is appointed by more than one shareholder and has been instructed by one or more shareholders to vote for the resolution and by one or more shareholders to vote against the resolution, in which case the proxy has one vote for and one vote against. This reflects the position in the Shareholders’ Rights Regulations 2009 which amended the Companies Act 2006. On a poll, every member present in person or by proxy and entitled to vote shall have one vote for every Ordinary share held. None of the Ordinary shares carry any special voting rights with regard to control of the Company. The Articles specify deadlines for exercising voting rights and appointing a proxy or proxies to vote in relation to resolutions to be passed at the AGM. The relevant proxy votes are counted and the number for, against or withheld in relation to each resolution are announced at the AGM and published on the Company’s website after the meeting.
CORPORATE GOVERNANCE
Domino’s Pizza Group plc Annual Report & Accounts 201766
Share capital continuedThere are no restrictions on the transfer of Ordinary shares in the Company other than certain restrictions that may be imposed from time to time by the Articles, law or regulation and pursuant to the Listing Rules whereby certain Directors, officers and employees require approval to deal in Ordinary shares of the Company. The Group is not aware of any agreements between holders of securities that may result in restrictions on the transfer of Ordinary shares.
Shares held by employee share trusts The Group has had an employee benefit trust (‘EBT’) for a number of years, the trustee of which is Intertrust Fiduciary Services (Jersey) Limited. As at 31 December 2017, the EBT held 2,114,550 shares, which are used to satisfy awards under employee share schemes. The voting rights in relation to these shares are exercisable by the trustee; however, in accordance with best practice guidance, the trustee abstains from voting.
Dividend waivers A dividend waiver is in force in relation to shares in the Company held by the EBT (see previous paragraph), which relates to a total of 2,114,550 shares.
Purchase of own sharesAt the 2017 AGM, a special resolution was passed to authorise the Company to make purchases on the London Stock Exchange of up to 10% of its Ordinary shares for the year under review. The Company engages in share buybacks to create value for shareholders when cash flows permit and there is no immediate alternative investment use for the funds. Shareholders will be requested to renew this authority at the forthcoming AGM, to be held on 19 April 2018.
During the year the Company made purchases of 7,849,454 Ordinary shares with a nominal value of £40,882. Since the year end the Company has made purchases over 5,310,000 Ordinary shares with a nominal value of £27,656, under the terms of the Share Purchase Programme announced on 15 December 2017.
Directors and their interestsThe Directors in service at 31 December 2017 were Stephen Hemsley, Colin Halpern, David Wild, Rachel Osborne, Helen Keays, Ebbe Jacobsen, Kevin Higgins and Steve Barber.
The biographical details of the present Directors are set out on pages 34 and 35 of this Annual Report.
The appointment and replacement of Directors is governed by the Articles of the Company, the UK Corporate Governance Code, the Companies Act 2006 and related legislation. Subject to the Articles of Association, the Companies Act 2006 and any directions given by special resolution, the business of the Company is managed by the Board, which may exercise all the powers of the Company.
The interests of Directors and their immediate families in the shares of the Company, along with details of options and awards held by Executive Directors, are contained in the Directors’ remuneration report set out on pages 46 to 64. Should any Ordinary shares be required to satisfy awards over shares, these may be provided by the EBT.
There have not been any changes in the interests of the Directors, including share options and awards, in the share capital of the Company between the year end and 8 March 2018. None of the Directors have a beneficial interest in the shares of any subsidiary.
In line with the Companies Act 2006, the Board has clear procedures for Directors to formally disclose any actual or potential conflicts to the whole Board for authorisation as necessary. All new conflicts are required to be disclosed as and when they arise.
There is an annual review of conflicts disclosed and authorisations given. The register of Directors’ conflicts is maintained by the Company Secretary.
Directors’ indemnities The Directors have the benefit of an indemnity provision contained in the Articles of Association. The provision, which is a qualifying third‑party indemnity provision (as defined by section 234 of the Companies Act 2006), was in force during the year ended 31 December 2017 and remains in force and relates to certain losses and liabilities which the Directors may incur to third parties in the course of acting as Directors or employees of the Company.
The Group maintained a directors’ and officers’ liability insurance policy throughout the financial year, although no cover exists in the event that Directors or officers are found to have acted fraudulently or dishonestly. No indemnity is provided for the Group’s auditor.
EmployeesThe Group employed 3,490 people as at 31 December 2017 (2016: 999 – including discontinued operations).
Employment policiesThe Group is committed to the principle of equal opportunity in employment. The Group recruits and selects applicants for employment based solely on a person’s qualifications and suitability for the position, whilst bearing in mind equality and diversity. It is the Group’s policy to recruit the most capable person available for each position. The Group recognises the need to treat all employees honestly and fairly. The Group is committed to ensuring that its employees feel respected and valued and are able to
Directors’ report continued
Substantial shareholdings As at 7 March 2018, the Company had been notified, in accordance with the FCA’s Disclosure, Guidance and Transparency Rules, of the following holdings of voting rights attaching to the Company’s shares:
Number ofshares
% of total voting rights
as at31 December 2017
% of total voting rights
as at7 March 2018
OppenheimerFunds, Inc. 55,042,305 11.31 11.31MFS Investment Management 48,991,388 10.06 10.06Vontobel Asset Management, Inc. 16,576,163 3.40 n/a
On 6 March 2018 the Company was notified by Vontobel Asset Management Inc, that it no longer had a notifiable interest.
No other notifications under DGTR 5.3.1R(1) have been received since 31 December 2017.
CORPORATE GOVERNANCE FINANCIAL STATEMENTSSTRATEGIC REPORT
Annual Report & Accounts 2017 Domino’s Pizza Group plc 67
fulfil their potential and recognises that the success of the business relies on their skill and dedication.
The Group gives full and fair consideration to applications for employment from disabled persons, with regard to their particular aptitudes and abilities. Efforts are made to continue the employment of those who become disabled during their employment.
For more information on the Company’s employment practices please see page 31.
General informationAnnual General MeetingThe notice convening the AGM to be held at 12.00 noon on 19 April 2018 at the Company’s Supply Chain Centre, 1 Thornbury, West Ashland, Milton Keynes MK6 4BB, is contained in a separate shareholder circular. Full details of all resolutions to be proposed are provided in that document. The Directors consider that all of the resolutions set out in the Notice of AGM are in the best interests of the Company and its shareholders as a whole. The Directors will be voting in favour of them and unanimously recommend that shareholders vote in favour of each of them.
Significant agreements and change of control provisionsThe Group judges that the only significant agreements in relation to its business are the UK and ROI Master Franchise Agreement, the Know How Licence Agreement and the Switzerland, Luxembourg and Liechtenstein Master Franchise Agreement pursuant to which certain of the Group’s companies are granted the right to franchise stores and operate commissaries in the territories by Domino’s Pizza International Franchising Inc.
The Group’s significant agreements listed above do not terminate on a change of control. The Group does not have agreements with any Director or employee that would provide compensation for loss of office or employment resulting from a takeover except that provisions of the Group’s employee share schemes may cause options and awards granted to employees, including Directors, to vest on a change of control. The Group’s banking arrangements do contain change of control provisions which, if triggered, could limit future utilisations, require the repayment of existing utilisations or lead to a renegotiation of terms.
As discussed more fully on page 82 in Note 2: Accounting policies in the section on key judgements and estimates, the Chairman and certain former directors entered into indemnity contracts with the Group in connection with their participation in some historic share based remuneration schemes. A provision for employment taxes amounting to £11.0m has been recorded in these financial statements, of which the Company has estimated that £9 million could be recoverable under the indemnities. The amount that the company has estimated it would recover from the Chairman under the indemnity with him, and based on the amount provided, equates to approximately £3m.
Articles of AssociationThe Articles of Association remained unchanged during the 2017 financial year and can only be amended by special resolution at a general meeting of the shareholders. A resolution to adopt new Articles of Association will be put to shareholders at the AGM in 2018.
BranchesDomino’s Pizza Germany Limited (a subsidiary company of the Company) closed its German Branch, Domino’s Pizza Deutschland on 26 June 2016.
Environmental and social responsibility and GHG emissionsThe Group acknowledges that it is part of a wider community and recognises that it has a responsibility to act in ways that respect the environment and the social wellbeing of others. Details of the Group’s approach to these issues and emissions attributable to all activities are set out in the corporate social responsibility report on pages 28 to 33.
Political donations The Company made no political donations in the year (2016: £nil).
Key performance indicators (‘KPIs’)Details of the Group’s KPIs can be found on pages 20 and 21.
AuditorEY has signified its willingness to continue in office as auditor to the Company and the Group is satisfied that EY is independent and there are adequate safeguards in place to safeguard its objectivity. A resolution to re‑appoint EY as the Company’s auditor will be proposed at the 2018 AGM.
On 8 December 2017, the Company announced its intention to appoint PwC as external auditor commencing with the financial year ending on 29 December 2019. A formal recommendation regarding the new appointment will be put to shareholders at the Company’s AGM to be held in 2019.
Directors’ statement of disclosure of information to auditorHaving made the requisite enquiries, the Directors in office at the date of this Annual Report and Accounts have each confirmed that, so far as they are aware, there is no relevant audit information of which the Group’s auditor is unaware and each Director has taken all the steps he/she ought to have taken as a Director to make himself/herself aware of any relevant audit information and to establish that the Group’s auditor is aware of that information.
Going concernThe Company’s business activities, together with the factors likely to affect its future development, performance and position, are set out in the strategic report on pages 2 to 33. The financial position of the Company, its cash flows, liquidity position and borrowing facilities are described in the financial review on pages 16 to 19.
In addition, notes 28 and 29 to the Group financial statements include the Company’s objectives, policies and processes for managing its capital, its financial risk management objectives, details of its financial instruments and hedging activities and its exposures to credit risk and liquidity risk.
The Directors have a reasonable expectation that the Company has adequate resources to continue in operational existence for the foreseeable future and have therefore continued to adopt the going concern basis in preparing the financial statements.
Cautionary statementThis Annual Report and Accounts contains forward‑looking statements. These forward‑looking statements are not guarantees of future performance; rather, they are based on current views and assumptions as at the date of this Annual Report and Accounts and are made by the Directors in good faith based on the information available to them at the time of their approval of this report. These statements should be treated with caution due to the inherent risks and uncertainties underlying any such forward‑looking information. The Group undertakes no obligation to update these forward‑looking statements.
By order of the Board
Adrian BushnellCompany Secretary7 March 2018
CORPORATE GOVERNANCE
Domino’s Pizza Group plc Annual Report & Accounts 201768
Directors’ responsibility statementThe Directors are responsible for preparing the Annual Report & Accounts, the Directors’ remuneration report and the financial statements (Group and Company) in accordance with applicable UK laws and regulations. UK company law requires the Directors to prepare financial statements for each financial year. Under that law, the Directors have prepared the Group financial statements in accordance with International Financial Reporting Standards as adopted by the European Union (‘IFRS’) and applicable UK law. Further, they have elected to prepare the Company financial statements in accordance with UK accounting standards (UK GAAP) and applicable UK law.
Under company law the Directors must not approve the financial statements unless they are satisfied that they are a true and fair view of the Group and Company and of the profit or loss of the Group for that period.
In preparing the Group financial statements, the Directors are required to:
• select suitable accounting policies in accordance with IAS 8 (Accounting Policies, Changes in Accounting Estimates and Errors) and then apply them consistently;
• present information, including accounting policies, in a manner which presents relevant, reliable, comparable and understandable information;
• provide additional disclosures when compliance with the specific requirements in IFRS is insufficient to enable users to understand the impact of particular transactions, other events and conditions on the Group’s financial position and financial performance; and
• state that the Group has complied with IFRS, subject to any material departures disclosed and explained in the financial statements.
In preparing the Company financial statements, the Directors are required to:
• select suitable accounting policies and apply them consistently;
• make judgements and estimates that are reasonable and prudent;
• state whether applicable UK Accounting Standards have been followed, subject to any material departures disclosed and explained in the financial statements; and
• prepare the financial statements on the going concern basis unless it is inappropriate to presume that the Company will continue in business.
The Directors are responsible for keeping adequate accounting records that disclose with reasonable accuracy at any time the financial position of the Company and the Group and enable them to ensure that the Annual Report & Accounts and financial statements comply with the Companies Act 2006 and, with regard to the Group financial statements, Article 4 of the IAS Regulation. They are also responsible for the system of internal control for safeguarding the assets of the Company and the Group and hence for taking reasonable steps to prevent and detect fraud and other irregularities.
A copy of the financial statements of the Company is posted on the Company’s website. The Directors are responsible for the maintenance and integrity of the corporate and financial information included on the website. Information published on the Company’s website is accessible in many countries with different legal requirements. Legislation in the United Kingdom governing the preparation and dissemination of financial statements may differ from legislation in other jurisdictions.
DTR 4.1 statementEach of the Directors, the names and functions of whom are set out on pages 34 and 35, confirms that, to the best of their knowledge, they have complied with the above requirements in preparing the financial statements in accordance with applicable accounting standards and that the financial statements give a true and fair view of the assets, liabilities, financial position and profit of the Group and the Company and of the Group’s income statement for that period. In addition, each of the Directors confirms that the strategic report represented by the Directors’ report includes a fair review of the development and performance of the business and the position of the Company and Group, together with a description of the principal risks and uncertainties that it faces.
The Directors are responsible for preparing the Annual Report in accordance with applicable law and regulations. Having taken advice from the Audit Committee, the Board considers the Annual Report & Accounts, taken as a whole, to be fair, balanced and understandable and that it provides the information necessary for the shareholders to assess the Company’s and Group’s performance, business model and strategy.
Signed on behalf of the Board
David WildChief Executive Officer7 March 2018
Statement of Directors’ responsibilities
CORPORATE GOVERNANCE FINANCIAL STATEMENTSSTRATEGIC REPORT
Annual Report & Accounts 2017 Domino’s Pizza Group plc 69
Basis for opinion We conducted our audit in accordance with International Standards on Auditing (UK) (ISAs (UK)) and applicable law. Our responsibilities under those standards are further described in the Auditor’s responsibilities for the audit of the financial statements section of our report below. We are independent of the group and parent company in accordance with the ethical requirements that are relevant to our audit of the financial statements in the UK, including the FRC’s Ethical Standard as applied to listed public interest entities, and we have fulfilled our other ethical responsibilities in accordance with these requirements.
We believe that the audit evidence we have obtained is sufficient and appropriate to provide a basis for our opinion.
Use of our reportThis report is made solely to the company’s members, as a body, in accordance with Chapter 3 of Part 16 of the Companies Act 2006. Our audit work has been undertaken so that we might state to the company’s members those matters we are required to state to them in an auditor’s report and for no other purpose. To the fullest extent permitted by law, we do not accept or assume responsibility to anyone other than the company and the company’s members as a body, for our audit work, for this report, or for the opinions we have formed.
Independent auditor’s reportto the members of Domino’s Pizza Group plc
OpinionIn our opinion:
• Domino’s Pizza Group plc’s group financial statements and parent company financial statements (the “financial statements”) give a true and fair view of the state of the group’s and of the parent company’s affairs as at 31 December 2017 and of the group’s profit for the year then ended;
• the group financial statements have been properly prepared in accordance with IFRSs as adopted by the European Union;
• the parent company financial statements have been properly prepared in accordance with United Kingdom generally accepted accounting practice including FRS 101; and
• the financial statements have been prepared in accordance with the requirements of the Companies Act 2006, and, as regards the group financial statements, Article 4 of the IAS Regulation.
We have audited the financial statements of Domino’s Pizza Group plc which comprise:
Group Parent company
Consolidated balance sheet as at 31 December 2017
Balance sheet as at 31 December 2017
Consolidated income statement for the 53 week period then ended
Consolidated statement of comprehensive income for the 53 week period then ended
Consolidated statement of changes in equity for the 53 week period then ended
Statement of changes in equity for the 53 week period then ended
Consolidated statement of cash flows for the 53 week period then ended
Related notes 1 to 37 to the financial statements, including a summary of significant accounting policies
Related notes C1 to C12 to the financial statements including a summary of significant accounting policies
The financial reporting framework that has been applied in their preparation is applicable law and International Financial Reporting Standards (IFRSs) as adopted by the European Union and, as regards the parent company financial statements, as applied in accordance with the provisions of the Companies Act 2006.
Conclusions relating to principal risks, going concern and viability statementWe have nothing to report in respect of the following information in the annual report, in relation to which the ISAs(UK) require us to report to you whether we have anything material to add or draw attention to:
• the disclosures in the annual report set out on pages 22 to 26 that describe the principal risks and explain how they are being managed or mitigated;
• the directors’ confirmation set out on page 22 in the annual report that they have carried out a robust assessment of the principal risks facing the entity, including those that would threaten its business model, future performance, solvency or liquidity;
• the directors’ statement set out on pages 67 and 68 in the financial statements about whether they considered it appropriate to adopt the going concern basis of accounting in preparing them, and their identification of any material uncertainties to the entity’s ability to continue to do so over a period of at least twelve months from the date of approval of the financial statements;
• whether the directors’ statement in relation to going concern required under the Listing Rules in accordance with Listing Rule 9.8.6R(3) is materially inconsistent with our knowledge obtained in the audit; or
• the directors’ explanation set out on pages 27 and 68 in the annual report as to how they have assessed the prospects of the entity, over what period they have done so and why they consider that period to be appropriate, and their statement as to whether they have a reasonable expectation that the entity will be able to continue in operation and meet its liabilities as they fall due over the period of their assessment, including any related disclosures drawing attention to any necessary qualifications or assumptions.
FINANCIAL STATEMENTS
Domino’s Pizza Group plc Annual Report & Accounts 201770
Overview of our audit approachKey audit matters • Reversionary interest share-based compensation scheme taxation
• Susceptibility to management override in recharging expenditure incurred by the group to the National Advertising Fund
• Susceptibility to management override in the recognition of revenue through manual journals
• Appropriate classification and disclosure of non-underlying items
• Impairment of acquired goodwill and intangible assets
Audit scope • We performed an audit of the complete financial information of 5 components and audit procedures on specific balances for a further 6 components.
• The components where we performed full or specific audit procedures accounted for 100% of Profit before non-underlying items and taxation from continuing operations, 98% of Revenue and 97% of Total assets.
Materiality • Overall group materiality of £4.8m which represents 5% of profit before non-underlying items and taxation from continuing operations.
Key audit mattersKey audit matters are those matters that, in our professional judgement, were of most significance in our audit of the financial statements of the current period and include the most significant assessed risks of material misstatement (whether or not due to fraud) that we identified. These matters included those which had the greatest effect on: the overall audit strategy, the allocation of resources in the audit; and directing the efforts of the engagement team. These matters were addressed in the context of our audit of the financial statements as a whole, and in our opinion thereon, and we do not provide a separate opinion on these matters.
Risk Our response to the riskKey observations communicated to the Audit Committee
Risk movement
Reversionary interest share-based compensation scheme taxationRefer to the Directors’ Remuneration Report (page 59), Directors’ Report (page 67), Audit Committee Report (page 43); Accounting policies (page 82); and Note 27 and 37 of the Consolidated Financial Statements (page 113 and 124, respectively).
Certain of the Group’s historic share-based compensation arrangements dating from 2003 to 2010 involved the use of employee benefit trusts which provided award recipients with reversionary interests in the form of share appreciation rights. Significant judgement is required to determine the treatment of such compensation from an employment tax perspective.
There is a risk that if HMRC were to reach a different judgement on the employment tax treatment of the compensation arrangements, this may give rise to material adverse income statement and/or cash flow variances.
During 2017, the Group updated its legal advice following recent decisions by the Supreme Court concerning the taxation of historic remuneration structures. This advice was received in January 2018.
A provision of £11m has been recorded in the year based upon management’s estimate of the gross tax that may become payable to HMRC.
The Chairman and certain other former directors and employees were award recipients. They have provided indemnities to the group in respect of future employment tax payable by the group on their awards. No asset has been recognised in respect of amounts recoverable under these indemnities as the recoverability of such amounts is not yet virtually certain.
We have inspected a sample of the compensation contracts to gain an understanding of the commercial purpose of the awards.
We examined historic correspondence between HMRC and the Group to understand the latest views of HMRC on management’s tax treatment of the awards.
We have involved our remuneration tax specialists to support us in corroborating the advice provided to the Group by the Group’s legal and tax advisers with regard to the effectiveness of the design and implementation of the schemes. We corroborated our understanding of the advice given to the Group by reading the report they issued to Group management, requesting a legal letter and inspecting the source documentation provided to the advisers to corroborate that it was an appropriate basis upon which to provide their legal advice.
We re-performed the calculation of the estimated employment tax payable, corroborated the source data used in the calculation to the protective assessments issued by HMRC and performed an independent assessment of the interest payable. We compared the basis upon which the tax provision has been calculated to equivalent case law to assess the appropriateness of management’s judgement.
We have inspected professional advice in respect of the effectiveness of indemnity arrangements provided to the Group from award recipients to understand whether the asset recognition criteria had been met.
We have compared the disclosures made by management in the financial statements, with the requirements of IFRS and Company Law, specifically including IAS 24 – Related Party Disclosures, IAS 37 – Provisions, Contingent Liabilities and Contingent Assets, Companies Act 2006 and the Listing Rule requirements.
We concur with management’s conclusion that the recent legal advice provides a basis upon which a reasonable estimate of the probable liability to HMRC can be made.
We consider the disclosures in respect of key judgements, directors’ remuneration, related party transactions and provisions proposed by management to be in accordance with the relevant accounting standards and company law.
Independent auditor’s report continuedto the members of Domino’s Pizza Group plc

CORPORATE GOVERNANCE FINANCIAL STATEMENTSSTRATEGIC REPORT
Annual Report & Accounts 2017 Domino’s Pizza Group plc 71
Risk Our response to the riskKey observations communicated to the Audit Committee
Risk movement
National Advertising Fund expenditureRefer to the Accounting policies (page 87); and Note 18 of the Consolidated Financial Statements (page 104)
Franchisees pay contributions which are collected by the Group for specific use within the National Advertising Fund (‘NAF’). The fund is operated by the Group on behalf of franchisees with the objective of driving revenues for their stores. Total contributions made to the NAF for the 53 week period amounted to £46.8m (2016: £41.5m) and the NAF balance at 31 December 2017 was a receivable of £3.9m (2016: £1.9m creditor).
The NAF is governed by a framework. The description of activities to be expensed against the fund is such that judgement is required to determine the appropriateness of the nature and extent of costs to be recharged from the Group to the fund. The recharging of expenditure incurred by the Group on behalf of the NAF is susceptible to management override through inappropriate expenditure being charged to the National Advertising Fund (NAF).
We performed testing to confirm that costs charged to the fund are permitted costs under the fund rules by selecting a sample of expenses and corroborating to supporting documentation.
We identified manual journals posted to the NAF fund and, where significant, understood the rationale for the journal entry and agreed the journals to relevant supporting documentation.
We performed a proof in total of credits to the NAF based upon a fixed percentage of system sales. System sales were substantively tested by selecting a sample of items to test to supporting documentation.
We identified no material expenses which had been inappropriately charged against the NAF.
Revenue recognitionRefer to the Accounting policies (page 89); and Note 3 Revenue of the Consolidated Financial Statements (page 91).
Total Group revenue is £474.6m (2016: £360.6m). The Group’s significant revenue streams include royalties, corporate store sales, sales to franchisees and rental income.
We continue to assess revenue recognition as an area of audit risk which has a significant effect on our audit strategy and our allocation of resources.
There is a risk of misstatement of revenue arising from the susceptibility to management override through recording of inappropriate manual journals.
We performed detailed testing over revenue recognition as follows:
For 3 of the full scope components (representing 85% of applicable group revenues), we used data analysis tools to analyse all of the revenue transactions for the royalties, franchise fees and sales to franchisees (excluding rebates) for the year. We tested the correlation of revenue to cash receipts to verify the occurrence of revenue. For those full or specific-scope components where we did not use data analysis tools, we performed alternative substantive procedures over revenue recognition, including tracing from origination of revenue through to the general ledger to ensure that the revenue was appropriately recorded in the correct period and at the correct value.
In addition, we performed analytical procedures using the inter-relationship of system sales, royalty income and sales to franchisees to analyse movements in revenue year on year.
In the execution of our journal entry testing, we performed testing over manual journal entries recorded for each revenue stream. We checked these journals to supporting documentation and validated that the revenue recognition criteria were fulfilled to gain assurance over the occurrence assertion and that the values assigned were correct to provide assurance over the measurement assertion.
Revenue was recognised in accordance with the Group’s accounting policies and we identified no evidence of management override in respect of inappropriate manual journals recorded in revenue.
Non-underlying itemsRefer to the Accounting policies (page 90); and Note 7 Non-underlying items of the Consolidated Financial Statements (page 96).
At the half year, £1.6m of non-underlying gains were recorded. Further gains of £1m and expenses of £17.6m were recorded in the second half of the year.
The Group’s accounting policy is to present separately, as non-underlying items, income and expenses where such disclosure is considered useful to the users of the financial statements in helping them understand the underlying business performance.
Non-underlying items are not defined by IFRS and therefore judgement is required in determining the appropriateness of such classification. Such judgement may be susceptible to management bias.
We have examined the items classified as non-underlying to understand management’s rationale for the separate presentation and assessed the appropriateness of the presentation by reference to the Group’s accounting policies and the FRC guidance in this area.
We traced the amounts presented as non-underlying items to supporting evidence to assess the occurrence and measurement of the items was appropriate. We assessed whether items classified within underlying operations, met the definition of “non-underlying”.
We reviewed the disclosures regarding items classified as non-underlying, with a focus on whether they provide an understanding of why they are excluded from underlying performance and can be linked to a statutory measure.
The income and expenses presented as non-underlying items are consistent with the group’s accounting policy.
Key audit matters continued
FINANCIAL STATEMENTS
Domino’s Pizza Group plc Annual Report & Accounts 201772
Risk Our response to the riskKey observations communicated to the Audit Committee
Risk movement
Impairment of acquired Goodwill and Intangible AssetsRefer to the Accounting policies (page 85); and Note 15 Intangible Assets of the Consolidated Financial Statements (page 102).
Following the acquisition of controlling stakes within Iceland, Norway and Sweden and the acquisition of a 75% stake in a London franchisee, goodwill of £50.7m and intangible assets of £45.5m have been recognised during the year.
As the Nordic businesses and Iceland represent new, less established markets for the group, judgement is required to establish the cashflow forecasts and impairment model. The acquisition of an existing franchisee increases the exposure to corporate store performance forecasting. These judgements are susceptible to management bias and execution risk.
We obtained the impairment analyses produced by management and tested the logical and arithmetic accuracy and to ensure that they had been prepared in line with the guidance provided in IAS 36.
We compared the performance of each acquired business in 2017 to management’s due diligence and investment appraisal models produced ahead of the acquisition dates, in order to identify bias within management’s impairment model assumptions.
We performed procedures to obtain an understanding of the underlying assumptions made in the forecasts and corroborated the appropriateness of these assumptions to supporting documentation.
The key assumptions included:
• Discount rates
• Medium-term growth rates
In respect of the discount rates, an independent assessment was made based on general market indicators.
We tested the reasonableness of medium-term growth rates by examining for consistency against the strategic and operational plans designed and implemented by management.
We performed sensitivity analysis over the key assumptions within the impairment models.
The cash flow projections prepared by management support the carrying value of the acquired goodwill and intangible assets.
A reasonable possible change in a key assumption would not give rise to a material impairment adjustment in the financial statements.
In the prior year, our auditor’s report included a key audit matter in relation to distributions made other that in compliance with the Companies Act. As a result of the EGM in January 2017 and steps taken by the directors to ensure that sufficient distributable reserves are available prior to a distribution, we do not consider this to be a key audit matter in the current year.
In the prior year, our auditor’s report also included a key audit matter in relation to the risk of impairment of the intangible and PPE related to the business in Switzerland. We have reassessed this risk and based on operational and strategic actions taken by management, recent trading performance, headroom (please see note 15) and our current audit work, we no longer consider it an area of significant risk.
No additional Key Audit Matters have been identified for the Parent Company audit.
Independent auditor’s report continuedto the members of Domino’s Pizza Group plc
Key audit matters continued

CORPORATE GOVERNANCE FINANCIAL STATEMENTSSTRATEGIC REPORT
Annual Report & Accounts 2017 Domino’s Pizza Group plc 73
An overview of the scope of our auditTailoring the scopeOur assessment of audit risk, our evaluation of materiality and our allocation of performance materiality determine our audit scope for each entity within the Group. Taken together, this enables us to form an opinion on the consolidated financial statements. We take into account size, risk profile, the organisation of the group and effectiveness of group-wide controls, changes in the business environment and other factors such as when assessing the level of work to be performed at each entity.
In assessing the risk of material misstatement to the Group financial statements, and to ensure we had adequate quantitative coverage of significant accounts in the financial statements, of the sixteen reporting components of the Group, we selected eleven components covering entities within UK, Ireland, Switzerland, Iceland and Norway, which represent the principal business units within the Group.
Of the eleven components selected, the primary audit team performed an audit of the complete financial information of five components (“full scope components”) which were selected based on their size or risk characteristics. For the remaining six components (“specific scope components”), we performed audit procedures on specific accounts within that component that we considered had the potential for the greatest impact on the significant accounts in the financial statements either because of the size of these accounts or their risk profile. Of the six specific scope components, five were performed by the primary team and one by a non-EY component auditor.
The audit scope of the specific scope components did not include the testing of all significant accounts of the component but will have contributed to the coverage of significant accounts tested for the Group. For an investment in associate, we instructed non-EY component auditors to perform specified procedures and determined the appropriate level of involvement to enable us to confirm that sufficient audit evidence had been obtained as a basis for our opinion on the Group as a whole. In the current year, one of the six specific scope components was an overseas non-EY component team that we instructed to perform specific scope audit procedures.
The charts below illustrate the coverage obtained from the work performed by the primary audit team and component audit teams.
FULL SCOPE COMPONENTS 99% SPECIFIC SCOPE COMPONENTS 1% OTHER PROCEDURES 0%
PROFIT BEFORE NON-UNDERLYING ITEMS AND TAXATION FROM CONTINUING OPERATIONS
TOTAL ASSETS
FULL SCOPE COMPONENTS 84% SPECIFIC SCOPE COMPONENTS 13% OTHER PROCEDURES 3%
REVENUE
FULL SCOPE COMPONENTS 85% SPECIFIC SCOPE COMPONENTS 13% OTHER PROCEDURES 2%
Of the remaining five components that together represent 0% of the Group’s Profit before non-underlying items and taxation from continuing operations, none are individually greater than 5% of the Group’s Profit before non-underlying items and taxation from continuing operations. For these components, we performed other procedures, including analytical review, testing of consolidation journals, intercompany eliminations and foreign currency translation recalculations to respond to potential risks of material misstatement to the Group financial statements.
Changes from the prior year As a result of the acquisitions made during the period, we have designated two of these locations as specific scope and two of these locations as review scope. The procedures in relation to the acquisition accounting were performed by our primary audit team.
Involvement with component teams In establishing our overall approach to the Group audit, we determined the type of work that needed to be undertaken at each of the components audited by us, as the primary audit team, or by non-EY component auditors operating under our instruction. Of the five full scope components, audit procedures were performed on five of these directly by the primary audit team. For the six specific scope components, where the work was performed by component auditors, we determined the appropriate level of involvement to enable us to determine that sufficient audit evidence had been obtained as a basis for our opinion on the Group as a whole.
The primary team interacted regularly with the component teams where appropriate during various stages of the audit, reviewed key working papers and were responsible for the scope and direction of the audit process. This, together with the additional procedures performed at Group level, gave us appropriate evidence for our opinion on the Group financial statements.

FINANCIAL STATEMENTS
Domino’s Pizza Group plc Annual Report & Accounts 201774
Our application of materialityWe apply the concept of materiality in planning and performing the audit, in evaluating the effect of identified misstatements on the audit and in forming our audit opinion.
MaterialityThe magnitude of an omission or misstatement that, individually or in the aggregate, could reasonably be expected to influence the economic decisions of the users of the financial statements. Materiality provides a basis for determining the nature and extent of our audit procedures.
We determined materiality for the Group to be £4.8 million (2016: £4 million), which is 5% (2016: 5%) of profit before non-underlying items and taxation from continuing operations. We believe that profit before non-underlying items and taxation from continuing operations is the most relevant measure of the underlying financial performance of the group.
We determined materiality for the Parent Company to be £4.8 million (2016: £4 million), which is consistent with our Group materiality.
Performance materialityThe application of materiality at the individual account or balance level. It is set at an amount to reduce to an appropriately low level the probability that the aggregate of uncorrected and undetected misstatements exceeds materiality.
On the basis of our risk assessments, together with our assessment of the Group’s overall control environment, our judgement was that performance materiality was 50% (2016: 50%) of our planning materiality, namely £2.4m (2016: £2m). We have maintained performance materiality at this percentage reflecting the results of our testing of the Group’s systems and processes and historical audit findings.
Audit work at component locations for the purpose of obtaining audit coverage over significant financial statement accounts is undertaken based on a percentage of total performance materiality. The performance materiality set for each component is based on the relative scale and risk of the component to the Group as a whole and our assessment of the risk of misstatement at that component. In the current year, the range of performance materiality allocated to components was £0.4m to £2.4m (2016: £0.4m to £2m).
Reporting thresholdAn amount below which identified misstatements are considered as being clearly trivial.
We agreed with the Audit Committee that we would report to them all uncorrected audit differences in excess of £0.2m (2016: £0.2m), which is set at 5% of planning materiality, as well as differences below that threshold that, in our view, warranted reporting on qualitative grounds.
We evaluate any uncorrected misstatements against both the quantitative measures of materiality discussed above and in light of other relevant qualitative considerations in forming our opinion.
Other information The other information comprises the information included in the annual report set out on pages 1 to 68, other than the financial statements and our auditor’s report thereon. The directors are responsible for the other information.
Our opinion on the financial statements does not cover the other information and, except to the extent otherwise explicitly stated in this report, we do not express any form of assurance conclusion thereon.
In connection with our audit of the financial statements, our responsibility is to read the other information and, in doing so, consider whether the other information is materially inconsistent with the financial statements or our knowledge obtained in the audit or otherwise appears to be materially misstated. If we identify such material inconsistencies or apparent material misstatements, we are required to determine whether there is a material misstatement in the financial statements or a material misstatement of the other information. If, based on the work we have performed, we conclude that there is a material misstatement of the other information, we are required to report that fact.
We have nothing to report in this regard.
In this context, we also have nothing to report in regard to our responsibility to specifically address the following items in the other information and to report as uncorrected material misstatements of the other information where we conclude that those items meet the following conditions:
• Fair, balanced and understandable (set out on page 68) – the statement given by the directors that they consider the annual report and financial statements taken as a whole is fair, balanced and understandable and provides the information necessary for shareholders to assess the group’s performance, business model and strategy, is materially inconsistent with our knowledge obtained in the audit; or
• Audit committee reporting (set out on pages 43 to 45) – the section describing the work of the audit committee does not appropriately address matters communicated by us to the audit committee; or
• Directors’ statement of compliance with the UK Corporate Governance Code (set out on page 36) – the parts of the directors’ statement required under the Listing Rules relating to the company’s compliance with the UK Corporate Governance Code containing provisions specified for review by the auditor in accordance with Listing Rule 9.8.10R(2) do not properly disclose a departure from a relevant provision of the UK Corporate Governance Code.
• Profit before taxation from continuing operations – £81.2m
• Non-underlying items before tax – £15.0m
• Totals £96.2m (materiality basis) – profit before non-underlying items and taxation from continuing operations
• Materiality of £4.8m (5% of materiality basis)
Starting basis
Adjustments
Materiality
Independent auditor’s report continuedto the members of Domino’s Pizza Group plc
CORPORATE GOVERNANCE FINANCIAL STATEMENTSSTRATEGIC REPORT
Annual Report & Accounts 2017 Domino’s Pizza Group plc 75
Opinions on other matters prescribed by the Companies Act 2006In our opinion, the part of the directors’ remuneration report to be audited has been properly prepared in accordance with the Companies Act 2006.
In our opinion, based on the work undertaken in the course of the audit:
• the information given in the strategic report and the directors’ report for the financial year for which the financial statements are prepared is consistent with the financial statements; and
• the strategic report and the directors’ report have been prepared in accordance with applicable legal requirements.
Matters on which we are required to report by exceptionIn the light of the knowledge and understanding of the group and the parent company and its environment obtained in the course of the audit, we have not identified material misstatements in the strategic report or the directors’ report.
We have nothing to report in respect of the following matters in relation to which the Companies Act 2006 requires us to report to you if, in our opinion:
• adequate accounting records have not been kept by the parent company, or returns adequate for our audit have not been received from branches not visited by us; or
• the parent company financial statements and the part of the Directors’ Remuneration Report to be audited are not in agreement with the accounting records and returns; or
• certain disclosures of directors’ remuneration specified by law are not made; or
• we have not received all the information and explanations we require for our audit.
Responsibilities of directorsAs explained more fully in the directors’ responsibilities statement set out on page 68, the directors are responsible for the preparation of the financial statements and for being satisfied that they give a true and fair view, and for such internal control as the directors determine is necessary to enable the preparation of financial statements that are free from material misstatement, whether due to fraud or error.
In preparing the financial statements, the directors are responsible for assessing the group and parent company’s ability to continue as a going concern, disclosing, as applicable, matters related to going concern and using the going concern basis of accounting unless the directors either intend to liquidate the group or the parent company or to cease operations, or have no realistic alternative but to do so.
Auditor’s responsibilities for the audit of the financial statements Our objectives are to obtain reasonable assurance about whether the financial statements as a whole are free from material misstatement, whether due to fraud or error, and to issue an auditor’s report that includes our opinion. Reasonable assurance is a high level of assurance, but is not a guarantee that an audit conducted in accordance with ISAs (UK) will always detect a material misstatement when it exists. Misstatements can arise from fraud or error and are considered material if, individually or in the aggregate, they could reasonably be expected to influence the economic decisions of users taken on the basis of these financial statements.
Explanation as to what extent the audit was considered capable of detecting irregularities, including fraudThe objectives of our audit, in respect to fraud, are; to identify and assess the risks of material misstatement of the financial statements due to fraud; to obtain sufficient appropriate audit evidence regarding the assessed risks of material misstatement due to fraud, through designing and implementing appropriate responses; and to respond appropriately to fraud or suspected fraud identified during the audit. However, the primary responsibility for the prevention and detection of fraud rests with both those charged with governance of the entity and management.
Our approach was as follows:
• We obtained an understanding of the legal and regulatory frameworks that are applicable to the group and determined that the most significant frameworks which are directly relevant to specific assertions in the financial statements are those that relate to the reporting framework (IFRS, FRS 101, the Companies Act 2006 and the UK Corporate Governance Code) and the relevant tax compliance regulations in the jurisdictions in which the group operates. In addition, we concluded that there are certain significant laws and regulations which may have an effect on the determination of the amounts and disclosures in the financial statements being the Listing Rules of the UK Listing Authority, and those regulations relating to health and safety and employee matters.
• We understood how the Group is complying with those frameworks by making enquiries of management, the company secretary, the head of legal and those responsible for legal and compliance procedures. We corroborated our enquiries through our review of board minutes, papers provided to the Audit Committee, discussion with the Audit Committee and any correspondence received from regulatory bodies.
• We assessed the susceptibility of the group’s financial statements to material misstatement, including how fraud might occur by reviewing the Group’s risk register, enquiry with management and the Audit Committee during the planning and execution phases of our audit. We also considered performance targets and their influence on efforts made by management to manage earnings or influence the perceptions of analysts. We considered the programs and controls that the group has established to address risks identified, or that otherwise prevent, deter and detect fraud and how senior management monitors those programs and controls. Where the risk was considered to be higher, we performed audit procedures to address each identified fraud risk. These procedures included testing manual journals and were designed to provide reasonable assurance that the financial statements were free from fraud or error.

FINANCIAL STATEMENTS
Domino’s Pizza Group plc Annual Report & Accounts 201776
Responsibilities of directors continuedExplanation as to what extent the audit was considered capable of detecting irregularities, including fraud continued
• Based on this understanding we designed our audit procedures to identify non-compliance with such laws and regulations. Our procedures involved journal entry testing, with a focus on manual consolidation journals and journals indicating large or unusual transactions based on our understanding of the business; enquiries of the company secretary, head of legal, management; and focused testing, as referred to in the key audit matters section above. In addition, we completed procedures to conclude on the compliance of the disclosures in the Annual Report and Accounts with the requirements of the relevant accounting standards, UK legislation and the UK Corporate Governance Code 2016.
A further description of our responsibilities for the audit of the financial statements is located on the Financial Reporting Council’s website at https://www.frc.org.uk/auditorsresponsibilities. This description forms part of our auditor’s report.
Other matters we are required to address • We were appointed by the company on
20 April 2017 to audit the financial statements for the year ending 31 December 2017 and subsequent financial periods.
• The period of total uninterrupted engagement including previous renewals and reappointments is 19 years, covering the years ending 26 December 1999 to 31 December 2017.
• The non-audit services prohibited by the FRC’s Ethical Standard were not provided to the group or the parent company and we remain independent of the group and the parent company in conducting the audit.
• The audit opinion is consistent with the additional report to the audit committee.
Christopher Voogd (Senior statutory auditor)for and on behalf of Ernst & Young LLP, Statutory AuditorBirmingham7 March 2018
Notes:1 The maintenance and integrity of the
Domino’s Pizza Group plc website is the responsibility of the directors; the work carried out by the auditors does not involve consideration of these matters and, accordingly, the auditors accept no responsibility for any changes that may have occurred to the financial statements since they were initially presented on the website.
2 Legislation in the United Kingdom governing the preparation and dissemination of financial statements may differ from legislation in other jurisdictions.
Independent auditor’s report continuedto the members of Domino’s Pizza Group plc
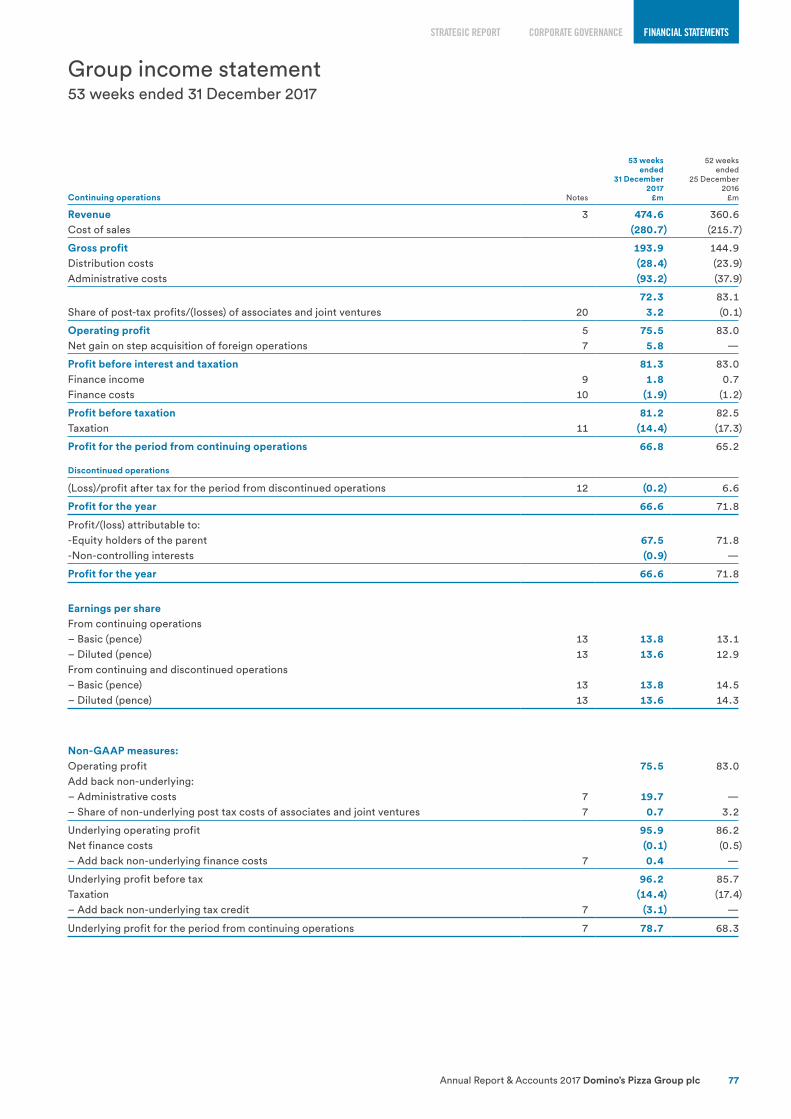
CORPORATE GOVERNANCE FINANCIAL STATEMENTSSTRATEGIC REPORT
Annual Report & Accounts 2017 Domino’s Pizza Group plc 77
Group income statement53 weeks ended 31 December 2017
Continuing operations Notes
53 weeksended
31 December2017
£m
52 weeksended
25 December2016
£m
Revenue 3 474.6 360.6Cost of sales (280.7) (215.7)
Gross profit 193.9 144.9Distribution costs (28.4) (23.9)Administrative costs (93.2) (37.9)
72.3 83.1Share of post-tax profits/(losses) of associates and joint ventures 20 3.2 (0.1)
Operating profit 5 75.5 83.0Net gain on step acquisition of foreign operations 7 5.8 —
Profit before interest and taxation 81.3 83.0Finance income 9 1.8 0.7Finance costs 10 (1.9) (1.2)
Profit before taxation 81.2 82.5Taxation 11 (14.4) (17.3)
Profit for the period from continuing operations 66.8 65.2
Discontinued operations
(Loss)/profit after tax for the period from discontinued operations 12 (0.2) 6.6
Profit for the year 66.6 71.8
Profit/(loss) attributable to:-Equity holders of the parent 67.5 71.8-Non-controlling interests (0.9) —
Profit for the year 66.6 71.8
Earnings per share From continuing operations– Basic (pence) 13 13.8 13.1– Diluted (pence) 13 13.6 12.9From continuing and discontinued operations– Basic (pence) 13 13.8 14.5– Diluted (pence) 13 13.6 14.3
Non-GAAP measures:Operating profit 75.5 83.0Add back non-underlying:– Administrative costs 7 19.7 —– Share of non-underlying post tax costs of associates and joint ventures 7 0.7 3.2
Underlying operating profit 95.9 86.2Net finance costs (0.1) (0.5)– Add back non-underlying finance costs 7 0.4 —
Underlying profit before tax 96.2 85.7Taxation (14.4) (17.4)– Add back non-underlying tax credit 7 (3.1) —
Underlying profit for the period from continuing operations 7 78.7 68.3
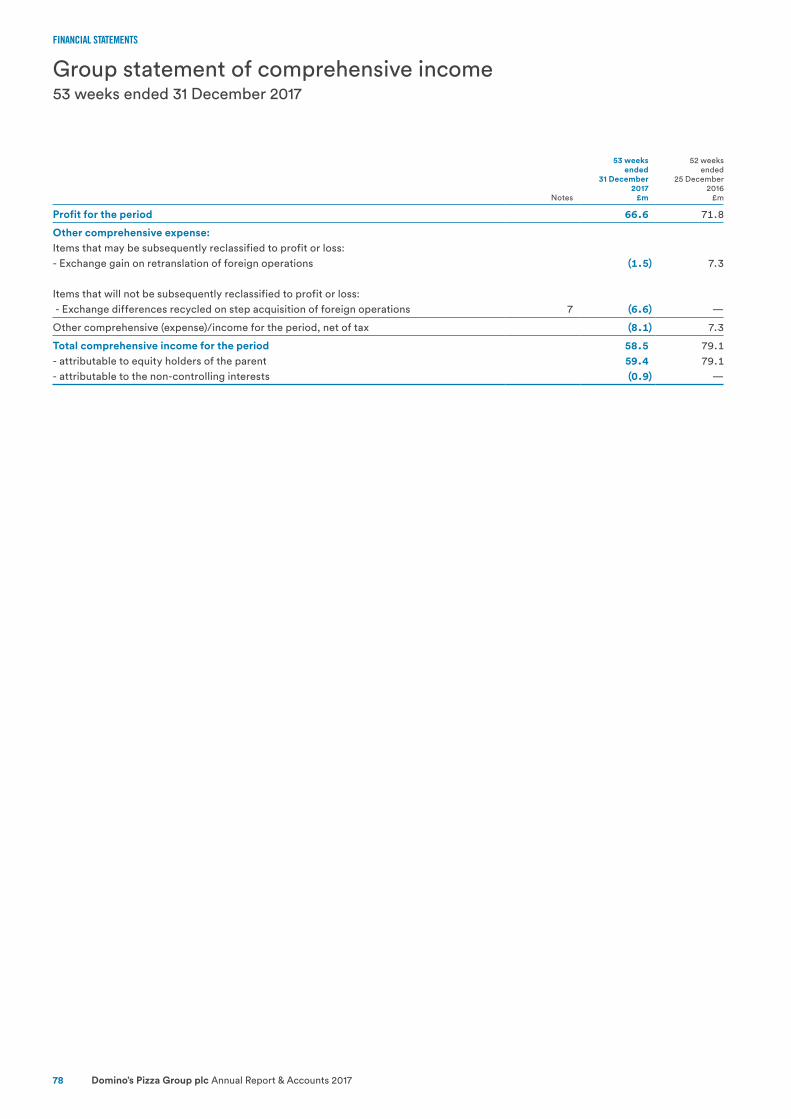
FINANCIAL STATEMENTS
Domino’s Pizza Group plc Annual Report & Accounts 201778
Group statement of comprehensive income53 weeks ended 31 December 2017
Notes
53 weeksended
31 December2017
£m
52 weeksended
25 December2016
£m
Profit for the period 66.6 71.8
Other comprehensive expense:Items that may be subsequently reclassified to profit or loss:- Exchange gain on retranslation of foreign operations (1.5) 7.3
Items that will not be subsequently reclassified to profit or loss: - Exchange differences recycled on step acquisition of foreign operations 7 (6.6) —
Other comprehensive (expense)/income for the period, net of tax (8.1) 7.3
Total comprehensive income for the period 58.5 79.1- attributable to equity holders of the parent 59.4 79.1- attributable to the non-controlling interests (0.9) —

CORPORATE GOVERNANCE FINANCIAL STATEMENTSSTRATEGIC REPORT
Annual Report & Accounts 2017 Domino’s Pizza Group plc 79
Notes
At31 December
2017£m
At25 December
2016£m
Non-current assetsIntangible assets 15 114.2 18.2Property, plant and equipment 16 105.9 67.8Prepaid operating lease charges 17 3.5 0.8Trade and other receivables 18 25.2 21.0Net investment in finance leases 19 0.5 0.2Available-for-sale financial asset 29 9.0 8.1Investments in associates and joint ventures 20 27.3 58.8Deferred tax asset 11 8.3 6.1
293.9 181.0
Current assetsInventories 21 8.4 9.3Trade and other receivables 18 48.7 42.4Net investment in finance leases 19 0.9 0.6Cash and cash equivalents 22 29.0 23.1
87.0 75.4
Total assets 380.9 256.4
Current liabilitiesTrade and other payables 23 (86.4) (59.3)Deferred income (8.1) (5.6)Financial liabilities 24 (6.2) (0.7)Financial liabilities – share buyback obligation 24 (18.3) (10.0)Deferred and contingent consideration 25 (3.6) (1.1)Current tax liabilities (8.2) (6.2)Provisions 27 (4.5) (1.5)
(135.3) (84.4)
Non-current liabilitiesTrade and other payables 23 (0.9) (2.7)Financial liabilities 24 (152.3) (57.0)Deferred income (6.8) (3.5)Deferred tax liabilities 11 (7.8) (0.4)Provisions 27 (13.3) (1.2)
(181.1) (64.8)
Total liabilities (316.4) (149.2)
Net assets 64.5 107.2
Shareholders’ equityCalled up share capital 30 2.5 2.6Share premium account 36.7 36.6Capital redemption reserve 0.5 0.5Capital reserve – own shares (6.5) (12.3)Currency translation reserve (1.1) 7.0Other reserves (40.3) —Retained earnings 52.0 72.8
Total equity shareholders’ funds 43.8 107.2
Non-controlling interests 20.7 —
Total equity 64.5 107.2
David WildDirector7 March 2018
Group balance sheetat 31 December 2017

FINANCIAL STATEMENTS
Domino’s Pizza Group plc Annual Report & Accounts 201780
Sharecapital
£m
Sharepremiumaccount
£m
Capitalredemption
reserve£m
Capitalreserve –
ownshares
£m
Currencytranslation
reserve£m
Other reserves
£m
Retainedearnings
£m
Total equityshareholders’
funds£m
Non-controlling
interests£m
Total £m
At 27 December 2015 2.6 29.1 0.5 (2.2) (0.3) — 68.0 97.7 — 97.7Profit for the period — — — — — — 71.8 71.8 — 71.8Other comprehensive income – exchange differences — — — — 7.3 — — 7.3 — 7.3
Total comprehensive income for the period — — — — 7.3 — 71.8 79.1 — 79.1Proceeds from share issues — 7.5 — — — — — 7.5 — 7.5Share buybacks — — — (10.1) — — (22.3) (32.4) — (32.4)Share buybacks obligation — — — — — — (10.0) (10.0) — (10.0)Tax on employee share options — — — — — — 0.1 0.1 — 0.1Share options and LTIP charge — — — — — — 2.2 2.2 — 2.2Equity dividends paid — — — — — — (37.0) (37.0) — (37.0)
At 25 December 2016 2.6 36.6 0.5 (12.3) 7.0 — 72.8 107.2 — 107.2Profit for the period — — — — — — 67.5 67.5 (0.9) 66.6Other comprehensive income – exchange differences — — — — (8.1) — — (8.1) — (8.1)
Total comprehensive income for the period — — — — (8.1) — 67.5 59.4 (0.9) 58.5Proceeds from share issues — 0.1 — 0.5 — — — 0.6 — 0.6Share cancellations — — — 12.3 — — (12.3) — — —Impairment of share issues — — — 2.8 — — (2.8) — — —Share buybacks (0.1) — — (9.8) — — (26.7) (36.6) — (36.6)Share buybacks obligation satisfied — — — — — — 10.0 10.0 — 10.0Share buybacks obligation outstanding — — — — — — (18.3) (18.3) — (18.3)Tax on employee share options — — — — — — 0.5 0.5 — 0.5Share options and LTIP charge — — — — — — 1.7 1.7 — 1.7Acquisitions (notes 30 and 31) — — — — — (40.3) — (40.3) 22.0 (18.3)Transactions with non-controlling interests — — — — — — — — (0.4) (0.4)Equity dividends paid — — — — — — (40.4) (40.4) — (40.4)
At 31 December 2017 2.5 36.7 0.5 (6.5) (1.1) (40.3) 52.0 43.8 20.7 64.5
Group statement of changes in equity53 weeks ended 31 December 2017

CORPORATE GOVERNANCE FINANCIAL STATEMENTSSTRATEGIC REPORT
Annual Report & Accounts 2017 Domino’s Pizza Group plc 81
Notes
53 weeksended
31 December2017
£m
52 weeksended
25 December2016
£m
Cash flows from operating activitiesProfit before interest and taxation 81.3 83.0Amortisation and depreciation 5 14.4 7.6Impairment 2.0 —Working capital movements 33 18.6 (10.8)
Cash generated from operations 116.3 79.8Other movements 33 3.5 (1.2)UK corporation tax paid (14.8) (13.6)Overseas corporation tax paid (0.8) (2.0)
Net cash generated by operating activities 104.2 63.0
Cash flows from investing activitiesPurchase of property, plant and equipment 16 (37.2) (14.1)Purchase of intangible assets 15 (6.2) (8.4)Purchase of other non-current assets 17 (3.2) —Receipts from the sale of other non-current assets 0.2 2.9Acquisition of subsidiaries, net of cash received 31 (23.2) —Investment in joint ventures and associates 20 — (42.8)Payment of deferred consideration 25 (1.1) (2.9)Interest received 0.4 0.3Dividends received from associates 1.2 0.8Decrease/(increase) in loans to associates and joint ventures 0.1 (11.0)(Increase)/decrease in loans to franchisees (0.4) 1.3Receipts from repayment of franchisee leases — 1.2Payments to acquire finance lease assets (0.7) —
Net cash used by investing activities (70.1) (72.7)
Cash inflow/(outflow) before financing 34.1 (9.7)
Cash flows from financing activitiesInterest paid (1.1) (0.9)Issue of Ordinary share capital 0.6 7.5Purchase of own shares (36.6) (32.4)New bank loans and facilities draw down 396.3 150.6Repayment of borrowings (339.9) (107.5)Cash received from non-controlling interest on acquisition of subsidiaries 31 1.7 —Equity dividends paid 14 (40.4) (37.0)Dividends paid to the non-controlling interest (7.6) —
Net cash used by financing activities (27.0) (19.7)
Net increase/(decrease) in cash and cash equivalents 7.1 (29.4)Cash and cash equivalents at beginning of period 23.1 52.9Foreign exchange gain on cash and cash equivalents (1.2) (0.4)
Cash and cash equivalents at end of period 29.0 23.1
Group cash flow statement53 weeks ended 31 December 2017

FINANCIAL STATEMENTS
Domino’s Pizza Group plc Annual Report & Accounts 201782
1. Authorisation of financial statements and statement of compliance with IFRSThe financial statements of the Group for the 53 weeks ended 31 December 2017 were authorised for issue by the Board of Directors on 7 March 2018 and the balance sheet was signed on the Board’s behalf by David Wild. The Company is a public limited company incorporated in the United Kingdom under the Companies Act 2006 (registration number 03853545). The Company is domiciled in the United Kingdom and its registered address is 1 Thornbury, West Ashland, Milton Keynes MK6 4BB. The Company’s Ordinary shares are listed on the Official List of the FCA and traded on the Main Market of the LSE.
The Group’s financial statements have been prepared in accordance with International Financial Reporting Standards (‘IFRSs’) as adopted by the European Union as they apply to the financial statements of the Group for the period ended 31 December 2017.
The principal accounting policies adopted by the Group are set out in note 2.
2. Accounting policiesBasis of preparationThe Group’s financial statements have been prepared in accordance with IFRSs as adopted by the European Union as they apply to the financial statements of the Group for the 53 weeks ended 31 December 2017 and applied in accordance with the Companies Act 2006. The accounting policies which follow set out those policies which apply in preparing the financial statements for the 53 weeks ended 31 December 2017.
The Group financial statements are presented in sterling and are prepared using the historical cost basis with the exception of the available-for-sale financial assets, contingent consideration and put option liabilities which are measured at fair value in accordance with IFRS 13 Fair Value Measurement.
The Group financial statements have been prepared on a going concern basis as the Directors have a reasonable expectation that the Group has adequate resources to continue in operational existence for the foreseeable future. Please refer to the Directors’ report for further details.
JudgementsThe following judgements have had the most significant effect on amounts recognised in the financial statements:
• Stores within the Domino’s Pizza system contribute into a national advertising fund (‘the Fund’) designed to build store sales through increased public recognition of the Domino’s Pizza brand. The Fund is managed with the objective of driving revenues for the stores and is planned to operate at break-even with any short-term timing surplus or deficit carried in the Group balance sheet (for details please see note 18):
• as all Fund income is designated for specific purposes and does not result in a profit or loss for the Group, the revenue recognition criteria as outlined in our accounting policy are not met and therefore the income and expenses of the Fund are not included in the Group income statement. Management consider any short-term deficits to be recoverable from future fund income;
• the assets and liabilities relating to the Fund are included in the appropriate headings in the Group balance sheet as the related legal, but not beneficial, rights and obligations rest with the Group; and
• the cash flows relating to the Fund are included within “Cash generated from operations” in the Group statement of cash flows due to the close interrelationship between the Fund and the trading operations of the Group.
• Domino’s Pizza Group plc (‘DPG’) has made a number of acquisitions during the period, with acquisition costs, conversion costs and other associated income and expense items incurred. Significant impairments and one-off provisions have also been incurred. These items have been considered by management to meet the definition of non-underlying items as defined by our accounting policy and are therefore shown separately within the financial statements. Judgement is required to determine that items are suitably classified as non-underlying and the values assigned are appropriate (as included in our non-GAAP performance measures policy). For details see note 31.
• Investments in Nordic associates undertaken during the prior year were treated as associate investments as operational control remained with the original operating management team in the Nordics due to their majority shareholding and voting rights. During the current year following an increase in the shareholding and voting rights, the judgement has been taken that control has been obtained. This has been accounted for as a step acquisition in accordance with IFRS 3. For details please see note 31.
• Master Franchise Agreements are held by the Group for the UK, Ireland, Switzerland, Iceland, Norway and Sweden. Management have treated these intangible assets as having indefinite lives due to the likelihood of renewal with DPI beyond the current terms without significant cost.
• On acquisition of a controlling interest in the London corporate stores, a put option was granted over the remaining shareholding. A key judgement is the portion that is subject to the put option has been recorded as non-controlling interest as there is uncertainty whether the put option will be exercised. See note 30 and 31.
Certain of the Group’s historical share-based compensation arrangements dating from 2003–2010 involve a degree of estimation and judgement in respect of their employment tax treatment. HMRC issued protective assessments in respect of potential employment tax relating to these historical schemes but the Group received advice from its tax advisors reconfirming the support for the non-taxable accounting treatment. During 2017 the Group updated its legal advice following recent decisions by the Supreme Court concerning the taxation of historical remuneration structures. This was received in January 2018. As a result of this advice, which includes estimates of the Group’s potential employment tax liabilities, a provision has been recorded in these financial statements amounting to £11.0m, comprising £2.6m employer’s NIC, and £8.4m employee’s NIC and PAYE, including interest.
Notes to the Group financial statements53 weeks ended 31 December 2017

CORPORATE GOVERNANCE FINANCIAL STATEMENTSSTRATEGIC REPORT
Annual Report & Accounts 2017 Domino’s Pizza Group plc 83
CORPORATE GOVERNANCE FINANCIAL STATEMENTSSTRATEGIC REPORT
2. Accounting policies continuedJudgements continuedThere are numerous uncertainties involved in the calculation of the provision and until the matter has been agreed with HMRC and the beneficiaries, the net impact to the group may differ materially from the current estimate. In calculating the quantum of the provision a number of significant assumptions were made as follows:
• While the Company has not been approached by HMRC with a demand to pay any potential tax liabilities in respect of these historical schemes, HMRC have served protective assessments for £36.5m covering employer’s national insurance contributions, employees national insurance contributions and PAYE. Our latest legal advice suggests that the full amount covered by the protective assessments is unlikely to be payable as the amounts protected appear to have been determined by calculating tax both on the grant and vesting of the awards received by beneficiaries of the schemes;
• no further employment tax is due in respect of awards granted to beneficiaries in periods that have not been protected by HMRC and for which the period in which HMRC is entitled to raise an enquiry has expired; and
• the beneficiaries of the arrangements, which among others include the Chairman and certain former directors and employees, have provided the Group with indemnities to repay to the Group an amount equivalent to their share of future tax liabilities should they crystallise and become payable by the Group to HMRC together with related interest. Based on the amount of employment tax currently provided, the amount estimated to be demanded from the beneficiaries under the terms of their indemnities equates to the £8.4m employees NIC and PAYE, calculated at the prevailing tax rates at the time, and related interest. Details in respect of the Chairman’s interest in this matter are disclosed within the Directors’ Report on page 67. Details in respect of amounts relating to the Chairman, certain former Directors and Key Management Personnel are included within note 37. As the tax liability has not crystallised, the Group is not yet entitled to seek recovery of the amounts due under the indemnities. In view of the probable time scale and potential uncertainty of recovery of the amounts under indemnities from the beneficiaries, no contingent asset has been recognised in the financial statements.
We are working with advisors to determine an agreed course of action. In due course the Company will engage with the beneficiaries with a view to recovering monies under the indemnities.
Key sources of estimation uncertainty and assumptionsIt is necessary for management to make estimates and assumptions that affect the amounts reported for assets and liabilities as at the balance sheet date and the amounts reported for revenues and expenses during the period. The nature of estimation means that actual outcomes could differ from those estimates.
The following estimates are dependent upon assumptions which could change in the next financial year and have a material effect on the carrying amounts of assets and liabilities recognised at the balance sheet date:
• Determining the fair value of consideration, including disposal of associate investments as part of step acquisitions, acquired intangible assets and goodwill acquired in business combinations, requires the use of estimates regarding the value of the associate investments, intangible assets and deferred consideration payable. Key inputs are managements expectation of business performance and discount rates applied. For details see notes 7, 29 and 31.
• Estimation is required in determining the fair value of any gross liabilities of put options held by non-controlling interests over shareholdings in subsidiary companies. The put option liability is based on a forecast EBITDA multiple of the respective business during the exercise period, which is the key source of estimation uncertainty. For details see note 24.
• The estimation of share-based payment costs requires the selection of an appropriate valuation model, consideration as to the inputs necessary for the valuation model chosen and the estimation of the number of awards that will ultimately vest, inputs which arise from judgements relating to the probability of meeting non-market performance conditions and the continuing participation of employees, as detailed in note 32.
• Determining the fair value of the Market Access Fee (‘MAF’), which relates to the amounts payable by DPE to Domino’s Pizza Group plc in future years, requires judgement in the selection of an appropriate valuation input and the profitability assumptions underlying the business case on which the payment of the MAF instalments is based. The business case valuation applies a discount rate to future cash flows as detailed in note 29.
Basis of consolidationThe full year consolidated financial statements incorporate the results and net assets of the Company and its subsidiary undertakings drawn up on a 52 or 53-week basis to the Sunday on or before 31 December 2017.
The consolidated financial statements comprise the financial statements of the Company and its subsidiaries as at 31 December 2017. Control is achieved when the Group is exposed, or has rights, to variable returns from its involvement with the investee and has the ability to affect those returns through its power over the investee. Specifically, the Group controls an investee if, and only if, the Group has:
• power over the investee (i.e. existing rights that give it the current ability to direct the relevant activities of the investee);
• exposure, or rights, to variable returns from its involvement with the investee; and
• the ability to use its power over the investee to affect its returns.

FINANCIAL STATEMENTS
Domino’s Pizza Group plc Annual Report & Accounts 201784
FINANCIAL STATEMENTS
Notes to the Group financial statements continued
53 weeks ended 31 December 2017
2. Accounting policies continuedBasis of consolidation continuedGenerally, there is a presumption that a majority of voting rights results in control. To support this presumption and when the Group has less than a majority of the voting or similar rights of an investee, the Group considers all relevant facts and circumstances in assessing whether it has power over an investee, including:
• the contractual arrangement(s) with the other vote holders the investee;
• rights arising from other contractual arrangements; and
• the Group’s voting rights and potential voting rights.
The Group re-assesses whether or not it controls an investee if facts and circumstances indicate that there are changes to one or more of the three elements of control. Consolidation of a subsidiary begins when the Group obtains control over the subsidiary and ceases when the Group loses control of the subsidiary. Assets, liabilities, income and expenses of a subsidiary acquired or disposed of during the year are included in the consolidated financial statements from the date the Group gains control until the date the Group ceases to control the subsidiary.
Profit or loss and each component of OCI are attributed to the equity holders of the parent of the Group and to the non-controlling interests, even if this results in the non-controlling interests having a deficit balance. When necessary, adjustments are made to the financial statements of subsidiaries to bring their accounting policies into line with the Group’s accounting policies. All intra-group assets and liabilities, equity, income, expenses and cash flows relating to transactions between members of the Group are eliminated in full on consolidation.
A change in the ownership interest of a subsidiary, without a loss of control, is accounted for as an equity transaction.
If the Group loses control over a subsidiary, it derecognises the related assets (including goodwill), liabilities, non-controlling interest and other components of equity, while any resultant gain or loss is recognised in profit or loss. Any investment retained is recognised at fair value.
Discontinued operationsIn the Group’s financial statements, the results and cash flows of discontinued operations are presented separately from those of continuing operations. An operation is classified as discontinued if it is a component of the Group that (i) has been disposed of, or meets the criteria to be classified as held for sale, and (ii) represents a separate major line of business or geographic area of operations or will be disposed of as part of a single co-ordinated plan to dispose of a separate major line of business or geographic area of operations. The discontinued operations results and cash flows relate to the sale or closure of the Group’s directly managed German stores.
Interests in associates and joint venturesThe Group’s interests in its associates, being those entities over which it has significant influence and which are neither subsidiaries nor joint ventures, are accounted for using the equity method of accounting. The Group has also entered into a number of contractual arrangements with other parties which represent joint ventures. These take the form of agreements to share control over other entities and share of rights to the net assets of the joint venture. Joint control is the contractually agreed sharing of control of an arrangement, which exists only when decisions about the relevant activities require the unanimous consent of the parties sharing control. The considerations made in determining significant influence on joint control are similar to those necessary to determine control over subsidiaries. Where the joint venture is established through an interest in a company, the Group recognises its interest in the entities’ assets and liabilities using the equity method of accounting.
Under the equity method, the investment in an associate or joint venture is carried in the balance sheet at cost plus post-acquisition changes in the Group’s share of net assets of the associate or joint venture, less distributions received and less any impairment in value of individual investments. The Group’s income statement reflects the Group’s share of the associate or joint venture’s results after tax. The Group statement of comprehensive income reflects the Group’s share of any income and expense recognised by the associate or joint venture outside profit and loss.
The foreign exchange gains or losses on the Group’s share of net assets of the associate or joint venture are reflected in the statement of other comprehensive income.
Financial statements of associates and joint ventures are prepared for the same reporting period as the Group. Where necessary, adjustments are made to bring the accounting policies used in line with those of the Group, to take into account fair values assigned at the date of acquisition and to reflect impairment losses where appropriate. Adjustments are also made in the Group’s financial statements to eliminate the Group’s share of unrealised gains and losses on transactions between the Group and its associates and joint ventures.
Foreign currenciesThe functional currency of each company in the Group is that of the primary economic environment in which the entity operates. Transactions in other currencies are initially recorded in the functional currency by applying spot exchange rates prevailing on the dates of the transactions. At each statement of financial position date, monetary assets and liabilities denominated in foreign currencies are retranslated at the functional currency rate of exchange prevailing on the same date. Non-monetary items that are measured in terms of historic cost in a foreign currency are translated using the exchange rates at the dates of the initial transactions. Non-monetary assets and liabilities carried at fair value that are denominated in foreign currencies are translated at the rates prevailing at the date when the fair value was determined. Gains and losses arising on translation are taken to the income statement, except for exchange differences arising on monetary assets and liabilities that form part of the Group’s net investment in a foreign operation. These are taken directly to equity until the disposal of the net investment, at which time they are recognised in profit or loss.
CORPORATE GOVERNANCE FINANCIAL STATEMENTSSTRATEGIC REPORT
Annual Report & Accounts 2017 Domino’s Pizza Group plc 85
CORPORATE GOVERNANCE FINANCIAL STATEMENTSSTRATEGIC REPORT
2. Accounting policies continuedForeign currencies continuedOn consolidation, the assets and liabilities of the Group’s overseas operations are translated into sterling at exchange rates prevailing on the statement of financial position date. Income and expense items are translated at the average exchange rates for the period. Exchange differences arising, if any, are classified as equity and are taken directly to a translation reserve. Such translation differences are recognised as income or expense in the period in which the operation is disposed of. Goodwill and fair value adjustments arising on the acquisition of a foreign entity are treated as assets and liabilities of the foreign entity and translated at the closing rate.
Business combinations and goodwillBusiness combinations are accounted for using the acquisition method. The cost of an acquisition is measured as the aggregate of the consideration transferred, measured at the acquisition-date fair value, and the amount of any non-controlling interest in the acquiree. Acquisition costs incurred are expensed and included in administrative expenses. The measurement of non-controlling interest is at the proportionate share of the acquiree’s net identifiable assets.
When the Group acquires a business, it assesses the financial assets and liabilities assumed for appropriate classification and designation in accordance with the contractual terms, economic circumstances and pertinent conditions as at the acquisition date.
Any contingent consideration to be transferred by the acquirer will be recognised at fair value at the acquisition date. Contingent consideration classified as equity is not remeasured and its subsequent settlement is accounted for within equity. Contingent consideration classified as an asset or liability that is a financial instrument and within the scope of IAS 39 Financial Instruments: Recognition and Measurement is measured at fair value with the changes in fair value recognised in the statement of profit or loss in accordance with IAS 39. Other contingent consideration that is not within the scope of IAS 39 is measured at fair value at each reporting date with changes in fair value recognised in profit or loss.
Goodwill is initially measured at cost, being the excess of the aggregate of the acquisition-date fair value of the consideration transferred and the amount recognised for the non-controlling interest (and, where the business combination is achieved in stages, the acquisition-date fair value of the acquirer’s previously held equity interest in the acquiree) over the net identifiable amounts of the assets acquired and the liabilities assumed in exchange for the business combination.
Assets acquired and liabilities assumed in transactions separate to the business combinations, such as the settlement of pre-existing relationships or post-acquisition remuneration arrangements, are accounted for separately from the business combination in accordance with their nature and applicable IFRSs. Identifiable intangible assets meeting either the contractual-legal or separability criteria are recognised separately from goodwill. Contingent liabilities representing a present obligation are recognised if the acquisition-date fair value can be measured reliably.
If the aggregate of the acquisition-date fair value of the consideration transferred and the amount recognised for the non-controlling interest (and where the business combination is achieved in stages, the acquisition-date fair value of the acquirer’s previously held equity interest in the acquiree) is lower than the fair value of the assets, liabilities and contingent liabilities and the fair value of any pre-existing interest held in the business acquired, the difference is recognised in profit and loss.
After initial recognition, goodwill is measured at cost less any accumulated impairment losses. For the purpose of impairment testing, goodwill acquired in a business combination is, from the acquisition date, allocated to each of the Group’s cash generating units (or groups of cash generating units) that are expected to benefit from the combination, irrespective of whether other assets or liabilities of the acquiree are assigned to those units. Each unit or group of units to which goodwill is allocated represents the lowest level within the entity at which the goodwill is monitored for internal management purposes.
When goodwill forms part of a cash generating unit and part of the operation within that unit is disposed of, the goodwill associated with the operation disposed of is included in the carrying amount of the operation, when determining the gain or loss on disposal of the operation. Goodwill disposed of in this circumstance is measured based on the relative values of the operation disposed of and the portion of the cash generating unit retained.
Other intangible assetsIntangible assets acquired separately are measured on initial recognition at cost. The cost of intangible assets acquired in a business combination is the fair value at the date of acquisition. Following initial recognition, intangible assets are carried at cost less any accumulated amortisation and accumulated impairment losses. Internally generated intangibles, excluding capitalised development costs, are not capitalised and the related expenditure is reflected in profit or loss in the period in which the expenditure is incurred.
Master franchise feesMaster franchise fees are fees paid towards or recognised at fair value on acquisition of the master franchise for the markets in which the Group operates. These are carried at cost less impairment, and are treated as having indefinite useful lives.
Standard franchise feesStandard franchise fees are recognised at fair value on acquisition of the standard franchise for the area in which corporate stores operate. As reacquired rights the fees are amortised over the remaining contractual term and are carried at amortised costs.

FINANCIAL STATEMENTS
Domino’s Pizza Group plc Annual Report & Accounts 201786
FINANCIAL STATEMENTS
Notes to the Group financial statements continued
53 weeks ended 31 December 2017
2. Accounting policies continuedOther intangible assets continuedComputer softwareComputer software is carried at cost less accumulated amortisation and any impairment loss. Externally acquired computer software and software licences are capitalised at the cost incurred to acquire and bring into use the specific software. Internally developed computer software programs are capitalised to the extent that costs can be separately identified and attributed to particular software programs, measured reliably, and that the asset developed can be shown to generate future economic benefits. These assets are considered to have finite useful lives and are amortised on a straight-line basis over the estimated useful economic lives of each of the assets, considered to be between three and ten years.
The carrying value of intangible assets is reviewed for impairment whenever events or changes in circumstances indicate the carrying value may not be recoverable.
Capitalised loan discountsThe Group provides interest-free loans to assist franchisees in the opening of new stores. The difference between the present value of loans recognised and the cash advanced has been capitalised as an intangible asset in recognition of the future value that will be generated via the royalty income and Supply Chain Centre sales that will be generated. These assets are amortised over the life of a new franchise agreement of ten years.
The carrying value of intangible assets is reviewed for impairment whenever events or changes in circumstances indicate the carrying value may not be recoverable. Intangible assets with indefinite useful lives are not amortised, but are tested for impairment annually, either individually or at the cash-generating unit level. The assessment of indefinite life is reviewed annually to determine whether the indefinite life continues to be supportable. If not, the change in useful life from indefinite to finite is made on a prospective basis.
Property, plant and equipmentConstruction in progress is stated at cost, net of accumulated impairment losses, if any. Plant and equipment is stated at cost, net of accumulated depreciation and accumulated impairment losses, if any. Such cost includes the cost of replacing part of the plant and equipment and borrowing costs for long-term construction projects if the recognition criteria are met. When significant parts of plant and equipment are required to be replaced at intervals, the Group depreciates them separately based on their specific useful lives. Likewise, when a major inspection is performed, its cost is recognised in the carrying amount of the plant and equipment as a replacement if the recognition criteria are satisfied. All other repair and maintenance costs are recognised in profit or loss as incurred.
Depreciation is calculated to write down the cost of the assets to their residual values, on a straight-line method on the following bases:
• Freehold land Not depreciated
• Freehold buildings 50 years
• Assets under construction Not depreciated
• Leasehold improvements Over the life of the lease
• Fixtures and fittings Over 5 to 10 years
• Supply Chain Centre equipment Over 3 to 30 years
The assets’ residual values, useful lives and methods of depreciation are reviewed and adjusted, if appropriate, on an annual basis. The majority of assets within Supply Chain Centre equipment are being depreciated over ten years or more. An item of property, plant and equipment is derecognised upon disposal or when no future economic benefits are expected from its use or disposal. Any gain or loss arising on derecognition of the asset (calculated as the difference between the net disposal proceeds and the carrying amount of the asset) is included in the income statement in the year that the asset is derecognised.
All items of property, plant and equipment are reviewed for impairment in accordance with IAS 36 Impairment of Assets when there are indications that the carrying value may not be recoverable.
Prepaid operating lease chargesPrepaid short leasehold property costs are classified as current and non-current prepayments. On initial recognition these assets are held at fair value and subsequently at amortised cost over the length of the head lease.
Available-for-sale financial assetsThe Market Access Fee is classified as an available-for-sale financial asset, initially recognised and subsequently measured at fair value, with changes in fair value recognised in other comprehensive income except for foreign exchange gains and losses, and impairment, which are recognised in profit or loss. On disposal of the asset, any changes in value recorded in other comprehensive will be recognised in the profit or loss.
CORPORATE GOVERNANCE FINANCIAL STATEMENTSSTRATEGIC REPORT
Annual Report & Accounts 2017 Domino’s Pizza Group plc 87
CORPORATE GOVERNANCE FINANCIAL STATEMENTSSTRATEGIC REPORT
2. Accounting policies continuedDerecognition of financial assets and liabilitiesA financial asset or liability is generally derecognised when the contract that gives rise to it is settled, sold or cancelled or expires.
Where an existing financial liability is replaced by another from the same lender on substantially different terms, or the terms of an existing liability are substantially modified, such an exchange or modification is treated as a derecognition of the original liability and the recognition of a new liability, such that the difference in the respective carrying amounts together with any costs or fees incurred are recognised in profit or loss.
LeasesGroup as lesseeLeases are classified as finance leases when the terms of the lease transfer substantially all the risks and rewards of ownership to the Group. All other leases are classified as operating leases.
Assets held as finance leases are recognised as assets of the Group at their fair value or, if lower, at the present value of the minimum lease payments during the lease term at the inception of the lease. Lease payments are apportioned between the reduction of the lease liability and finance charges in the income statement so as to achieve a constant rate of interest in the remaining balance of the liability. Assets held under finance leases are depreciated over the shorter of the estimated useful life of the assets and the lease term.
Assets leased under operating leases are not recorded on the balance sheet. Rental payments are charged directly to the income statement on a straight-line basis over the lease term. Lease incentives, primarily up-front cash payments or rent-free periods, are capitalised and spread over the period of the lease term. Payments made to acquire operating leases are treated as prepaid lease expenses and amortised over the life of the lease.
Group as lessorRental income, including the effect of lease incentives, and rent free periods, are recognised on a straight-line basis over the lease term. Plant and equipment leased out under operating leases are included in property, plant and equipment and depreciated over their useful lives.
Where the Group transfers substantially all the risks and benefits of ownership of the asset, the arrangement is classified as a finance lease and a receivable is recognised for the initial direct costs of the lease and the present value of the minimum lease payments. Finance income is recognised in the income statement so as to achieve a constant rate of return on the remaining net investment in the lease.
Impairment of non-financial assetsThe Group assesses at each reporting date whether there is an indication that an asset may be impaired. If any such indication exists, or when annual impairment testing for an asset is required, the Group makes an estimate of the asset’s recoverable amount. An asset’s recoverable amount is the higher of an asset’s or cash generating unit’s fair value less costs to sell and its value in use and is determined for an individual asset, unless the asset does not generate cash inflows that are largely independent of those from other assets or groups of assets. Where the carrying amount of an asset exceeds its recoverable amount, the asset is considered impaired and is written down to its recoverable amount. In assessing value in use, the estimated future cash flows are discounted to their present value using a pre-tax discount rate that reflects current market assessments of the time value of money and the risks specific to the asset. Impairment losses on continuing operations are recognised in the income statement in those expense categories consistent with the function of the impaired asset.
An assessment is made at each reporting date as to whether there is any indication that previously recognised impairment losses may no longer exist or may have decreased. If such indication exists, the recoverable amount is estimated. A previously recognised impairment loss is reversed only if there has been a change in the estimates used to determine the asset’s recoverable amount since the last impairment loss was recognised. If that is the case the carrying amount of the asset is increased to its recoverable amount. That increased amount cannot exceed the carrying amount that would have been determined, net of depreciation, had no impairment loss been recognised for the asset in prior years. Such reversal is recognised in profit or loss. After such a reversal, the depreciation charge is adjusted in future periods to allocate the asset’s revised carrying amount, less any residual value, on a systematic basis over its remaining useful life.
InventoriesInventories are stated at the lower of cost and net realisable value. Cost is determined on a first in, first out basis. Net realisable value is based on estimated selling price less any further costs expected to be incurred to disposal.
Trade and other receivablesTrade receivables, which generally have seven to 28-day terms, are recognised and carried at the lower of their original invoiced value and recoverable amount. Provision is made when it is likely that the balance will not be recovered in full. Balances are written off when the probability of recovery is considered remote.
The Group provides interest-free loans to assist franchisees in the opening of new stores. These are initially recorded at fair value, with the difference to the cash advanced capitalised as an intangible asset.
National advertising fundIn addition to franchise fees, franchisees pay contributions which are collected by the Group for specific use within the national advertising fund. The Group operates the funds on behalf of the franchisees with the objective of driving revenues for their stores. The fund is specifically used to pay for marketing and advertising. The fund is planned to operate at break-even with any short-term timing surplus or deficit carried in the Group balance sheet within working capital. As all fund contributions are designated for specific purposes and do not result in a profit or loss for the Group, revenue recognition criteria are not met and therefore the income and expenses of the fund are not included in the Group income statement.

FINANCIAL STATEMENTS
Domino’s Pizza Group plc Annual Report & Accounts 201788
FINANCIAL STATEMENTS
Notes to the Group financial statements continued
53 weeks ended 31 December 2017
2. Accounting policies continuedCash and cash equivalentsCash and short-term deposits in the statement of financial position comprise cash at banks and on hand and short-term deposits with a maturity of three months or less, which are subject to an insignificant risk of changes in value.
For the purpose of the consolidated statement of cash flows, cash and cash equivalents consist of cash and short-term deposits, as defined above, net of any outstanding bank overdrafts.
Income taxesCurrent tax assets and liabilities are measured at the amount expected to be recovered or paid to the taxation authorities, based on tax rates and laws that are enacted or substantively enacted by the balance sheet date. Management periodically evaluates positions taken in the tax returns with respect to situations in which applicable tax regulations are subject to interpretation and establishes provisions where appropriate.
Deferred tax is recognised using the liability method, providing for temporary differences between the tax bases and the accounting bases of assets and liabilities. Deferred tax is calculated on an undiscounted basis at the tax rates that are expected to apply in the period when the liability is settled or the asset is realised, based on tax rates and laws enacted or substantively enacted at the balance sheet date. Deferred tax liabilities are recognised for all temporary differences, with the following exceptions:
• where the temporary difference arises from the initial recognition of goodwill or of an asset or liability in a transaction that is not a business combination and, at the time of the transaction, affects neither the accounting profit nor taxable profit or loss; and
• in respect of taxable temporary differences associated with investments in subsidiaries, associates and joint ventures, where the timing of the reversal of the temporary differences can be controlled and it is probable that the temporary differences will not reverse in the foreseeable future.
Deferred tax assets are recognised only to the extent that it is probable that taxable profit will be available against which the deductible temporary differences, carried forward tax credits or losses can be utilised, with the following exceptions:
• when the deferred tax asset relating to the deductible temporary difference arises from the initial recognition of an asset or liability in a transaction that is not a business combination and, at the time of the transaction, affects neither the accounting profit nor taxable profit or loss; and
• in respect of deductible temporary differences associated with investments in subsidiaries, associates and interests in joint arrangements, deferred tax assets are recognised only to the extent that it is probable that the temporary differences will reverse in the foreseeable future and taxable profit will be available against which the temporary differences can be utilised.
Tax is charged or credited to the income statement, except when it relates to items charged or credited directly to other comprehensive income or to equity, in which case the income tax is also dealt with in other comprehensive income or equity respectively.
Deferred tax assets and liabilities are offset against each other when the Group has a legally enforceable right to set off current tax assets and liabilities and the deferred tax relates to income taxes levied by the same tax jurisdiction on either the same taxable entity, or on different taxable entities which intend to settle current tax assets and liabilities on a net basis or to realise the assets and settle the liabilities simultaneously in each future period in which significant amounts of deferred tax liabilities are expected to be settled or recovered.
ProvisionsProvisions are recognised when there is a present legal or constructive obligation as a result of past events for which it is probable that an outflow of economic benefit will be required to settle the obligation and where the amount of the obligation can be reliably measured. The amount recognised as a provision is the best estimate of the consideration required to settle the present obligation at the balance sheet date, considering the risks and uncertainties surrounding the obligation. Where a provision is measured using the cash flows estimated to settle the present obligation, its carrying amount is the present value of those cash flows if the impact of discounting at a pre-tax rate is material.
A restructuring provision is recognised when the Group has developed a detailed formal plan for the restructuring and has raised a valid expectation in those affected that it will carry out the restructuring by starting to implement the plan or announcing its main features to those affected by it. The measurement of a restructuring provision includes only the direct expenditures arising from the restructuring, which are those amounts that are both necessarily entailed by the restructuring and not associated with the ongoing activities of the entity.
Present obligations arising under onerous lease contracts are recognised and measured as provisions. An onerous contract is considered to exist when the Group has a contract under which the unavoidable costs of meeting the obligations under the contract exceed the economic benefits expected to be received under it.
Interest bearing loans and borrowingsObligations for loans and borrowings are recognised when the Group becomes party to the related contracts and are measured initially at fair value less directly attributable transaction costs. After initial recognition, interest bearing loans and borrowings are subsequently measured at amortised cost using the effective interest method.

CORPORATE GOVERNANCE FINANCIAL STATEMENTSSTRATEGIC REPORT
Annual Report & Accounts 2017 Domino’s Pizza Group plc 89
CORPORATE GOVERNANCE FINANCIAL STATEMENTSSTRATEGIC REPORT
2. Accounting policies continuedPensionsThe Group contributes to the personal pension plans of certain staff with defined contribution schemes. The contributions are charged as an expense as they fall due. Any contributions unpaid at the balance sheet date are included as an accrual at that date. The Group has no further payment obligations once the contributions have been paid.
Capital reserve – own sharesDomino’s Pizza Group plc shares held by the Company and its Employee Benefit Trust (‘EBT’) are classified in shareholders’ equity as “Capital reserve – own shares” and are recognised at cost. No gain or loss is recognised in the income statement on the purchase or sale of such shares.
Revenue recognitionRevenue is recognised to the extent that it is probable that the economic benefits will flow to the Group and the revenue can be reliably measured. Revenue is measured at the fair value of consideration net of returns, rebates and value-added taxes. Franchisee rebates are recognised as an expense within revenue on an accruals basis on the expected entitlement which has been earned up to the balance sheet date.
The following criteria must also be met before revenue is recognised:
Royalties, franchise fees and sales to franchiseesRoyalties are based on Domino’s Pizza system sales to customers and are recognised as the income is earned.
The franchise fee is effectively a joining fee; it is non-refundable and no element of the franchise fee relates to subsequent services. Revenue from franchisee fees is recognised when a franchisee opens a store for trading.
Revenue from sales to franchisees is recognised on delivery to stores.
Corporate store salesRevenue from pizza delivery is recognised on delivery to customers.
Rental income on leasehold and freehold propertyRental income arising from leasehold properties is recognised on a straight-line basis in accordance with the lease terms. Deferred income compromises lease premiums and rental payments. Lease premiums are recognised on a straight-line basis over the term of the lease. Rental payments are deferred and recognised over the period which it relates.
Borrowing costsBorrowing costs are generally expensed as incurred. Borrowing costs that are directly attributable to the acquisition or construction of an asset are capitalised while the asset is being constructed as part of the cost of that asset. Borrowing costs consist of interest and other finance costs that the Group incurs. The policy is adopted for all assets that meet the definition of qualifying assets under IAS 23.
Share-based paymentsThe Group provides benefits to employees (including Executive Directors) in the form of share-based payment transactions, whereby employees render services as consideration for equity instruments (equity-settled transactions). The cost of the equity-settled transactions is measured by reference to the fair value at the date at which they are granted and is recognised as an expense over the vesting period, which ends on the date on which the relevant employees become fully entitled to the award. Fair values of employee share option plans are calculated using a Stochastic model for awards with TSR-related performance conditions and a Black-Scholes model for SAYE awards and other awards with EPS-related performance conditions. In valuing equity-settled transactions, no account is taken of any service and performance (vesting conditions), other than performance conditions linked to the price of the shares of the Company (market conditions). Any other conditions which are required to be met in order for an employee to become fully entitled to an award are considered to be non-vesting conditions. Like market performance conditions, non-vesting conditions are taken into account in determining the grant date fair value.
No expense is recognised for awards that do not ultimately vest, except for awards where vesting is conditional upon a market or non-vesting condition, which are treated as vesting irrespective of whether or not the market or non-vesting condition is satisfied, provided that all other performance conditions and/or service conditions are satisfied.
At each balance sheet date before vesting, the cumulative expense is calculated, representing the extent to which the vesting period has expired and the Directors’ best estimate of the number of equity instruments that will ultimately vest on achievement or otherwise of non-market conditions or, in the case of an instrument subject to a market condition, be treated as vested as described above.
The movement in the cumulative expense since the previous balance sheet date is recognised in the income statement, with the corresponding increase in equity.
When the terms of an equity-settled award are modified, the minimum expense recognised is the grant date fair value of the unmodified award, provided the original terms of the award are met. An additional expense, measured as at the date of modification, is recognised for any modification that increases the total fair value of the share-based payment transaction, or is otherwise beneficial to the employee.

FINANCIAL STATEMENTS
Domino’s Pizza Group plc Annual Report & Accounts 201790
FINANCIAL STATEMENTS
Notes to the Group financial statements continued
53 weeks ended 31 December 2017
2. Accounting policies continuedShare-based payments continuedWhere an equity-settled award is cancelled, it is treated as if it had vested on the date of cancellation, and any cost not yet recognised in the income statement for the award is expensed immediately. This includes anywhere non-vesting conditions within the control of either the entity or the employee are not met. However, if a new award is substituted for the cancelled award, and designated as a replacement award on the date that it is granted, the cancelled and new awards are treated as if they were a modification of the original award, as described in the previous paragraph. All cancellations of equity-settled transaction awards are treated equally.
Any compensation paid up to the fair value of the award at the cancellation or settlement date is deducted from equity, with any excess over fair value being treated as an expense in the income statement.
The dilutive effect of outstanding options is reflected as additional share dilution in the computation of diluted earnings per share (further details are given in note 13).
The Group has taken advantage of the transitional provisions of IFRS 2 in respect of equity-settled awards so as to apply IFRS 2 only to those equity-settled awards granted after 7 November 2002 that had not vested before 3 January 2005.
Non-GAAP performance measuresIn the reporting of financial information, the Group uses certain measures that are not required under IFRS. The Group believes that these additional measures, which are used internally, are useful to the users of the financial statements in helping them understand the underlying business performance, as defined in the key performance indicators section of the strategic report.
The principal non-GAAP measures the Group uses are underlying operating profit, underlying profit before tax, underlying profit for the period from continuing operations underlying earnings per share and system sales. Underlying measures remove the impact of non-underlying items from earnings and are reconciled to operating profits; system sales measure the performance of the overall business, as defined in the key performance indicators section of the strategic report.
While the disclosure of non-underlying items and system sales is not required by IFRS, these items are separately disclosed either as memorandum information on the face of the income statement and in the segmental analysis, or in the notes to the accounts as appropriate. Non-underlying items include significant non-recurring items such as acquisition costs, conversion costs of stores acquired, gains and losses on step acquisitions, the recognition of historical share-based payments taxes provision, gains and losses on fair values of financial instruments, impairments and amortisation of acquired intangibles. These items are not considered to be underlying by management due to quantum and nature. Factors considered include items that are non-recurring, not part of the ordinary course of business or reduce understandability of business performance. For a detailed description of items see note 7.
System sales represent the sum of all sales made by both franchisee and corporate stores in the United Kingdom, Ireland, Norway, Iceland, Sweden and Switzerland to consumers.
Adoption of new and revised standardsThe following standards are effective for this financial year but have not had significant impact on the reported financial performance or position of the Group:
• Amendments to IFRS 11 Accounting for Acquisitions of Interests in Joint Operations;
• Amendments to IAS 1 Disclosure Initiative;
• Amendments to IAS 16 and IAS 38 Clarification of Acceptable Methods of Depreciation and Amortisation; and
• Amendments to IAS 27 Equity Method in Separate Financial Statements.
None of the amendments have an impact on the financial performance of the Group.
New standards and interpretations not appliedAt the date of authorisation of these financial statements, the following standards and interpretations that are relevant to the Group, which have not been applied in these financial statements, were in issue but not yet effective.
Effective for periodsbeginning on or after:
International Financial Reporting Standards (‘IFRSs’)Amendments to IFRS 2 Classification and Measurement of Share-based Payment Transactions 1 January 2018IFRS 9 Financial Instruments: Classification and Measurement 1 January 2018IFRS 15 Revenue from Contracts with Customers 1 January 2018IFRS 16 Leases 1 January 2019International Accounting Standards (‘IAS’)Amendments to IAS 7 Disclosure Initiative 1 January 2017Amendments to IAS 12 Recognition of Deferred Tax Assets for Unrealised Losses 1 January 2017IFRIC Interpretation 22 Foreign Currency Transactions and Advance Consideration 1 January 2018

CORPORATE GOVERNANCE FINANCIAL STATEMENTSSTRATEGIC REPORT
Annual Report & Accounts 2017 Domino’s Pizza Group plc 91
CORPORATE GOVERNANCE FINANCIAL STATEMENTSSTRATEGIC REPORT
2. Accounting policies continuedNew standards and interpretations not applied continuedIFRS 15 introduces a five-step approach to the timing of revenue recognition based on performance obligations in customer contracts. The Group recognises revenue from the following principal activities:
• royalties, franchise fees and sales to franchisees;
• corporate store sales; and
• rental income on leasehold and freehold property.
Rental income on leasehold and freehold property fall outside of the scope of IFRS 15. An assessment of the impact of IFRS 15 has been completed on revenues and recognition under IFRS 15 is expected to be materially consistent with current practice for the Group’s revenue. Had the principles of IFRS 15 been applied in the current reporting period, it would not have had a significant impact on the financial statements.
IFRS 16, replacing IAS 17, provides a single lessee accounting model, requiring lessees to recognise right of use assets and lease liabilities for all applicable leases.
IFRS 16 is expected to have a significant impact on the amounts recognised in the Group’s consolidated financial statements. On adoption of IFRS 16 the Group will recognise within the balance sheet a right of use asset and lease liability for all applicable leases. Within the income statement, rent expense will be replaced by depreciation and interest expense. This will result in a decrease in cost of sales and an increase in finance costs. Where the Group operates as lessor the rental income will continue to be recognised on the same basis.
The Group operates as intermediate lessor for a significant proportion of its leases. Where the sublease is substantially all of the right of use head lease, the right of use asset will be derecognised and recorded as a lease receivable, with interest income recognised in the income statement. Where the sublease is not substantially all of the right of use head lease, but management judges that it is likely the sublease will be renewed to become substantially all of the right of use asset then the same treatment will be applied. This will result in lease receivables and lease liabilities being recorded on the balance sheet with interest income expense recognised separately in the income statement, replacing revenue and cost of sales.
The standard will also impact a number of statutory measures such as operating profit and cash generated from operations, and alternative performance measures used by the Group. The full impact of IFRS 16 is currently under review, including understanding the practical application of the principles of the standard. It is therefore not practical to provide a reasonable estimate of the financial effect until this review is complete.
IFRS 9 Financial Instruments replaces IAS 39, covering the classification, measurement and derecognition of financial assets and financial liabilities, together with a new hedge accounting model and the new expected credit loss model for calculating impairment.
An initial assessment indicates that the adoption of IFRS 9 will not have a material impact on its consolidated results and financial position. The Market Access Fee, relating to the underlying performance of the associate Daytona JV Limited is currently classified as an available-for-sale-asset. On adoption of IFRS 9 this has been assessed as a derivative instrument with subsequent changes in fair value recognised through profit or loss.
The following standards are not expected to have a significant impact on the financial statements of the Group:
• Amendments to IFRS 2 Classification and Measurement of Share-based Payment Transactions
• Amendments to IAS 7 Disclosure Initiative
• Amendments to IAS 12 Recognition of Deferred Tax Assets for Unrealised Losses
• IFRIC Interpretation 22 Foreign Currency Transactions and Advance Consideration
3. RevenueRevenue recognised in the income statement is analysed as follows:
Continuing operations
53 weeksended
31 December2017
£m
52 weeksended
25 December2016
£m
Royalties, franchise fees and sales to franchisees 374.9 326.5Corporate store sales 75.5 15.6Rental income on leasehold and freehold property 24.2 18.5
474.6 360.6Discontinued operations
Royalties, franchise fees and sales to franchisees — 1.0Corporate store sales — 0.8
474.6 362.4

FINANCIAL STATEMENTS
Domino’s Pizza Group plc Annual Report & Accounts 201792
FINANCIAL STATEMENTS
Notes to the Group financial statements continued
53 weeks ended 31 December 2017
4. Segmental informationFor management purposes, the Group changed how it viewed its segments due to acquisitions made in the period. The Group is now organised into two geographical business units based on the operating models of the regions: the United Kingdom and Ireland operating more mature markets with a sub-franchise model and limited corporate stores, and International whose markets are at an earlier stage of development and which operate predominantly as corporate stores. The International segment includes Switzerland, Germany, Iceland, Norway and Sweden. These are considered to be the Group’s operating segments as the information provided to the chief operating decision makers, who are considered to be the Executive Directors of the Board, is based on these territories. Revenue included in each includes all sales (royalties, sales to franchisees and rental income) made to franchise stores and by corporate stores located in that segment.
Management monitors the operating results of its business units separately for the purpose of making decisions about resource allocation and performance assessment. Segment performance is evaluated based on operating profit or loss. Group financing (including finance costs and finance revenue) and income taxes are managed on a Group basis and are not allocated to operating segments. The comparative segment disclosures have been updated to reflect these changes.
Unallocated assets include cash and cash equivalents and taxation assets. Unallocated liabilities include the share buyback obligation, bank revolving facility and taxation liabilities.
At31 December
2017£m
At25 December
2016£m
Deferred tax asset 8.3 6.1Cash and cash equivalents 29.0 23.1
Unallocated assets 37.3 29.2
Current tax liabilities 8.2 6.2Deferred tax liabilities 7.8 0.4Bank revolving facility 113.9 56.7Share buyback obligation 18.3 10.0
Unallocated liabilities 148.2 73.3

CORPORATE GOVERNANCE FINANCIAL STATEMENTSSTRATEGIC REPORT
Annual Report & Accounts 2017 Domino’s Pizza Group plc 93
CORPORATE GOVERNANCE FINANCIAL STATEMENTSSTRATEGIC REPORT
4. Segmental information continuedOperating segments
53 weeks ended 31 December 2017 52 weeks ended 25 December 2016
International£m
UK & Ireland£m
Total£m
International£m
UK & Ireland£m
Total£m
RevenueSales to external customers 73.0 401.6 474.6 15.6 345.0 360.6
Segment revenue 73.0 401.6 474.6 15.6 345.0 360.6
ResultsUnderlying segment result (0.7) 92.7 92.0 (1.3) 84.3 83.0Non-underlying items (6.4) (14.0) (20.4) (3.1) — (3.1)Underlying share of profit of associates and joint ventures 1.5 2.4 3.9 1.0 2.1 3.1
Group operating profit (5.6) 81.1 75.5 (3.4) 86.4 83.0
Net gain on step acquisition of foreign operation 5.8 —
Net finance costs (0.1) (0.5)
Profit before taxation 81.2 82.5Taxation (14.4) (17.3)(Loss)/profit for the period from discontinued operations (0.2) 6.6
Profit for the year 66.6 71.8
Other segment informationDepreciation 4.9 4.1 9.0 1.5 3.4 4.9Amortisation 0.5 4.9 5.4 — 2.7 2.7Share-based payment charge 0.1 1.6 1.7 0.1 2.1 2.2
Entity-wide disclosuresRoyalties, franchise fees, sales to franchisees and corporate store income 73.0 377.4 450.4 15.6 326.5 342.1Rental income on leasehold and freehold property — 24.2 24.2 — 18.5 18.5
73.0 401.6 474.6 15.6 345.0 360.6
Segment assets Segment current assets 6.6 54.0 60.6 1.1 51.0 52.1Segment non-current assets 70.7 183.6 254.3 23.3 84.7 108.0Equity accounted investments – investment in associates 14.2 13.2 27.4 46.8 11.9 58.7Assets relating to discontinued operations 1.3 8.3Unallocated assets 37.3 29.3
Total assets 91.5 250.8 380.9 71.2 147.6 256.4
Segment liabilitiesLiabilities 18.6 146.5 165.1 3.9 69.1 73.0Liabilities relating to discontinued operations 2.9 2.9Unallocated liabilities 148.2 73.3
Total liabilities 18.6 146.5 316.2 3.9 69.1 149.2
* Revenue from external customers is made up of sales from corporate stores to the public and sales to non-corporate stores.
Major customersAnnual revenue from two franchisees amounted to £84.7m (2016: £76.9m) and £71.3m (2016: £67.4m) respectively, arising from sales reported in the UK and Ireland segment.

FINANCIAL STATEMENTS
Domino’s Pizza Group plc Annual Report & Accounts 201794
FINANCIAL STATEMENTS
Notes to the Group financial statements continued
53 weeks ended 31 December 2017
5. Group operating profitThis is stated after charging:
Continuing operations Discontinued operations Total
53 weeksended 31
December2017
£m
52 weeksended 25
December2016
£m
53 weeksended 31
December2017
£m
52 weeksended 25
December2016
£m
53 weeksended 31
December2017
£m
52 weeksended 25
December2016
£m
Depreciation of property, plant and equipment 9.0 4.9 — — 9.0 4.9Amortisation of prepaid lease charges 0.7 0.3 — — 0.7 0.3Amortisation of intangible assets 5.4 2.4 — — 5.4 2.4
Total depreciation and amortisation expense 15.1 7.6 — — 15.1 7.6
Operating lease payments (minimum lease payments)– Land and buildings 28.3 20.3 — — 28.3 20.3– Plant, machinery and vehicles 4.2 2.7 — — 4.2 2.7
Total operating lease payments recognised in the income statement 32.5 23.0 — — 32.5 23.0
Impairment loss recognised on non-current assets 2.0 — — — 2.0 —Net foreign currency gain (0.6) — — — (0.6) —Cost of inventories recognised as an expense 185.2 149.2 — 0.4 185.2 149.8Loss/(gain) on disposal of non-current assets 0.2 0.2 — (0.4) 0.2 (0.2)Gain on acquisition of foreign operation (5.8) — — — (5.8) —
6. Auditor’s remunerationThe Group paid the following amounts to its auditor in respect of the audit of the financial statements and for other services provided to the Group:
53 weeksended 31
December2017
£m
52 weeksended 25
December2016
£m
Fees payable to the Group’s auditor for the audit of the Group and Company annual accounts* 0.3 0.3Fees payable to the Company’s auditor and its associates for other services: Audit of the accounts of subsidiaries 0.2 0.2
Total audit fees 0.5 0.5Other services 0.1 0.1
Total audit and non-audit fees 0.6 0.6
* Of which £6,600 (2016: £6,600) relates to the Company.
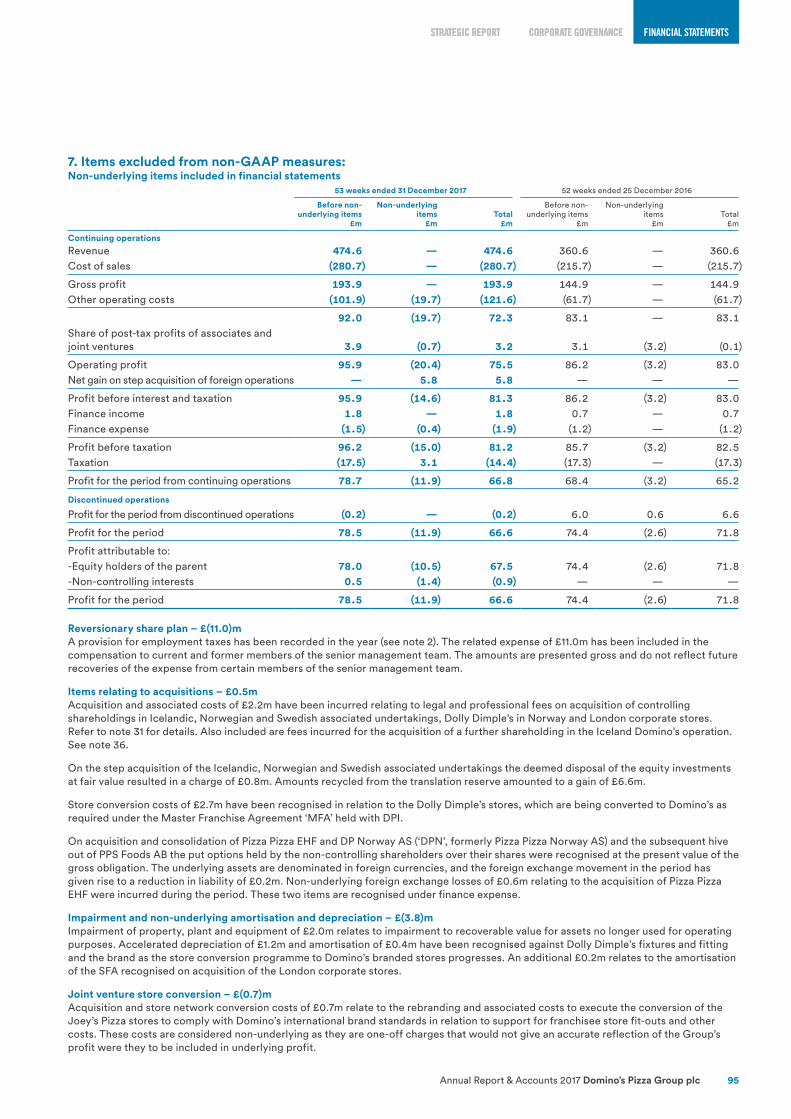
CORPORATE GOVERNANCE FINANCIAL STATEMENTSSTRATEGIC REPORT
Annual Report & Accounts 2017 Domino’s Pizza Group plc 95
CORPORATE GOVERNANCE FINANCIAL STATEMENTSSTRATEGIC REPORT
7. Items excluded from non-GAAP measures:Non-underlying items included in financial statements
53 weeks ended 31 December 2017 52 weeks ended 25 December 2016
Before non-underlying items
£m
Non-underlying items
£mTotal
£m
Before non-underlying items
£m
Non-underlying items
£mTotal
£m
Continuing operationsRevenue 474.6 — 474.6 360.6 — 360.6Cost of sales (280.7) — (280.7) (215.7) — (215.7)
Gross profit 193.9 — 193.9 144.9 — 144.9Other operating costs (101.9) (19.7) (121.6) (61.7) — (61.7)
92.0 (19.7) 72.3 83.1 — 83.1Share of post-tax profits of associates and joint ventures 3.9 (0.7) 3.2 3.1 (3.2) (0.1)
Operating profit 95.9 (20.4) 75.5 86.2 (3.2) 83.0Net gain on step acquisition of foreign operations — 5.8 5.8 — — —
Profit before interest and taxation 95.9 (14.6) 81.3 86.2 (3.2) 83.0Finance income 1.8 — 1.8 0.7 — 0.7Finance expense (1.5) (0.4) (1.9) (1.2) — (1.2)
Profit before taxation 96.2 (15.0) 81.2 85.7 (3.2) 82.5Taxation (17.5) 3.1 (14.4) (17.3) — (17.3)
Profit for the period from continuing operations 78.7 (11.9) 66.8 68.4 (3.2) 65.2
Discontinued operations Profit for the period from discontinued operations (0.2) — (0.2) 6.0 0.6 6.6
Profit for the period 78.5 (11.9) 66.6 74.4 (2.6) 71.8
Profit attributable to: -Equity holders of the parent 78.0 (10.5) 67.5 74.4 (2.6) 71.8-Non-controlling interests 0.5 (1.4) (0.9) — — —
Profit for the period 78.5 (11.9) 66.6 74.4 (2.6) 71.8
Reversionary share plan – £(11.0)mA provision for employment taxes has been recorded in the year (see note 2). The related expense of £11.0m has been included in the compensation to current and former members of the senior management team. The amounts are presented gross and do not reflect future recoveries of the expense from certain members of the senior management team.
Items relating to acquisitions – £0.5mAcquisition and associated costs of £2.2m have been incurred relating to legal and professional fees on acquisition of controlling shareholdings in Icelandic, Norwegian and Swedish associated undertakings, Dolly Dimple’s in Norway and London corporate stores. Refer to note 31 for details. Also included are fees incurred for the acquisition of a further shareholding in the Iceland Domino’s operation. See note 36.
On the step acquisition of the Icelandic, Norwegian and Swedish associated undertakings the deemed disposal of the equity investments at fair value resulted in a charge of £0.8m. Amounts recycled from the translation reserve amounted to a gain of £6.6m.
Store conversion costs of £2.7m have been recognised in relation to the Dolly Dimple’s stores, which are being converted to Domino’s as required under the Master Franchise Agreement ‘MFA’ held with DPI.
On acquisition and consolidation of Pizza Pizza EHF and DP Norway AS (‘DPN’, formerly Pizza Pizza Norway AS) and the subsequent hive out of PPS Foods AB the put options held by the non-controlling shareholders over their shares were recognised at the present value of the gross obligation. The underlying assets are denominated in foreign currencies, and the foreign exchange movement in the period has given rise to a reduction in liability of £0.2m. Non-underlying foreign exchange losses of £0.6m relating to the acquisition of Pizza Pizza EHF were incurred during the period. These two items are recognised under finance expense.
Impairment and non-underlying amortisation and depreciation – £(3.8)mImpairment of property, plant and equipment of £2.0m relates to impairment to recoverable value for assets no longer used for operating purposes. Accelerated depreciation of £1.2m and amortisation of £0.4m have been recognised against Dolly Dimple’s fixtures and fitting and the brand as the store conversion programme to Domino’s branded stores progresses. An additional £0.2m relates to the amortisation of the SFA recognised on acquisition of the London corporate stores.
Joint venture store conversion – £(0.7)m Acquisition and store network conversion costs of £0.7m relate to the rebranding and associated costs to execute the conversion of the Joey’s Pizza stores to comply with Domino’s international brand standards in relation to support for franchisee store fit-outs and other costs. These costs are considered non-underlying as they are one-off charges that would not give an accurate reflection of the Group’s profit were they to be included in underlying profit.

FINANCIAL STATEMENTS
Domino’s Pizza Group plc Annual Report & Accounts 201796
FINANCIAL STATEMENTS
Notes to the Group financial statements continued
53 weeks ended 31 December 2017
7. Items excluded from non-GAAP measures: continuedNon-underlying tax – £3.1m The tax credit of £3.1m relates to the non-underlying expenses.
The non-underlying items in the year have resulted in a net cash outflow of £5.1m.
8. Employee benefits and Directors’ remuneration(a) Employee benefits expense
53 weeksended
31 December2017
£m
52 weeksended
25 December2016
£m
Wages and salaries 53.3 35.3Social security costs 16.3 3.2Other pension costs 2.0 0.7Share-based payment charge 1.7 2.2
73.3 41.4
Of the above employee costs £73.3m (2016: £41.0m) relates to continuing operations. Included within Social security costs are £11.0m of costs in respect of historic share based remuneration schemes, as further detailed in note 2. For details of amounts relating to current and former Directors, refer to the Directors Remuneration Report on pages 58 and 59.
The average monthly number of employees during the year was made up as follows:
53 weeksended
31 December2017
52 weeksended
25 December2016
Administration 330 308Production and distribution 450 334Corporate stores 969 353
1,749 995
Continuing operations 1,749 911Discontinued operations — 84
1,749 995
(b) Directors’ remuneration53 weeks
ended31 December
2017£m
52 weeksended
25 December2016
£m
Directors’ remuneration 1.9 1.7
Aggregate contributions to defined contribution pension schemes 0.1 0.1
Number of Directors accruing benefits under:– defined contribution schemes 2 3
Additional information regarding Directors’ remuneration is included in the Directors’ remuneration report on pages 46 to 64.
9. Finance income53 weeks
ended31 December
2017£m
52 weeksended
25 December2016
£m
Bank interest receivable — 0.1Other interest receivable 0.3 —Interest on loans to associates and joint ventures 0.5 0.3Foreign exchange 1.0 0.3
Total finance income 1.8 0.7

CORPORATE GOVERNANCE FINANCIAL STATEMENTSSTRATEGIC REPORT
Annual Report & Accounts 2017 Domino’s Pizza Group plc 97
CORPORATE GOVERNANCE FINANCIAL STATEMENTSSTRATEGIC REPORT
10. Finance costs53 weeks
ended31 December
2017£m
52 weeksended
25 December2016
£m
Bank revolving credit facility interest payable 1.9 1.0Other interest payable — 0.2
Total finance costs 1.9 1.2
The finance expense relates to financial liabilities at amortised cost. Total interest on financial liabilities not at fair value through profit or loss, including loan costs related to finance for franchisee capital development reported within cost of sales, is £1.9m (2016: £1.2m).
11. Taxation(a) Tax on profit on ordinary activities
Continuing operations Discontinued operations Total
53 weeksended
31 December2017
£m
52 weeks ended
25 December2016
£m
53 weeksended
31 December2017
£m
52 weeksended
25 December2016
£m
53 weeksended
31 December2017
£m
52 weeksended
25 December2016
£m
Tax charged in the income statementCurrent income tax:UK corporation tax:– current period 15.5 15.5 0.2 1.8 15.7 17.3– adjustment in respect of prior periods (0.7) 0.3 0.2 (0.4) (0.5) (0.1)
14.8 15.8 0.4 1.4 15.2 17.2Income tax on overseas operations 1.6 0.6 — 0.9 1.6 1.5
Total current income tax charge/(credit) 16.4 16.4 0.4 2.3 16.8 18.7
Deferred tax:Origination and reversal of temporary differences (2.2) 0.6 — 0.3 (2.2) 0.9Effect of change in tax rate 0.5 0.3 — 0.1 0.5 0.4Adjustment in respect of prior periods (0.3) — — — (0.3) —
Total deferred tax (2.0) 0.9 — 0.4 (2.0) 1.3
Tax charge in the income statement 14.4 17.3 0.4 2.7 14.8 20.0
The tax charge in the income statement is disclosed as follows:Income tax expense 14.4 17.3 0.4 2.7 14.8 20.0
Tax relating to items credited/(charged) to equityReduction in current tax liability as a result of the exercise of share options 0.4 0.6 — — 0.4 0.6Origination and reversal of temporary differences in relation to unexercised share options 0.1 (0.5) — — 0.1 (0.5)
Tax credit in the Group statement of changes in equity 0.5 0.1 — — 0.5 0.1
There is no tax impact in relation to the foreign exchange differences in the statement of comprehensive income.

FINANCIAL STATEMENTS
Domino’s Pizza Group plc Annual Report & Accounts 201798
FINANCIAL STATEMENTS
Notes to the Group financial statements continued
53 weeks ended 31 December 2017
11. Taxation continued(b) Reconciliation of the total tax chargeThe tax expense in the income statement for the 53 weeks ended 31 December 2017 is lower (2016: higher) than the statutory corporation tax rate of 19.26% (2016: 20.00%). The differences are reconciled below:
53 weeksended
31 December2017
£m
52 weeksended
25 December2016
£m
Profit before taxation on continuing operations 81.2 82.5
Profit before taxation on discontinued operations 0.2 9.4
Profit before taxation 81.4 91.9
Accounting profit multiplied by the UK statutory rate of corporation tax of 19.26% (2016: 20.00%) 15.7 18.4Expenses not deductible for tax purposes 1.0 0.6Income not taxable (1.4) —Share of JV and associates’ results not taxable (0.6) —Accounting depreciation not eligible for tax purposes 0.3 0.1Adjustments relating to prior years — 1.1Impact of other tax reliefs — (0.1)Overseas losses carried forward 0.1 0.3Other 0.4 —Tax rate differences (0.7) (0.4)
Total tax expense reported in the income statement 14.8 20.0
Income tax attributable to continuing operations 14.4 17.3Income tax attributable to a discontinued operation 0.4 2.7
14.8 20.0
Effective tax rate – continuing and discontinued operations (%) 18.2 21.9Underlying effective tax rate – continuing operations (%) 18.3 20.3
At Budget 2016, the government announced a further reduction to the Corporation Tax main rate, which will have an effect on the Group’s current and future tax position. For the year starting 1 April 2020, the Corporation Tax main rate will be set at 17%. As a result, the relevant deferred tax balances have been remeasured as appropriate.
(c) Temporary differences associated with Group investmentsAt 31 December 2017, there was no recognised deferred tax liability (2016: £nil) for taxes that would be payable on the unremitted earnings of the Group’s subsidiaries, or its associates, as there are no corporation tax consequences of the Group’s UK, Irish or overseas subsidiaries or associates paying dividends to their parent companies.
There are also no income tax consequences for the Group attaching to the payment of dividends by the Group to its shareholders.
(d) Deferred taxThe deferred tax included in the balance sheet is as follows:
At31 December
2017£m
At25 December
2016£m
Deferred tax arising in the UK on non-capital items 6.2 5.4Deferred tax arising in the UK and ROI on capital gains (0.1) (0.1)Deferred tax arising on other overseas subsidiaries (0.4) 0.4Deferred tax arising on overseas losses 3.3 —Deferred tax arising on business combinations (8.5) —
Deferred tax on continuing operations 0.5 5.7
Represented as:Deferred tax asset 8.3 6.1Deferred tax liabilities (7.8) (0.4)
0.5 5.7

CORPORATE GOVERNANCE FINANCIAL STATEMENTSSTRATEGIC REPORT
Annual Report & Accounts 2017 Domino’s Pizza Group plc 99
CORPORATE GOVERNANCE FINANCIAL STATEMENTSSTRATEGIC REPORT
11. Taxation continued(d) Deferred tax continued
At31 December
2017£m
At25 December
2016£m
Gross movement in the deferred income tax accountOpening balance 5.7 7.6Liability at acquisition of subsidiaries (7.0) —Tax credit/(debit) to equity 0.1 (0.5)Income statement charge/credit 2.0 (1.4)Foreign exchange movements (0.3) —
Closing balance 0.5 5.7
Deferred tax arising in the UK on non-capital items
Share-basedpayments
£m
Acceleratedcapital
allowances£m
Leaseinducements
£mProvisions
£m
Reversionary interests
£mTotal
£m
At 27 December 2015 1.8 5.2 0.2 0.2 — 7.4Debit to equity (0.5) — — — — (0.5)Credit/(charge) to income 0.5 (2.2) — 0.2 — (1.5)
At 25 December 2016 1.8 3.0 0.2 0.4 — 5.4Asset at acquisition of subsidiaries — — — 0.3 — 0.3Debit to equity 0.1 — — — — 0.1Credit/(charge) to income 0.2 (1.4) (0.1) (0.2) 1.9 0.4
At 31 December 2017 2.1 1.6 0.1 0.5 1.9 6.2
A deferred tax asset of £6.2m (2016: £5.4m) has been recognised on continuing operations to the extent that future taxable profits are expected to be in excess of the profits arising from the reversal of existing taxable temporary differences.
The Group has tax losses of £6.3m (2016: £9.3m) which arose in relation to the Swiss business and are available to offset against future taxable profits in Switzerland. A deferred tax asset of £1.1m (2016: £0.7m) has been recognised in relation to these taxable losses in Switzerland on the basis they are expected to be recovered in the foreseeable future.
The Group has tax losses of £9.5m (2016: £nil) which arose in relation to the Nordic businesses and are available to offset against future taxable profits in Norway and Sweden. A deferred tax asset of £2.2m (2016: £nil) has been recognised in relation to these taxable losses in Norway and Sweden on the basis they are expected to be recovered in the foreseeable future.
Taxable losses that have arisen in the period in the German branch of Domino’s Pizza Germany Limited are available to surrender as Group relief to the UK Group and have been fully utilised.
12. Discontinued operationsIn December 2015, the Group agreed terms to dispose of the German operations and to enter a strategic associate arrangement with Domino’s Pizza Enterprises (‘DPE’), by setting up a new entity, Daytona JV Limited (‘Daytona’), to be owned one-third by Domino’s and two-thirds by DPE. Daytona owns the master franchise rights for the Domino’s brand in Germany and also acquired an existing German pizza chain, Joey’s Pizza.
Consideration for the disposal included a Market Access Fee (‘MAF’) of up to €25.0m (£21.2m). MAF payable by DPE to Domino’s Pizza Group plc is deferred consideration for the Company divesting its interest in operating Domino’s Pizza stores in Germany and its exclusive access to the German market. The MAF is payable in instalments, which become due annually up to six years from the date of the transaction. The payment of each instalment is determined by reference to Daytona achieving defined performance levels each calendar year. The amount included as consideration for the MAF is its estimated fair value, based on management’s evaluation of future underlying profitability.

FINANCIAL STATEMENTS
Domino’s Pizza Group plc Annual Report & Accounts 2017100
FINANCIAL STATEMENTS
Notes to the Group financial statements continued
53 weeks ended 31 December 2017
12. Discontinued operations continuedThe results of the discontinued operations, which have been included in the consolidated income statement, were as follows:
53 weeksended
31 December2017
£m
52 weeksended
25 December2016
£m
Revenue — 1.4Expenses – underlying 0.2 (2.3)
Underlying profit/(loss) before tax 0.2 (0.9)Income – non-underlying — 2.1Gain on disposal — 8.1
Profit before tax 0.2 9.3Attributable tax charge (0.4) (2.7)
Net (loss)/gain attributable to discontinued operations (attributable to owners of the Company) (0.2) 6.6
During the year, the discontinued operation decreased the Group’s net cash flows by £0.7m (2016: increased by £1.4m) and received £nil (2016: £1.3m) in respect of investing activities.
Within the tax charge of £0.4m (2016: £2.7m) is a tax charge of £nil (2016: £1.6m) relating to the gain on disposal of £nil (2016: £8.1m).
Non-underlying income in 2016 relates to the release of provision. The gain on disposal in 2016 relates to the recognition of the fair value of the MAF.
13. Earnings per shareBasic earnings per share amounts are calculated by dividing profit for the year attributable to ordinary equity holders of the parent by the weighted average number of Ordinary shares outstanding during the year.
Diluted earnings per share is calculated by dividing the profit attributable to ordinary equity holders of the parent by the weighted average number of Ordinary shares outstanding during the year plus the weighted average number of Ordinary shares that would have been issued on the conversion of all dilutive potential Ordinary shares into Ordinary shares.
Earnings
Continuing operations Notes
53 weeksended
31 December2017
£m
52 weeksended
25 December2016
£m
Profit attributable to owners of the parent 67.7 65.2Non-underlying items– Included in operating profit 7 19.7 —– Amounts included within share of post-tax result of associates and joint ventures 7 0.7 3.1– Net gain on step acquisition of foreign operations 7 (5.8) —– Net finance costs 7 0.4 —– Tax 7 (3.1) —– Attributable on non-controlling interests (1.4) —
Underlying profit attributable to owners of the parent 78.2 68.3
Continuing and discontinued operations
Continuing operations profit attributable to owners of the parent 67.7 65.2Discontinued operations (loss)/profit attributable to owners of the parent (0.2) 6.6
Total profit attributable to owners of the parent 67.5 71.8

CORPORATE GOVERNANCE FINANCIAL STATEMENTSSTRATEGIC REPORT
Annual Report & Accounts 2017 Domino’s Pizza Group plc 101
CORPORATE GOVERNANCE FINANCIAL STATEMENTSSTRATEGIC REPORT
13. Earnings per share continuedWeighted average number of shares
At31 December
2017Number
At25 December
2016Number
Basic weighted average number of shares (excluding treasury shares) 489,375,873 496,496,866Dilutive effect of share options and awards 6,690,858 7,453,287
Diluted weighted average number of shares 496,066,731 503,950,153
The performance conditions relating to share options granted over 2,041,160 shares (2016: 2,380,181) have not been met in the current financial period and therefore the dilutive effect of the number of shares which would have been issued at the period end has not been included in the diluted earnings per share calculation.
There are no share options excluded from the diluted earnings per share calculation because they would be antidilutive (2016: nil). See note 32 for further information on reversionary interests and share options.
Earnings per share
Continuing operations
53 weeksended
31 December2017
52 weeksended
25 December2016
Basic earnings per share 13.8p 13.1p
Diluted earnings per share 13.6p 12.9p
Underlying earnings per share:Basic earnings per share 16.0p 13.8p
Diluted earnings per share 15.8p 13.6p
Discontinued operations
Basic profits/(losses) per share — 1.3p
Diluted profits/(losses) per share — 1.3p
Continuing and discontinued operations
Basic earnings per share 13.8p 14.5p
Diluted earnings per share 13.6p 14.3p
14. Dividends paid and proposed53 weeks
ended31 December
2017£m
52 weeksended
25 December2016
£m
Declared and paid during the year:Equity dividends on Ordinary shares:Final dividend for 2016: 4.50p (2015: 3.92p) 22.0 19.5Interim dividend for 2017: 3.75p (2016: 3.50p) 18.4 17.5
Dividends paid 40.4 37.0
Proposed for approval by shareholders at the AGM (not recognised as a liability at 31 December 2017 or 25 December 2016)Final dividend for 2017: 5.25p (2016: 4.50p) 25.2 22.0
Dividends per share in the comparative period have been restated to reflect the sub-division of shares in the prior year. Refer to note 30 for more information.

FINANCIAL STATEMENTS
Domino’s Pizza Group plc Annual Report & Accounts 2017102
FINANCIAL STATEMENTS
Notes to the Group financial statements continued
53 weeks ended 31 December 2017
15. Intangible assetsGoodwill
£m
Franchisefees£m
Software£m
Other£m
Total£m
Cost or valuationAt 27 December 2015 1.6 13.7 17.9 0.5 33.7Additions — — 8.4 — 8.4Disposals — (9.8) (1.9) — (11.7)Foreign exchange on translation 0.3 0.4 0.1 — 0.8
At 25 December 2016 1.9 4.3 24.5 0.5 31.2Additions — — 6.4 0.3 6.7Acquisitions 47.8 44.9 — 1.9 94.6Disposals — — (0.2) — (0.2)Foreign exchange on translation — 0.3 — — 0.3
At 31 December 2017 49.7 49.5 30.7 2.7 132.6
Amortisation and impairmentAt 27 December 2015 — 11.3 10.2 0.2 21.7Provided during the year — — 2.5 — 2.5Disposals — (9.8) (1.6) — (11.4)Foreign exchange on translation — 0.1 0.1 — 0.2
At 25 December 2016 — 1.6 11.2 0.2 13.0Provided during the year — 0.2 4.8 0.4 5.4Disposals — — — — —Foreign exchange on translation — — — — —
At 31 December 2017 — 1.8 16.0 0.6 18.4
Net book value at 31 December 2017 49.7 47.7 14.7 2.1 114.2
Net book value at 25 December 2016 1.9 2.7 13.3 0.3 18.2
During the period the Group made a number of acquisitions, recognising intangible assets at fair value and goodwill at cost. Intangible assets recognised include the Master Franchise Agreements for Iceland, Norway and Sweden and the Standard Franchise Agreement for the London corporate stores. See note 31.
The carrying amount of goodwill and indefinite life intangibles has been allocated as follows:
At31 December
2017£m
At25 December
2016£m
GoodwillSwitzerland 1.8 1.9Norway 5.3 —Sweden 3.7 —Iceland 12.4 —UK corporate stores 26.5 —
49.7 1.9
Indefinite life intangiblesSwitzerland 2.7 2.7Norway 10.2 —Sweden 9.6 —Iceland 22.1 —
44.6 2.7
94.3 4.6
UK and international investmentsThe Group is obliged to test goodwill and indefinite life intangibles annually for impairment, or more frequently if there are indications that goodwill and indefinite life intangibles might be impaired, due to the goodwill deemed to have an indefinite useful life.
In order to perform this test, management is required to compare the carrying value of the relevant cash generating unit (‘CGU’) including the goodwill with its recoverable amount. The recoverable amounts of the CGU are determined from a value in use calculation. The key assumptions for the valuation are those regarding discount rates and expected changes to the level of sales in stores. Management estimates discount rates using pre-tax rates that reflect current market assessment of the time value of money and the risks specific to the CGU.
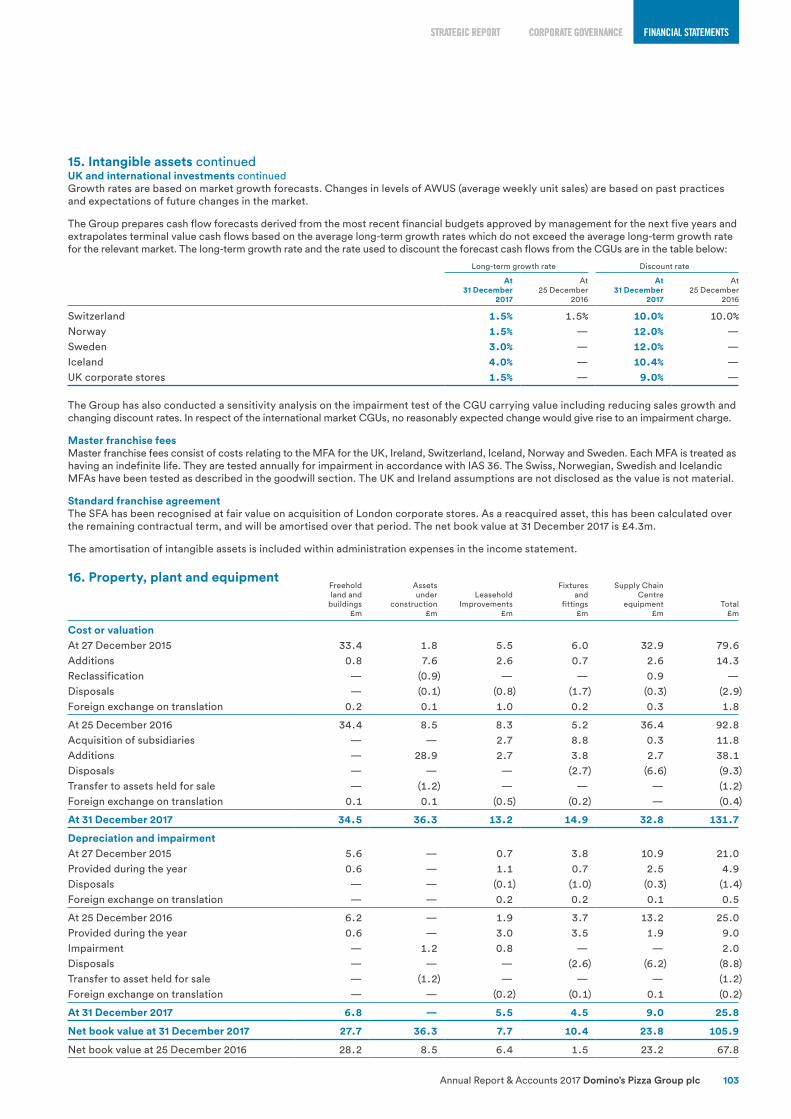
CORPORATE GOVERNANCE FINANCIAL STATEMENTSSTRATEGIC REPORT
Annual Report & Accounts 2017 Domino’s Pizza Group plc 103
CORPORATE GOVERNANCE FINANCIAL STATEMENTSSTRATEGIC REPORT
15. Intangible assets continuedUK and international investments continuedGrowth rates are based on market growth forecasts. Changes in levels of AWUS (average weekly unit sales) are based on past practices and expectations of future changes in the market.
The Group prepares cash flow forecasts derived from the most recent financial budgets approved by management for the next five years and extrapolates terminal value cash flows based on the average long-term growth rates which do not exceed the average long-term growth rate for the relevant market. The long-term growth rate and the rate used to discount the forecast cash flows from the CGUs are in the table below:
Long-term growth rate Discount rate
At31 December
2017
At25 December
2016
At31 December
2017
At25 December
2016
Switzerland 1.5% 1.5% 10.0% 10.0%Norway 1.5% — 12.0% —Sweden 3.0% — 12.0% —Iceland 4.0% — 10.4% —UK corporate stores 1.5% — 9.0% —
The Group has also conducted a sensitivity analysis on the impairment test of the CGU carrying value including reducing sales growth and changing discount rates. In respect of the international market CGUs, no reasonably expected change would give rise to an impairment charge.
Master franchise feesMaster franchise fees consist of costs relating to the MFA for the UK, Ireland, Switzerland, Iceland, Norway and Sweden. Each MFA is treated as having an indefinite life. They are tested annually for impairment in accordance with IAS 36. The Swiss, Norwegian, Swedish and Icelandic MFAs have been tested as described in the goodwill section. The UK and Ireland assumptions are not disclosed as the value is not material.
Standard franchise agreementThe SFA has been recognised at fair value on acquisition of London corporate stores. As a reacquired asset, this has been calculated over the remaining contractual term, and will be amortised over that period. The net book value at 31 December 2017 is £4.3m.
The amortisation of intangible assets is included within administration expenses in the income statement.
16. Property, plant and equipment
Freeholdland and
buildings£m
Assetsunder
construction£m
LeaseholdImprovements
£m
Fixturesand
fittings£m
Supply ChainCentre
equipment£m
Total£m
Cost or valuation At 27 December 2015 33.4 1.8 5.5 6.0 32.9 79.6Additions 0.8 7.6 2.6 0.7 2.6 14.3Reclassification — (0.9) — — 0.9 —Disposals — (0.1) (0.8) (1.7) (0.3) (2.9)Foreign exchange on translation 0.2 0.1 1.0 0.2 0.3 1.8
At 25 December 2016 34.4 8.5 8.3 5.2 36.4 92.8Acquisition of subsidiaries — — 2.7 8.8 0.3 11.8Additions — 28.9 2.7 3.8 2.7 38.1Disposals — — — (2.7) (6.6) (9.3)Transfer to assets held for sale — (1.2) — — — (1.2)Foreign exchange on translation 0.1 0.1 (0.5) (0.2) — (0.4)
At 31 December 2017 34.5 36.3 13.2 14.9 32.8 131.7
Depreciation and impairment At 27 December 2015 5.6 — 0.7 3.8 10.9 21.0Provided during the year 0.6 — 1.1 0.7 2.5 4.9Disposals — — (0.1) (1.0) (0.3) (1.4)Foreign exchange on translation — — 0.2 0.2 0.1 0.5
At 25 December 2016 6.2 — 1.9 3.7 13.2 25.0Provided during the year 0.6 — 3.0 3.5 1.9 9.0Impairment — 1.2 0.8 — — 2.0Disposals — — — (2.6) (6.2) (8.8)Transfer to asset held for sale — (1.2) — — — (1.2)Foreign exchange on translation — — (0.2) (0.1) 0.1 (0.2)
At 31 December 2017 6.8 — 5.5 4.5 9.0 25.8
Net book value at 31 December 2017 27.7 36.3 7.7 10.4 23.8 105.9
Net book value at 25 December 2016 28.2 8.5 6.4 1.5 23.2 67.8
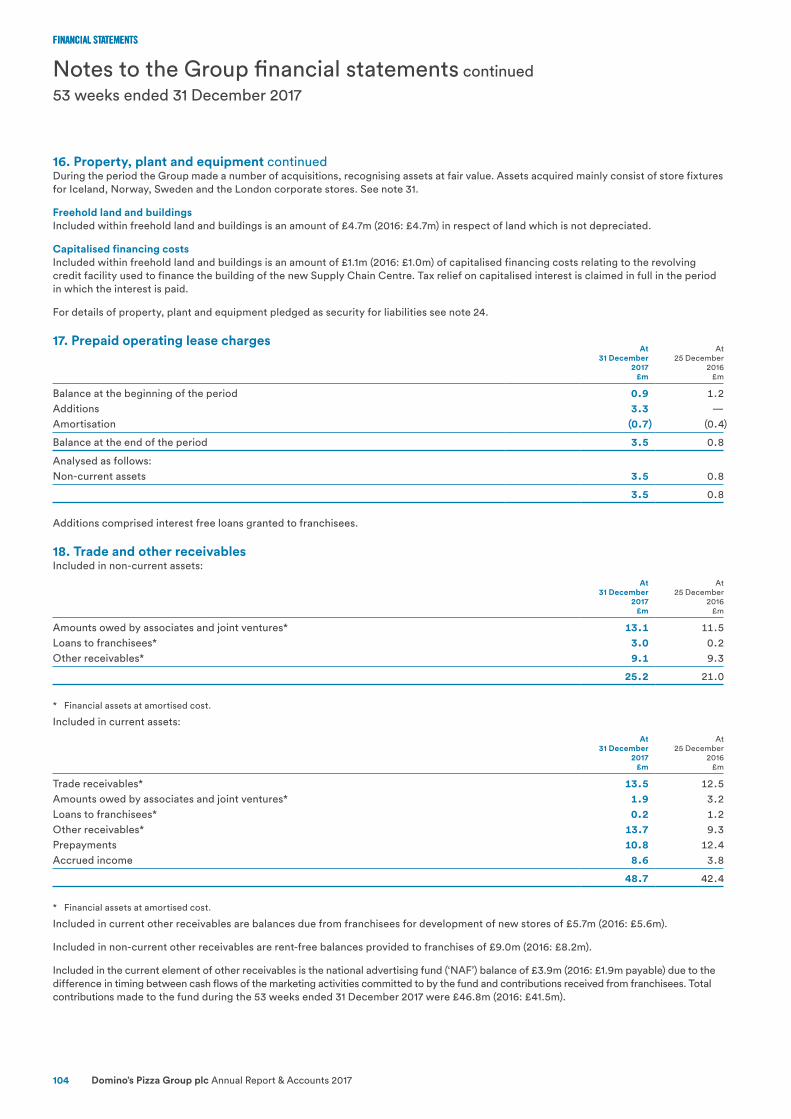
FINANCIAL STATEMENTS
Domino’s Pizza Group plc Annual Report & Accounts 2017104
FINANCIAL STATEMENTS
Notes to the Group financial statements continued
53 weeks ended 31 December 2017
16. Property, plant and equipment continuedDuring the period the Group made a number of acquisitions, recognising assets at fair value. Assets acquired mainly consist of store fixtures for Iceland, Norway, Sweden and the London corporate stores. See note 31.
Freehold land and buildingsIncluded within freehold land and buildings is an amount of £4.7m (2016: £4.7m) in respect of land which is not depreciated.
Capitalised financing costsIncluded within freehold land and buildings is an amount of £1.1m (2016: £1.0m) of capitalised financing costs relating to the revolving credit facility used to finance the building of the new Supply Chain Centre. Tax relief on capitalised interest is claimed in full in the period in which the interest is paid.
For details of property, plant and equipment pledged as security for liabilities see note 24.
17. Prepaid operating lease chargesAt
31 December2017
£m
At25 December
2016£m
Balance at the beginning of the period 0.9 1.2Additions 3.3 —Amortisation (0.7) (0.4)
Balance at the end of the period 3.5 0.8
Analysed as follows: Non-current assets 3.5 0.8
3.5 0.8
Additions comprised interest free loans granted to franchisees.
18. Trade and other receivablesIncluded in non-current assets:
At31 December
2017£m
At25 December
2016£m
Amounts owed by associates and joint ventures* 13.1 11.5Loans to franchisees* 3.0 0.2Other receivables* 9.1 9.3
25.2 21.0
* Financial assets at amortised cost.
Included in current assets:
At31 December
2017£m
At25 December
2016£m
Trade receivables* 13.5 12.5Amounts owed by associates and joint ventures* 1.9 3.2Loans to franchisees* 0.2 1.2Other receivables* 13.7 9.3Prepayments 10.8 12.4Accrued income 8.6 3.8
48.7 42.4
* Financial assets at amortised cost.
Included in current other receivables are balances due from franchisees for development of new stores of £5.7m (2016: £5.6m).
Included in non-current other receivables are rent-free balances provided to franchises of £9.0m (2016: £8.2m).
Included in the current element of other receivables is the national advertising fund (‘NAF’) balance of £3.9m (2016: £1.9m payable) due to the difference in timing between cash flows of the marketing activities committed to by the fund and contributions received from franchisees. Total contributions made to the fund during the 53 weeks ended 31 December 2017 were £46.8m (2016: £41.5m).

CORPORATE GOVERNANCE FINANCIAL STATEMENTSSTRATEGIC REPORT
Annual Report & Accounts 2017 Domino’s Pizza Group plc 105
CORPORATE GOVERNANCE FINANCIAL STATEMENTSSTRATEGIC REPORT
18. Trade and other receivables continuedTrade receivablesTrade receivables are denominated in the following currencies:
At31 December
2017£m
At25 December
2016£m
Sterling 10.5 10.5Euro 0.8 1.8Swiss franc 0.4 0.2Icelandic krona 0.2 —Norwegian krone 1.0 —Swedish krona 0.6 —
13.5 12.5
The Euro-denominated receivables relate to franchisee receivables within the Group’s Irish operations, the functional currency of which is the Euro.
Trade receivables are non-interest bearing and are generally on seven to 28 day terms. As at 31 December 2017, trade receivables at nominal value of £0.4m (2016: £0.2m) were provided for.
The ageing analysis of trade receivables is as follows:
Total£m
Neitherpast
due norimpaired
£m
Past due but not impaired
<30 days£m
>30 days£m
At 31 December 2017 13.5 12.4 0.2 1.9At 25 December 2016 12.5 9.9 2.1 0.5
Loans to franchiseesLoans to franchisees are repayable within one to five years. The loans are either interest free or bear interest on a quarterly basis at an average of 3.0% above LIBOR and are repaid in monthly or quarterly instalments.
Amounts owed by associates and joint venturesAt
31 December2017
£m
At25 December
2016£m
Amounts owed by associates 14.0 13.6Amounts owed by joint ventures 1.0 1.1
15.0 14.7
Included within the balance due from associates are loan balances totalling £0.9m (2016: £0.3m) due from Full House Restaurants Holdings Limited and £13.2m (2016: £11.5m) due from Daytona JV Limited. Included within the balance due from joint ventures are loan balances of £0.7m due from DP Shayban Limited (2016: £0.4m) and £0.3m due from Domino’s Pizza West Country Limited (2016: £0.2m).
The terms of the loans to Full House and the joint ventures are consistent with the loan terms provided to franchisees (see above).
The remainder of the balance due from associates and joint ventures represents trading balances.
An analysis is provided below of the movement in trading and loan balances with associates and joint ventures:
Tradingbalance
£m
Loanbalance
£mTotal
£m
At 27 December 2015 0.8 1.4 2.2Movement in trading balance 1.5 — 1.5Movement in loan balance — 11.0 11.0
At 25 December 2016 2.3 12.4 14.7Movement in trading balance (0.4) — (0.4)Movement in loan balance — 0.7 0.7
At 31 December 2017 1.9 13.1 15.0
The movement in the trading balance is included within the “increase in receivables” in “cash generated from operations” in the cash flow statement.
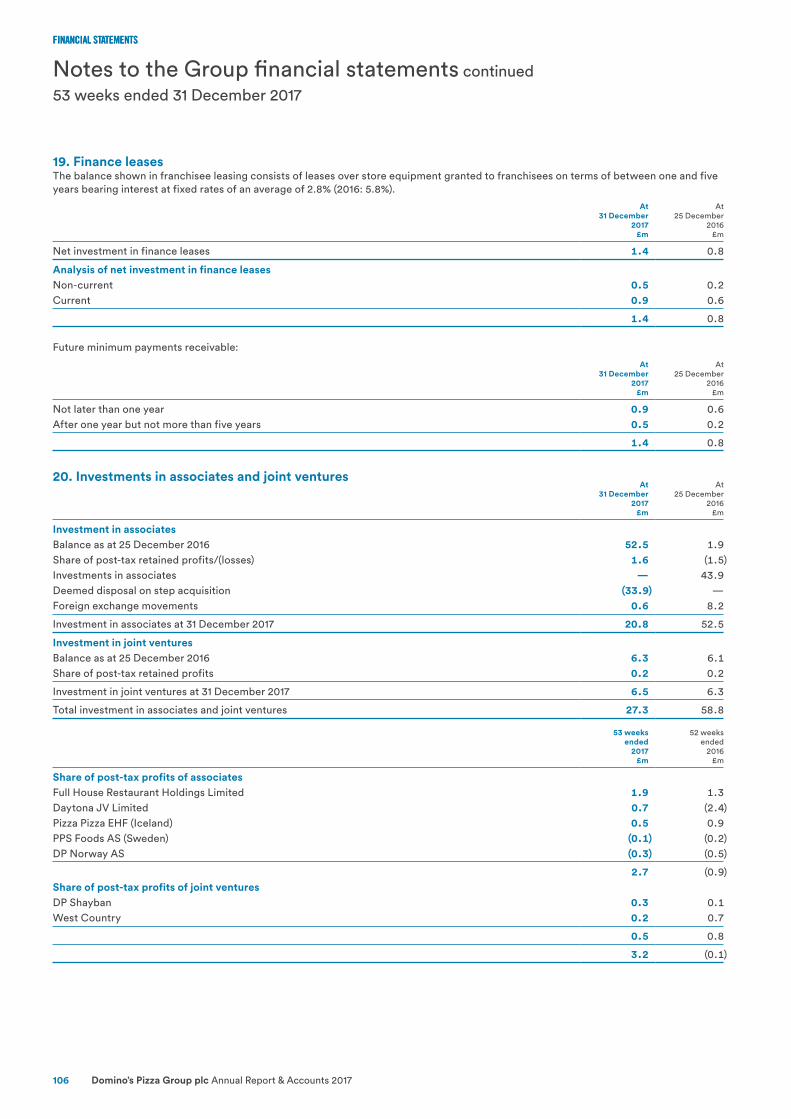
FINANCIAL STATEMENTS
Domino’s Pizza Group plc Annual Report & Accounts 2017106
FINANCIAL STATEMENTS
Notes to the Group financial statements continued
53 weeks ended 31 December 2017
19. Finance leasesThe balance shown in franchisee leasing consists of leases over store equipment granted to franchisees on terms of between one and five years bearing interest at fixed rates of an average of 2.8% (2016: 5.8%).
At31 December
2017£m
At25 December
2016£m
Net investment in finance leases 1.4 0.8
Analysis of net investment in finance leasesNon-current 0.5 0.2Current 0.9 0.6
1.4 0.8
Future minimum payments receivable:
At31 December
2017£m
At25 December
2016£m
Not later than one year 0.9 0.6After one year but not more than five years 0.5 0.2
1.4 0.8
20. Investments in associates and joint venturesAt
31 December2017
£m
At 25 December
2016£m
Investment in associatesBalance as at 25 December 2016 52.5 1.9Share of post-tax retained profits/(losses) 1.6 (1.5)Investments in associates — 43.9Deemed disposal on step acquisition (33.9) —Foreign exchange movements 0.6 8.2
Investment in associates at 31 December 2017 20.8 52.5
Investment in joint ventures Balance as at 25 December 2016 6.3 6.1Share of post-tax retained profits 0.2 0.2
Investment in joint ventures at 31 December 2017 6.5 6.3
Total investment in associates and joint ventures 27.3 58.8
53 weeksended
2017£m
52 weeksended
2016£m
Share of post-tax profits of associatesFull House Restaurant Holdings Limited 1.9 1.3Daytona JV Limited 0.7 (2.4)Pizza Pizza EHF (Iceland) 0.5 0.9PPS Foods AS (Sweden) (0.1) (0.2)DP Norway AS (0.3) (0.5)
2.7 (0.9)Share of post-tax profits of joint venturesDP Shayban 0.3 0.1West Country 0.2 0.7
0.5 0.8
3.2 (0.1)
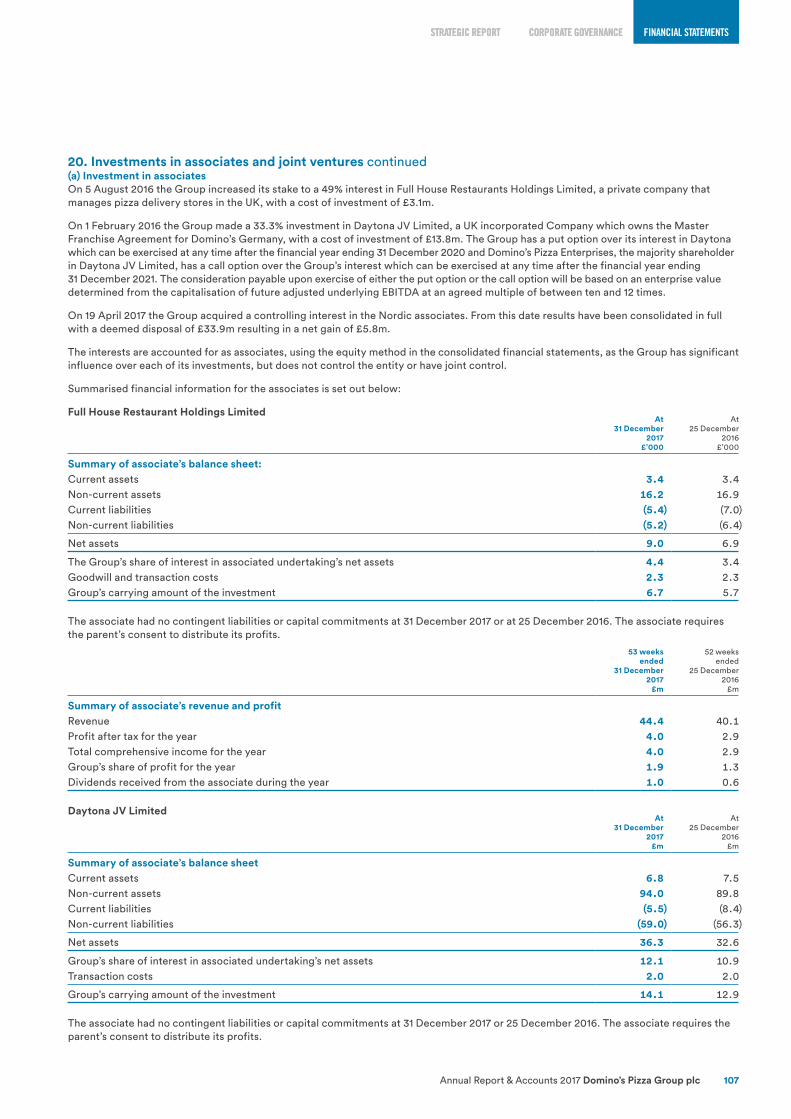
CORPORATE GOVERNANCE FINANCIAL STATEMENTSSTRATEGIC REPORT
Annual Report & Accounts 2017 Domino’s Pizza Group plc 107
CORPORATE GOVERNANCE FINANCIAL STATEMENTSSTRATEGIC REPORT
20. Investments in associates and joint ventures continued(a) Investment in associatesOn 5 August 2016 the Group increased its stake to a 49% interest in Full House Restaurants Holdings Limited, a private company that manages pizza delivery stores in the UK, with a cost of investment of £3.1m.
On 1 February 2016 the Group made a 33.3% investment in Daytona JV Limited, a UK incorporated Company which owns the Master Franchise Agreement for Domino’s Germany, with a cost of investment of £13.8m. The Group has a put option over its interest in Daytona which can be exercised at any time after the financial year ending 31 December 2020 and Domino’s Pizza Enterprises, the majority shareholder in Daytona JV Limited, has a call option over the Group’s interest which can be exercised at any time after the financial year ending 31 December 2021. The consideration payable upon exercise of either the put option or the call option will be based on an enterprise value determined from the capitalisation of future adjusted underlying EBITDA at an agreed multiple of between ten and 12 times.
On 19 April 2017 the Group acquired a controlling interest in the Nordic associates. From this date results have been consolidated in full with a deemed disposal of £33.9m resulting in a net gain of £5.8m.
The interests are accounted for as associates, using the equity method in the consolidated financial statements, as the Group has significant influence over each of its investments, but does not control the entity or have joint control.
Summarised financial information for the associates is set out below:
Full House Restaurant Holdings LimitedAt
31 December 2017
£’000
At25 December
2016£’000
Summary of associate’s balance sheet:Current assets 3.4 3.4Non-current assets 16.2 16.9Current liabilities (5.4) (7.0)Non-current liabilities (5.2) (6.4)
Net assets 9.0 6.9
The Group’s share of interest in associated undertaking’s net assets 4.4 3.4Goodwill and transaction costs 2.3 2.3Group’s carrying amount of the investment 6.7 5.7
The associate had no contingent liabilities or capital commitments at 31 December 2017 or at 25 December 2016. The associate requires the parent’s consent to distribute its profits.
53 weeksended
31 December2017
£m
52 weeksended
25 December2016
£m
Summary of associate’s revenue and profitRevenue 44.4 40.1Profit after tax for the year 4.0 2.9Total comprehensive income for the year 4.0 2.9Group’s share of profit for the year 1.9 1.3Dividends received from the associate during the year 1.0 0.6
Daytona JV LimitedAt
31 December2017
£m
At25 December
2016£m
Summary of associate’s balance sheetCurrent assets 6.8 7.5Non-current assets 94.0 89.8Current liabilities (5.5) (8.4)Non-current liabilities (59.0) (56.3)
Net assets 36.3 32.6
Group’s share of interest in associated undertaking’s net assets 12.1 10.9Transaction costs 2.0 2.0
Group’s carrying amount of the investment 14.1 12.9
The associate had no contingent liabilities or capital commitments at 31 December 2017 or 25 December 2016. The associate requires the parent’s consent to distribute its profits.
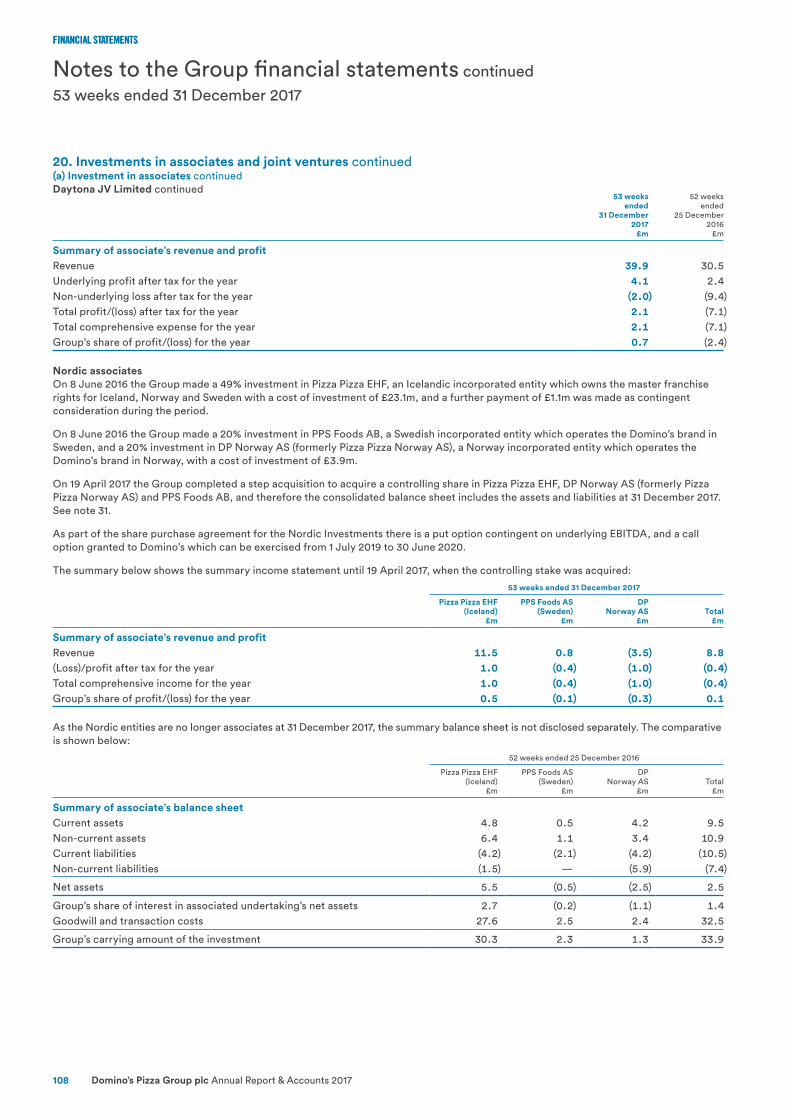
FINANCIAL STATEMENTS
Domino’s Pizza Group plc Annual Report & Accounts 2017108
FINANCIAL STATEMENTS
Notes to the Group financial statements continued
53 weeks ended 31 December 2017
20. Investments in associates and joint ventures continued(a) Investment in associates continuedDaytona JV Limited continued
53 weeksended
31 December2017
£m
52 weeksended
25 December2016
£m
Summary of associate’s revenue and profitRevenue 39.9 30.5Underlying profit after tax for the year 4.1 2.4Non-underlying loss after tax for the year (2.0) (9.4)Total profit/(loss) after tax for the year 2.1 (7.1)Total comprehensive expense for the year 2.1 (7.1)Group’s share of profit/(loss) for the year 0.7 (2.4)
Nordic associatesOn 8 June 2016 the Group made a 49% investment in Pizza Pizza EHF, an Icelandic incorporated entity which owns the master franchise rights for Iceland, Norway and Sweden with a cost of investment of £23.1m, and a further payment of £1.1m was made as contingent consideration during the period.
On 8 June 2016 the Group made a 20% investment in PPS Foods AB, a Swedish incorporated entity which operates the Domino’s brand in Sweden, and a 20% investment in DP Norway AS (formerly Pizza Pizza Norway AS), a Norway incorporated entity which operates the Domino’s brand in Norway, with a cost of investment of £3.9m.
On 19 April 2017 the Group completed a step acquisition to acquire a controlling share in Pizza Pizza EHF, DP Norway AS (formerly Pizza Pizza Norway AS) and PPS Foods AB, and therefore the consolidated balance sheet includes the assets and liabilities at 31 December 2017. See note 31.
As part of the share purchase agreement for the Nordic Investments there is a put option contingent on underlying EBITDA, and a call option granted to Domino’s which can be exercised from 1 July 2019 to 30 June 2020.
The summary below shows the summary income statement until 19 April 2017, when the controlling stake was acquired:
53 weeks ended 31 December 2017
Pizza Pizza EHF(Iceland)
£m
PPS Foods AS(Sweden)
£m
DPNorway AS
£mTotal
£m
Summary of associate’s revenue and profitRevenue 11.5 0.8 (3.5) 8.8(Loss)/profit after tax for the year 1.0 (0.4) (1.0) (0.4)Total comprehensive income for the year 1.0 (0.4) (1.0) (0.4)Group’s share of profit/(loss) for the year 0.5 (0.1) (0.3) 0.1
As the Nordic entities are no longer associates at 31 December 2017, the summary balance sheet is not disclosed separately. The comparative is shown below:
52 weeks ended 25 December 2016
Pizza Pizza EHF(Iceland)
£m
PPS Foods AS(Sweden)
£m
DPNorway AS
£mTotal
£m
Summary of associate’s balance sheetCurrent assets 4.8 0.5 4.2 9.5Non-current assets 6.4 1.1 3.4 10.9Current liabilities (4.2) (2.1) (4.2) (10.5)Non-current liabilities (1.5) — (5.9) (7.4)
Net assets 5.5 (0.5) (2.5) 2.5
Group’s share of interest in associated undertaking’s net assets 2.7 (0.2) (1.1) 1.4Goodwill and transaction costs 27.6 2.5 2.4 32.5
Group’s carrying amount of the investment 30.3 2.3 1.3 33.9
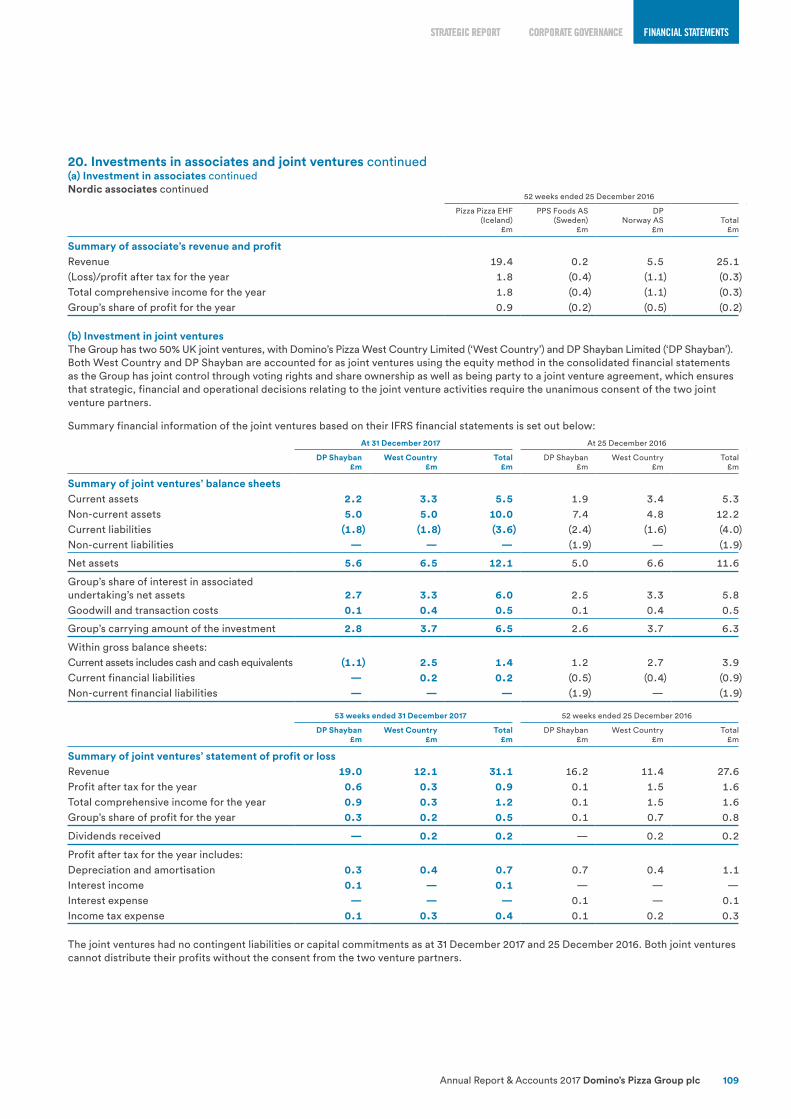
CORPORATE GOVERNANCE FINANCIAL STATEMENTSSTRATEGIC REPORT
Annual Report & Accounts 2017 Domino’s Pizza Group plc 109
CORPORATE GOVERNANCE FINANCIAL STATEMENTSSTRATEGIC REPORT
20. Investments in associates and joint ventures continued(a) Investment in associates continuedNordic associates continued
52 weeks ended 25 December 2016
Pizza Pizza EHF(Iceland)
£m
PPS Foods AS(Sweden)
£m
DPNorway AS
£mTotal
£m
Summary of associate’s revenue and profitRevenue 19.4 0.2 5.5 25.1(Loss)/profit after tax for the year 1.8 (0.4) (1.1) (0.3)Total comprehensive income for the year 1.8 (0.4) (1.1) (0.3)Group’s share of profit for the year 0.9 (0.2) (0.5) (0.2)
(b) Investment in joint venturesThe Group has two 50% UK joint ventures, with Domino’s Pizza West Country Limited (‘West Country’) and DP Shayban Limited (‘DP Shayban’). Both West Country and DP Shayban are accounted for as joint ventures using the equity method in the consolidated financial statements as the Group has joint control through voting rights and share ownership as well as being party to a joint venture agreement, which ensures that strategic, financial and operational decisions relating to the joint venture activities require the unanimous consent of the two joint venture partners.
Summary financial information of the joint ventures based on their IFRS financial statements is set out below:
At 31 December 2017 At 25 December 2016
DP Shayban£m
West Country£m
Total£m
DP Shayban£m
West Country£m
Total£m
Summary of joint ventures’ balance sheetsCurrent assets 2.2 3.3 5.5 1.9 3.4 5.3Non-current assets 5.0 5.0 10.0 7.4 4.8 12.2Current liabilities (1.8) (1.8) (3.6) (2.4) (1.6) (4.0)Non-current liabilities — — — (1.9) — (1.9)
Net assets 5.6 6.5 12.1 5.0 6.6 11.6
Group’s share of interest in associated undertaking’s net assets 2.7 3.3 6.0 2.5 3.3 5.8Goodwill and transaction costs 0.1 0.4 0.5 0.1 0.4 0.5
Group’s carrying amount of the investment 2.8 3.7 6.5 2.6 3.7 6.3
Within gross balance sheets: Current assets includes cash and cash equivalents (1.1) 2.5 1.4 1.2 2.7 3.9Current financial liabilities — 0.2 0.2 (0.5) (0.4) (0.9)Non-current financial liabilities — — — (1.9) — (1.9)
53 weeks ended 31 December 2017 52 weeks ended 25 December 2016
DP Shayban£m
West Country£m
Total£m
DP Shayban£m
West Country£m
Total£m
Summary of joint ventures’ statement of profit or lossRevenue 19.0 12.1 31.1 16.2 11.4 27.6Profit after tax for the year 0.6 0.3 0.9 0.1 1.5 1.6Total comprehensive income for the year 0.9 0.3 1.2 0.1 1.5 1.6Group’s share of profit for the year 0.3 0.2 0.5 0.1 0.7 0.8
Dividends received — 0.2 0.2 — 0.2 0.2
Profit after tax for the year includes: Depreciation and amortisation 0.3 0.4 0.7 0.7 0.4 1.1Interest income 0.1 — 0.1 — — —Interest expense — — — 0.1 — 0.1Income tax expense 0.1 0.3 0.4 0.1 0.2 0.3
The joint ventures had no contingent liabilities or capital commitments as at 31 December 2017 and 25 December 2016. Both joint ventures cannot distribute their profits without the consent from the two venture partners.
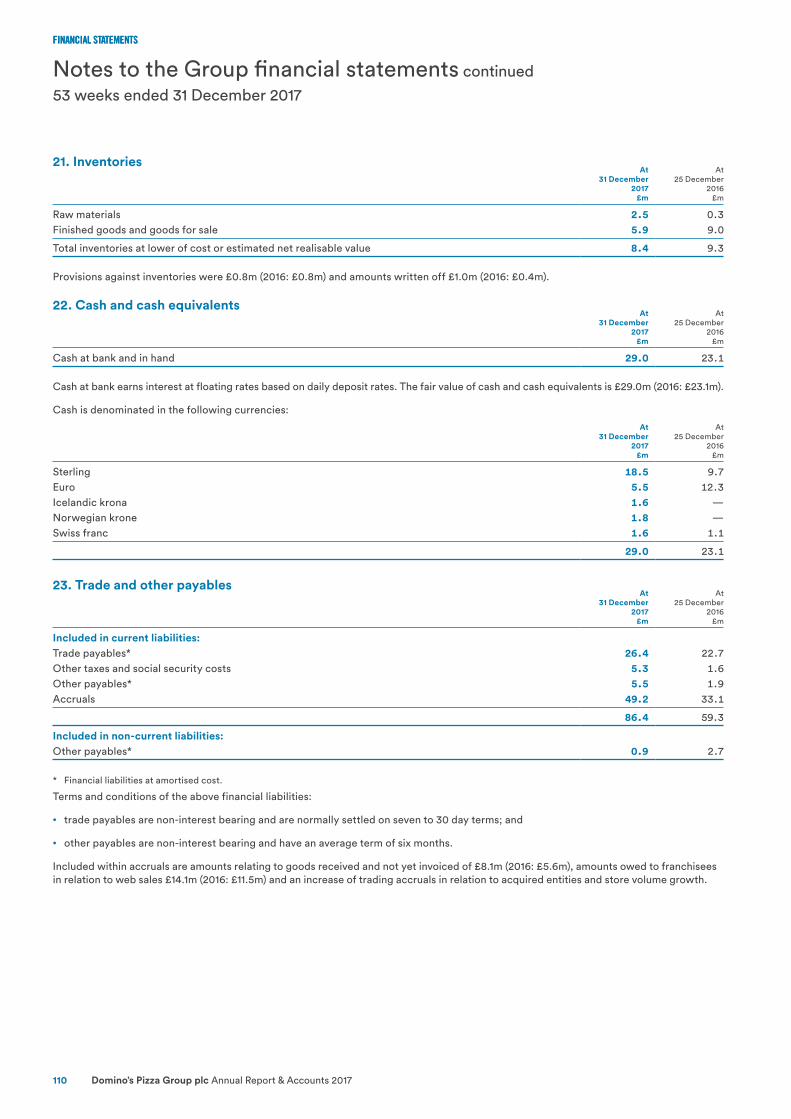
FINANCIAL STATEMENTS
Domino’s Pizza Group plc Annual Report & Accounts 2017110
FINANCIAL STATEMENTS
Notes to the Group financial statements continued
53 weeks ended 31 December 2017
21. InventoriesAt
31 December2017
£m
At25 December
2016£m
Raw materials 2.5 0.3Finished goods and goods for sale 5.9 9.0
Total inventories at lower of cost or estimated net realisable value 8.4 9.3
Provisions against inventories were £0.8m (2016: £0.8m) and amounts written off £1.0m (2016: £0.4m).
22. Cash and cash equivalentsAt
31 December2017
£m
At25 December
2016£m
Cash at bank and in hand 29.0 23.1
Cash at bank earns interest at floating rates based on daily deposit rates. The fair value of cash and cash equivalents is £29.0m (2016: £23.1m).
Cash is denominated in the following currencies:
At31 December
2017£m
At25 December
2016£m
Sterling 18.5 9.7Euro 5.5 12.3Icelandic krona 1.6 —Norwegian krone 1.8 —Swiss franc 1.6 1.1
29.0 23.1
23. Trade and other payablesAt
31 December2017
£m
At25 December
2016£m
Included in current liabilities:Trade payables* 26.4 22.7Other taxes and social security costs 5.3 1.6Other payables* 5.5 1.9Accruals 49.2 33.1
86.4 59.3
Included in non-current liabilities: Other payables* 0.9 2.7
* Financial liabilities at amortised cost.
Terms and conditions of the above financial liabilities:
• trade payables are non-interest bearing and are normally settled on seven to 30 day terms; and
• other payables are non-interest bearing and have an average term of six months.
Included within accruals are amounts relating to goods received and not yet invoiced of £8.1m (2016: £5.6m), amounts owed to franchisees in relation to web sales £14.1m (2016: £11.5m) and an increase of trading accruals in relation to acquired entities and store volume growth.

CORPORATE GOVERNANCE FINANCIAL STATEMENTSSTRATEGIC REPORT
Annual Report & Accounts 2017 Domino’s Pizza Group plc 111
CORPORATE GOVERNANCE FINANCIAL STATEMENTSSTRATEGIC REPORT
24. Financial liabilitiesAt
31 December2017
£m
At25 December
2016£m
CurrentCurrent instalments due on other loans 0.2 0.6Current instalments due on finance leases 0.4 0.1
0.6 0.7Gross put option liabilities 5.6 —
6.2 0.7Share buyback obligations 18.3 10.0
24.5 10.7
Non-current Bank revolving facility 113.9 56.7Non-current instalments due on other loans 3.7 0.3Gross put option liabilities 34.7 —
152.3 57.0
Banking facilitiesAt 31 December 2017 the Group had a total of £359.5m (2016: £180.0m) of banking facilities, of which £241.3m (2016: £118.3m) was undrawn.
Bank revolving facilityOn 8 July 2017, the Group extended the existing multi-currency syndicated revolving credit facility by one year to 8 July 2022. Subsequently, on 13 December 2017 the revolving credit facility was amended and extended to £350.0m with a term of five years.
Interest charged on the revolving credit facility ranges from 0.75% per annum above LIBOR (or equivalent) when the Group’s leverage is less than 1:1 up to 1.80% per annum above LIBOR for leverage above 2.5:1. A further utilisation fee is charged if over one-third utilised at 0.15% which rises to 0.30% of the margin rate if over two-thirds is drawn. In addition, a commitment fee is calculated on undrawn amounts based on 35% of the current applicable margin.
Arrangement fees of £3.2m (2016: £1.4m) directly incurred in relation to the facility are included in the carrying values of the facility and are being amortised over the term of the facility. Arrangement fees of £0.2m previously capitalised have been written off in the year.
An ancillary overdraft and pooling arrangement is in place with Barclays Bank Plc for £10.0m covering the Company, Domino’s Pizza UK and Ireland Limited, DPG Holdings Limited, and DP Pizza Limited. An ancillary overdraft is in place with Barclays Bank Plc for €5.0m for Domino’s Pizza UK and Ireland Limited. Interest is charged at the same margin as applicable to the revolving credit facility above bank base rate.
The facility is secured by an unlimited cross guarantee between the Company, Domino’s Pizza UK and Ireland Limited, DPG Holdings Limited, DP Realty Limited, DP Pizza Limited and DP Group Developments Limited, DP Cyco Switzerland Limited and Domino’s Pizza GmbH.
Other loansOther loans include loans entered into to acquire assets which are then leased on to franchisees under finance lease agreements. The Group has an asset finance facility of £5.0m (2016: £5.0m) with a term of five years. The balance drawn down on this facility and held within “other loans” as at 31 December 2017 is £0.2m (2016: £0.9m). The loans are repayable in equal instalments over a period of up to five years. The loans are secured by a limited guarantee and indemnity by the Company and Domino’s Pizza UK & Ireland Limited (limited to an annual sum of £0.3m) and a mortgage charge over the assets financed. The interest rate on these loans is fixed at an average of 5.9% (2016: 5.9%).
DP Norway AS has access to a NOK 4.0m (£0.4m) overdraft and NOK 50.0m (£4.5m) five year term loan facility provided by Nordea Bank AB. Interest is charged 0.6% above NIBOR for each overdraft utilisation plus a yearly commission of 0.9%. At 31 December 2017 NOK 40.0m (£3.6m) was drawn on the term loan facility. Interest is charged at 1.35% above NIBOR with a yearly commission of 0.6%. Both the overdraft and loan facility are guaranteed by the Company.
Share buyback obligationOn 14 December 2017 the Group entered into an irrevocable non-discretionary programme with Numis Securities Limited to purchase up to a maximum of £20.0m of shares from 18 December 2017. The remaining share buybacks outstanding at the balance sheet date have been recognised as a financial liability of £18.3m (2016: 10.0m). The full obligation had been utilised by 5 February 2018.
Gross put options liabilitiesOn acquisition of Pizza Pizza EHF and DPN, and the subsequent hive out of PPS Foods AB, a liability at the present value of the gross amount of the put options held by the non-controlling interests over the remaining shareholding has been recognised on consolidation amounting to £34.8m and by 31 December 2017 has been revalued to £34.7m.
The value of the financial liabilities is the discounted value of the gross liabilities for the put options based on the expected value of the consideration on exercise of the options. The put option liability is based on a forecast EBITDA multiple of the respective businesses during the exercise period. The options are exercisable from 1 July 2019 until 30 June 2020.
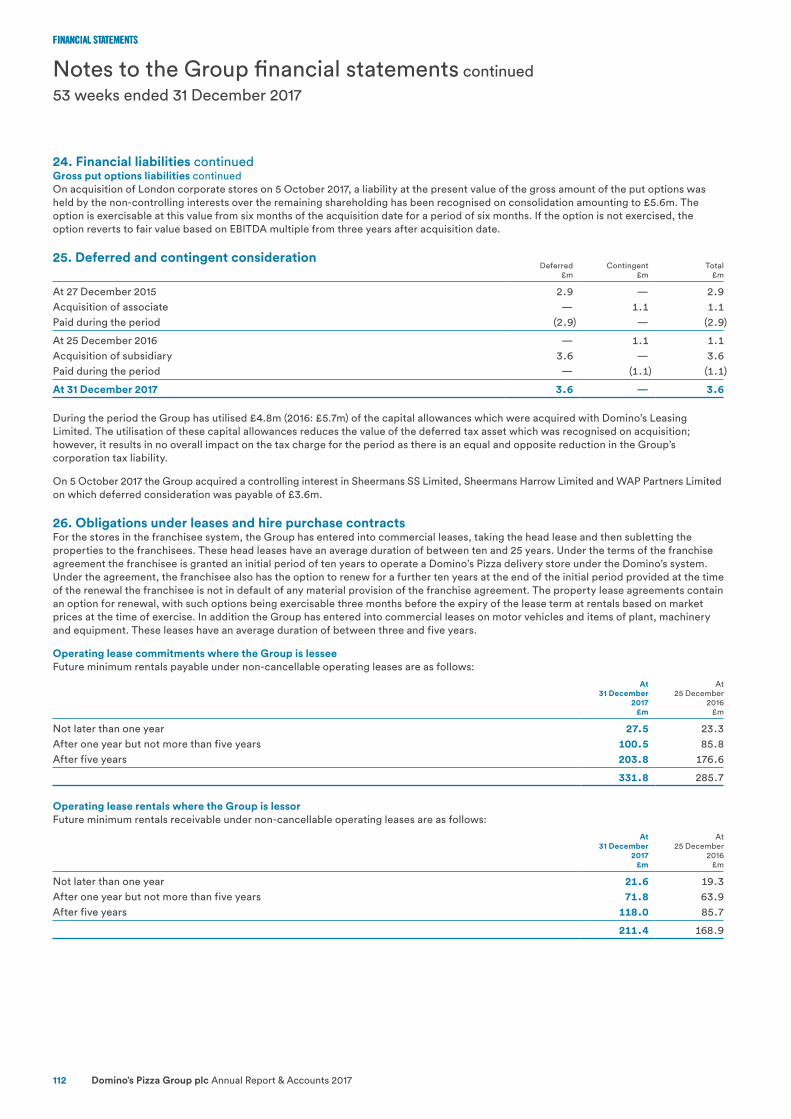
FINANCIAL STATEMENTS
Domino’s Pizza Group plc Annual Report & Accounts 2017112
FINANCIAL STATEMENTS
Notes to the Group financial statements continued
53 weeks ended 31 December 2017
24. Financial liabilities continuedGross put options liabilities continuedOn acquisition of London corporate stores on 5 October 2017, a liability at the present value of the gross amount of the put options was held by the non-controlling interests over the remaining shareholding has been recognised on consolidation amounting to £5.6m. The option is exercisable at this value from six months of the acquisition date for a period of six months. If the option is not exercised, the option reverts to fair value based on EBITDA multiple from three years after acquisition date.
25. Deferred and contingent considerationDeferred
£mContingent
£mTotal
£m
At 27 December 2015 2.9 — 2.9Acquisition of associate — 1.1 1.1Paid during the period (2.9) — (2.9)
At 25 December 2016 — 1.1 1.1Acquisition of subsidiary 3.6 — 3.6Paid during the period — (1.1) (1.1)
At 31 December 2017 3.6 — 3.6
During the period the Group has utilised £4.8m (2016: £5.7m) of the capital allowances which were acquired with Domino’s Leasing Limited. The utilisation of these capital allowances reduces the value of the deferred tax asset which was recognised on acquisition; however, it results in no overall impact on the tax charge for the period as there is an equal and opposite reduction in the Group’s corporation tax liability.
On 5 October 2017 the Group acquired a controlling interest in Sheermans SS Limited, Sheermans Harrow Limited and WAP Partners Limited on which deferred consideration was payable of £3.6m.
26. Obligations under leases and hire purchase contractsFor the stores in the franchisee system, the Group has entered into commercial leases, taking the head lease and then subletting the properties to the franchisees. These head leases have an average duration of between ten and 25 years. Under the terms of the franchise agreement the franchisee is granted an initial period of ten years to operate a Domino’s Pizza delivery store under the Domino’s system. Under the agreement, the franchisee also has the option to renew for a further ten years at the end of the initial period provided at the time of the renewal the franchisee is not in default of any material provision of the franchise agreement. The property lease agreements contain an option for renewal, with such options being exercisable three months before the expiry of the lease term at rentals based on market prices at the time of exercise. In addition the Group has entered into commercial leases on motor vehicles and items of plant, machinery and equipment. These leases have an average duration of between three and five years.
Operating lease commitments where the Group is lesseeFuture minimum rentals payable under non-cancellable operating leases are as follows:
At31 December
2017£m
At25 December
2016£m
Not later than one year 27.5 23.3After one year but not more than five years 100.5 85.8After five years 203.8 176.6
331.8 285.7
Operating lease rentals where the Group is lessorFuture minimum rentals receivable under non-cancellable operating leases are as follows:
At31 December
2017£m
At25 December
2016£m
Not later than one year 21.6 19.3After one year but not more than five years 71.8 63.9After five years 118.0 85.7
211.4 168.9

CORPORATE GOVERNANCE FINANCIAL STATEMENTSSTRATEGIC REPORT
Annual Report & Accounts 2017 Domino’s Pizza Group plc 113
CORPORATE GOVERNANCE FINANCIAL STATEMENTSSTRATEGIC REPORT
27. ProvisionsReversionary
share plan provisions
£m
Dilapidations provisions
£m
Onerous leaseprovisions
£m
Otherprovisions
£mTotal
£m
At 25 December 2016 — — 2.3 0.4 2.7Arising during the period 11.0 — 0.5 0.5 12.0Acquisitions — 2.2 0.7 1.2 4.1Utilised during the period — — (0.7) (0.3) (1.0)Released during the period — — (0.1) — (0.1)Impact of discounting — — 0.1 — 0.1
At 31 December 2017 11.0 2.2 2.8 1.8 17.8
At31 December
2017£m
At25 December
2016£m
Current 4.5 1.5Non-current 13.3 1.2
17.8 2.7
Reversionary share plan provisionsAs discussed more fully in note 2: the employment tax provision relates to certain of the Group’s historical share-based compensation arrangements dating from 2003–2010. As a result of the updated legal advice received a provision has been recorded in these financial statements amounting to £11.0m, comprising £2.6m employer’s NIC, and £8.4m employee’s NIC and PAYE. Within this an estimate of interest on overdue tax of £3.3m has been provided for.
No contingent asset has been recognised in the financial statements in relation to the indemnities provided by the beneficiaries of the arrangements. As the tax liability has not crystallised, the Group is not yet entitled to seek recovery of the amounts due under the indemnities.
The timing of the utilisation of the provision is uncertain, as discussed more fully in note 2.
Dilapidations provisionsOn acquisition of the Nordic entities and the London corporate stores, the Group acquired dilapidations provisions which were recognised at fair value.
Onerous lease provisionThe onerous lease provision relates to the outstanding rent obligation for properties in the UK, Ireland, Germany and Norway. These properties include sublets to commercial tenants, properties for which a lease has been signed but no franchisee has been identified to operate the store such that the lease obligation has become onerous, along with stores for which the tenant is paying reduced rent and the Group expects to make a loss in relation to the lease. The provision will be utilised over the remaining lease term on the properties identified which range between one and 24 years. Provisions recognised on acquisition of Dolly Dimple’s have been recorded at fair value.
28. Financial risk management objectives and policiesThe Group’s financial risk management objectives consist of identifying and monitoring risks which might have an adverse impact on the value of the Group’s financial assets and liabilities, reported profitability or cash flows.
The main risks are foreign currency risk, credit risk, liquidity risk and interest rate risk. The Board reviews and agrees policies for managing each of these risks, which are summarised below.
The Group has various financial assets such as trade receivables and cash, which arise directly from its operations. The Group’s principal financial liabilities comprise share buyback obligations, bank revolving facilities, other loans and finance leases.
The Group has not entered into any derivative transactions such as interest rate swaps or financial foreign currency contracts. The Group’s Treasury Policy allows it to trade in derivatives to manage interest rate, commodity and foreign exchange risk.
Foreign currency riskThe Group has invested in operations in the Iceland, Norway, Ireland, Sweden and Switzerland and also buys and sells goods and services in currencies other than sterling. The Group has also invested in an associate in Germany. As a result, the value of the Group’s non-functional currency revenues, purchases, financial assets and liabilities and cash flows can be affected by movements in exchange rates. The Group seeks to mitigate the effect of its currency exposures by agreeing fixed currency contracts with franchisees and suppliers wherever possible.
The group does not use derivatives to hedge balance sheet and profit and loss translation exposures arising on the consolidation of overseas subsidiaries.
The following table demonstrates the sensitivity to a reasonably possible change in sterling against the Euro, Icelandic Krona, Norwegian Krone and Swedish Krona exchange rates, with all other variables held constant. The impact on the Group’s profit before tax is due to changes in the carrying value of currency-denominated assets in subsidiaries with a sterling functional currency and sterling-denominated assets in subsidiaries with a non-sterling functional currency. The impact on the Group’s pre-tax equity is due to changes in carrying value of investments in joint ventures and associates. The Group’s exposure to foreign currency changes for all other currencies is immaterial.

FINANCIAL STATEMENTS
Domino’s Pizza Group plc Annual Report & Accounts 2017114
FINANCIAL STATEMENTS
Notes to the Group financial statements continued
53 weeks ended 31 December 2017
28. Financial risk management objectives and policies continuedForeign currency risk continued
Change inEUR rate
Effect on profitbefore tax
£m
Effect onpre-tax equity
£m
2017 +25% (1.8) (2.8)-25% 2.9 4.7
2016 +25% (4.0) (2.6)-25% 5.0 3.2
Change inNOK rate
Effect on profit before tax
£m
Effect on pre-tax equity
£m
2017 +25% 0.6 —-25% (1.1) —
2016 +25% — (6.1)-25% — 7.6
Change in SEK rate
Effect on profit before tax
£m
Effect on pre-tax equity
£m
2017 +25% 0.5 —-25% (0.8) —
2016 +25% — (0.5)-25% — 0.6
Change in ISK rate
Effect on profit before tax
£m
Effect on pre-tax equity
£m
2017 +25% 5.8 —-25% (9.7) —
2016 +25% — (0.3)-25% — 0.3
Credit riskCustomers who trade on credit terms and obtain finance leasing and loans from the Group are predominantly franchisees and it is considered that the franchisee selection process is sufficiently robust to ensure an appropriate credit verification procedure.
In addition, trade receivable balances are monitored on an ongoing basis with the result that the Group’s exposure to bad debts is not significant. Since the Group trades only with franchisees that have been subject to the franchisee selection process and provide guarantees as required under the franchisee agreements, there is no requirement for collateral.
It is Group policy that cash deposits are only made with banks that have been approved by the Board and have a high credit rating (in accordance with the Group’s treasury policy) to ensure that the Group is not exposed to unnecessary risk.
Liquidity riskLiquidity risk is the risk that the Group will not be able to meets its obligations as they fall due.
To manage liquidity risk, each operating area prepares short-term, medium-term and long-term cash flow forecasts which are regularly reviewed and challenged. These forecasts are consolidated centrally to ensure the Group has sufficient liquidity to meet it liabilities when due, under both normal and stressed conditions without risking damage to the Group’s reputation. All major investment decisions are considered by the Board as part of the project appraisal and approval process.
The Group has access to a £350.0m syndicated revolving credit facility which matures in December 2022 with an option of two further one-year extensions. The Group also has access to Sterling, Euro and Norwegian Krone overdrafts which were undrawn at 31 December 2017.
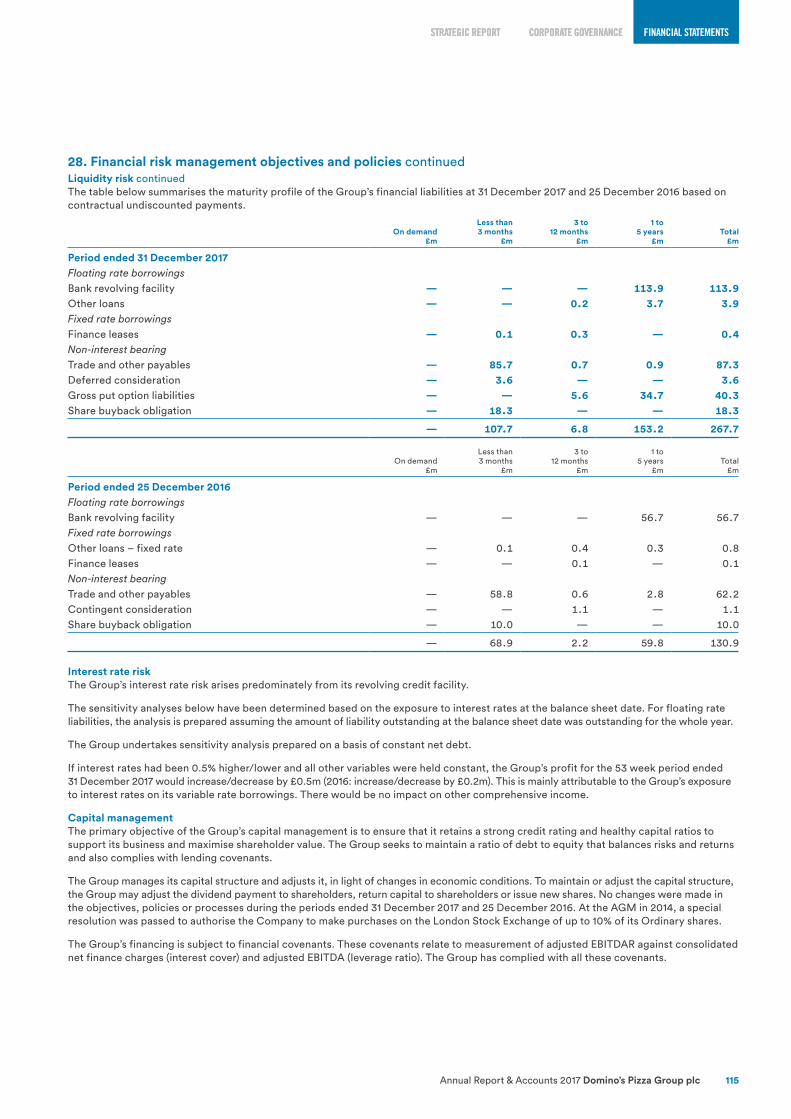
CORPORATE GOVERNANCE FINANCIAL STATEMENTSSTRATEGIC REPORT
Annual Report & Accounts 2017 Domino’s Pizza Group plc 115
CORPORATE GOVERNANCE FINANCIAL STATEMENTSSTRATEGIC REPORT
28. Financial risk management objectives and policies continuedLiquidity risk continuedThe table below summarises the maturity profile of the Group’s financial liabilities at 31 December 2017 and 25 December 2016 based on contractual undiscounted payments.
On demand£m
Less than3 months
£m
3 to12 months
£m
1 to5 years
£mTotal
£m
Period ended 31 December 2017Floating rate borrowingsBank revolving facility — — — 113.9 113.9Other loans — — 0.2 3.7 3.9Fixed rate borrowingsFinance leases — 0.1 0.3 — 0.4Non-interest bearingTrade and other payables — 85.7 0.7 0.9 87.3Deferred consideration — 3.6 — — 3.6Gross put option liabilities — — 5.6 34.7 40.3Share buyback obligation — 18.3 — — 18.3
— 107.7 6.8 153.2 267.7
On demand£m
Less than3 months
£m
3 to12 months
£m
1 to5 years
£mTotal
£m
Period ended 25 December 2016Floating rate borrowingsBank revolving facility — — — 56.7 56.7Fixed rate borrowingsOther loans – fixed rate — 0.1 0.4 0.3 0.8Finance leases — — 0.1 — 0.1Non-interest bearingTrade and other payables — 58.8 0.6 2.8 62.2Contingent consideration — — 1.1 — 1.1Share buyback obligation — 10.0 — — 10.0
— 68.9 2.2 59.8 130.9
Interest rate riskThe Group’s interest rate risk arises predominately from its revolving credit facility.
The sensitivity analyses below have been determined based on the exposure to interest rates at the balance sheet date. For floating rate liabilities, the analysis is prepared assuming the amount of liability outstanding at the balance sheet date was outstanding for the whole year.
The Group undertakes sensitivity analysis prepared on a basis of constant net debt.
If interest rates had been 0.5% higher/lower and all other variables were held constant, the Group’s profit for the 53 week period ended 31 December 2017 would increase/decrease by £0.5m (2016: increase/decrease by £0.2m). This is mainly attributable to the Group’s exposure to interest rates on its variable rate borrowings. There would be no impact on other comprehensive income.
Capital managementThe primary objective of the Group’s capital management is to ensure that it retains a strong credit rating and healthy capital ratios to support its business and maximise shareholder value. The Group seeks to maintain a ratio of debt to equity that balances risks and returns and also complies with lending covenants.
The Group manages its capital structure and adjusts it, in light of changes in economic conditions. To maintain or adjust the capital structure, the Group may adjust the dividend payment to shareholders, return capital to shareholders or issue new shares. No changes were made in the objectives, policies or processes during the periods ended 31 December 2017 and 25 December 2016. At the AGM in 2014, a special resolution was passed to authorise the Company to make purchases on the London Stock Exchange of up to 10% of its Ordinary shares.
The Group’s financing is subject to financial covenants. These covenants relate to measurement of adjusted EBITDAR against consolidated net finance charges (interest cover) and adjusted EBITDA (leverage ratio). The Group has complied with all these covenants.

FINANCIAL STATEMENTS
Domino’s Pizza Group plc Annual Report & Accounts 2017116
FINANCIAL STATEMENTS
Notes to the Group financial statements continued
53 weeks ended 31 December 2017
28. Financial risk management objectives and policies continuedCapital management continued
At31 December
2017£m
At25 December
2016£m
Other loans 3.9 0.9Finance leases 0.4 0.1Bank revolving facilities 113.9 56.7Less: cash and cash equivalents (29.0) (23.1)
Net debt 89.2 34.6
Underlying EBITDA from continuing operations 108.5 93.8
Adjusted gearing ratio 0.8 0.4
For further commentary on cash flow, net debt and gearing see the strategic report.
29. Financial instrumentsFair valuesSet out below is a comparison by category of carrying amounts and fair values of all the Group’s financial instruments that are carried in the financial statements:
Carryingvalue2017
£m
Carrying value2016
£m
Fairvalue2017
£m
Fair value 2016
£m
Financial assetsNet investment in finance leases — 0.8 — 0.8Available-for-sale financial assets 9.0 8.1 9.0 8.1Financial liabilitiesBank revolving facilities 113.9 56.7 113.9 56.7Fixed rate borrowings — 0.9 — 0.9Other loans 3.9 0.9 3.9 0.9Deferred and contingent consideration 3.6 1.1 3.6 1.1Share buyback obligations 18.3 10.0 18.3 10.0Gross put option liabilities 40.3 — 40.3 —Finance lease liabilities 0.4 0.1 0.4 0.1
The fair value of the net investment in finance leases has been calculated by discounting the expected future cash flows at the market interest rate. The fair value of fixed rate borrowings has been calculated by discounting the expected future cash flows at a market rate of interest.
Management has determined that the fair values of cash and cash equivalents, trade and other receivables, trade and other payables and share buyback obligations approximate their carrying amounts largely due to the short-term maturity of these instruments.
The fair values of bank revolving facilities, fixed rate borrowings and finance lease liabilities are determined using a rate that reflects the entity’s borrowing rate as at the end of the reporting period. The inputs used in these discounted cash flow calculations are at level 2 in the hierarchy.
Level 1 – Quoted prices (unadjusted) in active markets for identical assets or liabilities.
Level 2 – Inputs other than quoted prices included within Level 1 that are observable for the asset or liability, either directly or indirectly.
Level 3 – Unobservable inputs for the asset or liability.
IFRS 13 requires the classification of financial instruments measured at fair value to be determined by reference to the source of inputs used to derive fair value.
The contingent consideration of €25.0m (£22.2m) payable by Domino’s Pizza Enterprises Limited (referred to as the “Market Access Fee”) in respect of Domino’s Pizza Group plc divesting its interests in operating Domino’s Pizza stores in Germany and its exclusive access to the German market, held through its shareholding in DP Cyco Limited and which became payable from 2017, is carried at a fair value of €10.1m (£9.0m) within available-for-sale financial assets. The contingent consideration is payable by instalments from 2017, the payment of each instalment being determined by reference to the German business achieving defined levels of EBITDA. As at 31 December 2017, no payments are due.
The inputs used to calculate the fair value of the Market Access Fee fall within Level 3 of the IFRS 13 hierarchy. Level 3 fair value measurements use unobservable inputs for the asset (or liability).
The fair value of the financial asset recognised is calculated by discounting all future cash flows by the appropriate discount rate for the German associated Company. The payments are calculated applying an income approach valuation methodology, considering different scenarios of projected EBITDA, weighted by the probability of each scenario. The fair value is based on a mid-point in the range of probable fair value outcomes of €5.8m to €14.7m based on a range of EBITDA forecasts.
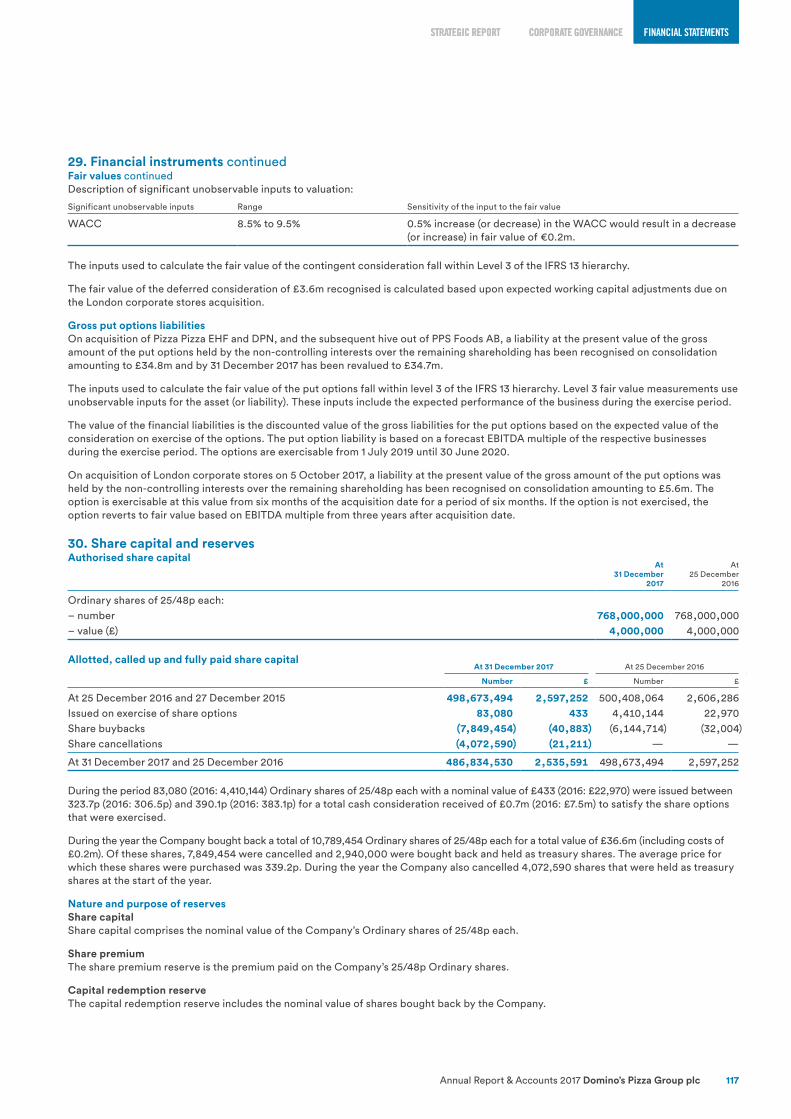
CORPORATE GOVERNANCE FINANCIAL STATEMENTSSTRATEGIC REPORT
Annual Report & Accounts 2017 Domino’s Pizza Group plc 117
CORPORATE GOVERNANCE FINANCIAL STATEMENTSSTRATEGIC REPORT
29. Financial instruments continuedFair values continuedDescription of significant unobservable inputs to valuation:
Significant unobservable inputs Range Sensitivity of the input to the fair value
WACC 8.5% to 9.5% 0.5% increase (or decrease) in the WACC would result in a decrease (or increase) in fair value of €0.2m.
The inputs used to calculate the fair value of the contingent consideration fall within Level 3 of the IFRS 13 hierarchy.
The fair value of the deferred consideration of £3.6m recognised is calculated based upon expected working capital adjustments due on the London corporate stores acquisition.
Gross put options liabilitiesOn acquisition of Pizza Pizza EHF and DPN, and the subsequent hive out of PPS Foods AB, a liability at the present value of the gross amount of the put options held by the non-controlling interests over the remaining shareholding has been recognised on consolidation amounting to £34.8m and by 31 December 2017 has been revalued to £34.7m.
The inputs used to calculate the fair value of the put options fall within level 3 of the IFRS 13 hierarchy. Level 3 fair value measurements use unobservable inputs for the asset (or liability). These inputs include the expected performance of the business during the exercise period.
The value of the financial liabilities is the discounted value of the gross liabilities for the put options based on the expected value of the consideration on exercise of the options. The put option liability is based on a forecast EBITDA multiple of the respective businesses during the exercise period. The options are exercisable from 1 July 2019 until 30 June 2020.
On acquisition of London corporate stores on 5 October 2017, a liability at the present value of the gross amount of the put options was held by the non-controlling interests over the remaining shareholding has been recognised on consolidation amounting to £5.6m. The option is exercisable at this value from six months of the acquisition date for a period of six months. If the option is not exercised, the option reverts to fair value based on EBITDA multiple from three years after acquisition date.
30. Share capital and reservesAuthorised share capital
At31 December
2017
At25 December
2016
Ordinary shares of 25/48p each:– number 768,000,000 768,000,000– value (£) 4,000,000 4,000,000
Allotted, called up and fully paid share capitalAt 31 December 2017 At 25 December 2016
Number £ Number £
At 25 December 2016 and 27 December 2015 498,673,494 2,597,252 500,408,064 2,606,286Issued on exercise of share options 83,080 433 4,410,144 22,970Share buybacks (7,849,454) (40,883) (6,144,714) (32,004)Share cancellations (4,072,590) (21,211) — —
At 31 December 2017 and 25 December 2016 486,834,530 2,535,591 498,673,494 2,597,252
During the period 83,080 (2016: 4,410,144) Ordinary shares of 25/48p each with a nominal value of £433 (2016: £22,970) were issued between 323.7p (2016: 306.5p) and 390.1p (2016: 383.1p) for a total cash consideration received of £0.7m (2016: £7.5m) to satisfy the share options that were exercised.
During the year the Company bought back a total of 10,789,454 Ordinary shares of 25/48p each for a total value of £36.6m (including costs of £0.2m). Of these shares, 7,849,454 were cancelled and 2,940,000 were bought back and held as treasury shares. The average price for which these shares were purchased was 339.2p. During the year the Company also cancelled 4,072,590 shares that were held as treasury shares at the start of the year.
Nature and purpose of reservesShare capitalShare capital comprises the nominal value of the Company’s Ordinary shares of 25/48p each.
Share premiumThe share premium reserve is the premium paid on the Company’s 25/48p Ordinary shares.
Capital redemption reserveThe capital redemption reserve includes the nominal value of shares bought back by the Company.

FINANCIAL STATEMENTS
Domino’s Pizza Group plc Annual Report & Accounts 2017118
FINANCIAL STATEMENTS
Notes to the Group financial statements continued
53 weeks ended 31 December 2017
30. Share capital and reserves continuedNature and purpose of reserves continuedCapital reserve – own sharesThis reserve relates to shares held by an independently managed EBT and shares held by the Company as “treasury shares”.
The shares held by the EBT were purchased in order to satisfy outstanding employee share options and potential awards under the Long Term Incentive Plan (‘LTIP’) and other incentive schemes. During the period the Company acquired 2,940,000 of its own shares (2016: nil). At 31 December 2017 the Company held 2,114,550 (2016: 168,756) of its own shares in the EBT which had a historic cost of £6.5m (2016: £nil). These shares had a market value at 31 December 2017 of £6.7m (2016: £0.6m). The EBT has waived its entitlement to dividends.
During the period the Company acquired nil of its own shares (2016: 2,932,590). At 31 December 2017 the Company held nil (2016: 4,072,590) of its own shares. The shares are held as treasury shares. The Company has the right to reissue these shares at a later date.
During the year the Group impaired treasury shares by £2.8m (2016: £nil) on issue of shares at a price lower than historic cost.
Currency translation reserveThe foreign currency translation reserve is used to record exchange differences arising from the translation of the financial statements of the Group’s foreign subsidiaries and the equity valuation of investments in associates and joint ventures carried in non-sterling currencies.
Other reservesThe other reserve relates to the gross liability for put options held by non-controlling interests that the Group is contractually obliged to meet when exercised.
31. Business combinationsThe acquisitions in the period have been accounted for as business combinations. The provisional fair value amounts recognised in respect of the identifiable assets acquired and liabilities assumed are as set out in the table below:
Transaction costs relating to the acquisitions detailed in this section are detailed in note 7.
Domino’sIceland
£m
Domino’s Norway and
Sweden£m
Dolly Dimple’s Norway
£m
LondonCorporate
Stores£m
Total£m
Consideration transferredCash 1.3 13.7 5.7 24.4 45.1Deferred consideration — — — 3.6 3.6Non-cash consideration — — — 5.6 5.6
Total 1.3 13.7 5.7 33.6 54.3
Fair value of net assets acquired (provisional)Property, plant and equipment 4.7 3.4 1.3 1.1 10.5Intangible assets 22.1 18.7 1.7 4.5 47.0Inventories 0.6 0.4 0.2 0.1 1.3Trade and other receivables 4.1 0.8 1.1 1.3 7.3Deferred tax assets — 1.2 1.4 — 2.6Assets held for sale — 0.2 — — 0.2Cash and cash equivalents 14.7 0.9 3.1 4.9 23.6
Total assets acquired 46.2 25.6 8.8 11.9 92.5
Trade and other payables (4.7) (2.9) (2.9) (4.3) (14.8)Loans (1.6) (2.7) — — (4.3)Provisions — — (2.3) — (2.3)Deferred tax liabilities (4.4) (4.3) (0.4) (0.5) (9.6)
Total liabilities acquired (10.7) (9.9) (5.6) (4.8) (31.0)
Net identifiable assets acquired at fair value 35.5 15.7 3.2 7.1 61.5
Goodwill arising on acquisitionConsideration transferred 1.3 13.7 5.7 33.6 54.3Transfer of equity at acquisition 29.2 3.8 — — 33.0Non-controlling interests 17.4 4.6 — — 22.0Fair value of net assets acquired (provisional) (35.5) (15.7) (3.2) (7.1) (61.5)
Goodwill 12.4 6.4 2.5 26.5 47.8
Acquisition of Domino’s IcelandOn 19 April 2017 the Group acquired 2% of the share capital of its associated undertaking Pizza Pizza EHF, taking the Group’s shareholding to 51% and in doing so gaining control of the Icelandic-based Domino’s master franchise holder.
The acquisition balance sheet has been adjusted to reflect provisional fair value adjustments. Adjustments to the completion balance sheet primarily relate to intangible assets of the MFA acquired with Pizza Pizza EHF and recognition of necessary provisions. The MFA has been valued using the multi-period excess earnings method income approach taking into account forecast revenue and EBITDA margin and a discount rate applied. Adjustments to taxes relate to additional tax provisions and deferred tax on the fair value adjustments. Non-controlling interests have been valued as a proportion of identifiable net assets.
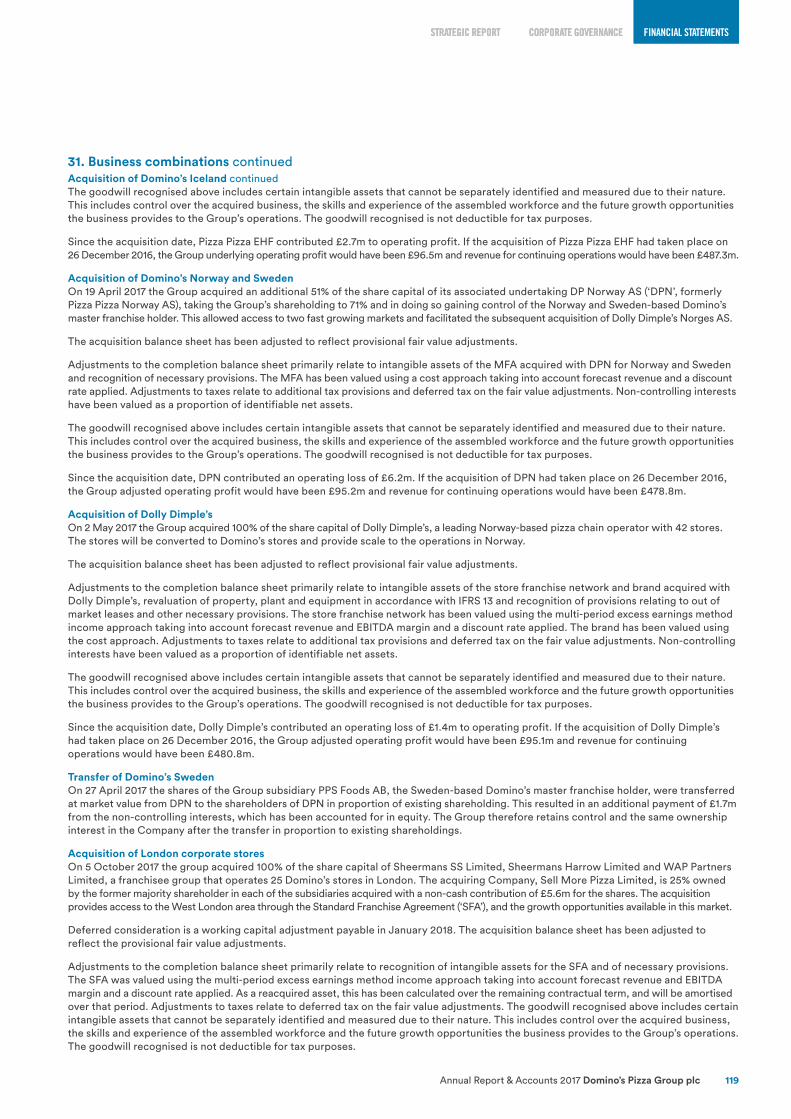
CORPORATE GOVERNANCE FINANCIAL STATEMENTSSTRATEGIC REPORT
Annual Report & Accounts 2017 Domino’s Pizza Group plc 119
CORPORATE GOVERNANCE FINANCIAL STATEMENTSSTRATEGIC REPORT
31. Business combinations continuedAcquisition of Domino’s Iceland continuedThe goodwill recognised above includes certain intangible assets that cannot be separately identified and measured due to their nature. This includes control over the acquired business, the skills and experience of the assembled workforce and the future growth opportunities the business provides to the Group’s operations. The goodwill recognised is not deductible for tax purposes.
Since the acquisition date, Pizza Pizza EHF contributed £2.7m to operating profit. If the acquisition of Pizza Pizza EHF had taken place on 26 December 2016, the Group underlying operating profit would have been £96.5m and revenue for continuing operations would have been £487.3m.
Acquisition of Domino’s Norway and SwedenOn 19 April 2017 the Group acquired an additional 51% of the share capital of its associated undertaking DP Norway AS (‘DPN’, formerly Pizza Pizza Norway AS), taking the Group’s shareholding to 71% and in doing so gaining control of the Norway and Sweden-based Domino’s master franchise holder. This allowed access to two fast growing markets and facilitated the subsequent acquisition of Dolly Dimple’s Norges AS.
The acquisition balance sheet has been adjusted to reflect provisional fair value adjustments.
Adjustments to the completion balance sheet primarily relate to intangible assets of the MFA acquired with DPN for Norway and Sweden and recognition of necessary provisions. The MFA has been valued using a cost approach taking into account forecast revenue and a discount rate applied. Adjustments to taxes relate to additional tax provisions and deferred tax on the fair value adjustments. Non-controlling interests have been valued as a proportion of identifiable net assets.
The goodwill recognised above includes certain intangible assets that cannot be separately identified and measured due to their nature. This includes control over the acquired business, the skills and experience of the assembled workforce and the future growth opportunities the business provides to the Group’s operations. The goodwill recognised is not deductible for tax purposes.
Since the acquisition date, DPN contributed an operating loss of £6.2m. If the acquisition of DPN had taken place on 26 December 2016, the Group adjusted operating profit would have been £95.2m and revenue for continuing operations would have been £478.8m.
Acquisition of Dolly Dimple’sOn 2 May 2017 the Group acquired 100% of the share capital of Dolly Dimple’s, a leading Norway-based pizza chain operator with 42 stores. The stores will be converted to Domino’s stores and provide scale to the operations in Norway.
The acquisition balance sheet has been adjusted to reflect provisional fair value adjustments.
Adjustments to the completion balance sheet primarily relate to intangible assets of the store franchise network and brand acquired with Dolly Dimple’s, revaluation of property, plant and equipment in accordance with IFRS 13 and recognition of provisions relating to out of market leases and other necessary provisions. The store franchise network has been valued using the multi-period excess earnings method income approach taking into account forecast revenue and EBITDA margin and a discount rate applied. The brand has been valued using the cost approach. Adjustments to taxes relate to additional tax provisions and deferred tax on the fair value adjustments. Non-controlling interests have been valued as a proportion of identifiable net assets.
The goodwill recognised above includes certain intangible assets that cannot be separately identified and measured due to their nature. This includes control over the acquired business, the skills and experience of the assembled workforce and the future growth opportunities the business provides to the Group’s operations. The goodwill recognised is not deductible for tax purposes.
Since the acquisition date, Dolly Dimple’s contributed an operating loss of £1.4m to operating profit. If the acquisition of Dolly Dimple’s had taken place on 26 December 2016, the Group adjusted operating profit would have been £95.1m and revenue for continuing operations would have been £480.8m.
Transfer of Domino’s SwedenOn 27 April 2017 the shares of the Group subsidiary PPS Foods AB, the Sweden-based Domino’s master franchise holder, were transferred at market value from DPN to the shareholders of DPN in proportion of existing shareholding. This resulted in an additional payment of £1.7m from the non-controlling interests, which has been accounted for in equity. The Group therefore retains control and the same ownership interest in the Company after the transfer in proportion to existing shareholdings.
Acquisition of London corporate storesOn 5 October 2017 the group acquired 100% of the share capital of Sheermans SS Limited, Sheermans Harrow Limited and WAP Partners Limited, a franchisee group that operates 25 Domino’s stores in London. The acquiring Company, Sell More Pizza Limited, is 25% owned by the former majority shareholder in each of the subsidiaries acquired with a non-cash contribution of £5.6m for the shares. The acquisition provides access to the West London area through the Standard Franchise Agreement (‘SFA’), and the growth opportunities available in this market.
Deferred consideration is a working capital adjustment payable in January 2018. The acquisition balance sheet has been adjusted to reflect the provisional fair value adjustments.
Adjustments to the completion balance sheet primarily relate to recognition of intangible assets for the SFA and of necessary provisions. The SFA was valued using the multi-period excess earnings method income approach taking into account forecast revenue and EBITDA margin and a discount rate applied. As a reacquired asset, this has been calculated over the remaining contractual term, and will be amortised over that period. Adjustments to taxes relate to deferred tax on the fair value adjustments. The goodwill recognised above includes certain intangible assets that cannot be separately identified and measured due to their nature. This includes control over the acquired business, the skills and experience of the assembled workforce and the future growth opportunities the business provides to the Group’s operations. The goodwill recognised is not deductible for tax purposes.

FINANCIAL STATEMENTS
Domino’s Pizza Group plc Annual Report & Accounts 2017120
FINANCIAL STATEMENTS
Notes to the Group financial statements continued
53 weeks ended 31 December 2017
31. Business combinations continuedAcquisition of London corporate stores continuedSince the acquisition date, the London corporate stores have contributed £0.4m to operating profit. If the acquisition of the London corporate stores had taken place on 26 December 2016, the Group adjusted operating profit would have been £98.2m and revenue for continuing operations would have been £488.2m.
32. Share-based paymentsThe expense recognised for share-based payments in respect of employee services received during the 53 weeks ended 31 December 2017 was £1.7m (2016: £2.2m). This all arises on equity-settled share-based payment transactions. The comparative figures in this note have been restated to reflect the share split in the period, as outlined in note 30.
2012 Long Term Incentive Plan (‘2012 LTIP’)At the 2012 AGM shareholders approved the adoption of new LTIP rules which allow for either the grant of market value options or performance shares. Awards are approved and granted at the discretion of the Remuneration Committee to Senior Executives and other employees. Awards are capable of vesting within a three-year period should certain performance targets be achieved by the Group and all awards will be equity settled. During the period 1,303,954 awards were granted (2016: 1,085,796). At 31 December 2017, there were 2012 LTIP awards over 4,072,373 (2016: 3,740,492) shares in Domino’s Pizza Group plc.
The weighted average remaining contractual life of the options outstanding at 31 December 2017 was 1.4 years (2016: 4.3 years). The weighted average share price for options exercised during 2017 was 281.9p (2016: 341.3p).
2016 Long Term Incentive Plan (‘2016 LTIP’)At the 2016 AGM shareholders approved the adoption of new LTIP rules which allow for either the grant of market value options or performance shares. Awards are approved and granted at the discretion of the Remuneration Committee to Senior Executives and other employees. Awards are capable of vesting within a three to five-year period should certain performance targets be achieved by the Group and all awards will be equity settled. During the period nil awards were granted (2016: 1,602,000). At 31 December 2017, there were 2016 LTIP awards over 1,602,000 (2016: 1,602,000) shares in Domino’s Pizza Group plc.
The weighted average remaining contractual life of the options outstanding at 31 December 2017 was 2.3 years (2016: 2.8 years).
There were no options exercised during 2017 (2016: nil).
The fair value of options granted is estimated at the date of grant using Stochastic and Black-Scholes models, taking into account the terms and conditions upon which they were granted. Total shareholder return (‘TSR’) is generated for the Company and the comparator group at the end of the three-year performance period. The expected volatility reflects the assumption that the historical volatility over a period similar to the life of the options is indicative of future trends, which may not necessarily be the actual outcome. The following table lists the inputs to the model used for the period ended 31 December 2017:
53 weeks ended31 December 2017
Weighted average fair value 159.0pWeighted average share price 271.6pWeighted average exercise price 0.00pExpected dividend yield 3.04%Risk-free rates 0.25%Expected volatility 29.89%
Further information on the Company’s 2012 and 2016 LTIP awards is given in the Executive Director policy table on pages 48 to 51 of the Directors’ remuneration report.
Employee share optionsOn 23 March 2004, the Company established the Domino’s Pizza Group plc Enterprise Management Incentive Scheme (‘EMI Scheme’).
All employees are eligible for grants of options under this scheme, which is approved by the Board. Prior to 2011, the options vested over a three-year period and are exercisable subject to the condition that the growth in adjusted diluted earnings per share during each of the three years following the date of grant exceeds growth in the Retail Prices Index by at least 3%. For 2011 and 2012 the options vest over a three-year period and are exercisable subject to the condition that real growth in adjusted diluted earnings per share, during each of the three years following the date of grant, exceeds 3%.
The options lapse after ten years or in certain other circumstances connected with leaving the Company. There are no cash settlement alternatives and all awards are equity settled.
No options were granted during the period ended 31 December 2017 (2016: nil).
Sharesave schemeDuring 2009 the Group introduced a Sharesave scheme giving employees the option to acquire shares in the Company at a 20% discount.
Employees have the option to save an amount per month up to a maximum of £500 and at the end of three years they have the option to purchase shares in the Company or to take their savings in cash. The contractual life of the scheme is three years. The weighted average fair value of each option granted in 2017 was 240.3p (2016: 190.7p).

CORPORATE GOVERNANCE FINANCIAL STATEMENTSSTRATEGIC REPORT
Annual Report & Accounts 2017 Domino’s Pizza Group plc 121
CORPORATE GOVERNANCE FINANCIAL STATEMENTSSTRATEGIC REPORT
32. Share-based payments continuedShare schemesAs at 31 December 2017, the following share options and awards were outstanding:
Scheme Exercise price
Outstanding at25 December
2016Number
Grantedduring
the periodNumber
Exercisedduring
the periodNumber
Forfeitedduring
the periodNumber
Outstanding at31 December
2017Number
Exercisable at31 December
2017Number
2012 Long Term Incentive Plan 0.00p to 43.16p
3,740,492 1,303,954 (586,177) (385,896) 4,072,373 1,334,766
2016 Long Term Incentive Plan — 1,602,000 — — — 1,602,000 —Domino’s Pizza (Unapproved) Scheme
69.67p to70.0p
52,776 — (23,997) — 28,779 28,779
Domino’s Pizza CSOP (Unapproved) Scheme
113.67p to 160.80p
82,023 — (30,876) (3,534) 47,613 47,613
Domino’s Pizza CSOP (Approved) Scheme
68.50p to 160.80p
211,263 — (77,748) (3,726) 129,789 129,789
Sharesave Scheme 143.33p to 275.33p
1,101,471 521,899 (347,682) (133,304) 1,142,384 —
6,790,025 1,825,853 (1,066,480) (526,460) 7,022,938 1,540,947
Weighted average exercise price 45.70p 69.17p 95.66p 35.22p 48.35p 41.92p
As at 25 December 2016, the following share options and awards were outstanding:
Scheme Exercise price
Outstanding at27 December
2015Number
Grantedduring
the periodNumber
Exercisedduring
the periodNumber
Forfeitedduring
the periodNumber
Outstanding at25 December
2016Number
Exercisable at25 December
2016Number
2012 Long Term Incentive Plan 0.00p to 43.16p
4,476,039 1,085,796 (1,244,556) (576,787) 3,740,492 236,925
2016 Long Term Incentive Plan — — 1,602,000 — — 1,602,000 —Domino’s Pizza (Unapproved) Scheme
69.67p to70.0p
205,992 — (125,439) (27,777) 52,776 52,776
Domino’s Pizza CSOP (Unapproved) Scheme
113.67p to 160.80p
238,869 — (156,846) — 82,023 82,023
Domino’s Pizza CSOP (Approved) Scheme
68.50p to 160.80p
482,895 — (248,223) (23,409) 211,263 211,263
Sharesave Scheme 143.33p to 275.33p
1,249,899 360,951 (150,843) (358,536) 1,101,471 —
6,653,694 3,048,747 (1,925,907) (986,509) 6,790,025 582,987
Weighted average exercise price 85.21p 32.60p 187.33p 57.55p 45.70p 136.89p
33. Additional cash flow information
Notes
53 weeksended
31 December2017
£m
52 weeksended
25 December2016
£m
Other movementsLoss/(profit) on disposal of non-current assets 20 0.4 (0.1)Share of post-tax (profits)/losses of associates and joint ventures 7 (3.2) 0.1Net gain on step acquisition of foreign operations (5.8) —Discontinued operations 12 (0.7) 1.4Increase/(decrease) in provisions 11.1 (4.9)Share option and LTIP charge 1.7 2.3
3.5 (1.2)
Working capital movementsDecrease/(increase) in inventories 2.2 (2.9)Decrease/(increase) in receivables 3.0 (17.4)Increase in payables 7.6 8.2Increase in deferred income 5.8 1.3
18.6 (10.8)
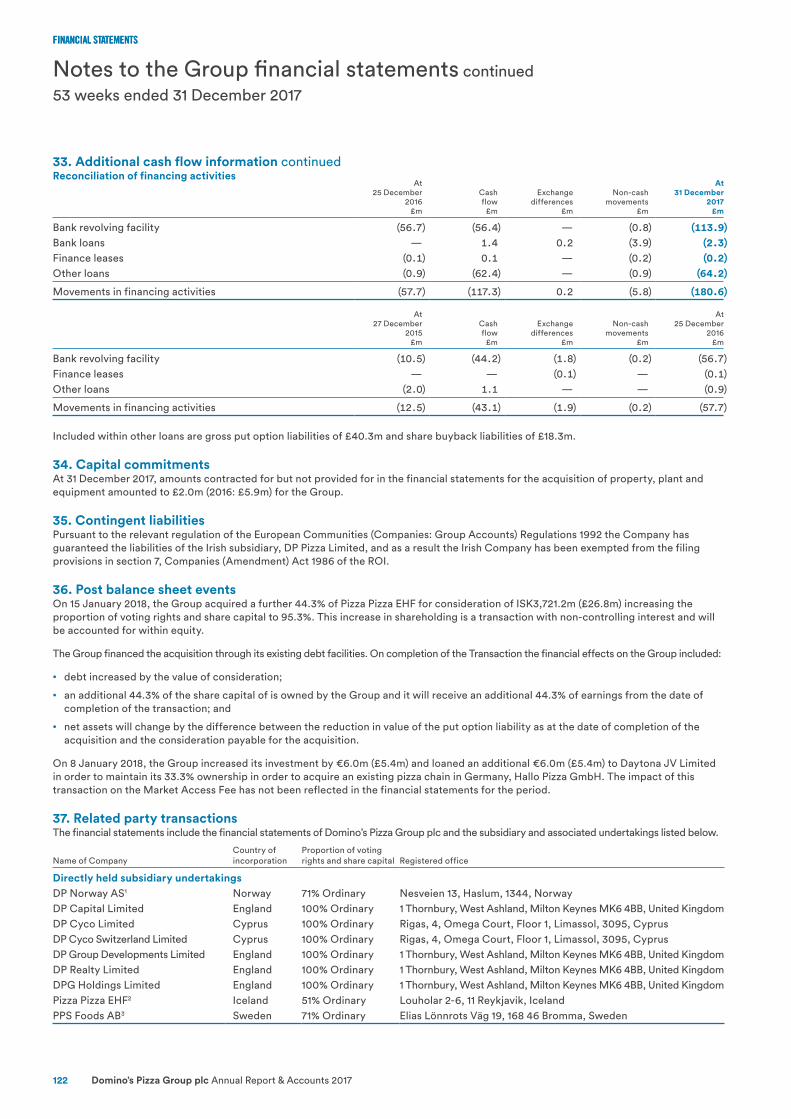
FINANCIAL STATEMENTS
Domino’s Pizza Group plc Annual Report & Accounts 2017122
FINANCIAL STATEMENTS
Notes to the Group financial statements continued
53 weeks ended 31 December 2017
33. Additional cash flow information continuedReconciliation of financing activities
At25 December
2016£m
Cashflow
£m
Exchangedifferences
£m
Non-cashmovements
£m
At31 December
2017£m
Bank revolving facility (56.7) (56.4) — (0.8) (113.9)Bank loans — 1.4 0.2 (3.9) (2.3)Finance leases (0.1) 0.1 — (0.2) (0.2)Other loans (0.9) (62.4) — (0.9) (64.2)
Movements in financing activities (57.7) (117.3) 0.2 (5.8) (180.6)
At27 December
2015£m
Cashflow
£m
Exchangedifferences
£m
Non-cashmovements
£m
At25 December
2016£m
Bank revolving facility (10.5) (44.2) (1.8) (0.2) (56.7)Finance leases — — (0.1) — (0.1)Other loans (2.0) 1.1 — — (0.9)
Movements in financing activities (12.5) (43.1) (1.9) (0.2) (57.7)
Included within other loans are gross put option liabilities of £40.3m and share buyback liabilities of £18.3m.
34. Capital commitmentsAt 31 December 2017, amounts contracted for but not provided for in the financial statements for the acquisition of property, plant and equipment amounted to £2.0m (2016: £5.9m) for the Group.
35. Contingent liabilitiesPursuant to the relevant regulation of the European Communities (Companies: Group Accounts) Regulations 1992 the Company has guaranteed the liabilities of the Irish subsidiary, DP Pizza Limited, and as a result the Irish Company has been exempted from the filing provisions in section 7, Companies (Amendment) Act 1986 of the ROI.
36. Post balance sheet eventsOn 15 January 2018, the Group acquired a further 44.3% of Pizza Pizza EHF for consideration of ISK3,721.2m (£26.8m) increasing the proportion of voting rights and share capital to 95.3%. This increase in shareholding is a transaction with non-controlling interest and will be accounted for within equity.
The Group financed the acquisition through its existing debt facilities. On completion of the Transaction the financial effects on the Group included:
• debt increased by the value of consideration;
• an additional 44.3% of the share capital of is owned by the Group and it will receive an additional 44.3% of earnings from the date of completion of the transaction; and
• net assets will change by the difference between the reduction in value of the put option liability as at the date of completion of the acquisition and the consideration payable for the acquisition.
On 8 January 2018, the Group increased its investment by €6.0m (£5.4m) and loaned an additional €6.0m (£5.4m) to Daytona JV Limited in order to maintain its 33.3% ownership in order to acquire an existing pizza chain in Germany, Hallo Pizza GmbH. The impact of this transaction on the Market Access Fee has not been reflected in the financial statements for the period.
37. Related party transactionsThe financial statements include the financial statements of Domino’s Pizza Group plc and the subsidiary and associated undertakings listed below.
Name of CompanyCountry ofincorporation
Proportion of votingrights and share capital Registered office
Directly held subsidiary undertakingsDP Norway AS1 Norway 71% Ordinary Nesveien 13, Haslum, 1344, NorwayDP Capital Limited England 100% Ordinary 1 Thornbury, West Ashland, Milton Keynes MK6 4BB, United KingdomDP Cyco Limited Cyprus 100% Ordinary Rigas, 4, Omega Court, Floor 1, Limassol, 3095, CyprusDP Cyco Switzerland Limited Cyprus 100% Ordinary Rigas, 4, Omega Court, Floor 1, Limassol, 3095, CyprusDP Group Developments Limited England 100% Ordinary 1 Thornbury, West Ashland, Milton Keynes MK6 4BB, United KingdomDP Realty Limited England 100% Ordinary 1 Thornbury, West Ashland, Milton Keynes MK6 4BB, United KingdomDPG Holdings Limited England 100% Ordinary 1 Thornbury, West Ashland, Milton Keynes MK6 4BB, United KingdomPizza Pizza EHF2 Iceland 51% Ordinary Louholar 2-6, 11 Reykjavik, IcelandPPS Foods AB3 Sweden 71% Ordinary Elias Lönnrots Väg 19, 168 46 Bromma, Sweden

CORPORATE GOVERNANCE FINANCIAL STATEMENTSSTRATEGIC REPORT
Annual Report & Accounts 2017 Domino’s Pizza Group plc 123
CORPORATE GOVERNANCE FINANCIAL STATEMENTSSTRATEGIC REPORT
Name of CompanyCountry ofincorporation
Proportion of votingrights and share capital Registered office
Indirectly held subsidiary undertakingsD.P. Newcastle Limited England 100% Ordinary 1 Thornbury, West Ashland, Milton Keynes MK6 4BB, United KingdomDeutsche Dominoid GmbH Germany 100% Ordinary c/o Cormoran GmbH, Am Zirkus 2, 10117, Berlin, GermanyDolly Dimple's Norge AS4 Norway 71% Ordinary Karenslyst allé 12/14, Oslo, 0278, NorwayDomino’s Pizza Germany GmbH Germany 100% Ordinary c/o Cormoran GmbH, Am Zirkus 2, 10117, Berlin, GermanyDomino's Leasing Limited England 100% Ordinary 1 Thornbury, West Ashland, Milton Keynes MK6 4BB, United KingdomDomino's Pizza (Isle of Man) Limited Isle of Man 100% Ordinary First Floor, Jubilee Buildings, Victoria Street, Douglas IM1 2SH,
Isle of ManDomino's Pizza Germany (Holdings) Limited
England 100% Ordinary 1 Thornbury, West Ashland, Milton Keynes MK6 4BB, United Kingdom
Domino's Pizza Germany Limited England 100% Ordinary 1 Thornbury, West Ashland, Milton Keynes MK6 4BB, United KingdomDomino's Pizza GmbH Switzerland 100% Ordinary Europastrasse 19, 8152, Glattbrugg, SwitzerlandDomino's Pizza UK & Ireland Limited England 100% Ordinary 1 Thornbury, West Ashland, Milton Keynes MK6 4BB, United KingdomDP Operations AS Norway 71% Ordinary Karenslyst allé 12/14, Oslo, 0278, NorwayDP Pizza Limited Republic of
Ireland100% Ordinary Unit 1B Toughers Business Park, Newhall, Naas Co. Kildare, Ireland
DP Production AS Norway 71% Ordinary Nesveien 13, Haslum, 1344, NorwayDP Realty Deutschland GbmH Germany 100% Ordinary c/o Cormoran GmbH, Am Zirkus 2, 10117, Berlin, GermanyHJS Pizza Deutschland GmbH Germany 100% Ordinary c/o Cormoran GmbH, Am Zirkus 2, 10117, Berlin, GermanySell More Pizza Limited5 England 75% Ordinary 1 Thornbury, West Ashland, Milton Keynes MK6 4BB, United KingdomSheermans Harrow Limited5 England 75% Ordinary 1 Thornbury, West Ashland, Milton Keynes MK6 4BB, United KingdomSheermans Limited5 England 75% Ordinary 1 Thornbury, West Ashland, Milton Keynes MK6 4BB, United KingdomSheermans SS Limited5 England 75% Ordinary 1 Thornbury, West Ashland, Milton Keynes MK6 4BB, United KingdomWAP Partners Limited5 England 75% Ordinary 1 Thornbury, West Ashland, Milton Keynes MK6 4BB, United Kingdom
Associate undertakingsDaytona JV Limited England 33.3% Ordinary 3rd Floor, 1 Ashley Road, Altrincham, Cheshire WA14 2DT,
United KingdomFull House Restaurants Holdings Limited
England 49% Ordinary 34 Anyards Road, Cobham, Surrey KT11 2LA, United Kingdom
Indirectly held subsidiaries of associate undertakingsB N Sandy (Newcastle) Limited England 49% Ordinary 34 Anyards Road, Cobham, Surrey KT11 2LA, United KingdomB N Sandy (Cannock) Limited England 49% Ordinary 34 Anyards Road, Cobham, Surrey KT11 2LA, United KingdomBristol Curry Limited England 49% Ordinary 34 Anyards Road, Cobham, Surrey KT11 2LA, United KingdomClassic Crust Limited England 49% Ordinary 34 Anyards Road, Cobham, Surrey KT11 2LA, United KingdomDancing Tiger Limited England 49% Ordinary 34 Anyards Road, Cobham, Surrey KT11 2LA, United KingdomFreshname 845 Limited England 49% Ordinary 34 Anyards Road, Cobham, Surrey KT11 2LA, United KingdomFull House Restaurants Limited England 49% Ordinary 34 Anyards Road, Cobham, Surrey KT11 2LA, United KingdomHouse Special Limited England 49% Ordinary 34 Anyards Road, Cobham, Surrey KT11 2LA, United KingdomJ M R Foster (Winsford) Limited England 49% Ordinary 34 Anyards Road, Cobham, Surrey KT11 2LA, United KingdomJ M R Foster Limited England 49% Ordinary 34 Anyards Road, Cobham, Surrey KT11 2LA, United KingdomSherston Limited England 49% Ordinary 34 Anyards Road, Cobham, Surrey KT11 2LA, United KingdomSunmead Limited England 49% Ordinary 34 Anyards Road, Cobham, Surrey KT11 2LA, United KingdomSurrey Pizzas Limited England 49% Ordinary 34 Anyards Road, Cobham, Surrey KT11 2LA, United KingdomThe Woodpecker Inn Ltd England 49% Ordinary 34 Anyards Road, Cobham, Surrey KT11 2LA, United Kingdom
Joint venture undertakingsDomino’s Pizza West Country Limited
England 50% Ordinary 1 Thornbury, West Ashland, Milton Keynes MK6 4BB, United Kingdom
DP Shayban Limited England 50% Ordinary 1 Thornbury, West Ashland, Milton Keynes MK6 4BB, United Kingdom
37. Related party transactions continued
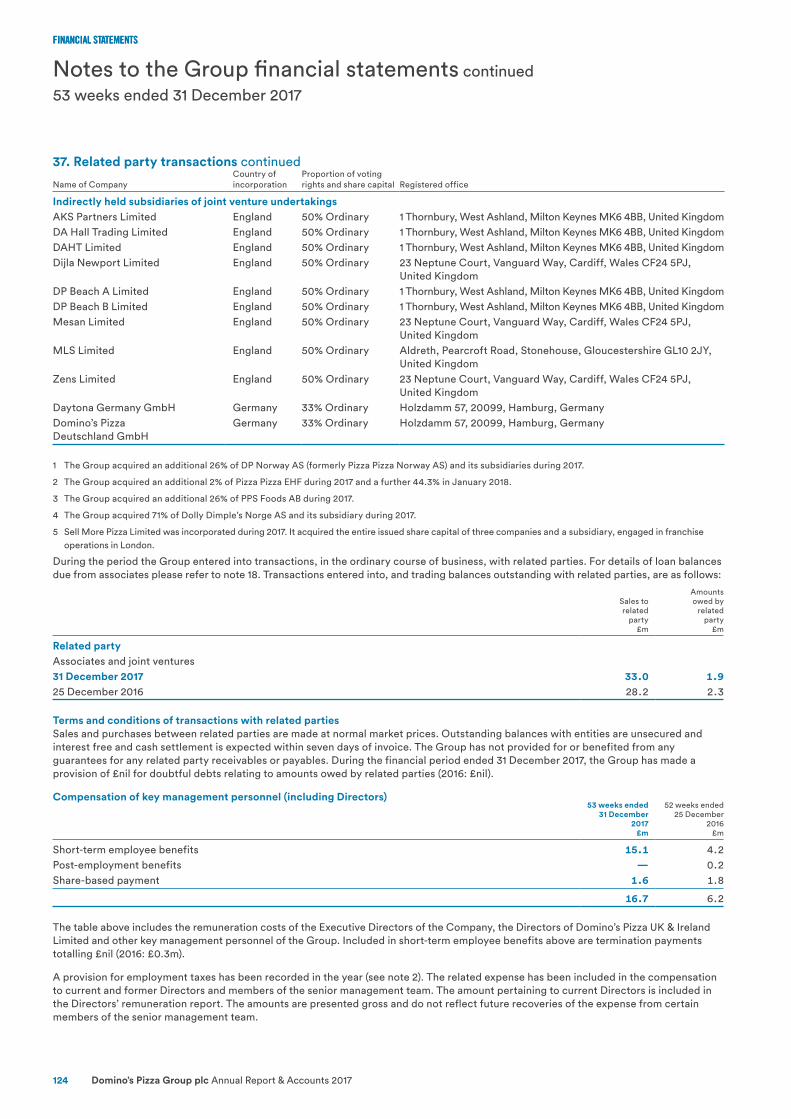
FINANCIAL STATEMENTS
Domino’s Pizza Group plc Annual Report & Accounts 2017124
FINANCIAL STATEMENTS
Notes to the Group financial statements continued
53 weeks ended 31 December 2017
Name of CompanyCountry ofincorporation
Proportion of votingrights and share capital Registered office
Indirectly held subsidiaries of joint venture undertakingsAKS Partners Limited England 50% Ordinary 1 Thornbury, West Ashland, Milton Keynes MK6 4BB, United KingdomDA Hall Trading Limited England 50% Ordinary 1 Thornbury, West Ashland, Milton Keynes MK6 4BB, United KingdomDAHT Limited England 50% Ordinary 1 Thornbury, West Ashland, Milton Keynes MK6 4BB, United KingdomDijla Newport Limited England 50% Ordinary 23 Neptune Court, Vanguard Way, Cardiff, Wales CF24 5PJ,
United KingdomDP Beach A Limited England 50% Ordinary 1 Thornbury, West Ashland, Milton Keynes MK6 4BB, United KingdomDP Beach B Limited England 50% Ordinary 1 Thornbury, West Ashland, Milton Keynes MK6 4BB, United KingdomMesan Limited England 50% Ordinary 23 Neptune Court, Vanguard Way, Cardiff, Wales CF24 5PJ,
United KingdomMLS Limited England 50% Ordinary Aldreth, Pearcroft Road, Stonehouse, Gloucestershire GL10 2JY,
United KingdomZens Limited England 50% Ordinary 23 Neptune Court, Vanguard Way, Cardiff, Wales CF24 5PJ,
United KingdomDaytona Germany GmbH Germany 33% Ordinary Holzdamm 57, 20099, Hamburg, GermanyDomino’s Pizza Deutschland GmbH
Germany 33% Ordinary Holzdamm 57, 20099, Hamburg, Germany
1 The Group acquired an additional 26% of DP Norway AS (formerly Pizza Pizza Norway AS) and its subsidiaries during 2017.
2 The Group acquired an additional 2% of Pizza Pizza EHF during 2017 and a further 44.3% in January 2018.
3 The Group acquired an additional 26% of PPS Foods AB during 2017.
4 The Group acquired 71% of Dolly Dimple’s Norge AS and its subsidiary during 2017.
5 Sell More Pizza Limited was incorporated during 2017. It acquired the entire issued share capital of three companies and a subsidiary, engaged in franchise operations in London.
During the period the Group entered into transactions, in the ordinary course of business, with related parties. For details of loan balances due from associates please refer to note 18. Transactions entered into, and trading balances outstanding with related parties, are as follows:
Sales torelated
party£m
Amountsowed by
relatedparty
£m
Related partyAssociates and joint ventures31 December 2017 33.0 1.925 December 2016 28.2 2.3
Terms and conditions of transactions with related partiesSales and purchases between related parties are made at normal market prices. Outstanding balances with entities are unsecured and interest free and cash settlement is expected within seven days of invoice. The Group has not provided for or benefited from any guarantees for any related party receivables or payables. During the financial period ended 31 December 2017, the Group has made a provision of £nil for doubtful debts relating to amounts owed by related parties (2016: £nil).
Compensation of key management personnel (including Directors)53 weeks ended
31 December2017
£m
52 weeks ended 25 December
2016£m
Short-term employee benefits 15.1 4.2Post-employment benefits — 0.2Share-based payment 1.6 1.8
16.7 6.2
The table above includes the remuneration costs of the Executive Directors of the Company, the Directors of Domino’s Pizza UK & Ireland Limited and other key management personnel of the Group. Included in short-term employee benefits above are termination payments totalling £nil (2016: £0.3m).
A provision for employment taxes has been recorded in the year (see note 2). The related expense has been included in the compensation to current and former Directors and members of the senior management team. The amount pertaining to current Directors is included in the Directors’ remuneration report. The amounts are presented gross and do not reflect future recoveries of the expense from certain members of the senior management team.
37. Related party transactions continued

CORPORATE GOVERNANCE FINANCIAL STATEMENTSSTRATEGIC REPORT
Annual Report & Accounts 2017 Domino’s Pizza Group plc 125
Notes
At31 December
2017£m
At25 December
2016£m
Fixed assetsInvestment in subsidiary undertakings 4 64.9 15.2Investment in associates and joint ventures 4 18.5 45.4
83.4 60.6
Assets Available-for-sale financial asset 3 9.0 8.1Other receivables: falling due after one year 5 13.2 11.4Other receivables: falling due within one year 5 66.0 60.5Cash and cash equivalents 0.8 0.5Deferred tax asset 8 1.9 —
90.9 80.5
Creditors: amounts falling due within one year Other payables 6 (13.4) (17.9)Current tax liabilities (1.6) (1.6)Financial liabilities 7 (18.3) (11.1)
(33.3) (30.6)Creditors: amounts falling due after one year Financial liabilities 7 (17.9) (11.8)Provisions 9 (11.0) —
Total liabilities (62.2) (42.4)
Net assets 112.1 98.7
Shareholders’ equity Called up share capital 10 2.5 2.6Share premium account 36.7 36.6Capital redemption reserve 0.5 0.5Capital reserve – own shares 12 (6.5) (12.3)Retained earnings 78.9 71.3
Total equity shareholders’ funds 112.1 98.7
David WildDirector7 March 2018
Company balance sheet53 weeks ended 31 December 2017

FINANCIAL STATEMENTS
Domino’s Pizza Group plc Annual Report & Accounts 2017126
Sharecapital
£m
Sharepremiumaccount
£m
Capitalredemption
reserve£m
Capitalreserve –
own shares£m
Profitand lossaccount
£m
Equityshareholders’
funds£m
At 27 December 2015 2.6 29.1 0.5 (2.2) 47.0 77.0Proceeds from share issue — 7.5 — — — 7.5Share buybacks — — — (10.1) (22.3) (32.4)
Share buybacks obligation — — — — (10.0) (10.0)Profit for the period — — — — 91.3 91.3Share option and LTIP charge — — — — 1.4 1.4Share options granted to subsidiary employees — — — — 0.9 0.9Equity dividends paid — — — — (37.0) (37.0)
At 25 December 2016 2.6 36.6 0.5 (12.3) 71.3 98.7Proceeds from share issues — 0.1 — 0.3 — 0.4Share cancellations — — — 12.3 (12.3) —Share buybacks (0.1) — — (9.6) (26.6) (36.3)Share buybacks obligation — — — — (8.3) (8.3)Impairment of share issues — — — 2.8 (2.8) —Profit for the period — — — — 95.8 95.8Tax on employee share options — — — — 0.5 0.5Share options and LTIP charge — — — — 1.7 1.7Equity dividends paid — — — — (40.4) (40.4)
At 31 December 2017 2.5 36.7 0.5 (6.5) 78.9 112.1
Company statement of changes in equity53 weeks ended 31 December 2017
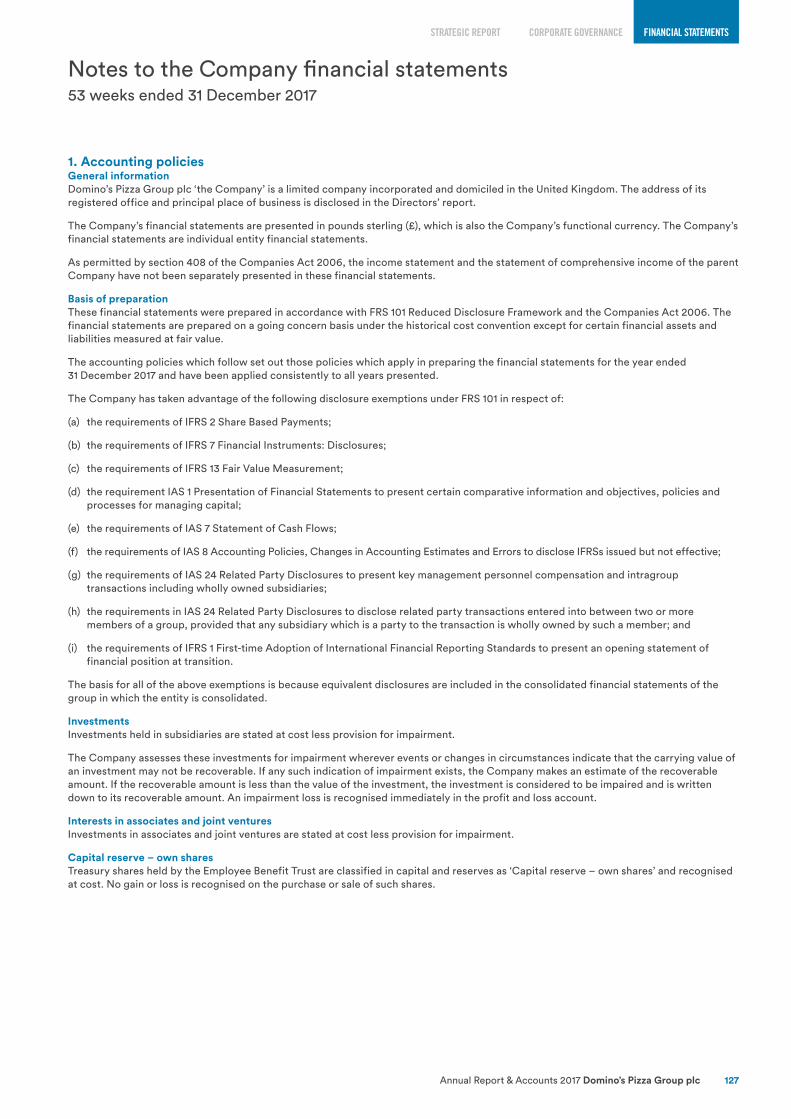
CORPORATE GOVERNANCE FINANCIAL STATEMENTSSTRATEGIC REPORT
Annual Report & Accounts 2017 Domino’s Pizza Group plc 127
Notes to the Company financial statements 53 weeks ended 31 December 2017
1. Accounting policiesGeneral informationDomino’s Pizza Group plc ‘the Company’ is a limited company incorporated and domiciled in the United Kingdom. The address of its registered office and principal place of business is disclosed in the Directors’ report.
The Company’s financial statements are presented in pounds sterling (£), which is also the Company’s functional currency. The Company’s financial statements are individual entity financial statements.
As permitted by section 408 of the Companies Act 2006, the income statement and the statement of comprehensive income of the parent Company have not been separately presented in these financial statements.
Basis of preparationThese financial statements were prepared in accordance with FRS 101 Reduced Disclosure Framework and the Companies Act 2006. The financial statements are prepared on a going concern basis under the historical cost convention except for certain financial assets and liabilities measured at fair value.
The accounting policies which follow set out those policies which apply in preparing the financial statements for the year ended 31 December 2017 and have been applied consistently to all years presented.
The Company has taken advantage of the following disclosure exemptions under FRS 101 in respect of:
(a) the requirements of IFRS 2 Share Based Payments;
(b) the requirements of IFRS 7 Financial Instruments: Disclosures;
(c) the requirements of IFRS 13 Fair Value Measurement;
(d) the requirement IAS 1 Presentation of Financial Statements to present certain comparative information and objectives, policies and processes for managing capital;
(e) the requirements of IAS 7 Statement of Cash Flows;
(f) the requirements of IAS 8 Accounting Policies, Changes in Accounting Estimates and Errors to disclose IFRSs issued but not effective;
(g) the requirements of IAS 24 Related Party Disclosures to present key management personnel compensation and intragroup transactions including wholly owned subsidiaries;
(h) the requirements in IAS 24 Related Party Disclosures to disclose related party transactions entered into between two or more members of a group, provided that any subsidiary which is a party to the transaction is wholly owned by such a member; and
(i) the requirements of IFRS 1 First-time Adoption of International Financial Reporting Standards to present an opening statement of financial position at transition.
The basis for all of the above exemptions is because equivalent disclosures are included in the consolidated financial statements of the group in which the entity is consolidated.
InvestmentsInvestments held in subsidiaries are stated at cost less provision for impairment.
The Company assesses these investments for impairment wherever events or changes in circumstances indicate that the carrying value of an investment may not be recoverable. If any such indication of impairment exists, the Company makes an estimate of the recoverable amount. If the recoverable amount is less than the value of the investment, the investment is considered to be impaired and is written down to its recoverable amount. An impairment loss is recognised immediately in the profit and loss account.
Interests in associates and joint venturesInvestments in associates and joint ventures are stated at cost less provision for impairment.
Capital reserve – own sharesTreasury shares held by the Employee Benefit Trust are classified in capital and reserves as ‘Capital reserve – own shares’ and recognised at cost. No gain or loss is recognised on the purchase or sale of such shares.

FINANCIAL STATEMENTS
Domino’s Pizza Group plc Annual Report & Accounts 2017128
1. Accounting policies continuedShare-based payment transactionsDirectors of the Company receive an element of remuneration in the form of share-based payment transactions, whereby employees render services as consideration for equity instruments.
• The awards vest when certain performance and/or service conditions are met; see the Directors’ remuneration report for the individual vesting conditions for the various schemes.
The cost of equity-settled transactions with employees is measured by reference to the fair value at the date at which they are granted and is recognised as an expense over the vesting period, which ends on the date on which the relevant employees become fully entitled to the award. Fair value is determined by an external value using an appropriate pricing model. In valuing equity-settled transactions, no account is taken of any vesting conditions, other than conditions linked to the price of the shares of the Company (market conditions).
No expense is recognised for awards that do not ultimately vest, except for awards where vesting is conditional upon a market condition, which are treated as vesting irrespective of whether the market condition is satisfied, provided that all other performance conditions are satisfied.
At each balance sheet date before vesting, the cumulative expense is calculated, representing the extent to which the vesting period has expired, management’s best estimate of the achievement or otherwise of non-market conditions and the number of equity instruments that will ultimately vest or, in the case of an instrument subject to a market condition, be treated as vesting as described above. The movement in the cumulative expense since the previous balance sheet date is recognised in the income statement, with a corresponding entry into equity.
Where the terms of an equity-settled award are modified or a new award is designated as replacing a cancelled or settled award, the cost based on the original award terms continues to be recognised over the original vesting period. In addition, an expense is recognised over the remainder of the new vesting period for the incremental fair value of any modification, based on the difference between the fair value of the original award and the fair value of the modified award, both as measured on the date of the modification. No reduction is recognised if this difference is negative.
Where an equity-settled award is cancelled, it is treated as if it had vested on the date of cancellation, and any cost not yet recognised in the income statement for the award is expensed immediately. Any compensation paid up to the fair value of the award at the cancellation or settlement date is deducted from equity, with any excess over fair value being treated as an expense in the profit and loss account.
The Company recharges the cost of equity-settled transactions to the respective employing entity, with a corresponding increase in equity and investment in subsidiary undertakings booked with Domino’s Pizza Group plc.
Available-for-sale financial assets The Market Access Fee is classified as a non-current asset available for sale and is measured at fair value. Changes in fair value are recognised in other comprehensive income except for foreign exchange gains and losses, and impairment, which are recognised in profit or loss.
Provisions for liabilitiesA provision is recognised where the Company has a legal or constructive obligation as a result of a past event and it is probable that an outflow of economic benefits will be required to settle the obligation.
Reversionary share planCertain of the Group’s historical share-based compensation arrangements dating from 2003-2010 involve a degree of estimation and judgement in respect of their employment tax treatment. HMRC issued protective assessments in respect of potential employment tax relating to these historical schemes and as a result of further advice received in January 2018 a provision has been recorded. For details see note 2 of the Group accounts.
Interest bearing loans and borrowingsObligations for loans and borrowings are recognised when the Company becomes party to the related contracts and are measured initially at fair value less directly attributable transaction costs.
After initial recognition, interest bearing loans and borrowings are subsequently measured at amortised cost using the effective interest method. Gains and losses arising on the repurchase, settlement or otherwise cancellation of liabilities are recognised respectively in finance revenue and finance cost.
2. Profit attributable to members of the parent CompanyThe profit within the financial statements of the parent Company is £95.8m (2016: £91.5m).
For details of audit fees see note 6 of the consolidated financial statements.
3. Available-for-sale financial assetsThe contingent consideration of €25.0m (£22.2m) payable by Domino’s Pizza Enterprises Limited (referred to as the “Market Access Fee”) in respect of Domino’s Pizza Group plc divesting its interests in operating Domino’s Pizza stores in Germany and its exclusive access to the German market, held through its shareholding in DP Cyco Limited and which became payable in 2017, is carried at a fair value of €10.1m (£9.0m) within available-for-sale financial assets. The contingent consideration is payable by instalments from 2017, the payment of each instalment being determined by reference to the German business achieving defined levels of EBITDA. As at 31 December 2017, no payments are due. For details of the fair value considerations see note 29.
Notes to the Company financial statements continued53 weeks ended 31 December 2017
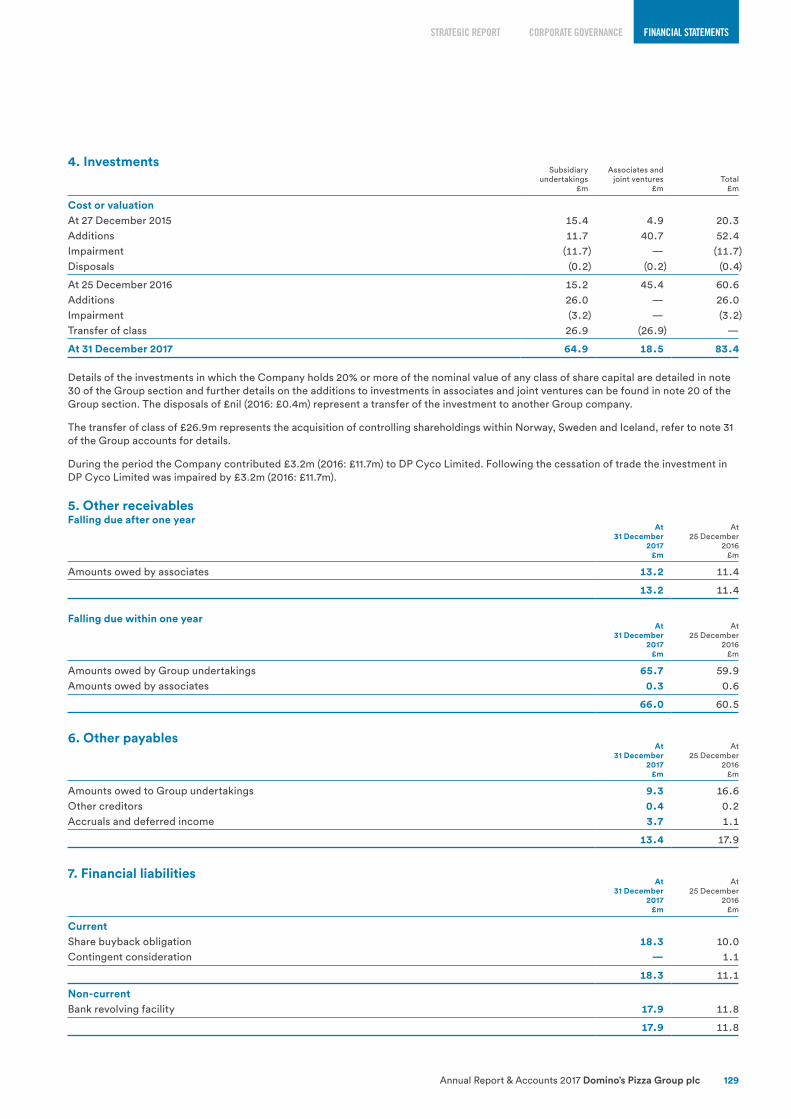
CORPORATE GOVERNANCE FINANCIAL STATEMENTSSTRATEGIC REPORT
Annual Report & Accounts 2017 Domino’s Pizza Group plc 129
4. InvestmentsSubsidiary
undertakings£m
Associates andjoint ventures
£mTotal
£m
Cost or valuationAt 27 December 2015 15.4 4.9 20.3Additions 11.7 40.7 52.4Impairment (11.7) — (11.7)Disposals (0.2) (0.2) (0.4)
At 25 December 2016 15.2 45.4 60.6Additions 26.0 — 26.0Impairment (3.2) — (3.2)Transfer of class 26.9 (26.9) —
At 31 December 2017 64.9 18.5 83.4
Details of the investments in which the Company holds 20% or more of the nominal value of any class of share capital are detailed in note 30 of the Group section and further details on the additions to investments in associates and joint ventures can be found in note 20 of the Group section. The disposals of £nil (2016: £0.4m) represent a transfer of the investment to another Group company.
The transfer of class of £26.9m represents the acquisition of controlling shareholdings within Norway, Sweden and Iceland, refer to note 31 of the Group accounts for details.
During the period the Company contributed £3.2m (2016: £11.7m) to DP Cyco Limited. Following the cessation of trade the investment in DP Cyco Limited was impaired by £3.2m (2016: £11.7m).
5. Other receivablesFalling due after one year
At31 December
2017£m
At25 December
2016£m
Amounts owed by associates 13.2 11.4
13.2 11.4
Falling due within one yearAt
31 December2017
£m
At25 December
2016£m
Amounts owed by Group undertakings 65.7 59.9Amounts owed by associates 0.3 0.6
66.0 60.5
6. Other payablesAt
31 December2017
£m
At25 December
2016£m
Amounts owed to Group undertakings 9.3 16.6Other creditors 0.4 0.2Accruals and deferred income 3.7 1.1
13.4 17.9
7. Financial liabilitiesAt
31 December2017
£m
At25 December
2016£m
CurrentShare buyback obligation 18.3 10.0Contingent consideration — 1.1
18.3 11.1
Non-currentBank revolving facility 17.9 11.8
17.9 11.8

FINANCIAL STATEMENTS
Domino’s Pizza Group plc Annual Report & Accounts 2017130
7. Financial liabilities continuedBank revolving facilityOn 8 July 2017, the Group extended the existing multi-currency syndicated revolving credit facility by one year to 8 July 2022. Subsequently, on 13 December 2017 the revolving credit facility was amended and extended to £350.0m with a term of five years.
Interest charged on the revolving credit facility ranges from 0.75% per annum above LIBOR (or equivalent) when the Group’s leverage is less than 1:1 up to 1.80% per annum above LIBOR for leverage above 2.5:1. A further utilisation fee is charged if over one-third utilised at 0.15% which rises to 0.30% of the margin rate if over two-thirds is drawn. In addition, a commitment fee is calculated on undrawn amounts based on 35% of the current applicable margin.
Arrangement fees of £3.2m (2016: £1.4m) directly incurred in relation to the facility are included in the carrying values of the facility and are being amortised over the term of the facility. Arrangement fees of £0.2m previously capitalised have been written off in the year.
An ancillary overdraft and pooling arrangement is in place with Barclays Bank Plc for £10.0m covering the Company, Domino’s Pizza UK and Ireland Limited, DPG Holdings Limited, and DP Pizza Limited. An ancillary overdraft is in place with Barclays Bank Plc for €5.0m for Domino’s Pizza UK and Ireland Limited. Interest is charged at the same margin as applicable to the revolving credit facility above bank base rate.
The facility is secured by an unlimited cross guarantee between the Company, Domino’s Pizza UK and Ireland Limited, DPG Holdings Limited, DP Realty Limited, DP Pizza Limited and DP Group Developments Limited, DP Cyco Switzerland Limited and Domino’s Pizza GmbH.
Share buyback obligationOn 15 December 2017 the Group entered into an irrevocable non-discretionary programme with Numis Securities Limited to purchase up to a maximum of £20.0m of shares from 15 December 2017 to 8 March 2018. The outstanding commitment to purchase share buybacks has been recognised as a financial liability of £18.3m. The full obligation had been utilised by 5 February 2018.
8. Deferred tax assetAt
31 December2017
£m
At25 December
2016£m
Deferred tax asset 1.9 —
The deferred tax asset of £1.9m (2016: £nil) relates to the £11.0m tax provision for the reversionary share plan. Refer to note 26 in the Group accounts for details.
9. ProvisionsReversionary
share planprovisions
£m
At 25 December 2016 —Arising during the period 11.0
At 31 December 2017 11.0
Reversionary share plan provisionsAs discussed more fully in note 2 of the Group accounts: the employment tax provision relates to certain of the Group’s historical share-based compensation arrangements dating from 2003-2010. As a result of the updated legal advice received a provision has been recorded in these financial statements amounting to £11.0m, comprising £2.6m employer’s NIC, and £8.4m employee’s NIC and PAYE. Within this an estimate of interest on overdue tax of £3.3m has been provided for.
No contingent asset has been recognised in the financial statements in relation to the indemnities provided by the beneficiaries of the arrangements. As the tax liability has not crystallised, the Group is not yet entitled to seek recovery of the amounts due under the indemnities.
The timing of the utilisation of the provision is uncertain, as discussed more fully in note 2 of the Group accounts.
10. Authorised and issued share capitalAuthorised share capital
At31 December
2017
At25 December
2016
Ordinary shares of 25/48p each:– number 768,000,000 768,000,000– value (£) 4,000,000 4,000,000
Notes to the Company financial statements continued53 weeks ended 31 December 2017

CORPORATE GOVERNANCE FINANCIAL STATEMENTSSTRATEGIC REPORT
Annual Report & Accounts 2017 Domino’s Pizza Group plc 131
10. Authorised and issued share capital continuedAllotted, called up and fully paid share capital
At 31 December 2017 At 25 December 2016
Number £ Number £
At 25 December 2016 and 27 December 2015 498,673,494 2,597,252 500,408,064 2,606,286Issued on exercise of share options 83,080 433 4,410,144 22,970Share buybacks (7,849,454) (40,883) (6,144,714) (32,004)Share cancellations (4,072,590) (21,211) — —
At 31 December 2017 and 25 December 2016 486,834,530 2,535,591 498,673,494 2,597,252
During the period 83,080 (2016: 4,410,144) Ordinary shares of 25/48p each with a nominal value of £433 (2016: £22,970) were issued between 323.7p (2016: 306.5p) and 390.1p (2016: 383.1p) for a total cash consideration received of £0.7m (2016: £7.5m) to satisfy the share options that were exercised.
During the year the Company bought back a total of 10,789,454 Ordinary shares of 25/48p each for a total value of £36.6m (including costs of £0.2m). Of these shares, 7,849,454 were cancelled and 2,940,000 were bought back and held as treasury shares. The average price for which these shares were purchased was 339.2p. During the year the Company also cancelled 4,072,590 shares that were held as treasury shares at the start of the year.
11. Share-based paymentsThe total charge recognised for share-based payments in respect of employee services received during the 53 weeks ended 31 December 2017 was £1.7m (2016: £2.2m). This all arises on equity-settled share-based payment transactions. Of this total, a charge of £1.6m (2016: £1.4m) relates to employees of the Company and a charge of £0.1m (2016: £0.9m) relates to share options granted to employees of subsidiaries. For full disclosures relating to the total charge for the period including grants to both employees of the Company and its subsidiaries please refer to note 32 of the Group financial statements.
12. Reconciliation of shareholders’ funds and movements on reservesOn 25 April 2017 the 2016 final dividend of £22.0m was paid to shareholders, and on 1 September 2017 an interim 2017 dividend of £18.4m was paid to shareholders.
In addition, the Company continued share buybacks, announcing £35.0m during the year, of which an irrevocable liability of £18.3m remained at 31 December 2017. The buybacks were completed on 5 February 2018.
The reserves available for distribution at 31 December 2017 were estimated as being £61.8m (2016: £43.0m).
Capital reserve – own sharesThis reserve relates to shares held by an independently managed EBT and shares held by the Company as “treasury shares”.
The shares held by the EBT were purchased in order to satisfy outstanding employee share options and potential awards under the Long Term Incentive Plan (‘LTIP’) and other incentive schemes. During the period the Company acquired 2,940,000 of its own shares (2016: nil). At 31 December 2017 the Company held 2,114,550m (2016: 168,756) of its own shares in the EBT which had a historic cost of £6.5m (2016: £nil). These shares had a market value at 31 December 2017 of £6.7m (2016: £0.6m). The EBT has waived its entitlement to dividends.
During the period the Company acquired nil of its own shares (2016: 2,932,590m). At 31 December 2017 the Company held nil (2016: 4,072,590) of its own shares. The shares are held as treasury shares. The Company has the right to reissue these shares at a later date.
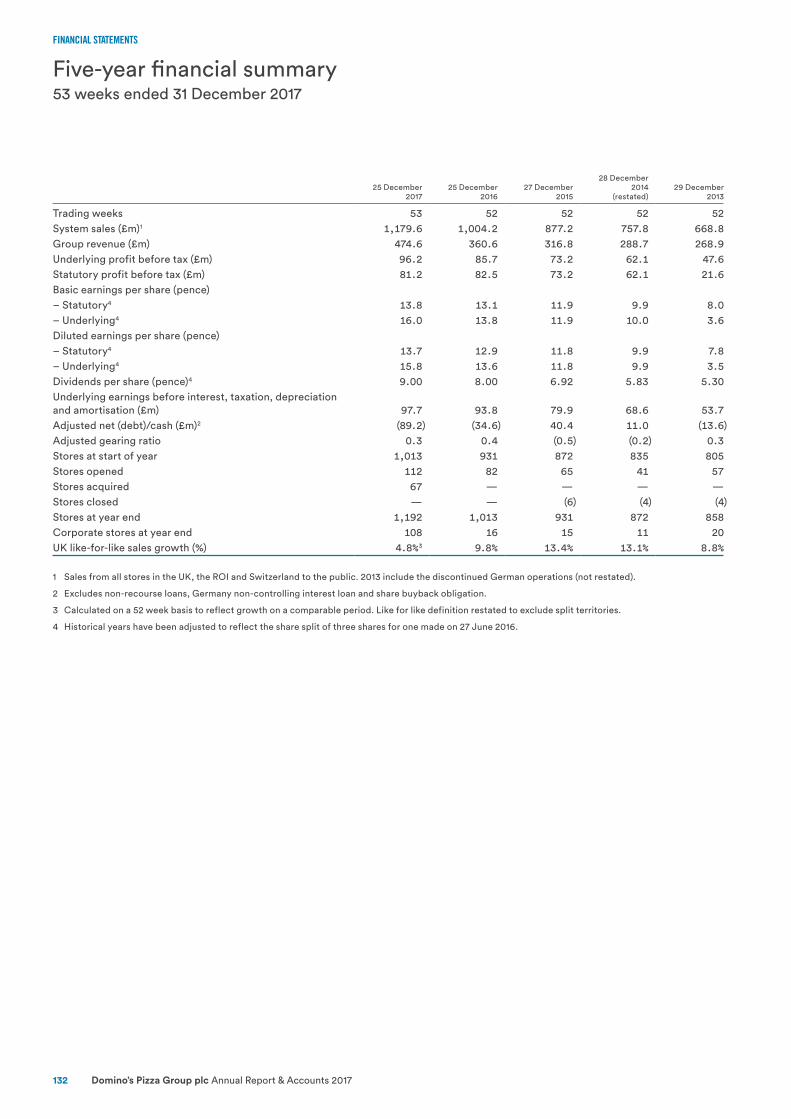
FINANCIAL STATEMENTS
Domino’s Pizza Group plc Annual Report & Accounts 2017132
Five-year financial summary53 weeks ended 31 December 2017
25 December2017
25 December2016
27 December2015
28 December2014
(restated)29 December
2013
Trading weeks 53 52 52 52 52System sales (£m)1 1,179.6 1,004.2 877.2 757.8 668.8Group revenue (£m) 474.6 360.6 316.8 288.7 268.9Underlying profit before tax (£m) 96.2 85.7 73.2 62.1 47.6Statutory profit before tax (£m) 81.2 82.5 73.2 62.1 21.6Basic earnings per share (pence)– Statutory4 13.8 13.1 11.9 9.9 8.0– Underlying4 16.0 13.8 11.9 10.0 3.6Diluted earnings per share (pence)– Statutory4 13.7 12.9 11.8 9.9 7.8– Underlying4 15.8 13.6 11.8 9.9 3.5Dividends per share (pence)4 9.00 8.00 6.92 5.83 5.30Underlying earnings before interest, taxation, depreciation and amortisation (£m) 97.7 93.8 79.9 68.6 53.7Adjusted net (debt)/cash (£m)2 (89.2) (34.6) 40.4 11.0 (13.6)Adjusted gearing ratio 0.3 0.4 (0.5) (0.2) 0.3Stores at start of year 1,013 931 872 835 805Stores opened 112 82 65 41 57Stores acquired 67 — — — —Stores closed — — (6) (4) (4)Stores at year end 1,192 1,013 931 872 858Corporate stores at year end 108 16 15 11 20UK like-for-like sales growth (%) 4.8%3 9.8% 13.4% 13.1% 8.8%
1 Sales from all stores in the UK, the ROI and Switzerland to the public. 2013 include the discontinued German operations (not restated).
2 Excludes non-recourse loans, Germany non-controlling interest loan and share buyback obligation.
3 Calculated on a 52 week basis to reflect growth on a comparable period. Like for like definition restated to exclude split territories.
4 Historical years have been adjusted to reflect the share split of three shares for one made on 27 June 2016.

CORPORATE GOVERNANCE FINANCIAL STATEMENTSSTRATEGIC REPORT
Shareholder information
Be a ScamSmart investor and spot the warning signsInvestment and pension scams are often sophisticated and difficult to spot.
Fraudsters will often: • contact you out of the blue;
• apply pressure to invest quickly;
• downplay the risks to your money;
• promise tempting returns that sound too good to be true; and
• say that they are only making the offer available to you or even ask you to not tell anyone else about it.
How to avoid investment and pension scamsReject unexpected offers
• Scammers usually cold call, but contact can also come by email, post, word of mouth or at a seminar. If you have been offered an investment out of the blue, chances are it is a high risk investment or a scam.
Check the FCA Warning List • Use the FCA Warning List to check the risks of a potential
investment – you can also search to see if the firm is known to be operating without our authorisation.
Get impartial advice • Get impartial advice before investing – do not use an adviser
from the firm that contacted you.
If you are suspicious, report itYou can report the firm or scam to us by contacting our consumer helpline on 0800 111 6768 or using our reporting form using the link below.
If you have lost money in a scam, contact Action Fraud on 0300 123 2040 or www.actionfraud.police.uk.
Be ScamSmart and visitwww.fca.org.uk/scamsmart
The Group’s commitment to environmental issues is reflected in this Annual Report which has been printed on Arcoprint which is made from an FSC® certified and PCF (Process Chlorine Free) material. Printed in the UK by Pureprint Group using its environmental printing technology, and vegetable inks were used throughout. Pureprint Group is a CarbonNeutral® Company. Both manufacturing mill and the printer are registered to the Environmental Management System ISO 14001 and are Forest Stewardship Council® (FSC) chain-of-custody certified.
Advisers and principal service providersRegistered office1 ThornburyWest AshlandMilton KeynesMK6 4BB01908 580000Investor website: http://investors.dominos.co.uk
Broker and corporate finance advisersNumis Securities LimitedThe London Stock Exchange10 Paternoster SquareLondonEC4M 7LT
Credit SuisseOne Cabot SquareLondonE14 4QJ
AuditorErnst & Young LLPNo.1 Colmore SquareBirminghamB4 6HQ
BankersBarclays Bank plcAshton House497 Silbury BoulevardMilton KeynesMK9 2LD
SolicitorsNorton Rose Fulbright LLPMore London RiversideLondonSE1 2AQ
RegistrarsEquiniti LimitedAspect HouseSpencer RoadLancingWest SussexBN99 6DA
If you hold your shares direct and not through a Savings Scheme or ISA and have queries relating to your shareholding, please contact the registrars:
• Callers in the UK: 0371 384 2895
• Callers from outside the UK: +44 121 415 0926
Lines are open from 8.00a.m. to 5.30p.m. Monday to Friday (excluding UK bank holidays).
Shareholders can also access details of their holding and other information on the registrars’ website, www.shareview.co.uk.
The registrars provide an online share dealing service for those who are not seeking advice on buying or selling, available at www.selftrade.co.uk.
The registrars also offer a range of other dealing and investment services, which are explained on their website, www.shareview.co.uk.

Dom
ino’s Pizza Group plc A
nnual Report &
Accounts 20
17
Domino’s Pizza Group plc1 Thornbury, West Ashland,
Milton Keynes MK6 4BB