d6: european extreme weather risk management needs ... · grant no. 233919 1/81 extreme weather...
TRANSCRIPT

Grant No. 233919
1/81
Extreme weather impacts on European networks of transport
Grant Nr 233919
D6: European Extreme Weather Risk Management – Needs, Opportunities, Costs and
Recommendations
Project: EWENT
Document Number and Title: D6 European Extreme Weather Risk Management – Needs,
Opportunities, Costs and Recommendations
Work-Package: WP6
Deliverable Type: Report
Contractual Date of Delivery: M30
Actual Date of Delivery: M32
Author/Responsible(s): P. Leviäkangas (VTT), P. Saarikivi (Foreca)
Contributors: P. Nurmi, V. Nurmi, A. Perrels, A. Vajda (FMI
T. Mühlhausen T. Gerz (DLR)
M. Nokkala, R. Molarius (VTT)
J.Ludvigsen (TÖI)
J. Schweighofer (via donau)
P. Groenemeijer (ESSL)
Co-Contributors: H. Tuomenvirta, I. Juga (FMI)
M. Kreuz, J.Bläsche (DLR)
Zulkarnain, J. Rönty, V. Könönen, A-M. Hietajärvi, H. Askola,
H. Auvinen, A. Tuominen (VTT)
N. Siedl (via donau)
S. Michaelides, S. Athanasatos, M. Papadakis (CYMET)
D. Ivanov (WMO)
N. Dotzek (†) (ESSL)
Approval of this report: European Commission
Summary of this report:
Keyword List: EWENT, extreme weather, policy, strategy, risk management
Dissemination level: Public (PU)

Grant No. 233919
2/81
Version history
Version Date Status Author (co-author) (Partner) Description
0.1 18.1.2012 Draft P. Saarikivi (Foreca)
P. Leviäkangas (VTT)
Outline
0.2 6.6.2012 Draft P. Nurmi, V. Nurmi, A. Perrels
(FMI)
Para 7 - WP5
covering economic value
assessment of weather
forecasts (D5.2)
0.3 11.06.2012 Draft A. Vajda (FMI)
T. Mühlhausen, T. Gerz (M.
Kreuz) (DLR)
M. Nokkala (H. Auvinen, H.
Askola, A. Tuominen) (VTT)
P. Saarikivi (Foreca)
(S. Michaelides, S.
Athanasatos, M. Papadakis)
(CYMET)
P. Groenemeijer (N. Dotzek (†))
(ESSL)
(D. Ivanov) (WMO)
Ch. 3
Ch. 4
Ch. 5
Ch. 6 & 7
0.4 19.06.2012 Draft R. Molarius (V. Könönen, J.
Rönty, Zulkarnain) (VTT)
P. Nurmi (FMI)
J. Schweighofer (via donau)
J. Ludvigsen (TÖI)
Ch. 6
Ch. 7
Ch. 6
0.5 28.7.2012 Final
draft
P. Leviäkangas (VTT) Ch. 1, ch 8, ch 9, technical
edits, minor revisions.
0.6 31.7.2012 Final P. Leviäkangas (VTT) Minor technical revisions
0.7 1.8.2012 Final P. Leviäkangas (VTT)
Minor technical revisions and
additions from earlier
deliverables
EWENT- project (Extreme weather impacts on European networks of transport, Grant Nr 233919) was
co-funded by the European Commission under the 7th Framework Programme, Transport, Horizontal
activities.
This report has been produced with the assistance of the European Union. The contents of this publication are the sole
responsibility of EWENT Consortium and can in no way be taken to reflect the views of the European Union.

Grant No. 233919
3/81
Table of contents
Foreword ......................................................................................................................... 5
1. Introduction ............................................................................................................... 6
2. Identified extreme phenomena .................................................................................. 7
2.1. Methods and goals to identify the phenomena ................................................................ 7
2.2. The phenomena ................................................................................................................ 7
2.3. The impacts and consequences – first robust assessment............................................... 9
3. Probabilities of extreme weather in Europe .............................................................. 13
3.1. Introduction .................................................................................................................... 13
3.2. Climatology of adverse weather conditions affecting transport ..................................... 13
3.3. Scenarios of adverse weather conditions for the 2050s ................................................. 18
4. Consequences of harmful weather events ............................................................... 24
4.1. Introduction .................................................................................................................... 24
4.2. Road traffic ..................................................................................................................... 25
4.3. Rail traffic........................................................................................................................ 26
4.4. Aviation ........................................................................................................................... 26
4.5. Maritime shipping ........................................................................................................... 27
4.6. Inland waterway transport ............................................................................................. 28
4.7. Light traffic ..................................................................................................................... 29
5. Direct and indirect costs .......................................................................................... 30
5.1. Accident costs ................................................................................................................. 30
5.2. Time costs ....................................................................................................................... 32
5.2.1. Aviation .............................................................................................................. 32
5.2.2. Road .................................................................................................................. 34
5.3. Operator costs ................................................................................................................ 35
5.3.1. Aviation .............................................................................................................. 35
5.3.2. Port operations .................................................................................................. 37
5.4. Infrastructure costs ........................................................................................................ 38
6. Risk panorama for Europe ....................................................................................... 40
6.1. The risk assessment method .......................................................................................... 40
6.2. Northern European (sub-arctic) region ........................................................................... 41
6.3. Temperate Central European region .............................................................................. 43
6.4. Temperate Eastern European region .............................................................................. 47
6.5. Oceanic region ................................................................................................................ 49
6.6. Mediterranean region...................................................................................................... 52
6.7. Mountainous regions ....................................................................................................... 54
6.8. Risk indicators per country and transport mode ............................................................ 56
7. Adaptation and mitigation strategies ........................................................................ 59

Grant No. 233919
4/81
7.1. Objectives ....................................................................................................................... 59
7.2. Identified policies and strategies .................................................................................... 59
7.3. Weather risk management measures based on more effective met-information .......... 61
7.3.1. Alarm services.................................................................................................... 61
7.3.2. Enhanced met-information services - cost effectiveness and benefits .............. 62
7.3.3. Met-information supply market vs. extreme weather situations ....................... 65
7.4. Other risk management approaches and ideas .............................................................. 65
8. Sum-up of results .................................................................................................... 68
8.1. Climatology and future scenarios of extreme weather ................................................... 68
8.2. Summary of consequences ............................................................................................. 69
8.3. Present and future costs of extreme weather in Europe ................................................ 71
9. Recommendations and discussion ............................................................................ 74
References .................................................................................................................... 79

Grant No. 233919
5/81
Foreword This is the final deliverable of EWENT project that was launched in December 2009 and closed in May
2012. This deliverable presents the major results of EWENT’s previous work packages and it draws
from the earlier research results in order to summarise the findings and to provide recommendations for
different stakeholders who must deal with extreme weather phenomena. These stakeholders include
decision makers and experts from supranational, national, regional and even local administration,
transport sector authorities and infrastructure managers, as well as business sector stakeholders:
transport operators, infrastructure owners, insurance, transport sector financiers, etc.
The results of EWENT are extensive and path-breaking. The results can be considered to some extent
quite novel, but it goes without saying that much is owed to prior research. The research consortium of
EWENT was a multidisciplinary team of six leading European research and service organisations, two
innovative SMEs and a United Nations global organisation. Most importantly, the team was a unique
combination of meteorological, climatological, transport economics and transport technology expertise
– and furthermore, a team that combined all modes of transport. Such research project teams are
seldom witnessed.
EWENT project produced a number of deliverables, reports, articles and a wide list of presentation
material most of which is available from EWENT website http://ewent.vtt.fi until the end of 2014.
EWENT was referenced throughout the world and it also caught the eye of media. We hope that
EWENT project has served its purpose, although as always in research, some objectives of projects
are met better than the others.
EWENT had the privilege to involve to its work an outstanding Consultative Board, which through its
advice and network made EWENT even more visible and productive. Especially we want to mention Mr
Martti Mäkelä from Ministry of Transport and Communications Finland, Ms Nancy Saich from the
European Investment Bank and Mr Philippe Crist, from the International Transport Forum of OECD.
The scientific project officers of the European Commission, first Mr Karsten Krause and then Ms Ioana-
Olga Adamescu, were a crucial force to support EWENT researchers’ efforts.
With great pleasure we deliver this last output of EWENT, on behalf of EWENT consortium and our
colleagues:
Pekka Leviäkangas
VTT Technical Research Centre of Finland
Heikki Tuomenvirta Thorsten Mühlhausen Pirkko Saarikivi
Finnish Meteorological Institute German Aerospace Center Foreca Consulting
Johanna Ludvigsen Silas Michaelides Juha Schweighofer
Institute of Transport Economics Cyprus Meteorological Service via donau
Pieter Groenemeijer Dimitar Ivanov
European Severe Storms Laboratory World Meteorological Organisation

Grant No. 233919
6/81
1. Introduction The EWENT project (Extreme Weather impacts on European Networks of Transport) funded by the
European Commission under the 7th Framework Programme (Transport, Horizontal Activities) has the
objective of assessing extreme weather impacts on the European transport system. EWENT will also
monetise the assessed impacts and draft mitigation and adaptation strategies to make the transport
system more resilient against extreme weather phenomena.
The whole work plan of EWENT project was based on risk management process, starting from the
identification of the critical phenomena, assessing their probabilities, investigating the associated
consequences and costs and finally assessing the risks. All these steps have been carried out in
previous EWENT work packages and reported in their deliverables D1, D2.1, D3, D4, D4.4 (working
memo), D5.1, and D5.2 (Leviäkangas et al. 2011, Vajda et al. 2011, Mühlhausen et al. 2011, Nokkala
et al. 2012, Ludvigsen et al. 2012, and Molarius et al. 2012, and Nurmi et al. 2012). These reports and
links to their officially published versions can be found from EWENT website http://ewent.vtt.fi/. The
interested reader is advised to consult these reports as they contain information much more in depth
than this summary report.
This is the last deliverable, merely summarising the results of previous work – describing the extreme
weather phenomena, their probabilities and consequences, the costs they result in, how to measure
their risk between 27 European Union member states, and finally how to tackle the risks by introducing
some lines of mitigation and adaptation.
Chapters of this deliverable follow the work breakdown structure, WP1 (phenomena) results are
summarised in chapter 2, WP2 in chapter 3, and so forth. Chapters 8 and 9 are putting together
recommendations and introducing new ideas that came out from EWENT.
17
Identification of hazards
Estimation of probabilities
Estimation of consequences
Estimation of associated cost
Definition of the object
Risk assessment
Mitigation strategies,policy options
WP1
WP2 WP3
WP4
WP5
WP6
The work breakdown structure of
EWENT project was based on risk
management standard IEC 60300-3-9.
This deliverable introduces all work
packages’ main results. The latter part of
the report is concentrating on strategies
and policies to mitigate risks and adapt
to possible increase of extreme weather
phenomena.

Grant No. 233919
7/81
2. Identified extreme phenomena
2.1. Methods and goals to identify the phenomena
The first work package of EWENT provided the results concerning the relevant extreme weather
phenomena:
A list of critical weather phenomena which, on the basis of literature and media mining, are
clearly such that they have consequences on transport systems
Threshold values of parameters for the above phenomena which, if met or exceeded, indicate a
high probability of measurable harmful impacts and consequences
Selected impact mechanisms (12) that indicate why certain impacts and consequences start to
occur; the meaning of these causal maps is to help later in the identification of efficient
mitigation and adaptation measures. For example, in some cases just improving drainage could
be a very efficient strategy, or in other cases there is little to do except improve the
dissemination of information.
The methodological approach was the following. First, there was the traditional review of professional
literature. Second, media mining was done in order to get more empirical data and to assess which
modes in which parts of Europe seem to be affected the most. Third, there was a compilation of specific
case studies on past extreme incidents, helping to assess the specific consequences of certain
phenomena.
All aspects and functions of the transport system are affected, but in different ways in different parts of
Europe and on different time scales when impacts are distinguished between operations and
infrastructure. Operations can always be more or less flexibly adapted to a changed situation, but
infrastructure requires long-term planning if modifications concerning weather resilience are to be
achieved.
2.2. The phenomena
Relevant adverse and extreme weather phenomena were analysed by taking into account the ranking
and threshold values defined from the viewpoint of different transport modes. The following phenomena
were analysed, based on extensive literature review of more than 150 references (Leviäkangas et al.
2010): strong winds; heavy snowfall; blizzards; heavy precipitation; cold spells; and heat waves. In
addition, visibility conditions determined by fog and dust events, small-scale phenomena affecting
transport systems such as thunderstorms, lightning, large hail and tornadoes. Events that damage the
transport system infrastructure were also considered, but not included in quantitative data analysis.
The three identified threshold values present a rough assessment on the probability with which the
negative impacts start to incur. Table 1 lists the phenomena and the threshold values.
There are large differences in the probabilities and intensity of extremes affecting transport systems
across Europe. The Northern European and the mountainous regions are impacted most by winter
extremes, such as snowfall, cold spells and winter storms, while the probability of extreme heat waves
is highest in Southern Europe. Extreme winds and blizzards are most common over the Atlantic and
along its coastline. Heavy rainfalls occasionally impact the whole continent. Visibility conditions indicate
a general improvement over the decades studied: severe fog conditions seem to have a strong
declining trend at some of the main European airports.

Grant No. 233919
8/81
Table 2.1. Most harmful extreme weather phenomena and their threshold values
Phenomena Threshold 1
harmful impacts
possible, 0.33
Threshold 2
harmful impacts
likely, 0.66
Threshold 3
harmful impacts
certain, 0.99
Wind (gust speed) ≥17 m/s ≥25 m/s ≥32 m/s
Snowfall ≥1 cm/d ≥10 cm/d ≥20 cm/d
Rain ≥30 mm/d ≥100 mm/d ≥150 mm/d
Cold (mean temperature of the day) <0°C <-7°C <-20°C
Heat (mean temperature of the day) ≥+25°C ≥+32°C ≥+43°C
Blizzard
Blizzard is considered to occur when Threshold 1 values of Wind,
Snowfall and Cold are realised simultaneously
Due to the various climatic patterns, different regions of Europe are impacted by different extremes. In
order to facilitate the assessment of impacts and consequences of extremes phenomena on European
levels a map of the European climate regions was created by Finnish Meteorological Institute in
collaboration with EWENT’s other met-partners. Based on the frequency and probability analysis of the
selected climatic extremes we differentiated six main climate regions: Northern European, Temperate
Eastern European, Temperate Central European, Mediterranean, Mountainous and Oceanic regions.
The hazards are constant within climate regions. Each EU-27 member state belongs to one or several
climate regions. For example, Italy presents both the Mediterranean and Mountainous climates, Norway
and Sweden likewise present Northern European climate but some parts have mountainous
characteristic, thus labelled as Mountainous regions. Poland has both Temperate Central and
Temperate Eastern regions present. In France there are in fact four climate regions present: Oceanic,
Temperate Central, Mountainous and Mediterranean; however, we have used only three for France.
The results that follow are shown by mode and climate regions, and some countries might appear in
several climate regions.

Grant No. 233919
9/81
Figure 2.1. The improved map of European climate regions based on the frequency and probability
analysis of the selected climatic extremes (Modified from Vajda et al., 2011).
2.3. The impacts and consequences – first robust assessment
The ultimate output of the first phase of EWENT was an “extreme weather impact map”, which attempts
to visualize where the top priorities are and what type they should be. The consequences are prioritised
as follows:
1st priority: Accidents leading to casualties and injuries (A)
2nd priority: Infrastructure collapse or damage (I)
3rd priority: Time delays (T)
4th priority: Sub-optimal operations (O)
The weather phenomena symbolised on the map are those identified as the most common extremes
with identifiable consequences, i.e. heavy rain, heavy snowfall, extreme winds, extreme heat, drought,
and visibility.
The map is of course a crude simplification that simply points out what the most urgent problems seem
to be in different parts of Europe. Its purpose is to give an overall impression and it cannot be used
beyond this simple purpose.
Identifying the most critical phenomena on the basis of gathered information is relatively easy:
precipitation in all its forms very quickly affects all land transport modes and when precipitation comes
as snow, aviation is likewise affected. Precipitation also affects inland waterway transport operations

Grant No. 233919
10/81
significantly. For land transport modes, precipitation has a similar type of impact in all regions.
Excessive rain and snow also block urban transportation more effectively than any other weather
phenomena.
Figure 2.2. Sum-up of critical weather phenomena, their occurrence by region where effects are the
most severe, with the most affected modes of transport and the consequences (Leviäkangas et al.
2011)
When heavy snowfall is encountered, the only essential difference between regions is the availability of
snow removal and maintenance equipment (and studded tyres in the Nordic countries in winter).
Furthermore, especially snow and ice cause severe road accidents, the consequences of which should
be considered top priority. This being the case, the greatest responsibility for mitigating the above
effects probably falls on the owners and managers of the road infrastructure. How effectively they will in
the end be able to answer this challenge in terms of their resources and preparedness is another
matter.
Precipitation is the phenomenon that most likely has the severest impacts on transport infrastructures,
in particular on road and rail embankments. Even relatively modest but frequent flooding quickly

Grant No. 233919
11/81
deteriorates land structures over the years, although one single event does not in itself appear to be
very serious.
Road transportation seems to be the most vulnerable mode. There are self-evident reasons for this.
First, the traffic volumes are highest on roads and the capacity usually most limited in densely
populated areas. One relatively insignificant crash can quickly create chaos on urban motorways. The
second reason is that road traffic is least controllable and manageable. Where air control or a railway
traffic management centre can quickly decide on and execute adaptive and corrective measures, road
traffic remains mostly a slowly self-adaptive system that is geographically widespread and scattered.
As to climatologic regions, most of the reported cases from both the literature and media reports seem
to come from mainland Europe, the UK and Scandinavia. Most likely this is partly dependent on a)
active research and b) active media in those regions. In this sense, the summary of results could
underestimate weather phenomena such as heat waves and sand storms, which are common in
southern parts of the EU. This bias is considered, however, to be insignificant in terms of the overall
conclusions.
Two tentative strategic options seem to arise and be distinguishable in a broad sense for decision
makers responsible for adapting to and mitigating extreme weather consequences. Either we can focus
our efforts on those modes and places that are already quite well controlled, such as railways and
aviation, and ensure that their resilience to extreme weather is enhanced. These modes can then serve
as back-up systems when other modes (roads) fail to be of service. This could well be a cost-efficient
and resource-efficient option from the society’s point of view.
Or, we can start working on the road mode, trying to increase its resilience in different ways such as
improving maintenance preparedness and road traffic control and information services. The vehicle
manufacturing industry has already been active in developing anti-skid systems that are definitely
useful in cases of icy and snowy roads. Relying on driver supporting systems and information services
probably puts the onus (both effort and cost) on the users rather than on the public sector.
The above options are, however, very preliminary thoughts how the battle against extreme weather
impacts could be envisioned. For both strategies, if they now at all are excluding options from one
another, there are both pros and cons (Table 1). These are summarised and evaluated in the below
table. If both fronts are battled simultaneously, there is a risk of dividing the efforts and resources
inefficiently. This risk is enhanced, when international, joint efforts are considered.
Inland waterways and short-sea shipping are special cases, and without underestimating their
importance they are probably in a better position to meet extreme weather events. Their share of the
transportation market could even be increased and improved by recognising them as more weather-
resilient modes that have greater reliability.

Grant No. 233919
12/81
Table 2.1. Pros and cons of alternative strategic emphasis (Leviäkangas et al. 2011)
Strategic emphasis
Pros Cons
Road system resilience
Much of the cost can be borne directly by the users, because users pay for in-vehicle safety systems and possibly also partly for information services.
The road system is the most “connecting” mode of transport – its reliability also serves the other modes best.
Investing in maintenance equipment and more comprehensive traffic management is expensive and possibly not a very cost-efficient strategy.
The road system is a scattered system that is complex to manage and control.
Rail and aviation system resilience
Rail and aviation systems are concentrated and centralised and manageable.
Mitigation and adaptation strategies are more easily implemented in centralised systems.
Aviation infrastructure owners and the aviation industry are obliged to bear much of the cost (which are then passed on to the consumer).
Both industries are in an economic pinch and introducing more obligations might further aggravate their situation.
For the rail sector some measures might require large public investments, which could be difficult to justify for a sector that already enjoys some public financial support.
Both rail and air travel chains almost without exception include stretches on roads and streets.

Grant No. 233919
13/81
3. Probabilities of extreme weather in Europe
3.1. Introduction
This chapter contains the main results of the Work Package 2 (WP2) of the EWENT project. The
objectives of EWENT WP2 were:
(1) to develop the first comprehensive European climatology of extreme weather events
relevant to the transport system to support socio-economic and technical research and
decision making, and
(2) to estimate the changes in extreme weather event intensities and frequencies of
occurrence relevant for the transport system.
The selection of weather events to be analyzed and their definitions are based on the results of the
preceding EWENT WP1, which identified the extreme weather events relevant within the European
transport system context (see Ch. 2 on WP1).
This chapter describes the observational data used, development of the methodology for the analyses,
and presents climatology of weather conditions affecting transport. Concerning future changes we first
describe the climate model simulations used in the construction of scenarios of harmful weather events
before presenting scenario maps as changes in frequencies or probabilities. A summary of results is
presented for six climate regions covering Europe. More details about the changes in the probability of
adverse and extreme weather events are presented in the WP2 report by Vajda et al. (2011).
3.2. Climatology of adverse weather conditions affecting transport
The analysis of the relevant adverse and extreme weather phenomena takes into account the ranking
and impact threshold values defined from the viewpoint of different transport modes, such as road, rail,
aviation, waterways, and infrastructure within WP1 (Leviäkangas et al., 2011). Threshold indices are
defined as the number of days on which a variable falls above or below a fixed threshold. In the present
study three impact threshold indices were defined for each of the following phenomenon: wind, snow,
blizzard, heavy precipitation, cold spell and heat wave, in such a way that these can be applied for the
entire European continent.
In order to assess the spatial and temporal variation of adverse weather conditions over the European
continent, two gridded datasets were used: the E-OBS European high resolution land-only gridded
dataset (Haylock et al. 2008) produced through spatial interpolation of daily station data Daily mean
(TG), maximum (TX), minimum (TN) temperature and precipitation sum in a 0.25° regular latitude-
longitude grid were utilized for the time period 1971-2000. In addition, the ERA-Interim reanalysis
dataset of the atmospheric state produced at the European Centre for Medium-range Weather
Forecasting (ECMWF) was used. ERA-Interim uses 4D-variational analysis on a spectral grid with T255
horizontal resolution (corresponds to approximately 80 km) and a hybrid vertical coordinate system with
60 levels (Simmons et al. 2006). We extracted for our analysis the 6-hour forecast of 10 m wind gust, 6-
hour forecast of precipitation sum, and 6-hour reanalysed 2-m mean temperature in Gaussian grid with
a spacing of about 0.7° for the time period 1989-2010.
The European Severe Weather Database (Dotzek et al., 2009) contains an ever-growing collection of
reports of individual severe weather events and is managed by the European Severe Storms
Laboratory (ESSL). We presented maps for hail (2 cm or larger) and tornadoes. In addition, to calculate
the frequency of freezing precipitation, the 16-year NOAA National Climatic Data Centre database of

Grant No. 233919
14/81
surface observations at airports covering the period 1982-1997 was used (Lott, 2000), and additional
observations were used in the evaluation of fog and dust occurrence as well as lightning frequency.
The impact of wind storms on transport network is considerable, with air, sea and land transportation
being all affected. Wind can impede transport operation or damage vehicles and infrastructure leading
to significant economic impacts and injuries. As indicated in Figure 3.1, extreme wind gust are more
frequent over the Atlantic, the most affected land areas are the British Isles, Iceland and the coastal
area (40-80 days/year with wind gust over 17m/s). Most of the continent experiences 10-20 days per
year with strong wind gust (17 m/s). Very extreme wind gust events (> 25 m/s) occur rarely and
sporadically over Europe.
Figure 3.1. Average number of days per year with wind gust exceeding 17 m/s during the period 1989-
2010 based on ERA-Interim data
Snow represents a great challenge for transport system operations. Heavy snowfall results in
increased travel time, delays and increased accident risk. Dense snowfall causes poor grip between the
road surface and tyres and reduces the visibility, resulting in a possible reduction of road capacity
(Agarwal et al., 2005). Keeping roads free from snow is a major part of winter road maintenance in
many European countries. Snowfall also has a strong negative impact on railway traffic and aviation, as
experienced in Europe during the winters of 2009/10 and 2010/11 when many European airports were
closed, generating severe economic losses.
Snow events impact practically the entire continent (Fig. 3.2) with an increase in probability toward
Northern, Eastern Europe and the Alpine region, where the frequency of days with snow varies
between 100-140 days/year. Although the chosen 1 cm snowfall is a relatively low threshold value,
even a thin snow cover may cause disruption, particularly in the regions where its probability is
reduced. Dense snowfall (≥10 cm/24 h) occurs only sporadically over Western, Southern and most of
Central Europe (max. 5 days/year). In Scandinavia the frequency varies between 5-15 days/year, while
over the eastern part of the continent and the Balkan Peninsula it rarely exceeds 5 days/year. Heavy
snowfall (≥20 cm/24 h) is frequent over Northern Europe (Norway and Iceland) and the Alps: 10-25
cases/year. Nevertheless, the analysis indicates 30-40 cases per year for the rest of Scandinavia,
Eastern Europe and some parts of the Balkan Peninsula during 1971-2000.

Grant No. 233919
15/81
Figure 3.2. Frequency-based probability (in percent) of daily snowfall exceeding 1 cm during the period
1971-2000 based on E-OBS data
A blizzard is a severe storm condition defined by low temperature, sustained wind or frequent wind
gust and considerable precipitating or blowing snow, which can cause damage to structures and,
failures in transport control systems, as well as reduced road friction and visibility. In the present study
we considered a blizzard to occur when the following criteria are met: snowfall exceeding 10 cm/24
hours, wind gust ≥ 17 m/s and daily mean temperature below 0°C.
Figure 3.3. Total number of blizzard events during the period 1989-2010 based on ERA-Interim data
The analysis indicated relatively low frequency of blizzards during the study period (Fig. 3.3). Blizzard
conditions occur predominantly over the Alps and Northern Europe (30-40 cases in 30 years). The most
affected regions are the western coast of Scandinavia and Iceland, with more than 140 cases in 1989-
2010 (~10 cases/year). However, we have to take into account that, due to the difficulties in wind gust
prediction and the relatively coarse resolution of ERA-Interim data, the frequency of blizzard events
might be underestimated.

Grant No. 233919
16/81
Hot days and heat waves are harmful for land (road and rail), air transportation and also for
infrastructure. High temperature may cause driver fatigue and road deterioration, while extreme high
temperature, such as 43 °C, causes buckling in the road surface, airport runways and rail tracks, and
equipment failure, thus increasing accident rates and the probability of delays or diversions. The
thresholds used in the analysis of heat waves were: 25 °C, 32 °C and 43 °C.
A) B)
Figure 3.4. Frequency-based probability of daily maximum temperature exceeding (A) 25 °C and (B) 32
°C (in percent) during the period 1971-2000 based on E-OBS data
There is at least a 5% probability of having high temperatures (≥ 25 °C) over the European continent
(Fig 3.4). The frequency of hot days varies between the annual average of 90-150 days (for the 25 °C
threshold), 30-80 days (32 °C) in southern Europe and between 15-60 days (25 °C), 10-20 days (32
°C), in the central and eastern part of the continent. Very hot days, with daily maximum temperature
above 43 °C, are very rare with a maximum of 25 days over the Iberian and Balkan Peninsula.
Low temperature can be considered a modifier of hazardous conditions for transportation, rather than
a main cause. Low temperatures contribute to the development of slippery conditions on roads, may
cause disruption in the railway sector, inland waterway transport and may severely limit the work of
ground crews at airports. The spatial and temporal variation of low temperature was studied using three
thresholds: 0 °C, -7 °C and -20 °C. The frequency of frost days varies from 100 to 200 per year in
Scandinavia, with the highest values in the Scandes (220 days), and decreases southwards, to about
20 days per year (Fig. 3.5). Most of the continent is free of very extreme cold spells (< 20 °C), except
Scandinavia and the NE part of Europe (5-30 days/year).

Grant No. 233919
17/81
A) B)
(C)
Figure 3.5. Average number of days per year with daily mean temperature below: (A) 0 °C, (B) -7 °C
and (C) -20 °C, during the period 1971-2000 based on E-OBS data
Fog occurrence is a problem for many modes of transport, most importantly aviation and shipping. For
shipping, it is necessary that the vessels reduce their speed to ensure safe operation. Similarly, for
aviation, an increase in separation between aircrafts is required as visibility reduces. The severity of the
fog problem is strongly related to the climate zone. However, local condition can also favour for
conditions thus making certain airports more fog-prone than others.
Recently, a number of scientists (Vautard et al., 2009; Van Oldenborgh et al., 2010) have considered
the temporal trend of visibility during a number of decades across Europe and found the intriguing
result that the occurrence of very low visibility conditions has strongly declined. Van Oldenborgh et al.
(2010) found that this decline is due to the decrease in aerosol emissions over Europe, and not
changes in flow patterns. For traffic, and air traffic in particular, the above results are naturally good
news (Fig. 3.6). We may expect that the trend of improving visibility conditions will continue in the near
future, provided that actions in improving air quality continue, although the trend may level off at longer
timescales.

Grant No. 233919
18/81
Figure 3.6. Annual numbers of hours with visibility <200 m at the airports of Zurich (green), London
Gatwick (blue) and Oslo (red). Thin lines represent annual totals; thick lines are 7-year moving
averages.
For occurrence of heavy precipitation (Fig. 3.7), freezing rain, dust episodes in the Eastern
Mediterranean, lightning, tornados, and hail as well as methodological development of extreme
value theory and weather pattern analysis we advise to see Vajda et al. (2011).
Figure 3.7. Probability of the five-day precipitation total exceeding 100 mm during the period 1971-2000
based on E-OBS data
3.3. Scenarios of adverse weather conditions for the 2050s
Six high-resolution (ca. 25x25 km2) Regional Climate Model (RCM) simulations produced in the
ENSEMBLES project were used to estimate future changes in adverse weather conditions for transport.
All GCMs used to drive RCMs were forced with the A1B (medium, non-mitigation) emission scenario
(van der Linden and Mitchell, 2009). The analyses compared the near-future (2011 to 2040) and far-
future (2041 to 2070) time horizons with the present climate (1971-2000). The RCMs chosen were:
SMHIRCA-ECHAM5-r3
SMHIRCA-BCM
SMHIRCA-HadCM3Q3

Grant No. 233919
19/81
KNMI-RACMO2-ECHAM5-r3
MPI-M-REMO-ECHAM5-r3
C4IRCA3-HadCM3Q16
There are three main uncertainties in climate projections: internal variability of the climate system that
exists even in the absence of any external forcing; uncertainty in radiative forcing due to future
emissions of greenhouse gases and aerosols; and model uncertainty (Hawkins and Sutton, 2009). It
was chosen to neglect the uncertainty due to emissions and focus on the A1B emission scenario,
because the uncertainty in emission scenarios rivals model uncertainty only in the latter half of the 21st
century.
Based on the calculation of frequencies using the six RCMs, the multi-model mean of the change
compared to the control period (1971-2000; for wind gusts and for blizzards 1989-2009), furthermore
the upper and lower limits of the change has been calculated for each threshold of the adverse and
extreme phenomena. The multi-model mean is the average change indicated by the six models giving
each model equal weight. The range of changes is also indicated for each grid that describes well the
inter-model variability, i.e. upper and lower limit. The upper limit (maximum) shows the “most positive”
change of any model, while the lower limit (minimum) indicates the “most negative” change.
The frequency of snowfall events is projected to decrease. The multi-model means (Fig. 3.8) show 1-5
fewer days of snow in southern Europe, with changes in the frequency of snow days increasing
progressively northward, to 10-20 days in Scandinavia compared to 1971-2000. The sign of change is
consistent among all six RCMs, except in the Mediterranean and the western part of the continent.
Contrary to the general decrease in snow days, the probability of extreme snowfall (> 10 cm) increases
over large areas of Scandinavia and north-eastern Russia (1-5 days/year). This increase is partly due
to the anticipated increase of total precipitation in the future but also due to warmer temperatures, since
heavy snowfall tends to occur close to near-zero degrees Celsius. As shown in the upper limit maps,
some models indicate a more robust increase in the frequency of 10 cm and especially 20 cm
snowfall/day for several central and eastern European countries. The anticipated decrease in snowfall
and frozen precipitation would have a positive impact on road, rail and air transportation reducing the
cost of maintenance in many European countries; however in the Nordic countries, where heavy
snowfall is already one of the most common disruption factors, it seems to become a more severe
phenomenon.

Grant No. 233919
20/81
Figure 3.8. Multi-model mean, upper and lower limit of changes in annual snowfall days from 1971-
2000 to 2041-2070 exceeding (A) 1 cm, (B) 10 cm and (C) 20 cm based on six RCM simulations
As Figure 3.9 shows, warm days (mean temperature above 25 °C) will become more prevalent by the
2050s. Scandinavia will experience 5 more warm days/year and Southern Europe 30-40 more
days/year. In western and central parts of the continent, the projections suggest warm days will become
more frequent by 20-30 days/year. The spatial variation of hot days (maximum temperature above 32
°C) suggests a substantial increase for the southern part of the continent, up to 40 days/year, and an
increase of 5-20 days/year in the mid-latitudes. This change implies that mid-latitudinal regions may
experience as many days with heat waves by 2070 as the Mediterranean countries do in the present
climate. As for the frequency and spatial variation of days above 43 °C, more countries will be affected
than nowadays, with most of S and SE Europe experiencing extreme heat waves, their number
increasing by 5 days/year. Some of the climate models indicate an increase of 20 days/year for the
Mediterranean countries.
The projected increase in the duration and intensity of hot days will have a negative impact on
transportation and infrastructure during the summer months, especially in those countries which already
experience high temperatures.

Grant No. 233919
21/81
Figure 3.9. Multi-model mean, upper and lower limit of changes in annual heat-spells days from 1971-
2000 to 2041-2070 exceeding (A) 25 °C, (B) 32 °C and (C) 45 °C based on six RCM simulations
The simulated cold extremes decline in occurrence substantially by 2070 over the whole continent
(Fig. 3.10), most strongly over Northern Europe. The decrease in the frequency of frost days (0 °C)
varies between 20-30 days/year in Northern Europe and decreases gradually towards Southern
Europe, with a decrease of 1-5 days/year. Most of the six models agree on the amplitude of change
over land. This implies that Finland, Sweden and Norway are likely to experience as many frost days in
the 2050s as some mid-latitude countries (such as the Baltic countries, Poland and Ukraine) do in the
current climate.
The spatial and temporal analysis of the extreme cold spells also indicates fewer days with
temperatures < -20 °C for the affected areas, by 10-20 days/year in Scandinavia, Alps and the
northeastern part of the continent. The RCMs agree on the variation of the upper and lower limits, the
most negative change for the extreme cold spell is 1-5 days/year for Northern and Northeastern
Europe. The largest differences from the current climate are 30-40 frost days/year in Scandinavia and
the Alps, 50 days in the Arctic and Baltic Sea and 10-20 days in Southern Europe. The magnitude of
change in the extreme cold spells (daily mean temperature < -20 °C) varies between 1-40 days/year
according to the most negative projection (see Lower limit map), with the highest values at high
latitudes.

Grant No. 233919
22/81
Figure 3.10. Multi-model mean, upper and lower limit of changes in annual cold-spell days from 1971-
2000 to 2041-2070 exceeding (A) 0 °C, (B) -7 °C and (C) -20 °C based on six RCM simulations
Considering the magnitude of changes in precipitation extremes, we found a somewhat less clear
change for the applied threshold indices than the earlier studies; an increase of 1-5 days/year over
Europe except the Mediterranean, where no significant change or a sporadical decrease is expected.
Changes in wind extremes are more difficult to assess, since the multi-mean indicates a decrease
over the Atlantic and Mediterranean Sea but a slight decrease or no significant change in either
direction over the continent. Additionally, there is a large variation in the results among the models.
Similarly, for blizzards any changes are fairly uncertain, with discrepancies among the models. For
more results we advise to see Vajda et al. (2011).
The changes in the Baltic Sea maximum ice cover extent and the average maximum fast ice
thickness were assessed based on the output of 19 global climate models; the results suggest that
maximum ice cover extent and the probability of severe ice winters will decrease. Severe ice winters
will become rare after 2030 (Fig.3.11), with a corresponding increase in probability for mild and
extremely mild ice winters. The average maximum fast ice thickness was calculated only for the coastal
sea areas and suggests that the average maximum fast ice thickness will become thinner everywhere,
and in the southern region likely disappear completely. It is however important to remember that

Grant No. 233919
23/81
Stefan’s law, used to estimate the average maximum fast ice thickness, does not take into account any
snow layer on top of the fast ice. The results shown here are thus about 10-20 cm too high
(Leppäranta, 1993), although it should also be noted that a warmer climate may also reduce the snow
thickness.
Figure 3.11. The average maximum fast ice thickness (cm) for each future decade; A) 2011-2020, B)
2021-2030, C) 2031-2040, D) 2041-2050, E) 2051-2060
Any change in the heat storage of the sea and its possible effect on the ice thickness has not been
taken into account. Presumably, in the future, a warmer summer and autumn would increase the heat
storage of the surface layer of the sea. This would delay the cooling of the sea in winter and thus
decrease the maximum fast ice thickness. Thus, any change in the heat storage is an important factor,
especially in the open sea areas.
A) B)
C) D)
E)

Grant No. 233919
24/81
4. Consequences of harmful weather events
4.1. Introduction
This Chapter summarises the work done in work package 3 of the EWENT project. It is based on the
following working memos and deliverables of the work package:
D3.1: Extreme weather impacts of extreme weather (working memo, not published)
D3.2: Traffic safety impacts of extreme weather (working memo, not published)
D3.3: Extreme weather impacts on European transport operators and their customers (working
memo)
D3.4: Consequences of extreme weather (deliverable, published as D3 (Bläsche et al 2011,
Kreuz et al 2012)
In the previous work packages of the EWENT-project the focus has been laid on the identification of
extreme weather impacts (WP1) and assigning probabilities to these phenomena (WP2). This was
done in order to be able to identify their significance from the transport mode and regional importance
point of view. This enables us to narrow the scope of analyses to those weather impacts that are most
relevant for each region.
Based on the work so far, the purpose of work package 3 is to focus on identifying the impacts of
extreme weather phenomena on infrastructure, its operators and users as well as the safety
implications. The key aspect is to identify consequences of various extreme weather impacts on all
transport modes and with geographical focus to capture the variety of European weather conditions.
The regions were identified as country groupings in the work package 1 and the most significant
impacts were assigned for each region.
The overall goal of work package 3 is to provide a quantitative assessment of impacts of
weather phenomena on transport modes, by regions. To achieve this target, for each of the
climate regions, typical traffic nodes or corridors are identified. Based on these nodes and
traffic volumes are identified and the consequences of adverse weather are analysed. A
generic example for these dependencies is shown in
Figure .
Figure 4.1. Generic example of harmful weather impacts and consequences to transport

Grant No. 233919
25/81
The analysis has shown that the different traffic modes within the European network of transport face
completely different consequences, and therefore, challenges by different weather phenomena. This
means thresholds, recovery time, and accident numbers for each type of weather differ for each traffic
mode.
Weather phenomena can either affect the operations directly or damage the infrastructure and hence
affect the operations indirectly. The duration of indirect effects is not correlated with the duration of the
weather phenomena. Indirect effects can be reduced by maintenance activities and may last much
longer than the weather phenomena itself, depending on their necessary repair measures.
4.2. Road traffic
Road traffic is the dominant mode within the network. Two most common traffic patterns are
passenger transport in urban areas
freight transport in corridors between these areas.
As large urban areas provide a dense
network of roads, redirecting the traffic is
often possible in case of local
disturbances. Therefore, weather
phenomena affecting larger parts of these
areas inflict disturbances, but do not have
major long-lasting implications, because
the traffic can be re-routed around
maintenance and repair construction
areas. This situation differs from the
corridor traffic, since re-routing option is
more complex and possibly non-feasible
due to the lack of alternative routes.
Furthermore, road quality and driver
training vary substantially within the European Union. This can result in an intensification of the
consequences of extreme weather phenomena and leads not only to congestions, but also to
accidents. The traffic growth intensifies this impact. Harmful weather phenomena’s safety effects are
clearly outweighed by the effects of this growth and the most adverse impacts are related to time costs
and infrastructure damages and maintenance costs.
As for the road transport, the future changes are likely to reduce the impact of extreme weather.
However, the causality is linked to the improved technologies that assist road users and the operability
of the road transport system in a more safe way. Partially these technologies assist in reducing the
impact, for instance through reductions in collisions and contacts between road users. As the largest
volumes of road transport users are in the Central and Southern Europe, the fact that extreme
conditions there become rare also means that majority of road users are less vulnerable to impacts.
The amount of delays in road transport will increase, but only partially due to the extreme weather.
More of the increase is result of increased traffic and the intensity especially in the urban context.
Road transport volumes will continue to increase in terms of both passengers and freight, but more
smart corridors and traffic management can slightly compensate for these events. More can be
achieved through specific measure directed against extreme weather. It is a worthy assumption that

Grant No. 233919
26/81
resilience of road transport sector will be addressed between now and 2040 by specific measures, once
the costs of extreme weather are known to policy-makers.
4.3. Rail traffic
Like in road traffic, rail traffic can be divided into urban commuter traffic on the side as well as long
distance passengers and freight traffic between population centres on the other side.
Rail traffic has only a limited number of vehicles compared to road traffic, which are operated by highly
trained drivers. In addition, multiple safety systems are in place. The accident rates are historically low
in this controlled operating environment. On the other hand, the lack of alternative routes and lack of
track capacity in case of weather disturbances can lead to significant delays in rail transport. Time costs
are also the dominant factor when assessing the negative impacts of extreme weather phenomena.
Snow storms are typically blocking the tracks and shifts and thunder storms damage the control and
safety systems.
Road and rail suffer from similar extreme weather phenomena, and thus the future reduction of impacts
is also expected, analogous to road transport. By improving the maintenance processes impacts of
heavy snowfall and rain can be dealt with. Also, by taking into consideration for instance the impact of
wind as creating obstacles to tracks or affecting the power supply gains can be made.
Rail transport will see developments that are related to technology that enhance the journey. These
developments are likely to include also deployment of tools and technologies that can improve the
resilience. Global warming may result in some negative impacts, such as avalanches in the Alpine
region. In critical places, these occurrences can be fatal. These can take place due to the fact that
trains that utilise narrow corridors in the region can have avalanches due to melting of slow in the upper
slopes. At present the existing safety measures may not adequately prevent such incidents from
happening. However, these effects can be mitigated through advance planning of the required counter-
measures to tackle the problems.
4.4. Aviation
Compared to the surface traffic modes, air transportation is a point to point connection. During the flight
in en-route area, aviation is only disrupted marginally by weather phenomena. But during start and
landing, it is very sensitive to those effects. Especially fog, snow and wind can disrupt the operations
with even a low intensity. This weather impact will increase in future. Past has shown that particular
airports, operating at their capacity limit, are affected by bad weather phenomena. Due to the expected
increase in aviation, more and more airports will operate in this area close to their overall capacity, and
therefore, they will be more affected by weather. As regular operations after a disturbance is easier to
restore for relative small traffic centres than for network structures like road or rail, the recovery time for
aviation is smaller. But especially high density airports transfer delay to the next day as they do not
have the capacity to reduce accumulated aircraft queues during regular operations.
Looking at the expected development for aviation, it can be stated that the influence of weather on
aviation will increase in future. The reason here is not primarily the climate change, but the prognosis
for growth in worldwide air traffic.

Grant No. 233919
27/81
The effects of climate change for air traffic can be hardly foreseen, as there are many overlapping
effects, which can offset or accumulate. Below you can find some examples:
A reduced number of fog situations leads to avoidance of higher separation and finally in higher
yearly capacity
An increased number of thunderstorms result in more temporary closure of airspace or airport
and so in a lower yearly capacity
Increasing temperatures reduce the necessity for de-icing procedure, resulting in shorter turn-
around times and hence in an increase of capacity
More sandstorms in the Mediterranean region reduce the visibility, what leads to an increase in
separation and so in a loss of capacity.
But due to the expected growth in aviation, an increasing number of airports will operate near their
capacity limit and hence will be more sensitive to disturbances by weather phenomena. An increase of
the capacity by airport extension programs is especially in Central Europe very difficult due to
environment restrictions and the noise awareness within the vicinity of an airport. Therefore, technical
and procedural developments are needed to face this challenge and maintain the high standards of
safety and quality in air travel. These developments include also the improvement of intermodal
processes especially with the rail system to strengthen the overall European network.
4.5. Maritime shipping
Like aviation, sea transport is a point to point traffic with only a very limited number of network elements
(e.g. channels). But unlike air traffic, the operations can be disrupted significantly during the whole trip
and not only near the harbour. Especially strong winds and low temperatures may have massive
negative impact on the operations.

Grant No. 233919
28/81
Considering marine/short ship shipping outlooks, future weather changes are already been addressed
and things look optimistic. The fact alone that shipping consists of 90% of Europe’s trade in goods and
the dual advantages of low fuel consumption and bulk transfer of goods has lead to addressing
problems such as port congestion and interconnectivity with other modes of transportation, as well as
the safety of passengers and the elimination of delays in transit.
Future weather changes are expected to affect, both directly and indirectly, infrastructures, personnel
and transit in the two main branches of marine shipping: Transport (of goods and people) and
Recreation/cruise shipping. Considering infrastructure and, in particular, ports, steps have already been
taken to identify and to address the problem of congestion which will most certainly intensify in the
future if preventative measures (such as better management, dealing with port spatial constrains, better
loading/unloading equipment, better utilization of weather related information) are not taken and is
susceptible to weather conditions, as well as the problems of interconnectivity to other modes of
transport in order to minimize the congestion of goods in ports. Port growth rate, on the other hand, is
not homogenous across the EU and this could lead to problems if flexibility to adapt is not present.
Technologies on the marine sector constantly improve and stricter regulations considering safety are
implemented and enforced, such as risk assessment, risk management and security to ports and ships.
Maritime accidents in the EU fleet seem to get lower by the year (or, at least, not rising) and weather-
related information for seafarers becomes more easily attainable, more accurate and more “tailor-
made” in order to be better implemented to the task at hand.
Finally, the recreation and cruise shipping industry seems to be on the rise, attracting tourists from both
inside the EU and outside. The Mediterranean Sea and the countries around it remain a popular
tourism destination. Rising temperatures may move tourists to “higher latitudes” (still within the EU) but
may also open a “winter market” for southern Mediterranean providing more time for peak-season
cruises.
A positive feature could be the potential decrease in ice cover of the Baltic Sea. This will inevitably, if
taking place, decrease the need for ice-breaking operations and hence reduce the fairway winter
maintenance costs. It will also increase the winter time reliability of vessel schedules decreasing the
time losses of cargo.
Aviation and maritime shipping both rely on the connected road and rail network, because these
networks distribute the passengers and goods to the final destination. The intermodal node points have
hence a significant role in the overall performance of the transport system.
4.6. Inland waterway transport
Inland waterways are based on a network of rivers and channels with a controlled water-level.
Therefore, weather phenomena disrupting these levels, i.e. heavy precipitation, especially in
association with snow melt, as well as drought have significant impact on the operations. But also low
temperatures over a longer time period (resulting in ice drift) lead to disruptions. Wind and low visibility
may have also negative impacts, but they are not that significant.
In the Rhine-Main-Danube corridor no decrease in the performance of inland waterway transport due to
extreme weather events is expected till 2050. Extreme weather events relevant to inland waterway
transport are low-water events (drought), high water events (floods) and ice occurrence. Of less
importance are wind gusts and reduced visibility. There is no convincing evidence that low-water events

Grant No. 233919
29/81
will become significantly severer on the Rhine as well as the Upper Danube in the near future. On the
Lower Danube some impact of drought in association with increased summer heat might appear,
demanding however dedicated research. Related to high-water events no reliable statement with
respect to increase of discharge and frequency of occurrence can be given. However, consideration of
floods on inland waterways will remain important also in the future due to reasons related to flood
protection. Ice occurrence is decreasing, due to global warming as well as human impacts leading to
shorter periods of suspension of navigation in regions where navigation may be prevented by ice. Wind
gusts are expected to remain on the same level as today, thereby not decreasing the safety of inland
waterway transport. Visibility seems to improve if results for European airports are considered, thereby
improving the safety of inland waterway transport as well as operation of inland waterway vessels.
Improving the inland waterway infrastructure by implementation of the respective TENT-T priority
projects acknowledged by the European Commission as well as national activities will have a significant
positive impact on the reduction of the vulnerability of inland waterway transport to extreme weather
events today and in the future. Further measures with high potential comprise the development of
customer oriented waterway management as well as River Information Services and new ICT
technologies.
4.7. Light traffic
Non-motorised traffic belongs to the coverage of EWENT project, although just a brief analysis is
pursued. Therefore a short outlook was given concerning light traffic (pedestrians, cycling) based on
the results of D1 (Leviäkangas et al. 2011) where the costs and impacts of slippery light traffic pathway
conditions were already reported and of D2.1 where the probabilities of adverse weather phenomena
were projected (Vajda et al. 2011).
The gravest impacts on light traffic are caused by the wintery weather conditions resulting in
slipperiness. Falling accidents, faced both by pedestrian and cyclists, generate large socio-economic
costs especially in the Nordic countries where most the research on the subject has been carried out. In
Finland alone, the socio-economic costs of the aforementioned accidents yield to more than 2 billion
euros per year. Upscaling this figure in a very rough manner means that in Northern Europe these
costs yield probably to around 10 billion euros each year. For other type of weather phenomena the
impacts are by and larger unknown and most likely do not reach a level of significance. Even in the
case of slippery conditions one can almost certainly exclude the extreme intensities of weather.
There are two trends that affect these accidents. First, the ageing of population in Europe, including the
Northern parts where the problem is present. Ageing citizens have a particular risk and in Swedish
studies 2/3 falling and slipping accidents occur in slippery conditions. The other trend is the warming of
the climate. In several studies, the warming has been associated with more temperatures around zero
centigrade hence resulting in more slippery conditions that there would be in colder circumstances. This
seems to be specifically again a Northern European issue, where winters might get warmer and more
slippery on sidewalks, pedestrian and cycle paths and courtyards.
The only effective way to combat slippery light traffic pathways is winter time maintenance, of which
much is mandated to real estate owners in city areas, where the problem obviously mostly exists. Cities
and municipalities in Northern areas are in the key role to tackle the challenge. The national authorities’
role can only be a supportive one, though guidelines and standards regarding light traffic pathway
winter time maintenance.

Grant No. 233919
30/81
5. Direct and indirect costs
5.1. Accident costs
The status and volume of accidents for each transport mode was reported in Mühlhausen et al. (2011).
This section only presents a summary of the results from the earlier report. For inland waterways, no
comprehensive data were available on accidents at the European level, so an estimate was made
using Eurostat transport performance statistics, accident data related to the transport performance of
PLANCO Consulting GmbH (2007) as well as accident data available for the Austrian Danube.
The accident data is reported in Table 5.1.
In other transport modes (barring road and rail) the amount of accidents on an annual level is so small
that any major accident can lead to considerable changes in accident amounts. In marine/short-sea
shipping the accident volume is also directly related to the volume of shipping activity; in the statistics
the year 2009 total number of fatalities was 52, when in 2007 and 2008 annual fatalities were 82 for
both years. In 2009 the freight volumes declined due to the financial crisis and global recession.
Since the European Union accident statistics from Eurostat do not specify the cause of the accidents or
give any details of the conditions in which accidents have taken place, the accidents resulting from
extreme weather cannot be disintegrated by the cause. Such an exercise could be possible using the
data from those rare countries where more detailed accidents data is available, but this would not
create figures that are credible. As we know the main causes of road accidents (as defined in
Deliverable 1 of the project), it is possible out of the accident volumes (country by country) to identify
the most likely causes. However, that is beyond the monetisation done in this deliverable as the focus
in on providing a European estimate of the total costs.
For the purpose of determining the portion of accidents caused by weather in road transport, we used
the detailed Finnish accident data from 2006 to 2010. The average number of fatalities and injuries
from weather-related accidents was around 20 per cent over the period. This may represent a higher
end estimate in terms of the European average, as weather conditions in Finland, particularly in the
winter time, are tougher than in most parts of Europe. On the other hand, since the conditions are more
familiar to road users in Finland, preparedness to encounter them is also most likely above the
average. The data does not also indicate what portion of the accidents linked with weather conditions
can be classified taken place under conditions that exceed the threshold values for severe occurrence.
We used an estimate of half (10%) of the accidents being a result of extreme weather. This is also in
line with findings from the other research projects as for instance those from Norway reported in
Mühlhausen et al. (2011). For the sensitivity analyses, additional calculations using 5% and 15% per
accident ratios were also carried out.
For the other transport modes, the probabilities from road transport appear too high. There is no similar
data available for the other modes as is for the road transport, so expert estimates were provided by
VTT and FMI staff members. For marine/short-sea shipping, the small number of accidents suggests
that the probabilities could be half of those observed in the road transport.

Grant No. 233919
31/81
Table 5.1. Fatalities and severe injuries across transport modes for EU-25, accession countries and
Switzerland
(Sources: European road accidents statistics (Eurostat), Maritime accident review, Railway accidents
statistics as specified in Mühlhausen et al., 2011; PLANCO Consulting GmbH, 2007)
Transport mode Fatalities Severe injuries All injuries
Road1 49 004 376 251 1 980 269
Rail2 1 498 1 350 N/A
Inland waterways3 7 17 266
Marine/short-sea shipping4 52 / 61 360 1 600
Aviation5 0 N/A N/A
12007;
22008;
3Based on calculations from IWW data, Excluding Bulgaria and Romania;
42009/2010;
52010
The share of weather-related accidents seems also lower in inland waterways, where the study results
reported in work package 3 indicate that only 10% of the accidents in inland waterways are related to
poor weather. In marine / short-sea shipping this percentage is most likely higher, as extreme weather
events contribute more to the accidents in sea transportation. For rail, similarly, we applied the lower
level estimate of 10%, with sensitivity analysis of 5% and 15% respectively.
Aviation was left out of the analyses, as the amount of accidents in the industry was small and was not
considered relevant for calculations. For instance, in 2010 no fatalities took place in the entire
European airlines passenger transport.
For pricing of the fatalities and injuries, we use the European level round figure estimates. The figures
include EU-25, Switzerland and the Accession countries. The value of life is estimated at 1 million €
and the severe accident at 250 000 €. Additional costs of slight injuries were estimated at 40 000 €
accident. The estimates and sensitivity analyses are shown in Table 5.2.

Grant No. 233919
32/81
Table 5.2. European level total accident costs resulting from extreme weather (€)
Transport mode Road*
2008
Rail
2009
IWT
2005
Marine/short-sea
2009-10
Baseline scenario
Percentage of accidents
resulting from extreme weather
10 5 10** 5
Fatalities 4 900 400 000 74 900 000 800 000 2 600 000
Other injuries 15 824 587 000 28 390 000 1 600 000 7 700 000
Total 20 724 987 000 103 290 000 2 400 000 10 300 000
Total European level estimate 20 840 977 000 €
Sensitivity analysis
Upper level estimate:
Percentage of accidents
resulting from extreme weather
15 7.5 15 7.5
Total 31 261 465 000 €
Lower level estimate:
Percentage of accidents
resulting from extreme weather
5 2.5 5 2.5
Total 10 472 133 000 €
*The number of fatalities and injured in the calculations excludes the Russian Federation
** Rounded figure (11%, Lammer, D. 2007. Machbarkeit eines Kollisionsvermeidungssystems in der Binnenschiff-fahrt. Fach-
Hochschule Wiener Neustadt. In German)
5.2. Time costs
5.2.1. Aviation
For aviation, the calculations were using specific data on the flights from major European airports. In
order to determine the time costs borne by society, we used the following calculation method:
1. In each of the climate zones major airports were selected, as defined by the number of
departures per year.
2. Based on the assumption that the amount of departures equals the amount of arrivals within
a time period of a year, total amount of movements per year per airport were determined.
3. Using analysis of the flight plan and the specific fleet mix at each airport offered by e.g.
Flightstats (Flightstats, Global Flight Status and Airport Information, 2012) the percentage of
heavy and medium jets is elaborated in a next step with the amount of light ones at major
airports being negligible.
4. Based on the fundamentals explained before, input data such as the average seating capacity
for heavy and medium jets, average seat load factors and the Value of time (VOT) on today’s
bases (2010) as well as in future (2040/2070) need to be determined. Relying on guidelines for
economic analyses given by EUROCONTROL (2009) and the Civil Aviation Safety Authority
(2010) the average seat capacity for heavy jets is assessed with 300 and 120 seats for medium
jets. Besides, average seat load factor is set with 75 % in medium jets and 80 % in heavy jets
preferentially used for long-haul flights.

Grant No. 233919
33/81
As for the next step, the average number of passengers in medium and heavy jets per year at the
selected airports is determined respectively.
The amount of the financial burden to the society due to different delay levels resulting from extreme
weather events are gained by sensitivity analyses. By changing the time cost factor, values for 15 min-
up to 60 min delays have been calculated. An overview of the total daily social costs at selected
airports for 2010 and for 2040 is given by following Figure 5.1 and Figure 5.2
Figure 1. Average total daily social costs at different delay levels due to extreme weather in 2010
scenario
Figure 5.2. Average total daily social costs at different delay levels due to extreme weather in 2040
scenario
0
10.000
20.000
30.000
40.000
50.000
60.000
70.000
80.000
90.000
15min - delay 30 min - delay 45 min - delay 60 min - delay
K€
London Amsterdam Zurich
0
20.000
40.000
60.000
80.000
100.000
120.000
15min - delay 30min - delay 45min - delay 60min - delay
K€
London Heathrow Amsterdam Zurich

Grant No. 233919
34/81
5.2.2. Road
An example of traffic volumes in the Helsinki metropolitan area can be used to illustrate the calculation
process. To begin with, the pattern of commuting travel is shown in Table 5.3 below. Using the
distribution below, it is possible to analyse the impact of extreme weather on trips, as long as there is
some estimate of the impact of weather on speed. It should be noted that the average length of a
commuting trip in the Helsinki area was 8.4 kilometres, however, in the calculations below we use the
more detailed travel pattern in order to take into consideration the time costs resulting from different
distances and average speeds.
Table 5.3. Travel pattern data of commuter trips in the Helsinki Metropolitan area
(Source: Finnish mobility statistics, 2001)
Trip length Share of trips % of total travel
0-2 km 20 % 2 %
2-5 km 20 % 8 %
5-20 km 56 % 67.5 %
20-50 km 3 % 10.5 %
50-100 km 0.5 % 5 %
100-150 km 0.5 % 7 %
Another factor which needs to be taken into consideration is the daily volume of trips that will enable the
calculation of total time costs according to travel patterns. According to Helsinki City travel survey, the
daily commuter volume is approximately 560 000 commuters. Using the data from Table 5.3 and
allowing for some variation in estimated speed of travel and impact of weather it is possible to construct
a table of impacts as shown in Table 5.4. The calculations were conducted as follows: For each trip
length an average was calculated. This average multiplied by amount trips gives the total kilometres for
each category. To be able to calculate the impact of reductions, the average speed for trips was
estimated. This is important, as the average speed enables to calculate some sensitivity analyses of
the actual impact of extreme weather. For shorter trips, average speeds were lower and for longer trips
higher, considering the utilisation of major roads network and taking into consideration the time spent
on commuting. It is evident that changing the travel speeds is another variable that can be used in the
sensitivity analysis.
Finally, three different alternatives for speed reduction were estimated: 20%, 30% and 40% reduction of
average speed. For instance, in the average speed of 80 kilometres per hour these would correspond
to speed of 64, 56 or 48 kilometres per hour driving speeds. They may seem low, but it needs to be
taken into consideration that factors such as poor visibility, collisions and insufficient equipment
(windshield wipers, poor tires etc.) can also contribute to the reduction in the speed.
The results from Helsinki MA commuting can be used to analyse the respective costs in other
European major cities, as classified in work package 3. The figures presented in Table 5.5 were
obtained by using the 2 – 4 euro/resident in Helsinki MA as an indicative figure of costs of delays per
resident in the major cities. As can be seen, on annual basis the costs of delays total a significant loss
in value of time. The figures exclude other cities in the regions, thus suggesting a lower boundary
estimate of the total costs.
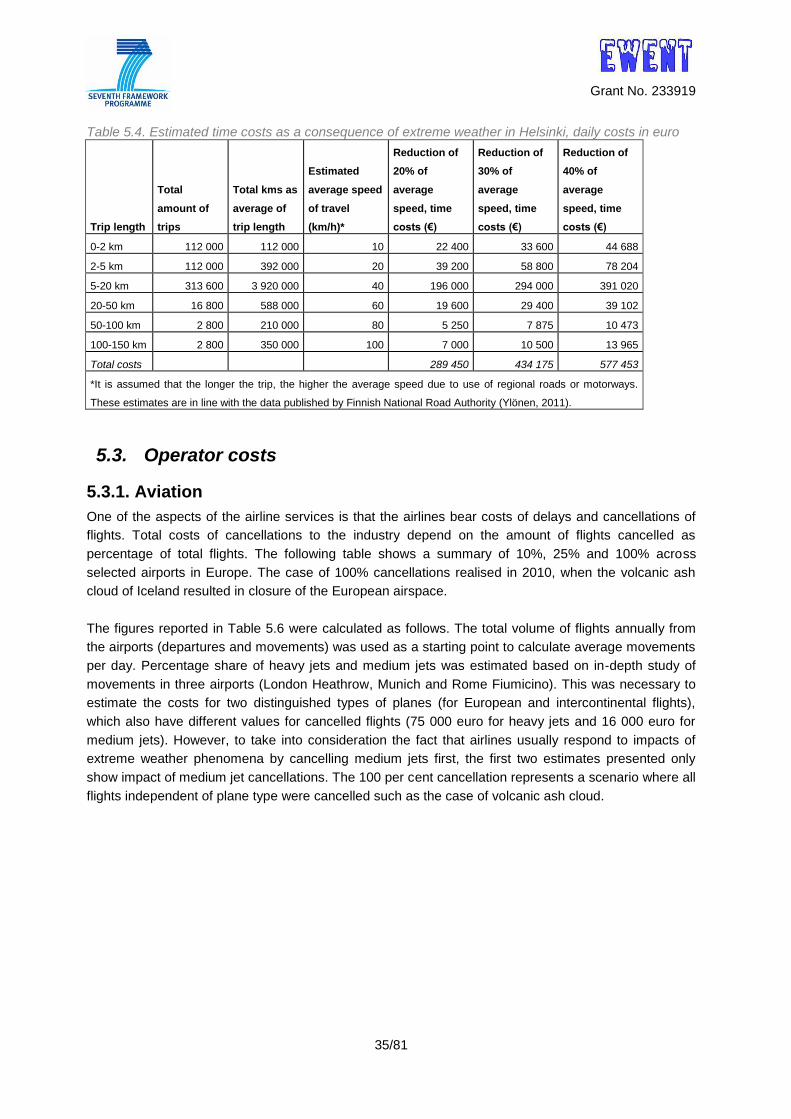
Grant No. 233919
35/81
Table 5.4. Estimated time costs as a consequence of extreme weather in Helsinki, daily costs in euro
Trip length
Total
amount of
trips
Total kms as
average of
trip length
Estimated
average speed
of travel
(km/h)*
Reduction of
20% of
average
speed, time
costs (€)
Reduction of
30% of
average
speed, time
costs (€)
Reduction of
40% of
average
speed, time
costs (€)
0-2 km 112 000 112 000 10 22 400 33 600 44 688
2-5 km 112 000 392 000 20 39 200 58 800 78 204
5-20 km 313 600 3 920 000 40 196 000 294 000 391 020
20-50 km 16 800 588 000 60 19 600 29 400 39 102
50-100 km 2 800 210 000 80 5 250 7 875 10 473
100-150 km 2 800 350 000 100 7 000 10 500 13 965
Total costs 289 450 434 175 577 453
*It is assumed that the longer the trip, the higher the average speed due to use of regional roads or motorways.
These estimates are in line with the data published by Finnish National Road Authority (Ylönen, 2011).
5.3. Operator costs
5.3.1. Aviation
One of the aspects of the airline services is that the airlines bear costs of delays and cancellations of
flights. Total costs of cancellations to the industry depend on the amount of flights cancelled as
percentage of total flights. The following table shows a summary of 10%, 25% and 100% across
selected airports in Europe. The case of 100% cancellations realised in 2010, when the volcanic ash
cloud of Iceland resulted in closure of the European airspace.
The figures reported in Table 5.6 were calculated as follows. The total volume of flights annually from
the airports (departures and movements) was used as a starting point to calculate average movements
per day. Percentage share of heavy jets and medium jets was estimated based on in-depth study of
movements in three airports (London Heathrow, Munich and Rome Fiumicino). This was necessary to
estimate the costs for two distinguished types of planes (for European and intercontinental flights),
which also have different values for cancelled flights (75 000 euro for heavy jets and 16 000 euro for
medium jets). However, to take into consideration the fact that airlines usually respond to impacts of
extreme weather phenomena by cancelling medium jets first, the first two estimates presented only
show impact of medium jet cancellations. The 100 per cent cancellation represents a scenario where all
flights independent of plane type were cancelled such as the case of volcanic ash cloud.

Grant No. 233919
36/81
Table 5.5. Estimated annual time costs of extreme weather borne by road commuter traffic in major
European cities
Major cities Population
Estimated costs, million € / year, ppp-adjusted
Scandinavian (North European)
SAINT PETERSBURG 4 661 219 9.3 – 18.6
STOCKHOLM 1 252 020 2.4 – 4.8
COPENHAGEN 1 189 231 2.8 – 5.5
HELSINKI MA 1 029 773 2.0 – 4.0
OSLO 907 288 2.2 - 4.3
Temperate (Eastern & Central)
BERLIN 3 440 441 5.8. – 11.7
PARIS 2 203 817 4.0 – 8.0
HAMBURG 1 773 218 3.0 – 6.0
WARSAW 1 711 466 1.7 – 3.5
COLOGNE 1 000 298 1.7 – 3.4
BUDAPEST 1 721 556 1.8 – 3.7
Alpine
VIENNA 1 712 903 3.0 – 6.0
MILAN 1 311 741 2.2 – 4.4
MUNICH 1 356 594 2.3 – 4.6
TURIN 909 960 1.5 – 3.1
Mediterranean
MADRID 3 255 944 5.1 – 10.2
ROME 2 756 502 4.6 – 9.3
BUCHAREST 1 944 367 1.9 – 3.7
BELGRAD 1 594 000 1.9 – 3.8
BARCELONA 1 621 537 2.6 – 5.1
Maritime (Oceanic)
LONDON 7 556 900 12.3 – 24.7
BIRMINGHAM 1 016 800 1.7 – 3.3
LEEDS 770 800 1.3 – 2.5
GLASGOW 581 900 0.9 – 1.9
SHEFFIELD 534 500 0.9 – 1.7
Total 23 108 343 67.7 – 135.8
The way the figures are presented reflects the actual number of bad weather days in 2008 at the
airports. The types of weather phenomena included in the analyses are fog, wind gusts and cold spells.
For each airport the most dominant extreme weather phenomena was chosen (to avoid possible of
double-counting days with more than one weather phenomena occurring). Thus, the figures below
represent the scenario for each airport of what would have been the total annual cost at these airports
at different cancellation rates given the number of days with bad weather. The final column shows an
estimate of the impact of one day closure of European airports.

Grant No. 233919
37/81
Table 5.6. Airline operator costs of cancelled flights
colours depict climate zones; red = Mediterranean, blue = Maritime, grey = Temperate Central, pale blue = Northern
What the results show is that cancellations of flights become a serious business factor for airlines. In
real life this has resulted in efforts to avoid cancellations and to shift the burden to passengers through
delayed flights. The fact that a one-day closure of airports can result in a significant 435 million euro
cost for the airlines in European level is a fact that cannot be overlooked, neither from the industry’s nor
the societal view. Prolonged closures can lead to a financial crisis amongst the viable operators, thus
leading to more future problems for the industry.
The figures above should be treated with caution as the true cancellation rate is not known and may not
be uniform across airports. However, what is clearly shown is that the relationship between extreme
weather and the resulting cancellation flights is a headache for the airline industry. Efforts to curb these
negative impacts are most likely needed and can result in new thinking on the design of new runways
and airport facilities.
5.3.2. Port operations
One of the sectors where weather can play a significant role in creating delays to operators is the
maritime transport. In order to assess the cost of delays/cancellations due to extreme weather on ports,
one must bear in mind that each port presents challenges and unique characteristics that make such a
calculation difficult. Indeed, a port is a hub of many activities and its economic revenue comes from
many different sources. It is safe to say that while the lion’s share of port revenue comes from shipment
handling (70-90%); even these operations alone are subject to many contributing factors.
There is no unified picture of ports since each is designed for a specific type of operation, be it a
loading/unloading procedure or the type of cargo handled. Considering the first factor, there are two
basic methods of loading and unloading cargo to vessels. They are lift on–lift off (Lo-Lo), which refers to
the loading and unloading method, employing either the vessel’s gear or quay-side cranes, and roll on–
roll off (Ro-Ro), which refers to the loading and unloading method conducted by horizontally moving
equipment. Vessels allowing this type of loading and unloading are equipped with a loading ramp that
permits the movement of cargo handling equipment and other vehicles (trucks, forklifts, straddle
carriers, tractors, etc.) between quay and vessel.
departures / year
(2008)
average movements /
day
10 % cancellation
(medium jets only)
25 % cancellation
(medium jets only)100 % cancellation
LONDON HEATHROW 239 280,00 1311,123288 10 132 360,77 25330901,92 314 708 922,74
MUNICH 214 675,00 1176,30137 117 743 061,92 294357654,8 1 657 361 578,08
ROME FIUMICINO 173 326,00 949,7315068 5592019,112 13980047,78 55920191,12
PARIS CHARLES DE GAULLE 279 988 1 534 14 139 010 35 347 526 182 812 987
FRANKFURT MAIN 242 693 1 330 6 127 832 15 319 580 133 088 852
AMSTERDAM SCHIPHOL 220 656 1 209 16 714 239 41 785 596 232 432 380
BRUSSELS NATIONAL 125 890 690 7 549 261 18 873 153 84 805 022
COPENHAGEN - KASTRUP 132 097 724 7 458 233 18 645 582 91 953 988
OSLO - GARDEMOEN 117 948 646 102 744 664 256 861 661 1 446 242 830
STOCKHOLM - ARLANDA 111 524 611 97 148 709 242 871 773 1 367 473 678
HELSINKI - VANTAA 92 651 508 80 708 413 201 771 033 1 136 058 640
SAINT PETERSBURG 63 402 347 55 229 569 138 073 923 777 416 217
VIENNA SCHWECHAT 144 803 793 8 409 206 21 023 015 109 799 553
ZURICH 131 499 721 5 727 448 14 318 620 80 620 055
MILAN MALPENSA 109 070 598 7 917 586 19 793 964 92 084 962
MADRID BARAJAS 234 889 1 287 11 861 573 29 653 932 153 366 429
BARCELONA 160 743 881 4 667 448 11 668 621 46 674 482
ISTANBUL - ATATURK 129 972 712 4 193 288 10 483 221 41 932 884
ATHENS E. VENIZELOS 96 708 530 3 120 092 7 800 229 31 200 915
LONDON GATWICK 132 048 724 1 917 120 4 792 800 26 985 546
DUBLIN 104 106 570 15 114 480 37 786 200 212 752 733
MANCHESTER 101 412 556 22 085 033 55 212 583 310 870 845
606 300 646 1 515 751 614 8 586 563 692

Grant No. 233919
38/81
A second factor that makes such a calculation difficult is the type of cargo: passengers, dry bulk, liquid
bulk, containers, etc. At cargo ports, the type and packaging of cargo products determine the manner of
loading and unloading as well as the type of other operations involved.
Of course, the most important aspect in order to evaluate the cost of extreme weather in
loading/unloading cargo is to define exactly how weather affects the whole procedure of loading and
unloading. This depends mainly on the type of cargo and ship. It is a very broad subject; however given
the rise of container shipping one should definitely look into container transport. Despite the fact that
maritime shipping is dominated by bulk cargo, which roughly accounted for 69.6% of all the ton-miles
shipped in 2005, the share of break-bulk cargo is increasing steadily, mainly because of
containerization. As of 2009 approximately 90% of non-bulk cargo worldwide is moved by containers
stacked on transport ships. Between 1990 and 2008, container traffic has grown from 28.7 million TEU
to 152.0 million TEU, an increase of about 430%. This corresponds to an average annual compound
growth of 9.5%. During the same period, container throughput went from 88 million to 530 million TEU,
an increase of 500%, equivalent to an average annual compound growth of 10.5%. In 2009, almost one
quarter of the world's dry cargo was shipped by container, an estimated 125 million TEU or 1.19 billion
metric tons worth of cargo (Rodrigue et al., 2009)
In general, containers are considered both as means of transport as well as storage units, a great
advantage over bulk cargo which is more exposed to the elements. In spite of that, containers remain
somewhat susceptible to weather elements: Rain in the long term will rust a container, reducing its
durability, exposure to heat will affect both a refrigerated container and a regular one because will
produce humidity if the containerization process was not made according to standard procedure.
However, the most important aspect one must examine considering extreme weather events and port
productivity remains the human factor. Human operators pervade all aspects of cargo processing within
a port and Health and safety procedures and regulations are meant to be enforced and followed in
order to allow the maximum port performance with the minimum risk involved. Each country and port
has its own set of regulations depending on the type of the port, the prevailing weather conditions,
special geographical characteristics, etc.
5.4. Infrastructure costs
The first notion on defining the cost items of infrastructure costs is that despite the fact they are well
known, quantifying them in euros is very difficult. This is because these cost items consist of various
inputs in terms of labour and materials. As the market for service provision in the infrastructure sector
has become more open for competition over the past decades, it has led to less transparency regarding
the actual costs of service provision. Simple questions such as how much 100 meters of tarmac would
cost or what is the average amount needed to repair a bridge are not so easy to answer. The industry
does not have average rates for such services, even when considered as routine work.
In road transport, there are several parts of the infrastructure that can become subject to repairs and
maintenance as a consequence of the extreme weather. Below is a short summary of the expected
repairs and maintenance needs and from which phenomena they result from:
foundations: low temperature, flooding
pavements: low temperature, flooding, mudslides, heavy rain
surface (tarmac): low temperature, high temperature, mudslides
physical obstacles to be removed: flooding, blizzards, mudslides, heavy rain.

Grant No. 233919
39/81
In the WEATHER project (Enei et al., 2011, Doll and Sieber, 2011), analyses of the costs to
infrastructure were provided. Next section begins with an overview of the work done in WEATHER
project and presents some additional information regarding the infrastructure costs.
Table 5.7. Costs of extreme weather to infrastructure by phenomena and transport mode at the
European level, euro million
(Source: Enei et al., 2011)
Extreme weather event Mode Infrastructure assets Infrastructure operations
Storm Road 76.10 22.60
Rail 0.07
Maritime - -
Air - -
Severe winter Road 248.80 126.30
Rail 0.04
Flood Road 630.10 21.90
Rail 103.66

Grant No. 233919
40/81
6. Risk panorama for Europe
6.1. The risk assessment method
The goal of the EWENT project was to estimate and monetise the disruptive effects of extreme weather
events on the operation and performance of the EU transport system. The methodological approach is
based on the generic risk management standard (IEC 60300-3-9) and starts with the identification of
hazardous extreme weather phenomena, followed by an impact assessment and concluded by
mitigation and risk control measures. Information from EWENT’s former analysis of e.g. risk
identification and estimation has been refined into a risk panorama, providing a general picture of the
risk situation in different parts of Europe.
The risk assessment is based on the definition of transport systems’ vulnerability to extreme weather
events in different countries and on calculations of the most probable event chains, starting from
adverse weather phenomena and ending with events that are harmful to the transport network in
different climate regions. The probabilistic section is the hazard analysis. The vulnerability of a
particular mode in a particular country is a function of exposure (indicated by transport or freight
volumes and population density), susceptibility (infrastructure quality index, indicating overall resilience)
and coping capacity (measured by GDP per capita, purchasing power adjusted). Hence, we defined
the extreme weather risk as a product of probability of negative consequences and vulnerability
assessment:
Risk
= hazard × vulnerability
= P(negative consequences) × f(exposure, susceptibility, coping capacity)
Based on this analytical approach information, the risk indicators for each mode and country have been
derived. Due to the techniques used in calculations, the risk indicator is by definition a relative indicator,
and must not be considered as an absolute measure. It is a very robust ranking system, first and
foremost.
The risk panorama applies the division of climate regions in Europe based on the occurrence of
adverse weather phenomena of WP2:
- Northern European (sub-arctic) region
- Maritime (oceanic) region
- Mediterranean region
- Temperate Central European region
- Temperate Eastern European region
- Mountainous (Alpine) region
The following chapters discuss, separately, these climate regions and extreme weather-related risks for
transport in these areas. More detailed information, and explanations and meteorological descriptions
can be found in the project Deliverable D 5.1 Risk panorama – Extreme weather hazards and
vulnerability of European transport network. The deliverable is freely downloadable at
http://ewent.vtt.fi/..

Grant No. 233919
41/81
6.2. Northern European (sub-arctic) region
Figure 6.1. Northern European climate region – risk indicators for road and rail systems
Road transport
In road transport, the Scandinavian area roads are among the most troubled in Europe. As the region
also has a versatile landscape and climate ranging from southern parts where slippery conditions are
common to coastal areas with strong winds and northern parts with extreme cold and heavy snowfalls.
The most likely series of events to harm road transport in Scandinavia starts when the weather
temperature drops below -7°C. This makes the roads slippery, which causes accidents, traffic jams,
and undesirable effects on traffic interoperability. The other significant event chain starts with heavy
wind gusts, which can take down trees in this forestry region onto roads causing accidents, delays and
increased maintenance costs.
The total number of road fatalities in the region was 1,514 in 2008, resulting in losses of 279 million
euros in social costs. Serious and minor injuries result in additional personal damages that can be up to
three times the value of the fatalities. Extreme weather easily results in a large number of accidents
over a short period of time. For instance, heavy snowfall over a couple of hours can result in hundreds
of accidents.
The greater the volumes of road users, the more probable are the extreme weather-related delays. In
the Scandinavian area, this means that the most significant impacts will be observed in the urban
context where the volumes of road users are large. However, the risk indicator for road transport in the
Northern European area is not high compared with the overall risk indicator for the whole EU-27. This is

Grant No. 233919
42/81
simply due to the sparsely populated areas and less dense transport. The quality index of the road
infrastructure is also the highest in Europe making it more resilient to extreme weather impacts.
Rail transport
For rail, the major impacts seem to result from strong winds, blizzards and cold temperatures. Wind
gusts over 17 m/s take down trees onto tracks and cause delays. Unexpectedly, heat waves also cause
damage when the temperature rises above +25°C. In fact, high temperatures are also supposed to
increase risks of working accidents and safety. Any incidents on rails will most likely cause delays and
cancellations of service. The impacts of wintry circumstances can be severe, as the network suffers
various impacts that require maintenance, at times in areas where maintenance is difficult. Prolonged
or combined impacts cause more severe consequences overall.
The risk indicator for rail transport in the Northern European area is not high compared with the
average risk indicator in Europe. Congruent with road transport, this is due to the sparsely populated
areas and less dense transport volumes.
Short sea shipping
This region is by far the most prone to icy conditions. Cold waves, snow, blizzards, low temperatures,
hail and ice are another set of weather conditions affecting ships, especially in the Baltic Sea and the
Gulf of Finland. The extent of the ice varies from year to year. Heavy ice means that many ships need
icebreakers to free them after they have become stranded by ice.
Accidents are regular in the Baltic due to the huge volumes of vessel traffic between busy ports, a
situation further aggravated by weather conditions. The total number of vessels involved in accidents in
the region in 2010 was up almost 19% on 2009. In the Baltic Sea, during severe or extremely severe
sea ice in winter a number of “small accidents” may take place as the routes through the ice are
narrow. The Baltic Sea vessel accident represented almost 14% of the EU total. The risk for accidents
increases when ships operate in relatively confined waters, such as around parts of eastern Denmark,
or in bad weather and/or without a pilot.

Grant No. 233919
43/81
Figure 6.2. Norhern European climate region – risk indicators for short sea / ports
6.3. Temperate Central European region
Road transport
In the Temperate Central Region, the freight corridors are sensitive to disruptions due to the high
volume of traffic. Reduced visibility because of fog, snow or heavy precipitation can lead to accidents.
Heavy wind gusts can take down trees and block roads temporarily and even higher winds may cause
closure of bridges. Heavy precipitation causes flooding and landslides, reducing the traffic flow and
increasing the number of accidents. The most likely series of events starts when the weather
temperature drops below -0°C. This makes the roads slippery and causes accidents, traffic jams and
undesirable effects on traffic interoperability.
High temperatures foster fatigue of drivers and can increase the number of accidents, which in turn
causes congestions and long travel times. Damage to pavements and constructions (e.g. bridges) can
lead to long-term problems, as the capacity of detours is often limited or the rerouting may be much
longer than the original route.
In cities, bad weather can result in a complete breakdown of the whole transport network during rush
hours. Luckily, there are fewer fatalities in cities as the speed is lower than on transit or intercity routes.
The extreme weather resulted fatality costs in the Temperate Central Region are 300 million euros per
year. With other accidents added, it totals approximately 1.2 billion euros. The figure is low compared
with other regions with equally large volumes of traffic, but this is explained by the relatively small
impact of extreme weather.

Grant No. 233919
44/81
Figure 6.3. Temperate Central European climate region – risk indicators for road and rail systems
The risk indicator for road transport in this region is high. This indicates that dense populations and
traffic volumes expose for risk. In some countries, such as in Poland, this exposure combined with
relatively poor infrastructure quality increases the risk levels extremely high. In the Slovak Republic and
Slovenia, the risk indicator is at the same level as in Germany – the latter has heavy transport volume
whereas the formers have low GDP/capita (coping capacity) and low quality of the road infrastructure.
The most vulnerable areas are in the Czech Republic and Poland due to high population and traffic
densities, together with low quality infrastructure and low GDP/capita. All different risk aspects
materialise in these countries simultaneously.
Rail transport
The primary weather events affecting rail transport are snowfall, low temperature and heavy
precipitation, which lead to delays in freight and passenger transport. Freight transport is affected on
long-haul routes, and passenger transport is affected in the commuter rail systems. Snowfall and low
temperatures can freeze switches, leading to blockages of tracks and delays. The most likely series of
events to harm rail transport originates from heavy wind gusts and heat waves. Wind gusts together
with lightning and thunderstorms take down trees onto tracks and damage wire grids, and control
systems, yielding to accidents, delays and maintenance costs. Heavy rain has a great probability of
damaging railway embankments. Heat waves may also have occupational consequences on top of rail
buckling.
Austria and Denmark produce the base level benchmark for the risk indicator in the case when the
population and traffic densities are low and the infrastructure quality level and GDP/capita are high.

Grant No. 233919
45/81
Germany and the Czech Republic represent a situation in which either the population or the traffic
density are high and the infrastructure quality is high or the population and traffic density are low and
the quality of infrastructure is also low. The highest risk indicator is in Poland where all the vulnerability
factors increase the risk.
Aviation
The aviation system is in general highly sensitive to wind gusts, snowfalls and cold waves. Compared
with other modes of transport, even slight disruptions to flight plans at airports, which are at capacity
limit, can lead to massive disruptions throughout Europe. The time delay risk and inefficient capacity
are the main issues to be considered.
The most likely series of events to harm aviation in this region takes place when wind gusts over 17 m/s
blow over the area. Fog and cold waves, and even 1cm/day snow, are considered prevailing weather
events combined with the high volume of passengers in the area. The effects on delays can be
massive. Due to the high safety standards and professional staff, the number of accidents is negligible
within Europe. Extreme snowfalls combined with non-existing extra capacity of runways will have a
quick and serious impact.
In the future, the probabilities of cold waves and snowfalls are expected to decrease whereas heat
waves are expected to increase. The risk indicator for accidents due to extreme weather is calculated
to be zero. The highest risk indicator is in Poland where high population and transport densities
together with low GDP per capita and low quality of infrastructure produce a high risk level. However,
the risk level in aviation is significantly lower than in railway or road transport.
Inland Waterways
This region contains important waterways of Europe such as major parts of the Rhine-Main-Danube
axis, the German waterways (e.g. Moselle, Neckar, Elbe) and canals, and the Odra on the German-
Polish border as well as the Sava and Tisza joining the Danube in Serbia. Parts of the Upper Rhine and
the German and Austrian Danube in this climatic region also coincide with the Mountainous region. An
inland waterway to be mentioned further is the Vistula in Poland which runs through the cities Kraków
and Warszawa and ends in Gdansk at the Baltic Sea.
The most important extreme weather events affecting inland waterway transport are high water and
floods due to heavy precipitation, and ice occurrence due to temperatures below zero degrees, as well
as low water due to drought and heat. Of less importance is the occurrence of wind gusts and reduced
visibility. The impact of extreme weather events on inland waterway transport is dependent on the
different regions and local hydrological conditions under consideration.
Navigation on the Moselle, the Saar, and the Neckar, as well as on the German Danube and the
Danube from the Austrian-Hungarian border till the Iron Gates is susceptible to the occurrence of high
waters. For example, on the Neckar, suspension of navigation due to high water may exceed 30 days a
year in severe cases. Navigation on the Middle Rhine and the Main-Danube Canal is not susceptible to
the occurrence of high waters.
Ice occurrence leading to the suspension of navigation is possible on almost the whole Danube, even
on the lower part of it. Very high susceptibility of navigation with respect to ice occurrence is present on
the Main-Danube Canal, where navigation may be suspended by more than 40 days a year in severe
cases. In the Rhine area navigation is not affected by ice occurrence.

Grant No. 233919
46/81
The occurrence of drought in association with heat waves can affect transport on the Rhine through
restricted water depths. Other critical waterway sections with respect to low water occurrence and
relevance to the cargo-carrying capacity of vessels are the stretch between Straubing and Vilshofen on
the German Danube, the free-flowing sections in the Wachau and between Vienna and Bratislava on
the Austrian Danube, and the free-flowing sections between Gabcikovo and Budapest as well as
Budapest and Mohács on the Hungarian Danube.
Figure 6.4. Temperate Central European climate region – risk indicators for aviation and inland
waterways systems
The highest risk indicators for inland waterway transport are in Poland and the Slovak Republic. This is
due to the high population density, low coping capacity and low quality index of infrastructure. It is
notable that the risk of accidents in each country is very low compared with the risk indicator of delays
and infrastructure maintenance costs.
Short sea shipping
Wind and waves, fog, rain and low temperatures are considered the prevailing weather events in the
region, and these phenomena can threaten both the operations and the infrastructure. The most likely
series of events to harm short sea shipping takes place when the wind gusts exceed 17 m/s. This
causes accidents and damage to vessels, cargo and humans. The other significant event chain
happens when the temperature falls below -0°C. This affects navigation and causes accidents and
delays. Cold weather may increase occupational accidents due to slipperiness of surfaces.

Grant No. 233919
47/81
The highest number of accidents occurs in the region’s main bottle-necks, where large numbers of
vessels are regularly brought together with little room to manoeuvre and different types of obstructions
to navigate through and around. Such areas are found around the biggest ports in Germany and
Denmark (Hamburg etc.) and in the Kiel Canal.
The risk indicator is again highest in Poland due to the high density of population and transport, the low
level of the infrastructure quality indicator and the low coping capacity. With regard to short sea
shipping, the risk indicator for accidents is low in each of the region’s countries.
6.4. Temperate Eastern European region
Figure 6.5. Temperate Eastern European climate region – risk indicators for road and rail systems
Road transport
In the Temperate Eastern Region, the freight corridors face a very high volume of traffic and are
therefore sensitive to disruptions.
The most likely series of events to harm short road transport in Temperate Eastern Europe occur when
the temperature falls below -0°C and snow and cold generate slippery roads. Heavy wind may take
down trees onto roads or close bridges, causing delays, especially for road transport. Heavy rain has
the same effects due to floods and mudslides covering or washing away parts of the infrastructure.
This region is prone to both heat waves and cold waves. High temperatures foster fatigue of drivers and
can increase accident risk. Extreme cold, in turn, reduces the use of cars and trucks. In urban transport,
bad weather can result in a total breakdown of the whole road transport network.

Grant No. 233919
48/81
The estimated weather related cost of fatalities in this climate region is 860 million euros annually, with
over 2.5 billion euros in other injury costs.
Rail transport
The main weather events affecting railway transport are snowfall, low and high temperatures and heavy
precipitation. Extreme weather events lead to delays in freight as well as in passenger transport.
Heat waves are most likely to have health-related consequences to the work force and maintenance
costs due to rail truck buckling and thermal extension. In the case of low temperatures, switches may
freeze leading to, e.g., blockages of tracks, slower speeds and delays. Wind gusts also take down trees
onto trails, which causes delays, and heavy precipitation can damage railway embankments and cause
delays as well as increased repair and maintenance costs.
The risk indicator for road and railway transport is highest in countries with high population and traffic
densities such as Poland and Romania. The infrastructure quality indicator is also low in the Baltic area
as the scarce population and low traffic density keep the risk indicator down.
Figure 6.6. Temperate Eastern European climate region – risk indicators for aviation, inland waterways,
and short sea / ports systems
Aviation
In the Eastern Temperate Region, the weather phenomena that are most likely to disturb aviation seem
to be snowfalls and cold waves when the temperature drops below -0°C. Due to these phenomena,

Grant No. 233919
49/81
there are operating restrictions that lead to delays and increased fuel consumption because of airborne
holding for arriving aircraft. Delays for flight cancellations are also possible.
There are no major hub airports in this region, however, but there are still important ones like Moscow
Scheremetjewo and Moscow Domodedowo.
The risk indicator is highest in countries in which the population and traffic densities are high and the
coping capacity and infrastructure quality indicator are low. As shown in the figure, the risk indicator for
accidents is zero. This was confirmed by calculations, which were performed by taking into account the
accident rates during the past few years.
Inland waterways
The most important waterway is the Lower Danube, extending from the Iron Gates to the Black Sea. It
is vulnerable to high waters and flooding. Ice occurrence due to cold waves may lead to the suspension
of navigation as well as accidents and damage of vessels and installations. As the number of hot days
is expected to increase, leading to higher evapotranspiration in the summer, the low water situation
may become more severe there in the future.
Between the Serbian-Romanian-Bulgarian border and Braila, there are several critical stretches with
respect to low water occurrence.
The risk indicator is highest in Poland and Romania where the traffic and population density are highest
and the coping capacity and quality of infrastructure are low. The high risk indicator for maintenance
costs is due to cold waves that cause accidents.
6.5. Oceanic region
Road transport
The most likely series of events to harm road transport in the Oceanic Region starts when the weather
temperature drops below -0°C or in heavy wind. Cold makes the roads slippery, which causes
accidents, traffic jams and undesirable effects on traffic interoperability. Preparedness of the transport
system to tackle the impacts of cold spells and snow is lower than in, e.g., the Northern Europe Region.
Wind gusts take down trees onto roads and block them temporarily. Heavy wind gusts can also close
bridges to traffic. High temperatures foster fatigue of drivers and can therefore also lead to an increase
in the number of accidents.
The fatality costs of accidents related to extreme weather are 1.5 billion euros annually, resulting from a
large volume of traffic and population.
Rail transport
With regard to rail transport, the primary concerns in terms of weather events are snowfall, low
temperature and heavy precipitation. Obstacles across railway lines, flooding, etc. generate the biggest
impact. In some cases, cold spells can also impact equipment and thus lead to accidents and delays.
These extreme weather events lead to delays in freight as well as passenger transport. Freight
transport is primarily affected on long-haul routes and passenger transport mainly in the commuting
transport. The most likely weather phenomena to cause disturbances in railway transport are heat
waves and heavy wind. Wind gusts take down trees onto rails and cause delays. Heat waves, for one,
cause rail track buckling, which adds to the maintenance costs and health impacts and even on rail
safety.

Grant No. 233919
50/81
The risk indicators for road and rail transport are also at a moderate level in the Oceanic Region. Even
if the population and traffic densities are high, increasing the risk, the level of infrastructure quality and
the coping capacity are also high, decreasing it. The figure also shows that all the affecting event
chains may inflict accidents and delays or increase maintenance costs. The higher risk indicator in the
UK indicates that the transport density is higher and the quality index of the rail infrastructure a slightly
below the average for this region.
Figure 6.7. Oceanic climate region – risk indicators for road and rail systems
Short sea shipping
Storms are the primary concern in this area, and there is considerable inter-annual and inter-decadal
difference in storm activity, which has increased in the North Atlantic since the 70s. Fog, snow and rain
are also disruptive phenomena for short sea shipping within this region. The northern part of the
coastline of the region is particularly intricate and this, combined with the northern Atlantic Ocean
weather systems and high density of shipping operating between the Atlantic Ocean and northern EU
ports, increases the risk of accidents.
An increase in storm duration and/or frequency may lead to port problems ranging from decreased
regularity to increased downtime and a requirement for more storage capacity for use in times of
closure. It could also lead to permanent loss of sand offshore as well as degradation of structures,
changes in depth and under-water landscape, and added cost of dredging. An increase in heavy rain
and fog in the area can affect visibility leading to slower speeds and disruption of operations. The
English Channel consistently sees the biggest concentrations of accidents, mainly as a result of the
combination of heavy traffic and weather conditions.

Grant No. 233919
51/81
Even if the seasonal storms hit this region, the area seems relatively well prepared for these
phenomena. The high coping capacity and high level of the infrastructure indicator of sea ports
decrease the risk indicator, although the amount of transport is high as is the population density in the
region. However, there is a small risk for delays, maintenance costs and even accidents.
Figure 6.8. Oceanic climate region – risk indicators for aviation, inland waterways, and short sea / ports
systems
Aviation
In the oceanic Region, the most likely weather events to disrupt the performance of the aviation system
on the ground as well as in the air seem to be blizzards, extreme cold spells, and heavy snowfalls and
wind gusts over the British Isles.
As a consequence, there are various aftermaths resulting from these weather phenomena, such as
delays due to de-icing processes, increased fuel consumption because of airborne holding for arriving
aircraft and even cancellations due to long delays and disruptions to flight plans.
These consequences may be even more severe in this region as the traffic volume is estimated to be
much higher compared with other regions such as the Oceanic Region, which includes Europe’s major
hub airports such as London Heathrow, Paris Charles de Gaulle and Amsterdam.

Grant No. 233919
52/81
The analysis indicates that the highest risk for aviation is in the United Kingdom and Luxembourg,
which both have high population densities and transport volumes. In the UK, the coping capacity is
lower than in Luxembourg, increasing the risk.
6.6. Mediterranean region
Figure 6.9. Mediterranean climate region – risk indicators for road and rail systems
Road transport
Road transport in this area is mostly affected by heavy precipitation and heat waves. Heavy rain can
lead to floods and landslides, inducing slower driving speeds and changes in accessibility and mobility.
High temperatures can increase accident rates, and delays and diversions. Increased accident rates
are linked to impacts of heat on road users, the pavements and asphalt. Delays are a result of
restrictions in road maintenance and construction. Diversions are also linked to maintenance and
construction and result in delays due to increases in travel time and possible congestion impacts.
The highest risk indicator is in Italy due to its high population density and high volumes of road
transport. As the most recurrent extreme phenomenon is heat waves, which mostly impact the fluency
of traffic and the maintenance costs, the risk indicator for accidents is low.
Rail transport
The most recurrent phenomena affecting rail transport in this region are wind gusts and heat waves.
Wind gusts together with thunderstorms pose threats through lightning and power cuts for railways.
Excessive heat results in buckling and heat exhaustion of the rail track as well as increased

Grant No. 233919
53/81
maintenance costs. Heavy precipitation can lead to landslides, and floods are also significant
phenomena.
In weather-related accidents and incidents, the most common type of consequence is derailment (about
75%), most often associated with heat but also with rainfall, snow or ice. This may also incur higher
maintenance costs.
The risk indicator is highest in Italy where the population and traffic densities are high. Compared with
the Temperate Central or the Northern European Region, the lower quality of infrastructure and lower
coping capacity explain the relatively high risk indicators.
Figure 6.10. Mediterranean climate region – risk indicators for aviation and short sea / ports systems
Short sea shipping
Wind, waves and rain are the most common extreme weather phenomena associated with short sea
shipping; however dust storms and heat waves may prove to have a much more significant effect in the
future.
The Mediterranean Sea includes three major bottlenecks (Gibraltar, the Suez Canal and the Bosporus)
and has a very heavy tourist load. High traffic density areas exist, particularly in and around tourist
areas. The through traffic is also heavy, with the largest volume using the main east-west lanes
between the Indian and Atlantic Oceans.

Grant No. 233919
54/81
Despite the mild climate, the Mediterranean, along with the Black Sea, has had the second highest EU
maritime accident figures: over 22% of the EU accident total of 2010 (up from 18% in 2009 and 17% in
2008). Geography has a significant impact on accidents. The Aegean Sea has the highest accident
concentrations, mainly because of the significant volume of traffic to and from the islands, between the
islands, and between the Mediterranean Sea and the Black Sea. However, it should be noted that the
number of accidents reported in and around the Greek waters decreased substantially in 2010 (down
24% from 2009 and 45% from 2008) and was the lowest reported in the last four years.
The most recurrent event chain due to extreme weather phenomena starts from the heat waves when
the temperature stays over 32 degrees celcius (daily average) for a long time. It mostly harms cargo
and staff and, due to reduced vitality, occupational accidents are also more likely.
No risk indicator is calculated for accidents or delays. This is due to the most probable event chains
studied, which did not give any signals of the impacts on delays or accidents. As seen, the risk indicator
is high in the areas in which there is dense population and high numbers of passengers, such as
Greece, Italy, Malta and Portugal.
6.7. Mountainous regions
Figure 6.11. Mountainous climate regions – risk indicators for road and rail systems
Road transport
Road transport in the Mountainous Region is vulnerable to flooding, snowfall, avalanches, land and
rock slides as well as strong winds, which all cause accidents and delay travel. The most likely series of
events to harm road transport in the Mountainous Region starts when the weather temperature drops
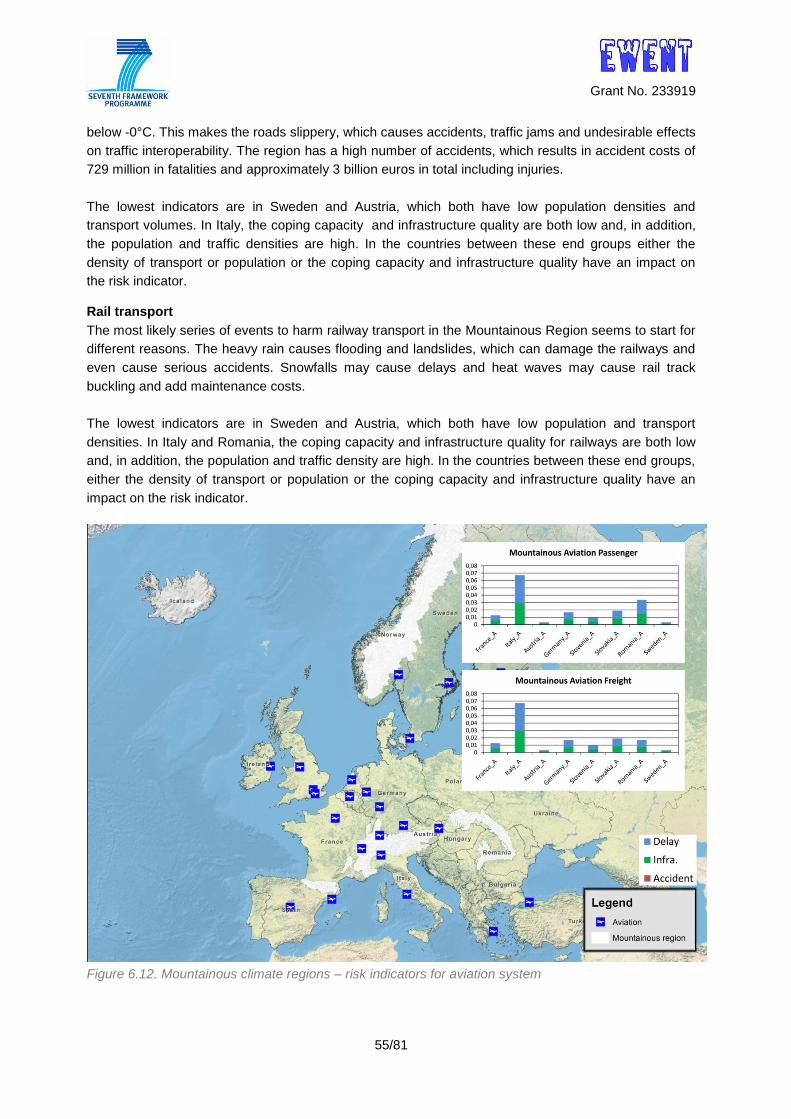
Grant No. 233919
55/81
below -0°C. This makes the roads slippery, which causes accidents, traffic jams and undesirable effects
on traffic interoperability. The region has a high number of accidents, which results in accident costs of
729 million in fatalities and approximately 3 billion euros in total including injuries.
The lowest indicators are in Sweden and Austria, which both have low population densities and
transport volumes. In Italy, the coping capacity and infrastructure quality are both low and, in addition,
the population and traffic densities are high. In the countries between these end groups either the
density of transport or population or the coping capacity and infrastructure quality have an impact on
the risk indicator. Rail transport
The most likely series of events to harm railway transport in the Mountainous Region seems to start for
different reasons. The heavy rain causes flooding and landslides, which can damage the railways and
even cause serious accidents. Snowfalls may cause delays and heat waves may cause rail track
buckling and add maintenance costs.
The lowest indicators are in Sweden and Austria, which both have low population and transport
densities. In Italy and Romania, the coping capacity and infrastructure quality for railways are both low
and, in addition, the population and traffic density are high. In the countries between these end groups,
either the density of transport or population or the coping capacity and infrastructure quality have an
impact on the risk indicator.
Figure 6.12. Mountainous climate regions – risk indicators for aviation system

Grant No. 233919
56/81
Aviation
Aviation is sensitive to extreme weather events such as wind gusts, snowfalls and cold waves. The
most likely series of events to harm aviation in the Mountainous Region seems to start from snowfalls
or wind gusts. Both cause delays to operations and, in addition, snowfalls add maintenance costs.
These extreme weather events have significant influence on the performance at airports such as Zurich
and Munich. In consequence, delays and cancellations may increase, i.e. the time costs for this region
are high.
The lowest risk indicators for aviation are in Sweden and Austria, which both have low population
densities and transport volumes. In Italy and Romania, the coping capacity and infrastructure quality for
railways are both low and, in addition, the population and traffic density are high. In the countries
between these end groups, either the density of transport or population or the coping capacity and
infrastructure quality have an impact on the risk indicator.
6.8. Risk indicators per country and transport mode
In this last chapter, the relative, specific transport mode risk indicators are presented for different
European countries. This gives an outlook on the risk situation in different parts of Europe. As
mentioned earlier, the factors that affect these indicators are
probability of the most recurrent extreme weather events (hazard indicator)
quality of infrastructure
traffic density
population density
coping capacity (gross domestic product per capita, adjusted for purchasing power)
On the basis of these factors the good quality of infrastructure and high GDP per capita reduce the risk
indicator, while high probability of extreme events, dense population and high amount of transport
increase the risk indicator.
In the following figures, all the countries are arranged into their climate regions and some are even
divided into two parts as they belong to two different areas. The first countries from Cyprus (CY) to
Spain (ES) belong to the Mediterranean area; from Belgium (BE) to Spain (ES_O) to the Oceanic
Region; from Austria (AT_Tc) to Belgium (BG)) to the Temperate Central Region; from Estonia (EE) to
Romania (RO_Te) to the Temperate Eastern Region; from France (FR_A) to Sweden (SW_A) to the
Mountainous Region and finally from Denmark (DK_NE) to Sweden (SE) to the Northern European
Region (Nordic). These risk indicators are given separately for each traffic mode and they describe the
risk for delays in transportation. More results can be found in the original deliverable mentioned in
Deliverable 5.1 (Molarius et al. 2012).

Grant No. 233919
57/81
Figure 6.13. Delay risk indicators for road system
Figure 6.14. Delay risk indicators for rail system

Grant No. 233919
58/81
Figure 6.15. Delay risk indicators for short sea / ports operations
Figure 6.16. Delay risk indicators for aviation system
Figure 6.17. Delay risk indicators for inland waterways system

Grant No. 233919
59/81
7. Adaptation and mitigation strategies
7.1. Objectives
This Chapter summarises the work done in EWENT Work Package 6 - Mitigation and adaptation
strategies: Adaptation policy and opportunities to avoid negative effects. The analysis and conclusions
have been based on the results of the five previous EWENT Work Packages. The objective of Work
Package 6 was to evaluate measures and options for negative impact reduction, control and monitoring
in short and long-term, identifying and innovating the potential of different measures and strategies of
adaptation and mitigation. The implementation tools can be generally grouped into better services for
transport users and managers, improved infrastructure and transport technology, and legal or policy
measures. The efficiency, applicability and finance needs need to be assessed in order to find the most
cost-effective adaptation and mitigation measures. Finally, up-coming research needs were considered
for transport system maintenance strategies, infrastructure planning and construction, transportation
technologies and policy oriented research.
7.2. Identified policies and strategies
The potential strategies in mitigating extreme weather risks rise from three contexts: European Union’s
strategies and policies (e.g. the White Paper on Climate Change), Member States’ strategies and
policies, and finally mode-specific strategies and policies mainly drafted by international umbrella
organisations and bodies acting with one single transport mode.
The policy relevant criteria for strategies were defined first. For any public policy measure the primary
criteria are effectiveness and efficiency. Effectiveness means that a substantial contribution to the
intended change is achieved within a reasonable time span. Efficient means that the required resources
and efforts are low or moderate as compared to the benefits generated (including avoided costs). If
measures are not particularly effective, they are mostly not efficient either, unless they are very cheap.
For simple measures a straightforward cost-benefit analysis can be carried out. For large measures,
which usually entail side effects and interact with many groups, cost-benefit analysis can get rather
tricky. It will usually entail consideration of trade-offs, equity effects, external effects, choice of the
discount rate, and distinction between direct costs and benefits and eventual induced social-economic
effects. Also distinctions between regional, national and international effects as well as transfers
between sectors are often important.
With the introduction of various notions of ‘fairness’ and implications of uncertainty acceptability
becomes a central criterion in public project evaluation, which often even raises the willingness to relax
efficiency and effectiveness targets so as to get measures at least implemented. In fact acceptability is
an overarching feature including various qualities of a considered policy, as is summarized in figure 7.1.
If initially effectiveness and efficiency seem satisfying other aspects get important. In order to arrive at
compromises for the other aspects, such administrative burden, side-effects (i.e. spill over effects for
other parties or the environment), and international regulations – while not watering down effectiveness
and efficiency too much – the whole decision process may run through several cycles.

Grant No. 233919
60/81
Figure 7.1 The interactive and overarching position of acceptability (source: Nissinen et al 2012)
The design and implementation of appropriate transport policy measures involves also several other
challenges. One challenge is to ensure that individual policies actually lead towards their intended
objectives. But another, as important, challenge is to avoid unanticipated side-effects on other policy
objectives. Figure 7.2 present a general perspective of the interactions of the transport system within
different transport sectors and with other sectors of the economy.
Figure 7.2. A system perspective on the hierarchy and the interrelations between overall policy
objectives, transport policy objectives and measures, direct transport related effects and their
consequences (modified Sorensen et al. 2010).
Starting to implement a solution if the benefits (U) are larger than those of hanging on to it, i.e. U(prob)t > U(solu)t
Climate change induced risk is acknowlegded(Dinkelman 1994 – a problem is only politically acknowledged,
if there is a solution in sight)
effectiveness
efficiency
Administrativeburden & complexity
Side-effects
International links

Grant No. 233919
61/81
Several existing strategies for extreme weather risk mitigation were presented for specific transport
modes. Stakeholder interviews indicated that continuous cooperation with national weather
services and environmental authorities with persistent development of specific warning services is
the most effective way to mitigate weather risks. These measures also fulfil the requirement of cost-
effectiveness. Education and training of transport managers and users is also important. Better
monitoring systems and forecasting methods are required. For aviation there is a clear need for
improved weather information, especially on adverse weather events, that helps all air space users to
plan well in advance to mitigate the weather impact. The present meteorological services for aviation
like aerodrome forecasts (TAF), trend-type landing forecast (TREND), aerodrome warnings or, for
aircraft en-route, standard and warning information for airmen (AIRMET/SIGMET) do not meet the
needs of today’s aircraft operators and air space users since they are not specific enough, not covering
all phases of flight and not containing important parameters. The community in aviation is growing who
believes that the disrupting impact of adverse weather on aviation can be mitigated by using and
integrating dedicated and tailored observations and forecasts of weather.
7.3. Weather risk management measures based on more effective met-information
7.3.1. Alarm services
Present weather risk management measures very considerably depending on the climate zone and
transport mode. For general public the procedures are quite similar as they have been coordinated for
decades by the World Meteorological Organisation. In each country the National Weather Service is the
official source to define and issue the risk of weather to the society. This is mainly done through pre-
defined set of weather warnings that are delivered through media for citizens in case there is a risk for
certain hazardous weather phenomenon. End users then decide themselves how to prepare for the risk
if at all. Professional users have usually more at stake and thus receive services from public or private
sources that are especially tailored for their specific needs. Official weather warnings have strict limits,
and those are issued only if certain observational or forecasted parameter values are exceeded.
For private car users there has been a gap in adequate weather services if the route should go through
several countries. For these kinds of cross-border transport needs European national weather services
have recently developed an on-line web service Meteoalarm. It is an initiative by EUMETNET, the
public European weather services network within the World Meteorological Organization. The service is
available on http://www.meteoalarm.eu informing public and authorities about severe weather
conditions in 30 European countries. On Meteoalarm, weather symbols and color-coded maps of
Europe show at a glance where the weather might be, or soon become, dangerous. One example of
the user-interface is shown in Figure 7.3.

Grant No. 233919
62/81
Figure 7.3. Pan-European weather alarm service Meteoalarm at http://www.meteoalarm.eu
7.3.2. Enhanced met-information services - cost effectiveness and benefits
EWENT assessed the impacts of weather forecast quality developments on the economic effects of
severe weather and resulted in a comprehensive assessment of the economic value of weather
forecasts for different transport sectors. The full version of the outcome, EWENT Deliverable Report,
D5.2, is available at: http://ewent.vtt.fi/ (Nurmi et al. 2012). The purpose was to survey alternative
approaches for such assessment of economic effects. Some illustrative calculations of the economic
impacts of specific weather services were provided. One founding argument was based on the fact that
there has been a constant increasing trend in weather forecast accuracy during the past decades, and
supposing that a similar progress will continue to the foreseeable future.
Identifying where added value is created
Reliable estimates of the net social-economic benefits of weather services are still relatively rare.
Deliverable 5.2 produced valuable new assessments for specific transport market segments. The report
also introduced a new approach, the Weather Service Chain Analysis (WSCA). It decomposes the
“usage chain” from the source of weather information down to the end-user into different components
which, when interlinked with each other, result in an overall estimate of the under-exploitation of the
potential benefit of the weather service as a whole.
A difference shall be made between highly professional end-users of weather information, such as civil
aviation, maritime transport, and electricity production, against common users with less skills, resources
or interest to fully exploit weather services. This means that not only weather forecast accuracy but also
access to forecasts, their comprehension, tailor-made products for specialized users, and the
contextual skills of the users will affect the eventual attainable benefit.
Progress in weather forecast quality as the basis
As regards the improvements in weather forecast quality:

Grant No. 233919
63/81
(i) there are differences in the forecasting capability of different weather variables
(ii) there are definite positive trends in the quality of weather forecasts
(iii) the past improvements in forecast quality have had a more or a less steady increase of the order of
one day per decade, as showcased in Figure 7.4.
It is realistic to expect that a similar trend will continue and that the predictability of atmospheric
variables and, consequently, the usefulness of final weather forecasts will evolve by one day per
decade to the foreseeable future.
Figure 7.4. Evolution (1995-2010) of the predictability, in days, of precipitation by the numerical weather
prediction model of the ECMWF (European Centre for Medium-range Weather Forecasts) (© ECMWF)
An example of applying such quality assessment information for practical target setting is the official
target of the Finnish Meteorological Institute for the year 2015: The precipitation forecasts should be
useful (i.e. have value) at least up to a forecast range of 104 hours ahead, when today the predictability
is ca. 100 hours.
Weather Service Chain Analysis (WSCA)
A basic approach to perform a net benefit analysis of a particular weather service is the so-called Cost-
Loss model. It is based on the assumption that all involved actors are perfectly informed and
knowledgeable about different options and perfectly rational. Hence, the only endogenous variable in
the Cost-Loss model is the weather forecast accuracy. However, this is not the case for most user
groups and additional analysis about the limitations in communication and utilisation of weather
information is necessary.
WSCA decomposes the chain from forecast generation to the realized benefit for the end-user into
seven steps: 1. The extent to which weather forecast information is accurate 2. The extent to which weather forecast information contains appropriate data for the end-user 3. The extent to which a decision maker has timely access to weather forecast information 4. The extent to which a decision maker adequately understands weather forecast information 5. The extent to which a decision maker can use weather forecast information to effectively adapt
behaviour 6. The extent to which recommended responses actually help to avoid damage

Grant No. 233919
64/81
7. The extent to which benefits from an adapted action or decision are transferred to another economic agent
Estimated benefits of weather services
Three case studies were conducted to estimate the value of weather information for different end-users
and to illustrate the use of WSCA and other valuation methods. For road transportation, WSCA was
applied to traffic accident cost data, resulting in estimated annual benefits of 36 million € in Finland and
3.4 billion € for the whole of Europe, corresponding to c. 14% of the potential value being reached, as
demonstrated in Figure 7.5 below.
Figure 7.5. Application of WSCA for road transportation
An interview was conducted with the operational managers of the Finnish Transport Agency to estimate
the benefits for rail transport. Each step of the WSCA was analysed with the conclusion that c. 20 % of
the potential value of weather information is actually perceived in rail transport. This would suggest that
annual travel time savings amount to 1.4 million € in Finland and 50-130 million € in Europe.
The value of improved weather information for aviation was estimated at around 280 million € basing on
the delay and cancellation cost statistics of the Eurocontrol and earlier research on the avoidable costs. Table 7.1. Summary of the results of the case studies and the estimated values
Transport
mode
Estimated
benefits
in Finland
(€)
Estimated
benefits
in Europe
(€)
Estimated
potential of
improved weather
information
Used
Valuation
methods
Included benefits
Road
transport
36 million 3.4 billion can be calculated
for each step in
WSCA
natural
experiment,
WSCA
reduced accident
costs
Rail
transport
1.4 million 50-130
million
can be calculated
for each step in
WSCA
expert
interviews,
WSCA
travel time
savings
Aviation - - 280 million €,
in Europe
statistics +
literature review
reduced delay &
cancellation costs

Grant No. 233919
65/81
7.3.3. Met-information supply market vs. extreme weather situations
Already now there are the national met-services and private met-service providers that offer both
standardized mass-services and tailored services according to specific needs of different customer
segments or even individual customers. Weather service chain analysis points out how there is great
potential in the further utilisation of weather information, hence mitigating some of the adverse weather
effects. These situations usually refer to day-to-day context and benefits gained from weather
information to adapt behaviour or guide decisions. It is in this context where enhanced services
produce the greatest benefits. In extreme weather situations, where grave risks lie, the role of national
met-institutes is emphasised and their role in supporting the other national authorities, e.g.
transportation and civil protection is crucial.
To simplify, the more efficient is the weather information supply market, the more day-to-day benefits
are generated to citizens and organisations. In extreme weather cases, a clearly more coordinated role
is needed.
7.4. Other risk management approaches and ideas
RIMAROC
ERA-NET Road project RIMAROCC developed a toolbox to risk management for roads with regard to
climate change. It can be used by European road owners and road administrations, but it is a useful
concept for the benefit of other transport modes as well. The toolbox covers the complete seven-step
cyclical process of risk management (see Figure 7.6).
Figure 7.6. Seven cyclical steps of the RIMAROCC method
Source:
http://www.eranetroad.org/index.php?option=com_docman&task=cat_view&gid=90&Itemid=53
Operational decision making aids - WxFUSION
For aviation new expert systems have been developed to enhance the situational awareness and the
decision making process of pilots in difficult weather situations. Heart of the expert systems for
thunderstorms and winter weather events is the WxFUSION concept which aims at the combination of
data from observation systems, nowcasting tools, and numerical models in order to detect, track,
nowcast (up to about 6 hours), and forecast (beyond 6 hours) hazardous weather phenomena for
aviation purposes as precisely and as consistent as possible (Forster and Tafferner, 2009a). The
combination within one integrated system can be expected to provide a greatly enhanced benefit in
monitoring and nowcasting capability, i.e. an integrated system can process and contrast the assertions
of the individual tools, e.g. as regards to the exact location of a particular weather system, its intensity

Grant No. 233919
66/81
and movement, and thus provide a more reliable assertion of the future state of a weather system as
when only one data source or nowcasting tool were used (Tafferner et al., 2008). Figure 7.7 illustrates
the WxFUSION system. Various data sources and system components are represented by symbols.
Figure 7.7. Concept of WxFUSION. The initiation, track, nowcast, and forecast of user specified
weather objects are characterized by appropriate information through fusion of selected nowcast
information (upper half) and forecast products (lower half) (adapted from Tafferner et al., 2008; Forster
and Tafferner 2009b).
Ideas from stakeholder interviews and EWENT Innovation Seminar
Stakeholder interviews revealed several new ideas which could improve the present risk management
level by new service solutions. In all transport modes the need for more detailed, accurate and
specifically tailored weather forecasts was imminent. This requires intensive research and development
for the accuracy of atmospheric models, applied models for transport modes, end user service products
and fast delivery channels. To foster new innovations, EWENT also organized a brainstorming
workshop in Athens on 26-27 April 2012. Out of the more than 50 ideas the group evaluated and
selected the six best ideas which were:
Road maintenance for all – road users can take part in road and slipperiness clearance with special equipment using e.g. the warming effect of exhaust gases.
Adaptive wind shields that would rise and fall according to the wind speed and could be used for generating wind energy as well.
Weather hazard skill management certificate that would be required for transport operators and infrastructure managers.
Advanced users behaviour – an extensive dynamic information system including automatic speed adaption in vehicles.
Cooling outfit for light traffic including novel outfit technologies and textiles.
Fog alert system combining weather and navigation data.

Grant No. 233919
67/81
For these ideas, the applicability is highest for the Weather Hazard Skill Management Certificate.
The realization of this idea even on the European scale would require only political will and some
agreements on the contents of the training courses and on the suitable certification facilities. Benefits
would be very significant as all transport managers on duty would know exactly how to behave and
what information and services to use during extreme weather events. Benefits would be for all transport
modes and for all extreme weather events.
All other five best ideas require first some technological development, and quite substantial for some
ideas (e.g. Road maintenance for all and Adaptive wind shields). However, all these ideas are
worth investigating with experts on those areas where technological development is needed. Intuitively
one may assess that the benefits would be substantial if systems like this could be implemented in
Europe. Advanced users behaviour requires a full-blown development and application of road
transport ITS, but fortunately the present projects and research groups are working on these kind of
concepts already in Europe. The Fog alert system considers marine transport problems, but other
versions could be developed for other transport modes as well. EWENT aviation expert reminded that
enhanced vision has been already developed for aviation and could be expanded to road and other
users. The Cooling outfit may be an idea that somebody is already working on and that would be on
the market sooner than we expect. Manufacturers for consumer products are eager to find new markets
and constantly search for novel ideas. Applications that ease the burden of transport users on summer
days that are getting hotter and hotter should be very attractive for designers and textile engineers.

Grant No. 233919
68/81
8. Sum-up of results
8.1. Climatology and future scenarios of extreme weather
The potential effect of changes in extremes will likely have both positive and negative effects on the
transport system. A decrease in cold spells, extreme snowfalls and frozen precipitation have a positive
impact on road, rail and air transportation, reducing the cost of maintenance and producing side
benefits. However, even with a general decreasing trend in winter extremes, due to inter-annual
variability winter extremes are still expected to have an impact on transportation, and would still need to
be considered in maintenance and investment in preparedness for many European countries.
Increases in warm extremes and heavy precipitation events are likely to have a negative impact on
transportation and infrastructure. During summer, especially in countries which already experience high
temperatures, further warming implies a need for improvements in the heat tolerance of the transport
system.
Figure 8.1 summarizes the present climatology and the predicted changes in the probabilities of
adverse and extreme weather events for each extreme climate region apart.
Figure 8.1. Classification of climate regions based on adverse and extreme phenomena for European
countries and the projected trends in frequency of adverse and extreme phenomena by the 2050s

Grant No. 233919
69/81
There are number of uncertainties related to additional changes in weather extremes. Increased
temperatures may increase also the occurrence of thunder and loosening of surface soil. Both will have
a definite impact on transport systems. However, these phenomena cannot be analytically projected.
8.2. Summary of consequences
Table 8.1 on the next page summarizes the added risks for delay and accidents in dependence from
the expected climatic changes. As the expected changes, concerning heavy precipitation are negligible,
the focus is laid on the other phenomena of extreme weather (Wind gusts, Snowfall, Heat waves and
Cold waves). For the different climatic regions, the expected change from 2010 for each of those
phenomena is given by a percentage rate. For example, the heat waves for the Temperate region will
increase between 0.1% and 7.0% until 2040. The effect of the changes on different traffic modes is
described for the indicators delay and accident rate in the same table. For the above mentioned
example, the inland waterway transport will be slowed down by droughts.
For all transport modes the accident rate should be reduced or will stay on a low level in future,
because it is expected that better technologies and higher safety standards (which today are best
utilized in aviation), will influence the accident rate more than the expected weather changes. From an
economic point of view, the former trend clearly outweighs the latter.

Grant No. 233919
70/81
Table 8.1 Summary of added delay and accidents risks due to extreme weather in
2011-2040 and 2041-2070
Forecast per
region
Nordic Temperate
Eastern &
Central
Alpine /
Mountainous
Mediterranean Maritime
2011-
2040
2041-
2070
2011-
2040
2041-
2070
2011-
2040
2041-
2070
2011-
2040
2041-
2070
2011-
2040
2041-
2070
Wind gusts -1,5%
to
0,3%
-2,1%
to
-0,2%
-0,4%
to
1,5%
-1,3%
to
0,5%
-1,1%
to
0,8%
-5,8%
to
0,3%
-0,6%
to
2,5%
-2,3%
to
4,1%
-0,5%
to
1,6%
-3,1%
to
-0,9%
Snowfall -7,7%
to
-2,6%
-
14,2%
to
-7,2%
-3,1%
to
-0,8%
-7,4%
to
-1,2%
-4,5%
to
-0,9%
-9,6%
to
-1,3%
-2,0%
to
0%
-3,5%
to
0%
-2,9%
to
-0,2%
-3,9%
to
-0,3%
Heat Waves 0%
to
4,0%
0,1%
to
6,5%
0,1%
to
7,0%
2,8%
to
18%
6,2%
to
14,6%
15,8%
to
28,4%
12,7%
to
29,1%
24,6%
to
41%
0,1%
to
2,8%
0,2%
to
7,6%
Cold Waves -16%
to
-7,8%
-41%
to
-22%
-8,8%
to
-0,5%
-25%
to
-5,3%
-15%
to
-5,1%
-29%
to
-12%
-8,1%
to
0,5%
-18%
to
0%
-7%
to
-3,5%
-14%
to
-1,5%
Road Delay Increase as the road system gets more congested and infrastructure ages
Acc. Decrease, either moderate or strong due to improved vehicle safety technologies
Rail
Delay
The extreme weather phenomena will most likely increase the delays in general, but
more efficient capacity utilization technologies and improved control systems dampen
the negative effects
Acc. Accidents continue to decline due to improved safety technologies despite the extreme
weather risks
Aviation
Delay
No particular identifiable changes due to weather phenomena because of overlapping
effects. But due to increased traffic volumes the system bottleneck, i.e. primarily
airports, will be more congested.
Acc. The accident risks are expected to remain unchanged even if extreme weather
phenomena increase slightly
Inland
Waterway
Transport
IWT
Delay
In the Nordic and Alpine region IWT will benefit from the warmer climate due to reduced
ice occurrence on inland waterways.
The delays and specific transport costs are expected to increase in regions with hot
summers, shallow water sections and low summer discharges; the climate is getting
warmer and droughts will slow the traffic and reduce the cargo carrying capacities. In
regions with high summer discharges a more balanced discharge distribution over the
year is expected for the near future.
Acc.
No changes; even if the risks of accidents increase because of adverse weather
phenomena, the improving safety track record as a result of better navigation and
vessel traffic control technologies will reduce the risks even more
Coastal
shipping
Delay No changes or slight decrease due to reducing ice cover (e.g. in the Baltic Sea)
Acc. No particular changes could be identified for coastal shipping accident risks
Grant No. 233919
71/81
8.3. Present and future costs of extreme weather in Europe
The following tables 8.2 and 8.3 summarise the cost analysis findings at present and projected to 30
years in the future. Needless to point out, the figures are very rough benchmarks and bring in the
magnitudes of different cost items resulted by extreme weather phenomena, but do not necessarily
represent any specific contexts, regions or cases. What is evident, is that road sector costs dominate
the picture quite clearly. This is because of one main reason only: most of the transport is done on
roads. If relative cost analysis would have been used, the picture might be slightly different, though not
too much. Roads are still today relatively unsafe and due to the nature of road network, the vulnerability
is high: roads are everywhere and they are not managed as systematically as other networks.
As to the future costs, there is an apparent trend in declining accident costs, first and foremost because
of general trends, and secondly because the winters are getting shorter and warmer in the Northern
hemisphere. Icy and slippery roads raise the accident risk up to 2-3 times higher than on dry roads. The
winter maintenance operations costs are also expected to decrease throughout Northern Europe. But
the actual impact of more frequent weather extremes remains still an open question. However, the
magnitudes of that, even if these extremes would become more frequent, will not be that significant
compared to the big picture.
Natural catastrophes and extremes that bring societies to their knees are of course another chapter. In
road transport, as the data on estimated future accident levels shows there will be considerable
improvements in vehicle technologies that will contribute to greater safety for passengers. Thus, the
scenarios take these developments into consideration as given baseline of future accident volume
developments.
The following table 8.3 attempts to capture the relevant changes in costs due to climatological changes.
For many items, the changes are positive, but not all. In aviation, the trend is to see costs from delays
to go up by 2040 from present mainly due to value of time changes but declining by 2070 as events
become less frequent.

Grant No. 233919
72/81
Table 8.2. Extreme weather resulted costs for the European transport system at present
Mode Present costs due to extreme weather, including all phenomena (ca. 2010)
Accidents Time costs Infrastructure Freight &
logistics Physical infra Maintenance
Road >10 bill. €/a,
mostly borne
by the society
0.5-1.0 bill. €/a,
mostly borne by
road commuters
ca. 1 bill. €/a,
mostly borne by
infrastructure
managers,
ultimately by the
taxpayers
ca. 0.2 bill. €/a,
mostly borne by
public infrastructure
managers and
hence ultimately by
the taxpayers
1-6 bill. €/a,
mostly borne by
the shippers
Rail >0.1 bill. €/a,
mostly borne
by the society
>10 mill. €/a,
borne by the
commuters
>0.1 bill. €/a,
mostly borne by rail infrastructure
managers (=taxpayers)
5-24 mill. €/a,
borne by the
shippers
IWT ca. 2 mill. €/a,
mostly borne
by society
na na na 0.1-0.3 mill. €/a,
borne by the
shippers
Short sea >10 mill. €/a,
mostly borne
by society
na na na 0.2-1 mill. €/a,
borne by the
shippers
Aviation na >0.7 bill. €/a na na 0.5-2.3 mill. €/a,
borne by the
shippers
Light traffic >2 bill. €/a,
borne by the
society and
insurers
- na na -
TOTAL >12 bill. €/a >1.2 bill. €/a ca. 1 bill. €/a >0.3 bill. €/a 1-6 bill.€/a
The EU-27 grand total for all modes and all cost items is at present more than 15 bill. euros p.a.

Grant No. 233919
73/81
Table 8.3. Future costs (present price level) of extreme weather resulted consequences to European
transport system
Mode Future costs due to extreme weather, including all phenomena (period 2040-2070)
Accidents Time costs Infrastructure Freight & logistics
Physical infra Maintenance
Road 4.5-6.6 bill.
€/a,
mostly borne
by the society
0.5-1.0 bill. €/a,
will remain about
the same
ca. 1 bill. €/a,
will remain
about the
same
<0.2 bill. €/a,
will reduce due to less
need for winter
maintenance
2-10 bill. €/a,
will increase
significantly, if
volumes continue to
grow
Rail <0.3 bill. €/a,
mostly borne
by the society
>10 mill. €/a,
borne by the
commuters
ca. 0.1 bill. €/a,
will remain about the same; winter
maintenance will decrease, but other
costs may increase
8-41 mill. €/a,
will increase in pace
with freight volumes
IWT ca. 2 mill. €/a,
mostly borne
by society
na na na 0.2-0.5 mill. €/a,
will increase in pace
with volumes
Short
sea
<3 mill. €/a,
mostly borne
by society
na na Will decrease due to
less need for ice-
breaking
0.3-1.7 mill. €/a,
will increase in pace
with volumes
Aviation na 0.6-0.8 bill. €/a
will increase by
2040 but drops by
2070
na na 0.8-4 mill. €/a
Light
traffic
will likely
reduce
- na na -
TOTAL >6 bill. €/a ca. 1 bill. €/a ca. 1 bill. €/a <0.3 bill. €/a 2-10 bill.€/a
The EU-27 grand total for all modes and all cost items will be more than 10 bill. euros p.a.

Grant No. 233919
74/81
9. Recommendations and discussion The analysis and stakeholder interviews performed in WP6 on Adaptation and mitigation strategies
indicated that most effective and cost efficient measures against extreme weather risks are continuous
cooperation of transport sector actors with national weather services and environmental authorities with
persistent development of specific weather warning services. Education and training of transport
managers and users is also important. Better monitoring systems and forecasting methods are
required.
The action plan devised for mitigation and adaptation identified the need to enhance weather
information services supply in general, but for truly extreme events the key to successful mitigation is
co-operation. None of the interviewees involved in EWENT stated that current co-operation models are
working and sufficient.
Out of the new innovations created during the EWENT Innovations Seminar, the Weather Hazard Skill
Management Certificate is particularly applicable with high benefit/cost ratio and should be made
mandatory in Europe for all transport operators and managers. Benefits would be for all transport
modes and for all extreme weather events. The European Commission should take this idea into
consideration and as a topic for future research.
Up-coming research needs were considered for transport system maintenance strategies, infrastructure
planning and construction, transportation technologies and policy oriented research. Research is
particularly needed on transport network’s vulnerability, reliability and resilience. Quantitatively
verifiable tools should be developed for diagnosing the European network’s state of preparedness to
withstand different classes of extreme weather phenomena and their impacts.
Below some most obvious recommendations coming out of EWENT results are listed. We have listed
them according to
aggregate benefit potential, i.e. where the largest extreme weather costs are lying and the
actions that can respond to those costs – “the big pay-offs”
the feasibility and acceptability of the policies, strategies and actions – “the easy ways”
the economics of the decisions and actions taking into account costs associated with their
implementation – “the low cost options”
commonly known and spoken ideas, but which might include additional risks or large long-
term costs – “the question marks”
commonly known and spoken ideas and initiatives, which work well to the direction of
extreme weather risk management, although not necessarily directly associated with these –
“the allies”
the probability of success, i.e. those lines of action that definitely work to the right direction in
terms of extreme weather risk management – “the sure bets”.
“The big pay-offs”
Accidents are currently the major cost item resulted by extreme weather, no matter how the calculus is
performed, if we rely on generally accepted valuation principles. However, the trend in accidents is
declining, and the improved vehicle technologies have responded to the demand for safety. Vehicle
technologies are first and foremost developed by vehicle manufacturers, who transfer the costs of these
to their customers. Keeping traffic safety high on the agenda will have a substantial impact also on

Grant No. 233919
75/81
safety in extreme weather situations, especially in slippery and wintery road and traffic conditions. No
particular measures, except keeping the safety issue on the transport policy agenda, is needed.
The second largest costs that in addition seem to be on the rise are the time cost of European logistics.
Increasing the time reliability and weather resilience of European logistics will pay off substantially. For
the public sector, the only immediate action to be taken is to enhance maintenance of infrastructures in
such a manner that transports are possible also in severe weather. Yet, it seems that maintenance is
one of the items that are cut when reducing the costs of European infrastructure managers. This policy
may be short-sighted in the longer run.
“The easy ways”
Intermodal, co-modal and multimodal transport system in Europe, in member states and in cities will
increase the flexibility of the transport system as a whole, and hence also enhance weather resilience
of the aggregate system. The already chosen lines of policies of the EU work on this direction as they
are. Resilience and flexibility aspects only underline the relevance of co-operation between modes.
However, there is a greater challenge to have the actors of the modes to co-operate on operational
level, not only in speeches. Transport service supply market, both from operating and infrastructure
viewpoints, that is modally split or segmented, will make this goal more difficult to realise.
The management of transport system is largely based on certain metrics that define how “good” the
infrastructure is. If such metrics are lacking concerning extreme weather resilience, then these
phenomena will not be taken into account in the design, building and operating. This is particularly
fruitful topic for upcoming research. The current research is by and large already focusing on the topic,
but the management system principles, including the metrics, are still lacking to a large extent.
The national met-service institutes are playing a key role in providing good and reliable weather
information. However, if their role and met-observation infrastructure network owner is self-evident and
clear, the service side could be much more open for newcomers and small, innovative companies, who
can create substantial added value by refining and tailoring the basic weather information to formats,
contents and distribution channels that serve a wider set of user segments than today. In short, the
more there is good weather information “on the air”, the more it will be utilised and hence it will
generate more benefits. However, if there is defective information available, i.e. the quality of service is
poor from the reliability point of view, there can be quite opposite effects.
The enhancement of the downstream end of the weather service supply chain could, in the best case,
also reduce budget pressures if the private sector actors would assume a bigger role in the met-
information services market. The national met-services’ role would in fact be highlighted as they would
act as “a neutral” data and information provider for the market, and perhaps even as a quality controller
of the services. In the longer term, this could create possibilities for novel market-based funding
mechanisms for met-services and for the infrastructures and research they require. National met-
services will nonetheless have to provide safety critical services, such as those related to public
security and defence.
“The low cost choices”
The aforementioned Weather Hazard Skill Management Certificate, which could be required from e.g.
traffic management centre operators, is definitely one of the good low-cost ideas to be investigated
further. Such training programmes could be arranged with moderate budgets. Also adding poor weather
training in European drivers’ licence training programmes could work to this direction with marginal
Grant No. 233919
76/81
financing needs. Already in Finland some slippery road condition training is offered in most driving
schools.
This extreme weather issue should be kept on the table and agenda of the EU and national authorities,
just to raise the awareness. Once European stakeholders realise how much extreme weather will affect
their activities, operations, business and governance, they will start to take extreme weather into
account in their decisions. Such decisions could be e.g. the following:
public transport operators are required to install their vehicles with air-conditioning systems in
order to win the operating contract
consumers will more eagerly require that their new cars are equipped with modern safety
technologies
weather service customer start to require new and more precise weather forecasts, opening the
way for weather service sector liberalisation
extreme weather phenomena are taken into account more consciously in infrastructure planning,
engineering as well as in maintenance planning, including the service contracts
investors and insurers start to set risk premiums for extreme weather events hence transferring
some of their losses as well as public costs to their customers who own and/or operate facilities
and services in question
availability type of contracts for infrastructures (ports, airports, roads, rails) will be favoured more
often, as these by definition include the assumption that availability will cover also extreme
weather situations; hence the costs are already internalised (at least partly) in availability
contracts
All in all, the efficient market for extreme weather information will start to be internalised in contracts,
agreements, service fees etc.
“The question marks”
There are rather many points in the logical chain of trying to visualise the long-term impacts of extreme
weather. The uncertainties relate to the models, to impacts, to causal chains and finally to
consequences. A strictly analytical decision would most probably be “wait-and-see”, but while this
thinking is good in business environment it does not apply to current decision making situation faced by
the EU, member states or even cities and municipalities. For example, improving the weather resilience
of new infrastructure will cost more out-of-the-pocket-cash and the net present value of future benefits
can be minimal, if not negative. However, the reduction of risk and other benefits of better quality
infrastructure are equally hard to assess, if accountable at all. This stalemate must be by-passed by
prioritising what is more relevant: a good cost-benefit ratio for us or better and safer environment for our
children. In EWENT, we could not witness straightforward cases or arguments for e.g. renewing
existing building standards. We could, however, witness several cases where more careful planning of
the unexpected extreme weather could have reduced damages and losses. Raising the quality of the
infrastructure does not in any way mean only raising existing standards, but also to think of novel
standards. But this will call further research.
Prioritising of maintenance operations, for example choosing between highways or access roads to
railway terminals, is also a difficult task. The choices will vary from place to place and depending on the
travel patterns of any particular area. There are no rules of thumb to be adopted. Sometimes, even
prioritising higher class roads might not solve the initial problem. What is certain is that the intra-city

Grant No. 233919
77/81
traffic and daily commuting result in huge losses if they do not function properly - the larger the city, the
bigger the losses.
Prioritising between modes is equally tedious. From pure volume perspective, roads must work, On the
other hand, railway network and node points, such as airports and ports, are more easily managed and
are not as flexible in their recovery as the road network, where an alternative route is almost always
possible and where the system is somewhat self-adaptable.
Infrastructure capacity is sometimes scarce or close to its limits and typically the capacity is tried to be
utilised maximally. However, extra capacity can offer some relaxation in the scarcity when extreme
weather events occur. For example, extra runways in airports are necessary when snow is cleaned
from the other runways. Double-tracks of rails may reduce delays when storm winds cast trees on
tracks, etc. There are numerous examples where some extra infrastructure capacity can be useful
when extreme weather puts pressure on transport flows. Hence, capacity utilisation to its maximum
might not be an optimal strategy.
Climate change in itself could reduce harmful weather consequences on transport system; that was one
of the findings of EWENT. Warming of climate will likely benefit e.g. traffic safety status in Northern
Europe. If the warming of climate is excessive and radical, the heat impacts in Southern Europe can
take us by surprise. All in all, heat waves will definitely favour neither light traffic nor public transport,
and therefore works against transport policy goals.
“The allies”
Any measures, strategies or policies that reduce and dampen extreme weather effects are of course
allies to extreme weather risk management. For instance, greening of cities by creating more land
space with vegetation will reduce the risk of flooding. Compact urban areas will most likely have the
same effect, as more compact areas are more manageable and can be maintained more efficiently.
Yet, also the risks are more concentrated in compact areas having greater impacts, but their probability
is lower.
Again, cities and urban communities are having a key role in realising greener and more compact
residents.
“The sure bets”
Maintenance capability and taking care and improving the existing infrastructure are one of the few
directions which can be regarded as a safe bet. If there are deficiencies in existing maintenance
capacity of capability (lack of manpower, equipment, or planning) any extreme phenomena can cause
problems. If these resources are in place, then most events will be manageable. In other words, making
sure we can easily handle less severe weather situations will raise the capability of face even the
extreme events. The line of thinking where only extreme situations require specific responses will not
work. Organisations, made of people, will not have the learning effect when it comes to necessary
reactions, proper handling of equipment, functional co-operations models, and so forth, unless these
exercises are carried out from time to time. Good quality everyday maintenance, combined with some
practice for extreme situations, will result in good preparedness.
Research on the topic is relatively recent, EWENT having been one of the first projects. Gaining
knowledge and understanding will likewise be an investment in preparedness. However, the research
should not only be targeted at strategic level of things, but also address practical issues, such as new

Grant No. 233919
78/81
materials that are more weather resilient, new designs, and of course not to forget weather and climate
research. A pure empirical research on how much extreme or high-impact weather contributes to social
costs of transport as well as to private costs of supply chains would be more than necessary in order to
further set efficient policies and strategies. Much of the basic data exists, but must be supplemented
and combined to achieve data sets for decent analysis.
Grant No. 233919
79/81
References Agarwal M., Maze T.H. and Souleyrette R., 2005: Impacts of weather on urban freeway traffic flow
characteristics and facility capacity, in: Proceedings of the 2005 Mid-Continent Transportation
Research Symposium.
Civil Aviation Safety Authority (2010): Standard Economic Values Guidelines. Australian Government.
Doll, C. and N. Sieber (2011): Vulnerability Assessment for Road Transport. Contribution to Deliverable 2: Transport Sector Vulnerabilities within the research project WEATHER (Weather Extremes: Impacts on Transport Systems and Hazards for European Regions) funded under the 7th framework program of the European Commission.
Dotzek, N., Groenemeijer P., Feuerstein B. and. Holzer A. M, 2009: Overview of ESSL's severe
convective storms research using the European Severe Weather Database, Atmos. Res. 93: 575-586.
Enei, R., C. Doll, S. Klug, I. Partzsch, N. Sedlacek, J. Kiel, N. Nesterova, L. Rudzikaite, A. Papanikolaou, and V. Mitsakis (2011): Vulnerability of Transport Systems - Main report. Transport Sector Vulnerabilities within the Research Project “WEATHER” (Weather Extremes: Impacts on Transport Systems and Hazards for European Regions) funded under the 7th framework program of the European Commission. EUROCONTROL (2009): Standard Inputs for EUROCONTROL Cost Benefit Analysis.
Finnish Mobility Statistics (2001): http://www.hlt.fi/tyomatkaliikkuminen.pdf.
Forster C., Tafferner A. 2009a: Nowcasting and forecasting thunderstorms for air traffic with an
integrated forecast system based on observations and model data, WMO Symposium on Nowcasting,
Whistler, B.C., Canada, 30 August - 4 September 2009.
Forster C., Tafferner A. 2009b: An integrated user-oriented weather forecast system for air traffic using
real-time observations and model data, Proceedings of the European Air and Space Conference
(CEAS), Manchester, UK
Haylock, M.R., Hofstra N., Klein Tank A.M.G., Klok E.J., Jones P.D., and New M., 2008: A European
daily high-resolution gridded dataset of surface temperature and precipitation, J. Geophys. Res
(Atmospheres), 113, D20119, doi:10.1029/2008JD10201.
Hawkins E. and Sutton R., 2009: The potential to narrow uncertainty in regional climate predictions,
Bull. Amer. Met. Soc. 90: 1095-1107, doi:10.1175/2009BAMS2607.1.
Leppäranta, M. 1993: A Review of Analytical Models of Sea-Ice Growth. Atmosphere-Ocean 31(1):
123-138.
Leviäkangas P. (ed.), Tuominen A. (ed.), Molarius R. (ed.), Kojo H. (ed.), Schabel J., Toivonen S.,
Keränen J., Ludvigsen J., Vajda A., Tuomenvirta H., Juga I., Nurmi P., RauhalaJ., RehmF., Gerz T.,
Muehlhausen T., Schweighofer J., Michaelides S., Papadakis M., Dotzek N.(†) and Groenemeijer P.,
2011: Extreme weather impacts on transport systems-EWENT Project deliverable D1, VTT Working
Paper 168, 133p.

Grant No. 233919
80/81
Lott J.N., 2000: NOAA National data centre climate data online for use in research and atmospheric
icing studies. Proceedings, 9th International Workshop on Atmospheric Icing of Structures, 5-8 June
2000, Chester, U.K., EA Technology Ltd. (proceedings had no page numbers).
Ludvigsen, J., Klæboe, R., Nokkala, M., Hietajärvi, A.-M., Leviäkangas, P., Oiva, K., Athanasatos, S.,
Michaelides, S., Papadakis, M. (2012): Costs and consequences of extreme weather on European
freight and logistics industries and supply chains. EWENT project working memo D4.4. April 2, 2012.
Institute of Transport Economics, available at http://ewent.vtt.fi
Molarius, R., Leviäkangas, P., Hietajärvi, A.-M.,Nokkala, M., Rönty, J., Könönen, V., Zulkarnain, Oiva,
K., Mäensivu, S., Kreuz, M., Mühlhausen, T., Ludvigsen, J., Saarikivi, P., Vajda, A., Tuomenvirta, H.,
Athanasatos, S., Papadakis, M., Michaelides, S., Siedl, N., Schweighofer, J., Riemann-Campe, K.,
Groenemeijer, P. (2012): D.5.1 Weather hazards and vulnerabilities for the European transport system
– a risk panorama. EWENT project deliverable, VTT, July 2012, available at http://ewent.vtt.fi
Mühlhausen, T., Kreuz, M., Bläsche, J., Schweighofer, J., Leviäkangas, P., Molarius, R., Nokkala, M., Athanasatos, S., Michaelides, S., Papadakis, M. (2011): Consequences of Extreme Weather. EWENT Deliverable D3, available at http://ewent.vtt.fi
Nissinen, A. et al. (2012) Ohjauskeinoyhdistelmät asumisen, henkilöliikenteen ja ruoan
ilmastovaikutusten hillintään: KUILU -hankkeen loppuraportti (in Finnish). Helsinki: Suomen
ympäristökeskus, 78 pp.
Nokkala, M (ed.)., Leviäkangas, P. (ed.), Oiva, K. (ed.), Hietajärvi, A.-M., Ludvigsen, J., Klᴂboe, R.,
Kreuz, M., Mühlhausen, T., Schweighofer, J., Siedl, N., Athanasatos, S., Michaelides, S., Papadakis,
M. (2012): The costs of extreme weather for the European transport system – EWENT project D4. VTT
Technology 36. VTT, 2012.
Nurmi, V., Perrels, A., Nurmi, P., Michaelides, S., Athanasatos, S., Papadakis, M. (2012). Economic
value of weather forecasts on transportation – impacts of weather forecast quality developments to the
economic effects of severe weather. EWENT deliverable D5.2, available at http://ewent.vtt.fi.
PLANCO Consulting GmbH (2007): Economical and Ecological Comparison of Transport Modes: Road, Railways and Inland Waterways. Essen.
Rodrigue, J-P et al. (2009) The Geography of Transport Systems, Hofstra University, Department of
Global Studies & Geography, http://people.hofstra.edu/geotrans.
Simmons A., Uppala S., Dee D. and Kobayashi S., 2006: ERA-Interim: New ECMWF reanalysis
products from 1989 onwards. ECMWF Newsletter 110: 26–35.
Tafferner A., Hagen M., Keil C., Zinner T., Volkert H. 2008: Development and propagation of severe
thunderstorms in the upper Danube catchment area: Towards an integrated nowcasting and forecasting
system using real-time data and high-resolution simulations, Meteorology and Atmospheric Physics,
101, 211-227, DOI 10.1007/s00703-008-0322-7.
van der Linden P. and J.F.B. Mitchell (eds.) 2009: ENSEMBLES: Climate Change and its Impacts:
Summary of research and results from the ENSEMBLES project. Met Office Hadley Centre, FitzRoy
Road, Exeter EX1 3PB, UK. 160 p.

Grant No. 233919
81/81
van Oldenborgh G.J., Yiou P. and Vautard R., 2010: On the roles of circulation and aerosols in the
decline of mist and dense fog in Europe over the last 30 years, Atmos. Chem. Phys. 10: 4597-4609.
Vautard R., Yiou P., and van Oldenborgh G. J., 2009: Decline of fog, mist and haze in Europe over the
past 30 years, Nature Geoscience 2: 115-119.
Vajda A., Tuomenvirta H., Jokinen P., Luomaranta A., Makkonen L., Tikanmäki M., Groenemeijer P.,
Saarikivi P., Michaelides S., Papadakis M., Tymvios F. and Athanasatos S., 2011: Probabilities of
adverse weather affecting transport in Europe: climatology and scenarios up to the 2050s. FMI Reports
2011:9, 85 p.
Ylönen, Jutta-Leea (2011): Autojen nopeudet vuonna 2010. Liikenneviraston tutkimuksia ja selvityksiä 36/2011, Finnish National Road Administration, Helsinki.