daily b - latibex.com · ¨datasul: good 2q08 results, egm expected on august 19 ... ¨ gpa: 2q08...
TRANSCRIPT

DAILY BRAZIL
August 07 2008 Settlement: August 12 2008
Banco Espírito Santo de Investimento, S.A. Equity Iberia – Brazil
MARKET OVERVIEW MACROECONOMICS STEEL/MINING
VALE: 2Q08 Slightly Lower Than Expected, but Good Nonetheless Gerdau: 2Q08 results better than expected
OIL/PETROCHEMICAL Braskem: A Little Better Than Expected Ultrapar: Good Results for Ipiranga and Ultragaz
BANKING Banco Itaú: Complementary Dividends BIC Bank: Results for 2Q08
TELECOM / IT / MEDIA Bematech: Interest on Equity Datasul: Good 2Q08 results, EGM expected on August 19 TOTVS: Good Results for 2Q08 15th Telesintese Gathering: Focus is on the new PGO
ELECTRIC UTILITIES Equatorial: 2Q08 Results Preview
RETAIL GPA: 2Q08 Operational Result in Line with Expectations
HEALTH CARE Medial Saúde: Lower, but not a cause for concern
AVIATION GOL: Air Traffic Statistics for July/08.
PULP/PAPER VCP: Consolidation on the Way
REAL ESTATE Cyrela Commercial Properties: 2Q08 Result Abyara/Brasil Brokers: Details of the Acquisition of Brasil Brokers
EDUCATION Kroton: 2Q08 Results.
CAPITAL GOODS Randon: 2Q08 Results
OTHERS ANFAVEA: Very positive Jul/08
MACRO CALENDAR CORPORATE CALENDAR SHORT INTEREST
Main Economic Figures
International Date Local Time (BZ) Indicator Reference BES Estimates Last7-Aug 8:00 AM UK BOE ANNOUNCES RATES AUG 7 - - 5.0% 5.0%7-Aug 8:45 AM EC ECB Announces Interest Rates AUG 7 - - 4.3% 4.3%7-Aug 9:30 AM US Initial Jobless Claims AUG 2 - - 420K 448K7-Aug 9:30 AM US Continuing Claims JUL 26 - - 3265K 3282K7-Aug 11:00 AM US Pending Home Sales MoM JUN - - -1.0% -4.7%7-Aug 4:00 PM US Consumer Credit JUN - - $6.8B $7.8B
Brazilian Market 6-Aug Daily Chg. YTD Chg.Ibovespa 57,542.5 1.90% -9.93%IBX-50 8,242.4 2.09% -15.51%
Fixed Income/Yield 6-Aug 5-Aug 31-DecBR40 5.47% 5.47% 5.55%30y T-Bond 4.68% 4.64% 4.51%
IBOV Most Traded Stocks R$m Quantity (k) 6M Avg.*IBOVESPA 5,436.0 - 1.00%VALE PNA 800.1 21,690 1.23%PETROBRAS PN 633.5 19,062 0.67%BRADESCO PN 210.0 6,592 1.21%ITAU HOLDING PN 201.9 6,017 1.36%CSN ON 195.2 3,375 1.14%Blue Chips Daily Chg. Monthly Last PriceBradesco PN 2.42% -5.30% 32.15Brasil Tel Part PN 2.64% -5.80% 23.30Eletrobrás PNB -1.30% 2.90% 26.65Petrobras PN 3.42% -10.30% 33.30Telemar PN 4.58% -3.20% 37.65Vale PNA 1.86% -11.80% 36.71
Ibovespa - Top Gainers Daily Chg. Monthly Last PriceVCP PN 8.98% -4.20% 39.80ROSSI ON 6.32% -1.60% 13.13BRASIL ON 5.00% -8.40% 24.15TELEMAR PN 4.58% -3.20% 37.65B2W GLOBAL ON 4.39% -3.40% 59.50
Ibovespa - Top Losers Daily Chg. Monthly Last PriceJBS ON -3.09% -15.20% 6.90GOL LINHAS AÉREAS PN -2.88% 19.70% 18.55CEMIG PN -2.41% 0.70% 36.50ELETROBRAS ON -2.40% 2.80% 30.50EMBRAER ON -1.65% 1.30% 11.90
Other Stock Markets 6-Aug Daily Chg. YTD Chg.North AmericaDow Jones US 11,656.1 0.35% -12.79%Nasdaq US 2,378.4 1.21% -11.07%S&P 500 US 1,289.2 0.34% -12.80%EuropeDax Xetra GR 6,561.4 0.65% -18.67%IBEX 35 SM 11,774.4 0.20% -22.45%CAC 40 FP 6,863.8 1.17% -32.63%FTSE 100 LN 5,486.1 0.58% -15.30%PSI 20 PL 8,185.3 -1.31% -37.22%AsiaNikkei JP 13,254.9 2.63% -13.41%Emerging MarketsTOP 40 SJ 3,368.1 1.58% -14.72%Merval AR 1,871.7 3.46% -13.02%IGPA CI 27.8 0.56% -1.80%BUX HB 141.1 -1.27% -7.11%JCI IJ 0.2 -0.18% -17.51%IPC MX 2,753.1 0.99% 1.08%RTS RU 1,814.6 0.14% -20.78%Price Index Preview May-08 Last 2007IPCA 0.65% 0.55% 4.46%IGP-M 0.72% 1.36% 7.75%Indicators 6-Aug Daily Chg. YTD Chg.Dollar (R$/US$) 1.577 0.13% -32.63%Brent (US$) 115.83 -0.69% 23.00%*Volume traded as % of average daily volume for the last 6 months

Daily Brazil
August 07 2008
Banco Espírito Santo de Investimento, S.A. - 2 - Equity Iberia - Brazil
MARKET OVERVIEW
Equity Market
This Wednesday, US equity markets traded in negative territory in reaction to further losses announced in the mortgage market. Despite this, results reported by companies in the technology sector reversed the pessimistic mood towards the end of the day. Thus the Dow Jones and S&P 500 closed up 0.35% and 0.34%, respectively. The oil price continued the downward trend seen in the last few days, influenced by the publishing of the latest oil stock report, with Brent crude closing down 0.59% at US$117/barrel. In local markets, the Bovespa Index closed up 1.9% at 57,542 points, on volume of R$ 5.4 billion. The shares of Petrobras did not accompany the drop in the oil price, with the ordinary shares closing up 2.67%, and the preferred shares up 3.14%. VCP was the star performer on the day, up 8.98% after the announcement of the company's acquisition of part of the controlling stake of Aracruz. One of the day's highest losers was was JBS , which closed down 3.08%.
Short Position Comments
Equity rental markets saw little movement this Wednesday, with an increase in the level of donors available, and a reduction in rates. Of particular note was the shortage of donors for Aracruz PNB (ARCZ6), with a 21-day average rate of 1.55% p.a.. Other highlights were: Cyrela ON (CYRE3), trading at 3.85% p.a., compared to its 21-day average of 4.00% p.a. and Petrobras ON (PETR3), trading at 0.40% p.a., in line with its historic average.
Exchange Rate
BRL fell in the morning on USD strength but recovered in the afternoon session, closing at 1.5765 (+0.06%). Crude oil futures closed at USD 118.58 (-0.59), the Embi+ Brazil at 220 bp (-3 bp), and the yield of the 10 Yr UST at 4.03% (+1 bp).
The USD closed at R$ 1.57 up 0.06%.
Interest Rates
The lower-than-expected IGP-DI and the further drop in commodity prices led to the continued fall in domestic interest rates, especially short tenors. Jan/09 and Jan/10 rates closed at 13.72% (-2 bp) and 14.64% (-5 bp), respectively.
MACROECONOMICS No major economic indicators were released this Wednesday on international front. In Brazil, FGV institute released general price index (IGP-DI) related to July. According to monthly report, the index decelerated from 1.89% in June to 1.12% in the past month, and came below our estimates (+1.31%). As anticipated, wholesale prices have considerably eased in the end of last month, driven by both agriculture and industrial products. However, that deceleration movement was more intense than our projections had indicated. According to our estimates, IGP-M may register a positive rate of 0.14% in the first preview of August, whose result will be released on Friday, taking into account the recent trend mentioned above. Shifting to economic activity, Anfavea’s vehicle production figures rose 19.8% in July on YoY terms. Based on last data and keeping other relevant variables in their current trend, our econometric model signals a growth between 4.5% and 6.5% (YoY) in July that would represent a drop between 1% and 2% excluding seasonal factors. We will define a more accurate projection as soon as other coincident and leading indicators have been released. On Thursday, monetary policy decisions on Europe will be the highlight on international markets. Analysts expect that BoE and ECB will keep benchmark rates unchanged at 5.00% and 4.25%, respectively.

Daily Brazil
August 07 2008
Banco Espírito Santo de Investimento, S.A. - 3 - Equity Iberia - Brazil
STEEL/MINING
VALE: 2Q08 Slightly Lower Than Expected, but Good Nonetheless Company Ticker Rating Target Price Upside Last Price R$ YTD P/E 08E EV/EBTIDA 08E DY 08EVALE ON vale3 BUY 69.4 64.5% 42.2 -29.3 8.97 5.9 2.0%
Analyst: Juliana Chu - [email protected] (11) 3074 7320 Company Ticker Rating Target Price Upside Last Price R$ YTD P/E 08E EV/EBTIDA 08E DY 08EVALE PNA vale5 BUY 64.8 76.4% 36.7 -28.4 7.8 5.2 2.3%
Analyst: Juliana Chu - [email protected] (11) 3074 7320 Vale do Rio Doce has published its results for 2Q08, reporting an operational performance slightly below our forecast, but without any major surprises. Operational performance, in general terms, was worse than we had estimated, basically due to the fact that the company did not fully recognized the impact of the iron ore price increase. On the other hand, the company benefited from a positive financial result from currency derivative trading, that we had not expected, which ended up producing higher than forecast net earnings.
Net sales in 2Q08 amounted to US$ 10.600 billion, EBITDA (not including dividends received) of US$ 5.837 billion, with EBITDA margin of 56.6% and net earnings of US$ 5.009 billion, which included a financial gain from trading in currency derivatives, metal hedging positions, etc. of US$ 724 million, US$ 681 million being from swap operations between the Brazilian Real and the US Dollar. Our estimates were for net sales of US$ 11.039 billion (bearing in mind that the company also is due to recognize the amount of US$ 553 million in the next quarter, as a consequence of the iron ore price increase in 2Q08), EBITDA cash generation EBITDA (not including dividends received) of US$ 6.393 billion, with EBITDA margin of 57.9% and net earnings of US$ 4.465 billion.
Despite this lower than expected operational performance, we consider the result to be positive. With this, we do not believe that there will be any significant impact on the company's share price, although there may be some confusion in the market in the interpretation of this result. As a consequence, we are maintaining our BUY recommendation for the preferred and ordinary shares of Vale do Rio Doce.
TAB. 1: RESULT SUMMARY US GAAP 2Q08 2Q08E % 1Q08 % 2Q07 %
Volume (000 ton) Iron Ore (000) 79 72 10.0% 68 15.5% 73 8.1% Nickel 69 67 2.5% 66 4.5% 67 3.0% US$ million Net Revenues 10,600 11,039 -4.0% 7,832 35.3% 8,697 21.9% Gross Profit 5,837 6,559 -11.0% 3,590 62.6% 4,913 18.8% Gross marging 55.1% 59.4% 45.8% 56.5% EBITDA* 5,995 6,393 -6.2% 3,681 62.9% 4,904 22.2% EBITDA Margin 56.6% 57.9% 47.0% 56.4% Financial Result 1,167 (241) - (711) - 501 132.9% Taxes (1,506) (809) 86.1% (358) 320.7% (1,396) 7.9% Net Profit 5,009 4,465 12.2% 2,021 147.9% 4,100 22.2%
* w/o dividends Source: Company and BES Securities Estimates
Gerdau: 2Q08 results better than expected Company Ticker Rating Target Price Upside Last Price R$ YTD P/E 08E EV/EBTIDA 08E DY 08E
GERDAU PN ggbr4 NEUTRAL 43.8 36.3% 32.1 23.3 9.5 5.7 3.1%Analyst: Juliana Chu - [email protected] (11) 3074 7320
Gerdau has published its results for 2Q08, reporting a better operational performance better than we had forecast, particularly in terms of improved operational margins. Of particular note were the operations in Brazil, which saw a significant widening in EBITDA margin, while for its Latin American operations, sales increased strongly, as did EBITDA margin - both compared to the previous quarter. It should be borne in mind that this result was also impacted by the consolidation of the operations of Macteel/Quanex, whose acquisition was completed on April 23, 2008.
The result reported in IFRS in 2Q08 amounted to net revenue of R$ 11,100 million, EBITDA generation of R$ 2,747 million, with EBITDA margin of 24.7% and net earnings of R$ 1,863 million - this latter benefiting from exchange-rate variation in the quarter. Our forecasts were for net revenue of R$ 10,348 million, EBITDA of R$ 2,384 million, EBITDA margin of 23.0% and net earnings of R$ 1,582 million.

Daily Brazil
August 07 2008
Banco Espírito Santo de Investimento, S.A. - 4 - Equity Iberia - Brazil
Considering the good result reported and bearing in mind the favourable outlook for the company, we are maintaining our NEUTRAL recommendation for the shares of Gerdau, with a target price of R$ 43.8/share (US$ 25.8/ADR) and a BUY recommendation for Met. Gerdau, with a target price of R$ 64.7/share.
TAB.1: SUMMARY RESULTS IFRS 2Q08 2Q08E % 1Q08 % 2Q07 % Total Volume 5,495 5,460 0.6% 4,941 11.2% 4,168 31.8% Brazil + Exports 1,818 1,864 -2.5% 1,621 12.2% 1,759 3.4% USA 2,268 2,208 2.7% 2,158 5.1% 1,577 43.8% Latin America 624 610 2.3% 623 0.2% 581 7.4% Europe/Specialty 785 778 0.9% 539 45.6% 251 212.7% R$ million Net Revenues 11,100 10,348 7.3% 8,945 24.1% 7,541 47.2% Gross Profit 2,980 2,572 15.8% 2,132 39.8% 1,894 57.4% Gross Margin 26.8% 24.9% 23.8% 25.1% EBITDA 2,747 2,384 15.2% 1,985 38.4% 1,597 72.0% EBITDA Margem 24.7% 23.0% 22.2% 21.2% Financial Result 434 490 -11.5% (164) -364.2% 149 191.5% Taxes and Min. (649) (486) 33.5% (308) 110.9% (296) 119.5%
Net Profit 1,863 1,582 17.8% 874 113.1% 876 112.7% Source: Company and BES Securities
OIL/PETROCHEMICAL
Braskem: A Little Better Than Expected Company Ticker Rating Target Price Upside Last Price R$ YTD P/E 08E EV/EBTIDA 08E DY 08E
BRASKEM PNA brkm5 BUY 22.0 62.0% 13.6 -4.4 12.52 5.2 3.0%Analyst: Gilberto Pereira de Souza - [email protected] (11) 3074 7325
Braskem has published its results for 2Q08, reporting net earnings of R$383 million, up 362.8% on 1Q08, and up 36.3% on the same period a year earlier. It should be remembered that the results in 1Q08 were positively impacted by the recognition of an extraordinary item of R$ 116 million (R$ 87 million after taxes) from the sale of Petroflex, while the 2Q07 result was boosted by a R$ 111 million reversion in PIS/COFINS tax provision.
TABLE 1: BRASKEM CONSOLIDATED – RESULT HIGHLIGHTS R$ million 2Q08 (a) 2Q08e (b) (a) / (b) 1Q08 (c) (a) / (c) 2Q07 (d) (a) / (d)Net Revenues 4.405 4.510 -2,3% 4.410 -0,1% 4.969 -11,4%Gross Profit 637 542 17,5% 650 -2,0% 932 -31,7%Gross margin 14,5% 12,0% 14,7% 18,8%EBITDA 519 471 10,1% 583 -11,0% 805 -35,5%EBITDA margin 11,8% 10,5% 13,2% 16,2%Net Profit 383 354 8,1% 83 362,8% 281 36,3%
Source: Braskem / BES Securities
Margins exceed expectations - Operationally, the company reported a better margin than we had forecast, practically in line with the previous quarter, despite the impact of higher naphtha prices on production costs. This better-than-expected performance is largely due to higher-than-expected sales volume in the domestic market (as well as an improved sales mix) and a lower volume of condensate re-sales than we had estimated (we had expected this to be constant compared to the previous quarter).

Daily Brazil
August 07 2008
Banco Espírito Santo de Investimento, S.A. - 5 - Equity Iberia - Brazil
Reaction likely to be positive - The strong sales volume in the domestic market, enabling more stock to be drawn down than we had expected, resulted in the company obtaining better margins than forecast, something which we consider to be very positive, and likely to please investors. However, we draw attention to the fact that a significant volume of sales took place in June, which may represent advance buying on the part of clients, in order to avoid the price increases announced for subsequent months. This could result in lower sales volume growth in 3Q08. The second point is with regard to the rise in sales expenses in this quarter, which we believe will have a negative impact on this result. We believe that part of this increase was due to the need to handle a higher volume of stock during the period that the plants were shut down, but it is not entirely clear exactly how much of this increase is non-recurring.
Despite these points, our view of the results and the prospects for the company continue favourable. We are maintaining our BUY recommendation for the preferred shares of Braskem, with a target price of R$ 22.00/share.
Ultrapar: Good Results for Ipiranga and Ultragaz
Company Ticker Rating Target Price Upside Last Price R$ YTD P/E 08E EV/EBTIDA 08E DY 08E
ULTRAPAR PN ugpa4 NEUTRAL Under Revision - 57.0 -8.6 - - -Analyst: Gilberto Pereira de Souza - [email protected] (11) 3074 7325
Ultrapar has published its results for 2Q08, reporting net earnings of R$ 104 million, up 15.3% on the previous quarter, and up 178.3% on 2Q07 (this quarter did not include the acquisition of the assets from Ipiranga). Of particular note was the declaration of a dividend of R$ 0.89/share (dividend yield of 1.6% on the closing share price as at August 6, 2008), which corresponds to a payout of 61% of the company's net earnings in the half-year.
TABLE 1: ULTRAPAR CONSOLIDATED – RESULT HIGHLIGHTS
R$ million 2Q08 (a) 2Q08e (b) (a) / (b) 1Q08 (c) (a) / (c) 2Q07 (d) (a) / (d)Net Revenues 6.992 6.917 1,1% 5.927 18,0% 6.181 13,1%Gross Profit 488 513 -5,0% 466 4,6% 477 2,3%Gross margin 7,0% 7,4% 7,9% 7,7%EBITDA 248 247 0,5% 222 11,5% 222 11,3%EBITDA margin 3,5% 3,6% 3,7% 3,6%Net Profit 104 102 2,3% 90 15,3% 37 178,3%
Source: Ultrapar / BES Securities Ultragaz: better volume than expected
Ultragaz ended 2Q08 with sales volume of 411,000 tons of LPG, an increase (partly seasonal) of 12.3% on 1Q08, being up 2.2% compared to the previous year, higher than we had expected, as a result of a better performance than expected in the bulk gas segment. Of particular note was the EBITDA margin per ton, up 14.8% compared to the previous quarter.
Oxiteno: Still under pressure from ethylene costs
Oxiteno ended 2Q08 with sales volume of 146,000 tons, up 6.7% compared to the previous quarter, but down 0.9% on 2Q07. The domestic market accounted for sales volume of 101,000 tons, down 9.4% on the previous year (lower sales volume in the polyester segment) but up 2.9% on 1Q08. Cost pressure, however, resulted in a further squeezing in EBITDA margin/ton - more than we had estimated.
Ipiranga: Good Operational Performance
Oil product sales volume at Ipiranga in 2Q08 amounted to 3,063,000 m³, up 11.5% on the previous year, and a seasonal increase of 13.1% on the previous quarter. Of particular note was the significant increase in ethanol sales: up 71.3% on 2Q07, well above market growth and much higher than we had forecast. The highlight here was the sharp rise in EBITDA/m³ (6.9% on the previous quarter), higher than we had estimated.
Opinion: In general, the result, both consolidated as well as for the subsidiaries, is in line with our forecasts, and likely to please investors, particularly in the case of Ipiranga and Ultragaz.

Daily Brazil
August 07 2008
Banco Espírito Santo de Investimento, S.A. - 6 - Equity Iberia - Brazil
BANKING
Banco Itaú: Complementary Dividends
Company Ticker Rating Target Price Upside Last Price R$ YTD P/E 08E EV/EBTIDA 08E DY 08E
ITAU HOLDING PN itau4 BUY 44.3 31.0% 33.8 -6.8 12.1 - 2.9% Analyst: Mariana Moraes de Barros - [email protected] (11) 3074 7356
Banco Itaú announced the payment of complementary dividends. The gross value to be paid is one of R$ 444.8 million or R$0.15 per share which correspond to a dividend yield of 0.5% considering the closing price of August 04th. The shares will go ex-dividends on the 16th August 2008 and the payment is scheduled to take place on August 25th 2008.
BIC Bank: Results for 2Q08 BIC Bank released the results for 2Q08, with a net profit of R$ 104.7 million, representing an increase of 13.9% for the quarter and a return on equity of 25.1%, also an increase of 2.0 p.p..
It should be noted that this result, just like the result for the previous quarter, was affected by the recognition of tax credits. During this quarter, the tax credits were recognized as a result of the change in the rate of social contribution.
A table below shows the principal indicators and results for the Bank.
Table 1: Results
2Q08(a) 1Q08(b) (a)/(b) 2Q07 (c) (a)/(c) Net Income 104.7 91.9 13.9% 33.0 217.3% Net Income1 44.9 69.2 -35.1% 21.4 109.8% Stockholders' Equity1 1,670.6 1,596.9 4.6% 796.5 109.8% Average Assets 11,909 10,937 8.9% 8,858 34.4% Return on avarage equity 25.1% 23.0% 2.0 p.p. 16.6% 8.5 p.p. Adjusted Return on avarage equity1 10.8% 17.3% -6.6 p.p. 10.7% 0.0 p.p. Return on avarage assets 3.9% 3.6% 0.3 p.p. 1.7% 2.2 p.p.
Source: Company 1 Exclude fiscal credit
The Credit Portfolio recorded strong growth during the quarter of 18.1%, with the highlight being the
operations in the middle market (+20.5%). In the Financial System, the expansion during the quarter was 3.9% for the individual portfolio and 9.5% for the corporate portfolio, taking into account only the operations referenced for the rate of interest.
Table 2: Credit portfolio
2Q08(a) 1Q08(b) (a)/(b) 2Q07 (c) (a)/(c) Individuals 984 972 1.2% 995 -1.1% - Payroll Loans 425.0 443.3 -4.1% 497 -14.4% - Personal Loans 115.6 136.6 -15.4% 125.2 -7.7% - Others 443.5 392.1 13.1% 373.2 18.8% Middle 8,187 6,794 20.5% 4,850 68.8% Total 9,172 7,766 18.1% 5,845 56.9%
Source: Company, not included loans assignment with recourse
This strong growth led the provision for loan losses to increase by 10.7% with this, the allowance for loan losses over the total loans reach 1.9%, stable in comparison with the previous quarter. The coverage for credit due reached 260.7%, a significant improvement over 1Q08 (137.6%).

Daily Brazil
August 07 2008
Banco Espírito Santo de Investimento, S.A. - 7 - Equity Iberia - Brazil
With regard to the D-H portfolio coverage reached 68.5% showing a deteriorating position compared with 1Q08 (78.8%).
The strong growth in the credit portfolio wound up benefiting the financial margin of the bank, which reached 9.6%, representing a growth of 0.6 p.p. compared to 1Q08. The table below displays the behavior of the financial margin.
Table 3: Financial Margin
(R$ million)
2Q08(a) 1Q08(b) (a)/(b) 2Q07 (c) (a)/(c) Financial margin (A) 242.6 220.5 10.0% 143.1 69.5% Provision for loan losses 39.2 35.4 10.7% 36.2 8.3%
Financial margin after provision for loan losses (B) 203.4 185.1 9.9% 106.9 90.3% Average Assets (C) 10,102 9,745 3.7% 7,769 30.0% Net interest margin before provision (A/C) 9.6% 9.1% 0.6 p.p. 7.4% 2.2 p.p. Net interest margin after provision (B/C) 8.1% 7.6% 0.5 p.p. 5.5% 2.5 p.p.
Source: Company
Expenditures increased by 4.6% during the quarter, with highlights for the administrative expenditures that increased by 18.4%. Despite this increase, the index of efficiency continue to present a declining trend line during 2Q08 and reached 34.8% (-2.1 p.p.).
The Basle index was 14.9%, a reduction of 4.3 p.p. against 1Q08 and was impacted by the new methodology for calculating exchange-rate exposure, according to the bank.
Opinion: We like the growth in the credit portfolio and the improvement in financial margins. On the other hand, the results for operations reached R$ 109.6 million, finishing 3.2% lower than in 1Q08 because of higher administrative expenses and a growth in the lineup other operating expenses (as a function of fiscal and tax contingencies) that were R$ 37.8 million, against R$ 14.8 million in 1Q08.
TELECOM / IT / MEDIA
Bematech: Interest on Equity News: Bematech (BEMA3) announced the payment of Interest on Equity in the gross amount of R$ 0.05/share, equivalent to a dividend yield of 0.69% per share, based on the stock quote of August 5, R$ 7.28. The payment will be made up to August 31. Company’s stocks will be traded “ex-interest on equity” as of August 6.
Datasul: Good 2Q08 results, EGM expected on August 19 Datasul (DSUL3) reported its 2Q08 results. The numbers were very positive, but should not be a catalyst for the stock, given the expectation ahead of the Extraordinary General Meeting (EGM) on August 19, which will decide on the sale of the company to TOTVS (TOTS3). Net revenue was R$75.0 million, growing 17.3% sequentially and 39.2% year on year. EBITDA was R$17.2 million, up 37.0% sequentially and 50.0% year on year, while EBITDA margin was 23.0%, expanding 3.3 p.p. against 1Q08 and 1.7 p.p. versus 2Q07. Lastly, net income was R$11.2 million, growing 33.4% on 1Q08 and 47.9% from a year earlier.
Table 1: Datasul – 2Q08 Financial Results
R$ Million 2Q08 (a) 1Q08 (b) (a)/(b) 2Q07 (c) (a)/(c) Net Revenue 75.0 64.0 17.3% 53.9 39.2% EBITDA 17.2 12.6 37.0% 11.5 50.0% EBITDA Margin 23.0% 19.6% 3.3 p.p. 21.3% 1.7 p.p. Net Income 11.2 8.4 33.4% 7.6 47.9%
Source: BES Securities and Datasul
Daily Brazil
August 07 2008
Banco Espírito Santo de Investimento, S.A. - 8 - Equity Iberia - Brazil
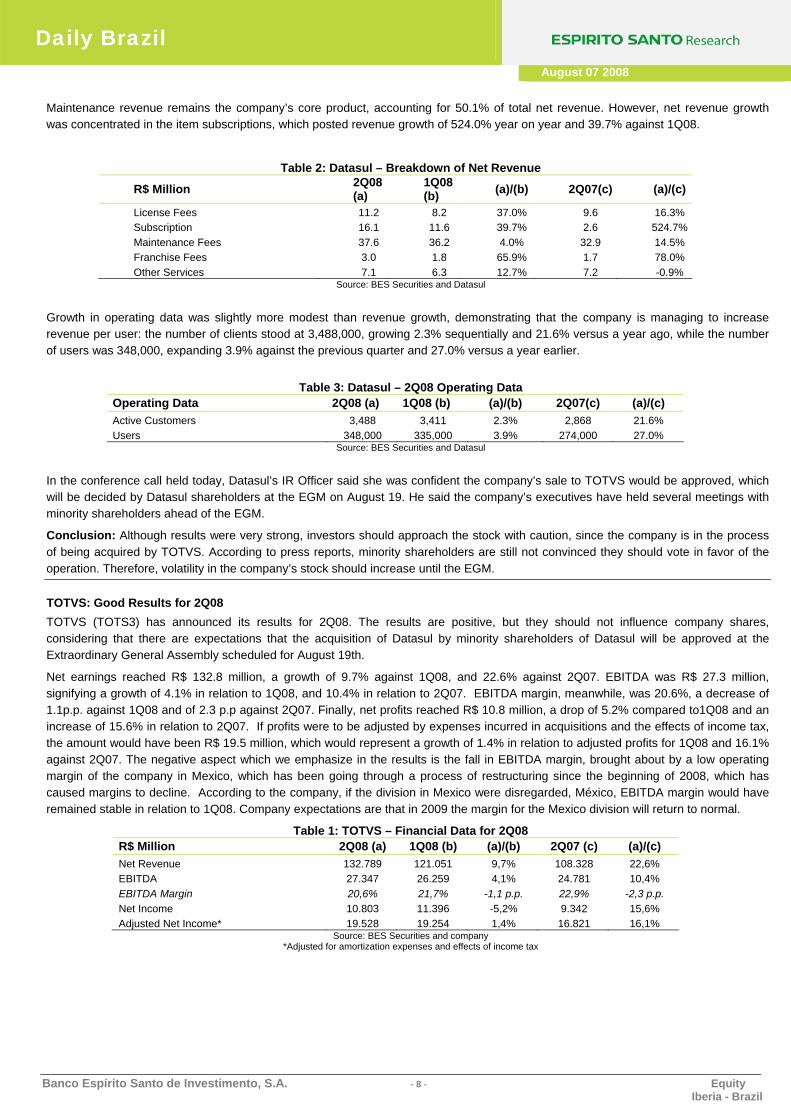
Maintenance revenue remains the company’s core product, accounting for 50.1% of total net revenue. However, net revenue growth was concentrated in the item subscriptions, which posted revenue growth of 524.0% year on year and 39.7% against 1Q08.
Table 2: Datasul – Breakdown of Net Revenue
R$ Million 2Q08 (a)
1Q08 (b) (a)/(b) 2Q07(c) (a)/(c)
License Fees 11.2 8.2 37.0% 9.6 16.3% Subscription 16.1 11.6 39.7% 2.6 524.7%Maintenance Fees 37.6 36.2 4.0% 32.9 14.5% Franchise Fees 3.0 1.8 65.9% 1.7 78.0% Other Services 7.1 6.3 12.7% 7.2 -0.9%
Source: BES Securities and Datasul
Growth in operating data was slightly more modest than revenue growth, demonstrating that the company is managing to increase revenue per user: the number of clients stood at 3,488,000, growing 2.3% sequentially and 21.6% versus a year ago, while the number of users was 348,000, expanding 3.9% against the previous quarter and 27.0% versus a year earlier.
Table 3: Datasul – 2Q08 Operating Data
Operating Data 2Q08 (a) 1Q08 (b) (a)/(b) 2Q07(c) (a)/(c) Active Customers 3,488 3,411 2.3% 2,868 21.6% Users 348,000 335,000 3.9% 274,000 27.0%
Source: BES Securities and Datasul
In the conference call held today, Datasul’s IR Officer said she was confident the company’s sale to TOTVS would be approved, which will be decided by Datasul shareholders at the EGM on August 19. He said the company’s executives have held several meetings with minority shareholders ahead of the EGM.
Conclusion: Although results were very strong, investors should approach the stock with caution, since the company is in the process of being acquired by TOTVS. According to press reports, minority shareholders are still not convinced they should vote in favor of the operation. Therefore, volatility in the company’s stock should increase until the EGM.
TOTVS: Good Results for 2Q08 TOTVS (TOTS3) has announced its results for 2Q08. The results are positive, but they should not influence company shares, considering that there are expectations that the acquisition of Datasul by minority shareholders of Datasul will be approved at the Extraordinary General Assembly scheduled for August 19th.
Net earnings reached R$ 132.8 million, a growth of 9.7% against 1Q08, and 22.6% against 2Q07. EBITDA was R$ 27.3 million, signifying a growth of 4.1% in relation to 1Q08, and 10.4% in relation to 2Q07. EBITDA margin, meanwhile, was 20.6%, a decrease of 1.1p.p. against 1Q08 and of 2.3 p.p against 2Q07. Finally, net profits reached R$ 10.8 million, a drop of 5.2% compared to1Q08 and an increase of 15.6% in relation to 2Q07. If profits were to be adjusted by expenses incurred in acquisitions and the effects of income tax, the amount would have been R$ 19.5 million, which would represent a growth of 1.4% in relation to adjusted profits for 1Q08 and 16.1% against 2Q07. The negative aspect which we emphasize in the results is the fall in EBITDA margin, brought about by a low operating margin of the company in Mexico, which has been going through a process of restructuring since the beginning of 2008, which has caused margins to decline. According to the company, if the division in Mexico were disregarded, México, EBITDA margin would have remained stable in relation to 1Q08. Company expectations are that in 2009 the margin for the Mexico division will return to normal.
Table 1: TOTVS – Financial Data for 2Q08 R$ Million 2Q08 (a) 1Q08 (b) (a)/(b) 2Q07 (c) (a)/(c) Net Revenue 132.789 121.051 9,7% 108.328 22,6% EBITDA 27.347 26.259 4,1% 24.781 10,4% EBITDA Margin 20,6% 21,7% -1,1 p.p. 22,9% -2,3 p.p. Net Income 10.803 11.396 -5,2% 9.342 15,6% Adjusted Net Income* 19.528 19.254 1,4% 16.821 16,1%
Source: BES Securities and company *Adjusted for amortization expenses and effects of income tax

Daily Brazil
August 07 2008
Banco Espírito Santo de Investimento, S.A. - 9 - Equity Iberia - Brazil
All components of the company’s gross earnings display a good development, both in comparison with 1Q08 as well with 2Q07. The key highlight in its growth was service revenues, which showed a growth of 13.1% in 2Q08 against 1Q08, and user licenses which grew by 35.1% in relation to 2Q08.
Table 2: TOTVS – Opening of Gross Earnings for 2Q08
Million 2Q08 (a) 1Q08 (b) (a)/(b) 2Q07 (c) (a)/(c) License Fees 37,697 34,522 9.2% 27,908 35.1% Services 51,976 45,938 13.1% 42,359 22.7% Maintenance 59,660 57,099 4.5% 49,481 20.6%
Source: BES Securities and company
With regard to operating data, the key highlight involved sales of new Vitrine software licenses for customers who were already part of the company’s customer base, which exhibited growth of 67.1% against 1Q08. The negative aspect to be noticed is with relation to sales of software licenses (other than Vitrine and BCS) to clients of the customer base which fell by 32.7% in relation to 1Q08.
Table 3: TOTVS – Operating data for 2Q08
Operating Data 2Q08 (a) 1Q08 (b) (a)/(b) 2Q07 (c) (a)/(c) New clients 353 293 20,5% 336 5,1% Software (other than Vitrine and BCS) Base clients 996 1.481 -32,7% 882 12,9% New clients 160 142 12,7% - - Vitrine Base clients 132 79 67,1% - - New clients 7 - - - - BCS Sisjuri
Base clients 358 - - - - Source: BES Securities and company
Conclusion: The results are positive, but they should not cause an impact on company shares, inasmuch as there are market expectations concerning the approval of the acquisition of Datasul by Datasul’s own minority shareholders. According to the press, the minority shareholders of Datasul are not yet convinced to vote in favor of the operation. Therefore, it is necessary to be cautious as well with the shares of TOTVS.
15th Telesintese Gathering: Focus is on the new PGO At an event held yesterday in Brasília by Momento Editorial, entitled the 15th Telesintese Gathering, executives of various operators and institutions of the telecommunications industry presented their visions on the change of the regulatory framework which is under way through the new PGO (General Licensing Plan) and the PGR (General Plan for the updating of Regulations). The theme of the gathering was: The new telecommunications policy and regulatory changes: where does Brazil want to be?
As was to be expected, the small operators defended aspects of the new regulatory framework that promote competition, while incumbents focused on two obligations imposed on them by Anatel in the new PGO: (i) the need for separation of companies between public telephony and broad band, and (ii) the need for a transfer of license in the event of the sale of any of the company’s assets (broad band, public telephony, mobile telephony, etc.).
We underscore the following most significant aspects of the event:
Anatel: we believe that the most important news announced by the president of Anatel, Ronaldo Sardenberg, was that the Agency has hired a consultant to evaluate the impact of the separation between fixed telephony and broad band. The study should be ready in 60 days and should help Anatel in deciding whether or not to maintain this requirement of the licensees. In this light, it is our understanding that the approval of the new PGO must be contingent upon this study.
GVT (GVTT3): GVT's Vice President for Regulatory Affairs, Carlos Alberto Nunes, referring to NET (NETC4), said that there cannot continue to be a regulatory environment in which one single player can provide video service. In the current situation, neither the incumbents nor the entrants can offer service directly. In order for them to be able to offer triple-play, for example, they have to do what the incumbents did: (i) purchase a company with a TVA license (Pay-TV), for example, the purchase of TVA company by Telefônica; (ii) or purchase a Cable TV company (CATV), for example, the purchase of Way-TV by Oi. Finally, he also said that GVT, in moving to expand its telephony network, has suffered from the high costs of municipal taxes, which in some cases reach up to 22% of the rate.

Daily Brazil
August 07 2008
Banco Espírito Santo de Investimento, S.A. - 10 - Equity Iberia - Brazil
Telefônica (TLPP3 and TLPP4): Telefônica’s Vice President for Strategic and Regulatory Planning, Mauricio Giusti, believes that the company separation generates inefficiency and increases costs for licensees. He also said that this requirement would give rise to something that doesn’t make sense: if the Telefônica concession were sold, for example, the mobile telephony part would also have to be sold.
Oi (TNLP3, TNLP4): with regard to the company separation in the new PGO, Oi president Luiz Eduardo Falco emphasized that the measure, in addition to being illegal, infringing the LGT (General Law of Telecommunications), will increase the price of broad band for Oi by around 10%. This cost, according to him, will be passed along in prices. Furthermore, he estimated, by the end of the concession in 2025, the additional taxes generated by the separation would be on the order of R$3.5 billion. In closing, he defended once again the merger with BrT on the basis of three arguments: (a) the creation of a Brazilian multinational; (b) the generation of a new R&D cycle encouraged by the new business, and (c) the possibility of facing up to the foreign multinationals operating in Brazil, Telmex and Telefônica, with a large group.
ELECTRIC UTILITIES
Equatorial: 2Q08 Results Preview
Company Ticker Rating Target Price Upside Last Price R$ YTD P/E 08E EV/EBTIDA 08E DY 08EEQUATORIAL ON eqtl3 BUY 24.0 57.9% 15.2 - 7.24 3.6 12.8%
Analyst: Gilberto Pereira de Souza - [email protected] (11) 3074 7325Analyst: Alexandre Kogake Claudio - [email protected] (11) 3074 7327
Equatorial will report its results on August 12, 2008 after market close. This is the second quarter in which the company will report consolidated results that include its 25.0% share in Light. To facilitate comparison between the periods, we made a pro forma consolidation of the previous quarters. Energy supply considers 100% of Cemar and 25% of Light.
Table: Result estimates – 2Q08 PREVIEW 2Q08E (a) 1Q08 (b) (a) / (b) 2Q07 (c) (a) / (c) Energy supplied (GWh) 2,033 1,975 2.9% 1,951 4.2%Residential 847 848 -0.1% 801 5.7%Industrial 247 217 14.1% 240 3.1%Commercial 544 534 1.9% 521 4.4%Other segments 395 377 4.8% 389 1.6%
Result (R$ milhões)Net Revenues 543 560 -3.1% 561 -3.3%Part A margin 274 272 0.5% 307 -10.7%gross margin 50.4% 48.6% 1.8 p.p. 54.6% -4.2 p.p.EBIT 132 126 5.3% 169 -21.5%EBITDA 174 165 5.6% 207 -15.9%EBITDA margin 32.1% 29.5% 2.7 p.p. 36.9% -4.8 p.p.Net profit 47 72 -34.3% 117 -59.6%
Source: Equatorial and Espirito Santo Research
We are updating our projections based on Equatorial's 1Q08 results, the latest valuation of Light, and macroeconomic premises. The main reason for raising Equatorial's price target was the change in Light’s price target from R$ 29.20 to R$ 31.10 per share. In the current valuation, Cemar and Equatorial holding represent R$ 16.20 per share and their stake in Light R$ 7.80 per share.
Valuation. Considering the closing price on August 6, 2008, Equatorial (Cemar asset) is currently trading at a net EV/BRR multiple of 1.36x, which is in line with the 1.34x for the energy distributors in our coverage universe (Eletropaulo, Light and Coelce). We believe that Equatorial should trade in higher multiples due to its lower manageable costs in comparison with the reference company (60% of ER) and better growth prospects for the market in its area of concession. Hence, we reiterate our BUY recommendation for Equatorial's shares with the price target of R$24.0 per share and upside potential of 57.9% for the end of 2008.

Daily Brazil
August 07 2008
Banco Espírito Santo de Investimento, S.A. - 11 - Equity Iberia - Brazil
RETAIL
GPA: 2Q08 Operational Result in Line with Expectations
Company Ticker Rating Target Price Upside Last Price R$ YTD P/E 08E EV/EBTIDA 08E DY 08EPÃO AÇUCAR PN pcar4 NEUTRAL 45.4 22.7% 37.0 8.3 20.4 8.6 1.2%
Analyst: Luiz Carlos Cesta - [email protected] (11) 3074 7322 The Pão de Açúcar Group (GPA) has published its results for 2Q08, reporting EBITDA of R$ 303.7 million (2.3% less than we had estimated) and net earnings of R$ 60 million (23.7% less than we had forecast).
Gross margin 40 bps lower than estimated
The company's gross margin was 40 bps less than we had estimated and 200 bps less than reported in 2Q07. We had already expected some narrowing in margins on an annual comparison given the absorption of the Assai store chain into the main company, as well as the increased participation of non-food sales as a percentage of the total, which have relatively tighter margins (although a higher average ticket). Despite this, the company announced that: (i) maintaining its strategy of competitive prices, (ii) the selling of non-food products at a relatively low price as a consequence of promotions and, (iii) the change in ICMS taxation in the state of São Paulo (which no longer allows deductions from gross revenue to be included in the company's costs), were all responsible for this drop.
Expenses (before tax) lower than estimated
Despite the fact that the incorporation of the Assai chain has reduced the company's gross margins, operational expenses in relation to net revenues have also come down due to the fact that this format operates on a lower expense budget. Thus, operational expenses (before tax) represented 18.4% of net revenues, being in line with our expectations. Compared to 2Q07,operational expenses as a proportion of net sales dropped by 260 bps.
Conclusion
The result for 2Q08 can be considered positive, given that they show a trend of improving margins for the next few quarters. Despite this, we believe that this improvement had to a certain extent been built in to the company's share price. We are therefore maintaining our NEUTRAL recommendation for the shares.
Marisa: 2Q08 Results
Marisa disclosed its earnings for 2Q08, with net revenues of R$ 355.9 million, EBITDA of R$ 71.8 million and net income totaling R$ 29.6 million, numbers slightly higher than average market expectation. The increase in sales through the same stores concept was 5.8% higher than 2Q07, growth under that foreseen by the company for the current year (8-10%), although justifiable by the strong comparison base (SSS in 2Q07 was 22.7%). The negative results in the Northeast region (mainly due to greater selectivity of the Marisa Card in this region due to higher payment default rates), where sales were under the average of the other regions, also contributed to numbers below the guidance. However, according to the company, in the month of July it was possible to observe a two-digit increase in same store sales.
The retail operation posted a net profit of R$ 27.4 million in the period, which represented a slight increase over the R$ 27.2 million recorded in 2Q07. For its part, the Marisa Card operation (financial services) obtained a R$ 2.2 million net profit in 2Q08, compared to a R$ 5.4 million for the same period last year. This improvement was mainly a result of the increase in interest-bearing installment sales and a greater control of Marisa Card losses, which wound up helping the company’s consolidated income, different from 2Q07 and also 1Q08 when the financial services negatively impacted earnings.
R$ Million 2Q08 (a) 1Q08 (c) (a) / (b) 2Q07 (b) (a) / (c)
Net Revenue 355,9 255,8 39,1% 300,1 18,6% Gross Profit 182,0 114,0 59,6% 155,1 17,3% Gross Margin 51,1% 44,6% 6,6 p.p. 51,7% -0,5 p.p. EBITDA 71,8 -8,4 - 54,6 31,5% EBITDA Margin 20,2% -3,3% 23,5 p.p. 18,2% 2,0 p.p. Net Income 29,6 -12,4 - 21,9 35,2% Source: Marisa and BES Securities
The retail operation’s gross margin for the period was 52.3%, a decline of 1.7 p.p. compared to 2Q07’s gross margin. The reduction, according to the company, is justified by Winter product promotions resulting from higher temperatures in 2Q08.

Daily Brazil
August 07 2008
Banco Espírito Santo de Investimento, S.A. - 12 - Equity Iberia - Brazil
General and administrative expenses of the retail operation went from 5.7% in 2Q07 to 5.0% in the period, as a percentage of net income. Sales expenses in 2Q08 totaled R$ 106.8 million, compared to R$ 86.3 million in 2Q07, an increase of 1.0 p.p., analyzed as a percentage of net revenues.
The Marisa Card was responsible for 60.8% of the Company’s total sales in 2Q08 and, thus, represented a smaller share than registered in 2Q07, when it was 68.0%. This decline was due to the fact that 24% of the total sales area (213,000 m3) of the stores is newer than one year and sales through the Marisa Card have a lower penetration in new stores. It is important to note that the measures taken by the company to correct an aggressive policy of credit acceptance in the past few years are now being perceived in the results of this quarter, where there was better control of payment defaults.
Opinion: Positive. A good result, somewhat above the market consensus, positively impacted by better controls in the financial services division and the availability of credit, although without big surprises in the retail operations.
HEALTH CARE
Medial Saúde: Lower, but not a cause for concern Company Ticker Rating Target Price Upside Last Price R$ YTD P/E 08E EV/EBTIDA 08E DY 08E
MEDIAL ON medi3 BUY 37.7 121.7% 17.0 -26.9 9.1 6.0 1.0%Analyst: Juliana Chu - [email protected] (11) 3074 7320
Medial Saúde published its results for the 2Q08 revealing a poorer operational performance than we had been expecting, but one which did not produce much in the way of concern or surprises. The weaker result was caused for the most part by a higher medical loss ratio than we had been forecasting, and this attributed by the company to a spill over effect from the 1Q08.
The company’s net premiums for the 2Q08 came to a figure of R$ 459 million, with an adjusted medical loss ratio of 76.5% (utilizing the methodology adopted in the 1Q08), an adjusted EBITDA of R$ 7 million (an EBITDA margin of 1.6%) and an adjusted net profit of R$ 11 million. We had been estimating net premiums of R$ 463 million, a medical loss ratio of 74.4%, an EBITDA figure of R$ 12 million (an EBITDA margin of 2.7%) and an adjusted net profit of R$ 16 million.
It should also be borne in mind that in the 2Q08 for the very first time Medial Saúde gave a breakdown of the results by business units, posting a revenue of R$ 105.5 million and an operating profit of R$ 4.6 million for the hospital division, and a revenue of R$ 14.3 million and an operating profit of R$ 0.7 million for the diagnostics division.
The 2Q08’s results mean that the company maintains its original expectations regarding its medical loss ratio this year in between 70% and 72% using the former methodology and a level of between 68% and 70% on the basis of the new methodology that began to be used from 1Q08 onwards. We also stress that Medial recently implemented a new line of products, concentrated on 2 special lines, and that the impact of this new strategy should be seen over the next few quarters.
Taking into account this performance and the future outlook for the company, we are maintaining our BUY recommendation for Medial Saúde’s shares with a target price of R$ 37.7/share.
TAB. 1: RESULT SUMMARY 2Q08 2Q08E % 1Q08 % 2Q07 %
Plan Members ‘000s 1,403 1,409 -0.4% 1,386 1.3% 1,408 -0.3% R$ million Net Plan Premium 459 463 -0.8% 441 4.1% 394 16.5% Medical Loss Ratio 76.5% 74.4% 63.4% 77.2% Gross Profit 94 109 -13.1% 151 -37.6% 83 14.2% EBITDA adj 7 12 -39.8% 56 -86.9% 2 236.4% EBITDA Margin adj 1.6% 2.7% 12.8% 2.2% Net Profit (8) (4) 93.7% 24 -131.3% (6) 18.8%
Adjusted Net Profit 11 16 -30.5% 44 -75.6% 6 92.9% Source: Company and BES Securities

Daily Brazil
August 07 2008
Banco Espírito Santo de Investimento, S.A. - 13 - Equity Iberia - Brazil
AVIATION
GOL: Air Traffic Statistics for July/08. Gol Linhas Aéreas Inteligentes published its Air Traffic statistics for July/08 which revealed a 16.9% drop in the supply of seats (ASK) by comparison with June/08, coming out at a figure of 3,591 million. It is our assessment that this decrease is a result of the restructuring of the company’s flight network (that began on March/08) which has led to a reduction in the number of seats offered (ASK) both on the domestic market as well as on the international one. The number of passengers transported per kilometer flown (RPK) also showed a decrease in both markets by comparison with June/08. However, the smaller drop exhibited in the RPK, meant that in July/08 the company’s total occupation rate came out a figure of 64.7% which is 0.5 p.p. higher than the comparable figure observed for June/08.
Table 1. Air Traffic Statistics in July/08. Operational Data (Consolidated) Jul/08 (a) Jun/08 (b) (a)/(b) Jul/07 (c) (a)/(c) Total System ASK (mm) (1) 3.591 4.320 -16,9% 3.013 19,2% RPK (mm) (2) 2.323 2.774 -16,3% 2.063 12,6% Load Factor 64,7% 64,2% 0,5 p.p. 68,4% -3,8 p.p. Domestic Market ASK (mm) (1) 2.838 3.217 -11,8% 2.267 25,2% RPK (mm) (2) 1.769 2.133 -17,1% 1.565 13,0% Load Factor 62,3% 66,3% -4,0 p.p. 69,1% -6,7 p.p. International Market ASK (mm) (1) 753 1.103 -31,7% 747 0,9% RPK (mm) (2) 554 641 -13,6% 497 11,4% Load Factor 73,6% 58,1% 15,4 p.p. 66,6% 7,0 p.p.
1 Seat-Kilometer Offered
2 Passenger-Kilometer Transported
Source: the Company
Table 2. Air Traffic Statistics, by company, July/08. GTA Jul-08 Jun-08 % ASK (mm) 2.664 3.419 -22,1% RPK (mm) 1.713 2.234 -23,3% Load Factor 64,3% 65,4% -1,1 p.p. VRG Jul-08 Jun-08 ASK (mm) 927 901 2,9% RPK (mm) 610 540 13,0% Load Factor 65,8% 59,9% 5,9 p.p.
Source: the Company

Daily Brazil
August 07 2008
Banco Espírito Santo de Investimento, S.A. - 14 - Equity Iberia - Brazil
Graph 1. Change in the 12-month Occupation Rate.
-500
1.0001.5002.0002.5003.0003.5004.0004.5005.000
jul/07
ago/0
7se
t/07
out/0
7
nov/0
7
dez/0
7jan
/08fev
/08
mar/08
abr/0
8
mai/08
jun/08
jul/08
50%52%54%56%58%60%62%64%66%68%70%
ASK (million) RPK (million) Load Factor (Right Axes)
Opinion: This is negative for the company’s shares. Despite the lower growth in the number of seats offered (ASK) the company’s occupation rate posted a mere 0.5 p.p. growth vis-à-vis June/08. We draw attention to the fact that July is a vacation month and that the company’s occupation rate should have registered a greater growth under this comparison basis. Proof of this can be seen by comparing the figures from July/08 with those for July/07 which reveals a 3.8 p.p. drop in the occupation rate.
PULP/PAPER
VCP: Consolidation on the Way Company Ticker Rating Target Price Upside Last Price R$ YTD P/E 08E EV/EBTIDA 08E DY 08EVCP PN vcpa4 BUY 67.8 70.5% 39.8 -32.6 39.5 12.3 1.0%
Analyst: Juliana Chu - [email protected] (11) 3074 7320
VCP has announced the acquisition of the shares of Aracruz held by Arapar (Lorentzen), which can lead to a major step towards the consolidation of Brazil's paper and pulp industry. Assuming that the corporate restructuring that is being proposed is carried out, VCP would be on the way to becoming the world’s largest eucalyptus market pulp company.
ACQUISITION: The announcement involves the acquisition of 127,506,500 ordinary shares held by Arapar (Lorentzen), the equivalent to 28% of the ON shares of Aracruz and 12.4% of the company's total shares, by VCP and Votorantim Industrial (VDI).
PRICE: The amount involved in the operation is R$ 2.710 billion, or R$ 21.25/ ON share. VCP has indicated that it has received a commitment from 3 banks (Caylon, Santander and HSBC) for the funding of this operation.
REORGANISATION: VCP is also proposing corporate restructuring, with the aim of merging VCP and Aracruz, which is conditional on Arainvest (Safra) waiving its right of preference and joint sale. Arainvest has 90 days to announce its decision.
It should be borne in mind that the Arainvest group (Safra) holds 127,506,500 ON shares and 27,737,000 PN shares. For the reorganization, VCP has indicated that the swap ratio (taking a DCF valuation) could vary between 0.22 and 0.24 share of VCP for 1.00 share of Aracruz, including both the ON and PN.
SYNERGIES SAVINGS: Synergies savings of around R$ 4.5 billion have been indicated, which according to VCP should be mainly obtained through restructuring, in other words 80% of these savings is dependent on the merging of the two companies. This figure was calculated, considering aspects involving procurement, logistics, capital expenditure, etc.
OUR OPINION: We consider the acquisiton, as well as corporate restructuring, as being positive for the companies, particularly VCP. As a consequence, we are reiterating our BUY recommendation for the shares of VCP and Aracruz. However, we point out that Aracruz's share performance is likely to be linked to the swap ratio indicated by VCP, which leads us to recommend a BUY recommendation for the shares of Aracruz only if the price of the share is less than 0.24x to 0.22x of the price of VCP.

Daily Brazil
August 07 2008
Banco Espírito Santo de Investimento, S.A. - 15 - Equity Iberia - Brazil
REAL ESTATE
Cyrela Commercial Properties: 2Q08 Result
highlights 2Q08(a) 1Q08(b) (a)/(b) 1H08 (c) 1H07 (d) (c)/(d) Net Revenue 24.9 23.6 5.5% 48.5 37.1 30.7% Gross Profit 22.3 21.4 4.2% 43.7 27.0 61.9% Gross Margin 89.6% 90.7% -1.1 b.p. 90.1% 72.8% +17.3 b.p. EBITDA 20.3 19.0 6.8% 39.3 25.2 56.0% EBITDA Margin 81.5% 80.5% +1.0 b.p. 81.0% 67.9% +13.1 b.p. Net Income 8.3 7.5 10.7% 15.7 2.1 647.6% Net Margin 33.3% 31.8% +1.6 b.p. 32.4% 5.7% +26.7 p.p.
Source: Company.
* The company held its IPO in the first half of 2007, so there are no comparative figures relative to the 1Q07
The main 2Q08 highlights were: (1) the increased weight of the office buildings segment, whose share of gross revenue climbed from 54.2%, in the 1Q08, to 55.8%, with the addition of two new properties to the portfolio; and (2) the reduced vacancy rate, which fell from 8.3%. in the 1H07, to just 0.4% in the 2T08, reflecting greater sector demand for such developments.
The narrowing of the gross margin was chiefly due to the 127.7% quarter-over-quarter upturn in mall leasing costs to R$ 1.2 million, while the healthier EBITDA margin was due to the reduction in administrative expenses, which fell by 21.7% in the same period, closing the 2Q08 at R$ 1.8 million.
The company’s greatest risk lies in the concentration of leasing contract renewals in any given period. Currently, maturities are concentrated in 2011 (22%) and 2013 (39%), with 2008, 2009 and 2010 accounting for 3%, 12% and 15%, respectively.
In addition to its results, CCP announced an agreement with AMB Property Corporation to develop projects in Brazil’s industrial segment. The two companies will retain 50% each of the new venture, but no further details are available as yet. The industrial leasing segment accounts for around 6.7% of CCP’s total revenue.
Abyara/Brasil Brokers: Details of the Acquisition of Brasil Brokers News: Brasil Brokers has reached a deal to acquire a controlling interest (51%) in Abyara Intermediação Imobiliária (Abyara’s property brokerage, consulting and advisory assets), with an option to acquire the remaining 49% over the next three years (14.5% in the first and second years and 20% in the third year). The total value of the acquisition is R$ 250 million, with a down payment of R$ 150 million and the payment of R$ 50 million within 120 days and R$ 50 million within 180 days. The transaction will be made in two phases: in the first, BR Brokers will subscribe R$ 176 million in stock issued by Abyara Brokers (the new company to be constituted following the acquisition – see Chart 1). In the second, Brasil Brokers will buy the stock that Abyara Planejamento Imobiliário holds in Abyara Brokers over a period of three years if it exercises the put and call options guaranteed to each other under the agreement. Another important aspect of the transaction is the need for the new company, Abyara Brokers, to pay out 100% of its net income as dividends after one year of operations.

Daily Brazil
August 07 2008
Banco Espírito Santo de Investimento, S.A. - 16 - Equity Iberia - Brazil
Bear in mind that the earn-out process presented for 2009 and 2010 will be based on the net income of Abyara Brokers in the previous four quarters and the P/E multiple of Brasil Brokers in the previous 60 trading sessions, with the application of a 35% discount on both figures. The potential acquisition in 2011 will follow the same methodology for the two previous years, except that it will use the average net income and average P/E multiple of the periods to calculate the exercise price.
Therefore, if we consider that the new company may be fully acquired by Brasil Brokers after the last earn-out phase, we estimate the 2007 results of the company together with the operations of Brasil Brokers as follows:
*At end of earn-out process.
Comment: Our opinion is that the news is positive for Brasil Brokers, but negative for Abyara.
For Brasil Brokers, the synergy gains will be captured by the addition to its operations of R$12.0 billion in potential sales and 1,158 brokers. For Abyara, the sale of part of its brokerage operations could adversely impact its results going forward, given that at the close of 2007 the brokerage segment accounted for approximately 27.7% of gross revenue, 91.3% of EBITDA and practically 100% of net income.
Chart 1: Creation of Abyara Broker Chart 2: Potential Acquisition – Sep. 2009
BRASILBROKERS
ABYARA
ABYARABROKERS
R$ 176,0 milionR$ 169.9 milion in financial liabilities
49% 51%
BRASILBROKERS
ABYARA
ABYARABROKERS
Dividends Dividends
34.5% 65.5%
Chart 3: Potential Acquisition – Sep. 2010 Chart 4: Potential Acquisition – Sep. 2011
BRASILBROKERS
ABYARA
ABYARABROKERS
Dividends20% 80%
Dividends
BRASILBROKERS
ABYARA
ABYARABROKERS
Dividends100%
Dividends
Source: Brasil Brokers. Source: Brasil Brokers.
Table 1: Operating Indicators
Indicators 2007 Brasil Brokers Abyara *Abyara Brokers Net Revenue 27,9 64,2 92,1 EBITDA 10,3 32,8 43,1 EBITDA margin 36,9% 51,1% 46,8% Net Income 9,2 27,0 36,2 Net Margin 33,0% 42,1% 39,3%
Backlog to 2009 (R$ Bi) 32,0 12,3 44,3 Launches (R$ MM) 3.199 600 3.799 Sold units (R$ MM) 11.360 2.184 13.544 Contracted Sales (R$ MM) 2.404 598 3.002 Brokers 7.076 1.115 8.191
Source: Companies.

Daily Brazil
August 07 2008
Banco Espírito Santo de Investimento, S.A. - 17 - Equity Iberia - Brazil
The price paid by Brasil Brokers for Abyara Brokers suggests a value of approximately R$656.8 million for this operation, which indicates an EV/EBITDA ’07 multiple of 20.0x. Lopes is currently trading at roughly 15.7x actual EBITDA in 2007.
We believe that with this operation Abyara is moving forward in its strategy of focusing operations on its property development operations, which the company launched approximately one year ago. Note that Abyara closed 1Q08 with net debt of R$363.5 million.
EDUCATION
Kroton: 2Q08 Results. Kroton Educacional has announced its results for 2Q08, presenting net revenues of R$ 70.2 million, EBITDA of R$ 8.0 million and net profits of R$ 5.8 million.
Table 1. 2Q08 Results
R$ 000' 2Q08(a) 1Q08(b) (a/b) 2Q07*(c) (a/c) Net Revenue 70.218 70.985 -1,1% 33.085 112,2% K - 12 24.127 37.831 -36,2% 16.356 47,5% Post Secondary 46.091 33.114 39,2% 16.317 182,5% Others 0 40 - 412 - Gross Profit 21.768 39.947 -45,5% 15.341 41,9% Gross Margin 31,0% 56,3% -25,3 p.p. 46,4% -15,4 p.p. EBITDA Adj. 8.011 25.947 -69,1% 5.703 40,5% EBITDA Margin 11,4% 36,6% -25,1 p.p. 17,2% -5,8 p.p. Net Profit 5.815 25.627 -77,3% 3.329 74,7% 0 0 0 0 0
Net Debt (216.910) (287.100)
Avg. Students - Post Secundary 35.442 23.560 50,4% 10.803 228,1% *2T07 Adjusted for IPO expenses (R$ 0,9 milhões)
Source: Company.
As a result of seasonality shown in operations of basic instruction, which concentrates a large part of its revenues in the first quarter of each year, the comparison with 1Q08 is rendered problematic.
Net revenues: Kroton presented net revenues of R$ 70.2 million, which constitutes a growth of 112.2% compared to 2Q07. This growth is the consequence of the increase in the average number of enrolled students, chiefly in the higher education segment, which grew by 228.1% in the same period of comparison. Such growth occurred as a result of the acquisitions made and the opening of new campuses. For the first time, Kroton registered (65.6%) of revenues coming from post secondary in the company’s total net revenues.
Table 2. Composition of net earnings.
Sales Mix 2Q08(a) 1Q08(b) (a/b) 2Q07(c) (a/c) Post
Secundary 65,6% 46,6% 19,0
p.p. 49,3% 16,3
p.p.
K - 12 34,4% 53,3% -
18,9 p.p. 49,4% -
15,1 p.p.
Others 0,0% 0,1% -0,1
p.p. 1,2% -1,2
p.p. Source: Company.
Gross Profits/Gross Margin: The company reported gross profits of R$ 21.8 million, exhibiting growth of 41.9% compared to 2Q07. Gross margin of 31.0% remained 15.4 percentage points below the margin presented in 2Q07 of 46.4%. This decline is related to the process of maturation of the existing campuses, the change in the company’s mix of revenues and the transition of units acquired to Kroton’s operational model.
EBITDA/EBITDA Margin: EBITDA of R$ 8.0 million represented a growth of 40.5% compared to the same period in 2007. In spite of this gain in EBITDA, as a result of the increase in the size of the company, EBITDA margin of 11.4% went down by 5.8 p.p. compared to 2Q07, chiefly represented by greater expenses on sales and personnel, beyond those noted above, as a result of the absorption and inauguration of new units.
Daily Brazil
August 07 2008
Banco Espírito Santo de Investimento, S.A. - 18 - Equity Iberia - Brazil
Net profits: As a result of the foregoing facts, net profits for the quarter reached R$ 5.8 million, a figure 74.7% higher than the same period in 2007.
Financial Revenues/Net Debt: Kroton showed financial revenues of R$ 2.3 million against R$ 1.6 million for 2Q07. This net balance is obtained has a result of financial revenues of R$ 6.9 million (the company is presenting net cash of R$ 216.9 million) and the revenue is the result of the application of the cash, as well as expenses of R$ 4.7 million, the expenses being for the most part the result of the discount given to students for timely payment of monthly fees.
Opinion: A positive result for the shares of Kroton, exceeding market expectations. The company is continuing with guidance for growth, and has doubled its revenues in the comparison between 1S08 vs. 1S07 (R$ 141.2 million and R$ 78.2 million respectively). The company is continuing with its efforts to reduce the seasonality of revenues and dispersal of margin, increasing its share of higher education, hoping the latter will achieve a 70% share of total net earnings by the end of 2008.
The company further stressed that in 2S08 it will commence operations with an INED unit (Technologic Courses), in the city of Contagem, and with distance learning.
Distance learning will have three avenues of development, as follows: i) 5 technology programs of study, with up to 10,000 places, 100% online with tests at any INED unit, 1x per semester; ii) degree programs in history and mathematics with up to 8,000 places, 100% online with a focus on schools involved in the training of teachers and tests at the Pitágoras campuses, and iii) a Bachelor’s program in pedagogy, partly requiring physical attendance, with a central pole in Belo Horizonte and Pitágoras units in Minas Gerais as EAD poles.
CAPITAL GOODS
Randon: 2Q08 Results
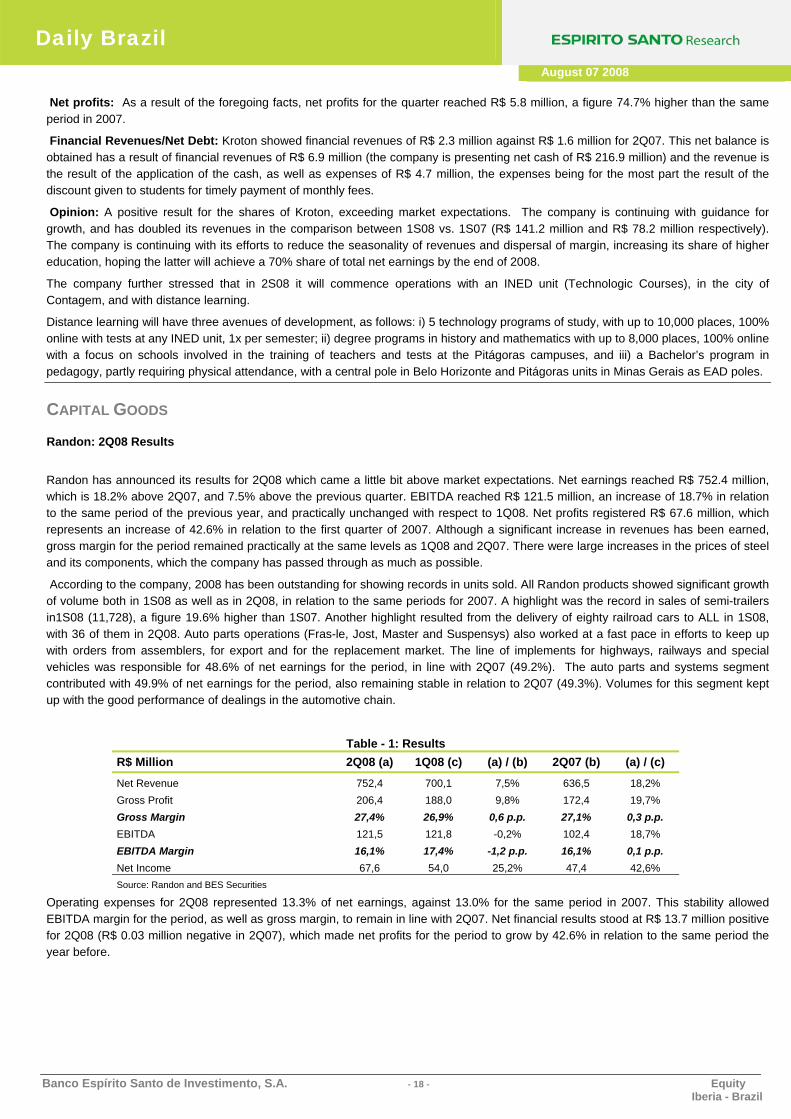
Randon has announced its results for 2Q08 which came a little bit above market expectations. Net earnings reached R$ 752.4 million, which is 18.2% above 2Q07, and 7.5% above the previous quarter. EBITDA reached R$ 121.5 million, an increase of 18.7% in relation to the same period of the previous year, and practically unchanged with respect to 1Q08. Net profits registered R$ 67.6 million, which represents an increase of 42.6% in relation to the first quarter of 2007. Although a significant increase in revenues has been earned, gross margin for the period remained practically at the same levels as 1Q08 and 2Q07. There were large increases in the prices of steel and its components, which the company has passed through as much as possible.
According to the company, 2008 has been outstanding for showing records in units sold. All Randon products showed significant growth of volume both in 1S08 as well as in 2Q08, in relation to the same periods for 2007. A highlight was the record in sales of semi-trailers in1S08 (11,728), a figure 19.6% higher than 1S07. Another highlight resulted from the delivery of eighty railroad cars to ALL in 1S08, with 36 of them in 2Q08. Auto parts operations (Fras-le, Jost, Master and Suspensys) also worked at a fast pace in efforts to keep up with orders from assemblers, for export and for the replacement market. The line of implements for highways, railways and special vehicles was responsible for 48.6% of net earnings for the period, in line with 2Q07 (49.2%). The auto parts and systems segment contributed with 49.9% of net earnings for the period, also remaining stable in relation to 2Q07 (49.3%). Volumes for this segment kept up with the good performance of dealings in the automotive chain.
Table - 1: Results R$ Million 2Q08 (a) 1Q08 (c) (a) / (b) 2Q07 (b) (a) / (c)
Net Revenue 752,4 700,1 7,5% 636,5 18,2% Gross Profit 206,4 188,0 9,8% 172,4 19,7% Gross Margin 27,4% 26,9% 0,6 p.p. 27,1% 0,3 p.p. EBITDA 121,5 121,8 -0,2% 102,4 18,7% EBITDA Margin 16,1% 17,4% -1,2 p.p. 16,1% 0,1 p.p. Net Income 67,6 54,0 25,2% 47,4 42,6% Source: Randon and BES Securities
Operating expenses for 2Q08 represented 13.3% of net earnings, against 13.0% for the same period in 2007. This stability allowed EBITDA margin for the period, as well as gross margin, to remain in line with 2Q07. Net financial results stood at R$ 13.7 million positive for 2Q08 (R$ 0.03 million negative in 2Q07), which made net profits for the period to grow by 42.6% in relation to the same period the year before.

Daily Brazil
August 07 2008
Banco Espírito Santo de Investimento, S.A. - 19 - Equity Iberia - Brazil
For 2008, the company intends to invest R$ 250.0 million, a large part of it in increasing production capacity, a level 27% greater than that invested in 2007 (R$ 196.5 million), thus demonstrating confidence in the expansion of its business. Let us recall that in 1S08 R$ 98.5 million were entered as investment, against R$ 76.3 million in 1S07.
Opinion: Positive. Strong results. The automotive chain continues to harvest the fruits of the expansion of the economy. Randon's expectations for 2S08 point towards a promising semester, which is at the same time challenging, in view of the waiting list for implements and trucks caused by the increase in orders, in addition to the new forecast of a record agricultural harvest. Among these challenges, the company has listed inflationary pressure in the supply chain and inversion of the curve of the interest rate.
OTHERS
ANFAVEA: Very positive Jul/08 News: The National Association of Vehicle Manufacturers (ANFAVEA) released the results regarding the performance of the automotive industry for Jul/08. According to ANFAVEA, the commercialization of new vehicles achieved 288.1 thousand units, which represents a 12.5% increase comparing to previous month and 32.5% increase comparing to Jul/07. From Jan/08 to Jul/08, the automotive industry has achieved 1.7 million units commercialized, which represents an impressive 30.4% growth against the same period of previous year (1.3 million). The flex-fuel vehicles, which can run either with gasoline or ethanol (or any proportion of both) represented 87.6% of the total vehicles sold during 2008.
Opinion. Positive. The numbers for Jul/08 disclosed by ANFAVEA confirm an excellent moment that the whole automotive industry has been experiencing. We remember that such 30.8% growth until Jul/08 is well above the official guidance provided by ANFAVEA, which comprises growth around 24.0% for the industry in 2008. We believe such performance reported in Jul/08 may be received as positive not only for the automotive industry, but for companies from different sectors such as: Steel (Usiminas e CSN), Transports (Tegma) and Sugar & Ethanol (Cosan, Sao Martinho and Guarani).

Daily Brazil
August 07 2008
Banco Espírito Santo de Investimento, S.A. - 20 - Equity Iberia - Brazil
MACRO CALENDAR
Brazil
Date Local Time (BZ) Indicator Reference BES Estimates Consensus Last08-Aug 08:00 AM FGV CPI IPC-S AUG 7 0.53% - - 0.53%08-Aug 08:00 AM FGV Preview Inflation IGP-M AUG 7 0.14% - - 1.76%08-Aug 09:00 AM IBGE Inflation IPCA (MoM) JUL 0.55% 0.60% 0.74%08-Aug 09:00 AM IBGE Inflation IPCA (YoY) JUL 6.39% - - 6.06%08-Aug 09:00 AM IBGE Inflation INPC (MoM) JUL 0.60% - - 0.91%
International
Date Local Time (BZ) Indicator Reference BES Estimates Consensus Last07-Aug 08:00 AM UK BOE ANNOUNCES RATES AUG 7 - - 5.00% 5.00%07-Aug 08:45 AM EC ECB Announces Interest Rates AUG 7 - - 4.25% 4.25%07-Aug 09:30 AM US Initial Jobless Claims AUG 2 - - 420K 448K07-Aug 09:30 AM US Continuing Claims JUL 26 - - 3265K 3282K07-Aug 11:00 AM US Pending Home Sales MoM JUN - - -1.0% -4.7%07-Aug 04:00 PM US Consumer Credit JUN - - $6.8B $7.8B08-Aug 09:30 AM US Nonfarm Productivity 2Q P - - 2.5% 2.6%08-Aug 09:30 AM US Unit Labor Costs 2Q P - - 1.4% 2.2%08-Aug 11:00 AM US Wholesale Inventories JUN - - 0.6% 0.8%
Source: Bloomberg, BES Investimento.

Daily Brazil
August 07 2008
Banco Espírito Santo de Investimento, S.A. - 21 - Equity Iberia - Brazil
CORPORATE CALENDAR Company Date Events Detail
TIM 7-Aug 2Q08 Release Before Market Opening
TIM 7-Aug Conference Call 2Q08 13h00 Portuguese / 11h00 English
CVRD 7-Aug Conference Call 2Q08 11h00
Totvs 7-Aug Conference Call 2Q08 15h00 Portuguese / 13h00 English
Randon 7-Aug Conference Call 2Q08 -
Cteep 7-Aug 2Q08 Release -
DASA 7-Aug 2Q08 Release After Market Closing
Grupo Pão de Acúcar 7-Aug Conference Call 2Q08 14h00 Portuguese / English
B2W 7-Aug 2Q08 Release -
Kroton 7-Aug 2Q08 Release -
Brasil Ecodiesel 7-Aug 2Q08 Release -
Rodobens 7-Aug Conference Call 2Q08 10h00 Portuguese / 12h00 English
Camargo Corrêa 7-Aug Conference Call 2Q08 14h00 Portuguese / 13h00 English
Unibanco 7-Aug 2Q08 Release SP
BRMALLS 7-Aug Conference Call 2Q08 15h00 Portuguese / 16h00 English
Braskem 8-Aug Conference Call 2Q08 -
Ultrapar 8-Aug Conference Call 2Q08 -
B2W 8-Aug Conference Call 2Q08 -
Cesp 8-Aug 2Q08 Release After Market Closing
Kroton 8-Aug Conference Call 2Q08 -
Alpargatas 8-Aug 2Q08 Release -
Brasil Ecodiesel 8-Aug Conference Call 2Q08 -
Bovespa 8-Aug 2Q08 Release SP
Light 8-Aug 2Q08 Release After Market Closing
Iguatemi 11-Aug 2Q08 Release After Market Closing
Petrobras 11-Aug 2Q08 Release After Market Closing
Suzano Petroquímica 11-Aug 1Q08 Release -
Agrenco 11-Aug 2Q08 Release -
CCR 11-Aug 2Q08 Release -
Cemig 11-Aug 2Q08 Release After Market Closing
Globex 11-Aug 2Q08 Release After Market Closing
Pine 11-Aug 2Q08 Release SP
Banco ABC 11-Aug 2Q08 Release SP
Banco Paraná 11-Aug 2Q08 Release SP
Positivo 12-Aug 2Q08 Release -
Amil 12-Aug 2Q08 Release -
Eletrobras 12-Aug 2Q08 Release -
Embraer 12-Aug Analysts Meeting -
Brascan Residential 12-Aug 2Q08 Release After Market Closing
Braskem 12-Aug Analysts Meeting SP
CPFL 12-Aug 2Q08 Release After Market Closing
Duratex 12-Aug 2Q08 Release -
Amil 12-Aug Conference Call 2Q08 15h00
Agrenco 12-Aug Conference Call 2Q08 -
GOL 12-Aug 2Q08 Release Before Market Opening
GOL 12-Aug Conference Call 2Q08 12h00 English / 13h30 Portuguese
Cemig 12-Aug Conference Call 2Q08 9h00
Globex 12-Aug Conference Call 2Q08 -
Banrisul 12-Aug 2Q08 Release SP
Sofisa 12-Aug 2Q08 Release SP
Light 12-Aug Conference Call 2Q08 16h00
Marfrig 12-Aug 2Q08 Release -

Daily Brazil
August 07 2008
Banco Espírito Santo de Investimento, S.A. - 22 - Equity Iberia - Brazil
Equatorial 12-Aug 2Q08 Release After Market Closing
Cesp 13-Aug Conference Call 2Q08 10h00 Portuguese / 11h00 English
Eletropaulo 13-Aug 2Q08 Release After Market Closing
CPFL 13-Aug Conference Call 2Q08 11h00
AES Tietê 13-Aug 2Q08 Release After Market Closing
Renner 13-Aug 2Q08 Release After Market Closing
Providência 13-Aug 2Q08 Release -
Petrobras 13-Aug Conference Call 2Q08 -
Multiplan 13-Aug 2Q08 Release After Market Closing
Eletrobras 13-Aug Conference Call 2Q08 -
Copel 13-Aug 2Q08 Release -
Fertilizantes Heringer 13-Aug 2Q08 Release -
ALL 13-Aug Conference Call 2Q08 -
CSU 13-Aug Conference Call 2Q08 11hs Portuguese / 12hs English
Wilson Sons 13-Aug 2Q08 Release -
Positivo 13-Aug Conference Call 2Q08 -
Tractebel 13-Aug 2Q08 Release After Market Closing
Gafisa 14-Aug 2Q08 Release After Market Closing
PDG Realty 14-Aug 2Q08 Release After Market Closing
Company 14-Aug 2Q08 Release After Market Closing
Abyara 14-Aug 2Q08 Release After Market Closing
Unipar 14-Aug 2Q08 Release -
Brasil Brokers 14-Aug 2Q08 Release After Market Closing
Anhanguera 14-Aug 2Q08 Release -
Tempo 14-Aug 2Q08 Release -
Even 14-Aug 2Q08 Release After Market Closing
General Shopping 14-Aug 2Q08 Release After Market Closing
OHL 14-Aug 2Q08 Release After Market Closing
Klabin Segall 14-Aug 2Q08 Release After Market Closing
MRV 14-Aug 2Q08 Release After Market Closing
CCP 14-Aug 2Q08 Release -
Inpar 14-Aug 2Q08 Release After Market Closing
Brasil Brokers 14-Aug 2Q08 Release After Market Closing
Grupo Pão de Acúcar 14-Aug Same-Store-Sales -
Copasa 14-Aug 2Q08 Release -
Equatorial 14-Aug Conference Call 2Q08 14h00 Portuguese / 12h00 English
Ambev 14-Aug 2Q08 Release -
Celesc 14-Aug 2Q08 Release -
Providência 14-Aug Conference Call 2Q08 -
Minerva 14-Aug 2Q08 Release -
Estacio 14-Aug 2Q08 Release -
SEB 14-Aug 2Q08 Release -
Lupatech 14-Aug 2Q08 Release After Market Closing
Grendene 14-Aug 2Q08 Release After Market Closing
Cia Hering 14-Aug 2Q08 Release -
Fertilizantes Heringer 14-Aug Conference Call 2Q08 11h00 Portuguese / 11h00 English
Tegma 14-Aug 2Q08 Release -
Coelce 14-Aug 2Q08 Release -
Wilson Sons 14-Aug Conference Call 2Q08 -
TAM 14-Aug 2Q08 Release Before Market Opening
Cyrela Brazil Realty 14-Aug 2Q08 Release After Market Closing
Rossi Residencial 14-Aug 2Q08 Release After Market Closing
Panamericano 14-Aug 2Q08 Release SP
Cruzeiro do Sul 14-Aug 2Q08 Release SP
Multiplan 14-Aug Conference Call 2Q08 11h45 Portuguese / 10h30 English
Daily Brazil
August 07 2008
Banco Espírito Santo de Investimento, S.A. - 23 - Equity Iberia - Brazil
Usiminas 14-Aug 2Q08 Release Before Market Opening
Renner 14-Aug Conference Call 2Q08 11h00
Marfrig 14-Aug Conference Call 2Q08 -
Eletropaulo 15-Aug Conference Call 2Q08 14h30
AES Tietê 15-Aug Conference Call 2Q08 13h30
Copel 15-Aug Conference Call 2Q08 15h00
Tractebel 15-Aug Conference Call 2Q08 10h00
PDG Realty 15-Aug Conference Call 2Q08 9h00 Portuguese / 11h00 English
Company 15-Aug Conference Call 2Q08 -
Cyrela Brazil Realty 15-Aug Conference Call 2Q08 10h00 Portuguese / 12h00 English
Lopes 15-Aug Conference Call 2Q08 -
Abyara 15-Aug Conference Call 2Q08 -
Brasil Brokers 15-Aug Conference Call 2Q08 -
Anhanguera 15-Aug Conference Call 2Q08 -
MRV 15-Aug Conference Call 2Q08 -
CCP 15-Aug Conference Call 2Q08 -
Inpar 15-Aug Conference Call 2Q08 11h00 Portuguese / 13h00 English
Brasil Brokers 15-Aug Conference Call 2Q08 -
OHL 15-Aug Conference Call 2Q08 11h00 Portuguese / 13h00 English
Grendene 15-Aug Conference Call 2Q08 10h30
Grendene 15-Aug Conference Call 2Q08 10h30
Tegma 15-Aug Conference Call 2Q08 09h00 Portuguese / 10h00 English
TAM 15-Aug Conference Call 2Q08 10h00 Portuguese / 11h30 English
Rossi Residencial 15-Aug Conference Call 2Q08 10h00 Portuguese / 12h00 English
Klabin Segall 15-Aug Conference Call 2Q08 10h00 Portuguese / 12h00 English
Gafisa 15-Aug Conference Call 2Q08 9h00 Portuguese / 11h00 English
General Shopping 15-Aug Conference Call 2Q08 14h00 Portuguese / 15h30 English
Even 17-Aug Conference Call 2Q08 -
SEB 18-Aug Conference Call 2Q08 -
Lupatech 18-Aug Conference Call 2Q08 -
Log-In 18-Aug Conference Call 2Q08 10h00 Portuguese / 11h30 English
Unipar 19-Aug Analysts Meeting SP
ALL 19-Aug Analysts Meeting 11h00
Eletrobras 20-Aug Analysts Meeting -
WEG 20-Aug Analysts Meeting -
Randon 26-Aug Analysts Meeting 18h00
Eletropaulo 27-Aug Analysts Meeting -
Alpargatas 28-Aug Analysts Meeting -
Cia Hering 28-Aug Analysts Meeting -
Even 1-Sep Analysts Meeting SP

Daily Brazil
August 07 2008
EquityIberia - Brazil
SHORT INTEREST
Period: 08/05/08Company Ticker Days Open Average Volume Fluctuation
21 days R$ VolumeKlabin KLBN4 22 24 174.840.128 -0,39%Telesp TLPP4 19 25 79.109.335 1,09%Eletrobras ELET6 18 22 634.593.646 2,12%CPFL Energia CPFE3 17 15 292.700.224 0,11%Celesc CLSC6 11 15 52.962.655 -2,64%Cemig CMIG4 11 12 736.953.895 2,32%Gafisa GFSA3 10 11 288.513.760 -1,38%Telemar-Tele NL Par TNLP4 10 9 276.405.751 4,97%Sabesp SBSP3 10 11 122.055.813 -0,79%Perdigao PRGA3 9 8 286.550.611 4,22%
10 LARGEST OPEN POSITIONS
Source: Espirito Santo Research e CBLC
Period: 08/05/08Company Ticker Volume Fluctuation
R$ VolumeSAO MARTINHO SMTO3 14.636.562 -59,08%Porto Seguro PSSA3 25.091.582 -13,12%B2W Global BTOW3 123.497.239 -8,59%Natura NATU3 101.052.167 -7,49%Comgas CGAS5 35.582.041 -7,46%
OPEN POSITIONS - 5 HIGHEST DECREASES*
Source: Espirito Santo Research, CBLC and Economática. *Variations in companies with a minimum of 3 days open
Days Open
45367
Period: 08/05/08Company Ticker Volume Fluctuation
R$ VolumeUniverso Online UOLL4 6.878.323 16,84%Copasa MG CSMG3 24.184.198 5,64%Telemar-Tele NL Par TNLP4 276.405.751 4,97%Positivo POSI3 10.918.417 4,71%AES Tiete GETI4 30.428.723 4,62%
Source: Espirito Santo Research, CBLC and Economática. *Variations in companies with a minimum of 3 days open
OPEN POSITIONS - 5 HIGHEST INCREASES*
Days Open
4
36
103

EquityIberia - Brazil
DAILY BRAZIL Espírito Santo Research
August 07 2008
SHORT INTEREST
OPEN POSITION - IBRX 100 Period: 08/05/08Ticker Name Open Volume Average Ticker Name Open Volume Average Ticker Name Open Volume Average
Days 21 days Days 21 days Days 21 daysALLL11 ALL America Latina 4 R$ 181.112.332 5 ENBR3 Energias BR 2 R$ 33.677.215 1 PSSA3 Porto Seguro 5 R$ 25.091.582 4AMBV3 Ambev 1 R$ 5.832.994 1 EQTL3 Equatorial 0 R$ 514.580 0 POSI3 Positivo 3 R$ 10.918.417 2AMBV4 Ambev 7 R$ 317.391.958 8 ETER3 Eternit 4 R$ 13.631.356 4 RAPT4 Randon Part 8 R$ 28.252.800 8ARCZ6 Aracruz 8 R$ 180.844.470 10 GFSA3 Gafisa 10 R$ 288.513.760 11 RSID3 Rossi Resid 2 R$ 25.535.728 3BTOW3 B2W Global 3 R$ 123.497.239 5 GGBR3 Gerdau 0 R$ 1.979.217 1 SBSP3 Sabesp 10 R$ 122.055.813 11BEES3 Banestes 0 R$ 1.356 0 GGBR4 Gerdau 1 R$ 169.370.038 2 SDIA4 Sadia 7 R$ 183.749.366 7BRML3 BR MALLS PAR 2 R$ 7.973.358 2 GOAU4 Gerdau Met 3 R$ 106.774.448 4 SMTO3 SAO MARTINHO 4 R$ 14.636.562 8BBDC4 Bradesco 2 R$ 451.861.991 4 GOLL4 Gol 4 R$ 90.455.480 5 CSNA3 Sid Nacional 2 R$ 282.552.189 2BRAP4 Bradespar 1 R$ 41.589.837 2 GUAR3 Guararapes 0 R$ 277.546 1 CRUZ3 Souza Cruz 8 R$ 113.867.968 10BBAS3 Brasil 3 R$ 219.530.107 4 GVTT3 GVT HOLDING 7 R$ 116.118.114 5 SUZB5 Suzano Papel 1 R$ 19.307.983 2BRTP3 Brasil T Par 1 R$ 19.113.041 1 IDNT3 Ideiasnet 2 R$ 4.592.929 1 SZPQ4 Suzano Petroquim 2 R$ 180.207 3BRTP4 Brasil T Par 5 R$ 64.147.781 11 ITAU4 Bco Itau Hold Finan 4 R$ 679.917.072 5 TAMM4 TAM 2 R$ 53.151.880 3BRTO4 Brasil Telecom 3 R$ 42.687.954 6 ITSA4 Itausa 3 R$ 205.720.733 4 TCSA3 TECNISA 1 R$ 1.408.524 1BRKM5 Braskem 7 R$ 127.554.230 8 JBSS3 JBS 3 R$ 62.747.540 5 TNLP3 Telemar-Tele NL Par 1 R$ 23.317.348 4CCIM3 CC DES IMOB 6 R$ 6.686.325 9 KLBN4 Klabin 22 R$ 174.840.128 24 TNLP4 Telemar-Tele NL Par 10 R$ 276.405.751 9CCRO3 CCR Rodovias 4 R$ 107.988.924 5 KSSA3 Klabin Segall 1 R$ 1.440.383 1 TMAR5 Telemar Norte Leste 7 R$ 99.497.299 6CLSC6 Celesc 11 R$ 52.962.655 15 LIGT3 Light 7 R$ 47.012.108 9 TMCP4 Telemig Celul Part 8 R$ 24.234.705 13CMIG4 Cemig 11 R$ 736.953.895 12 RENT3 Localiza 2 R$ 24.988.806 3 TLPP4 Telesp 19 R$ 79.109.335 25CESP6 Cesp 2 R$ 84.213.371 4 LAME4 Loj Americanas 4 R$ 136.813.398 4 TCSL3 Tim Participacoes 2 R$ 8.031.075 5CGAS5 Comgas 7 R$ 35.582.041 10 LREN3 Lojas Renner 3 R$ 99.866.683 3 TCSL4 Tim Participacoes 7 R$ 88.683.732 7CNFB4 Confab 0 R$ 251.525 0 LUPA3 Lupatech 1 R$ 6.999.456 1 TBLE3 Tractebel 2 R$ 26.617.290 2CPLE6 Copel 7 R$ 186.502.035 9 POMO4 Marcopolo 2 R$ 3.101.247 2 TRPL4 Transmissao Paulist 6 R$ 90.961.332 8CSAN3 Cosan 3 R$ 93.979.206 3 MMXM3 MMX Mineracao 1 R$ 14.447.963 1 UGPA4 Ultrapar 1 R$ 18.626.518 2CPFE3 CPFL Energia 17 R$ 292.700.224 15 NATU3 Natura 6 R$ 101.052.167 7 UBBR11 Unibanco 2 R$ 209.935.094 3CCPR3 Cyrela Comercial P. 4 R$ 5.996.398 7 NETC4 Net 2 R$ 49.928.687 3 UNIP6 Unipar 2 R$ 7.320.227 3CYRE3 Cyrela Realty 7 R$ 336.477.941 5 BNCA3 Nossa Caixa 2 R$ 20.927.646 4 UOLL4 Universo Online 3 R$ 6.878.323 4DASA3 Dasa 3 R$ 25.142.535 3 OHLB3 OHL Brasil 1 R$ 4.327.080 1 USIM3 Usiminas 0 R$ 14.024.995 1DURA4 Duratex 2 R$ 24.599.986 4 PCAR4 Pao de Acucar 4 R$ 68.739.139 6 USIM5 Usiminas 5 R$ 711.888.465 7ECOD3 Brasil Ecodiesel 1 R$ 1.621.638 0 PDGR3 PDG REALT 1 R$ 7.952.160 1 VCPA4 Votorantim C P 4 R$ 67.954.762 4ELET3 Eletrobras 2 R$ 93.765.492 3 PRGA3 Perdigao 9 R$ 286.550.611 8 VALE3 Vale Rio Doce 4 R$ 834.075.197 7ELET6 Eletrobras 18 R$ 634.593.646 22 PETR3 Petrobras 6 R$ 800.501.544 6 VALE5 Vale Rio Doce 2 R$ 1.381.988.149 4ELPL6 Eletropaulo Metropo 6 R$ 142.196.298 6 PETR4 Petrobras 1 R$ 695.238.499 2 VIVO4 Vivo Part 5 R$ 115.024.024 8EMBR3 Embraer 7 R$ 160.691.108 10 PINE4 PINE 1 R$ 1.407.150 1 WEGE3 Weg 2 R$ 13.497.740 3
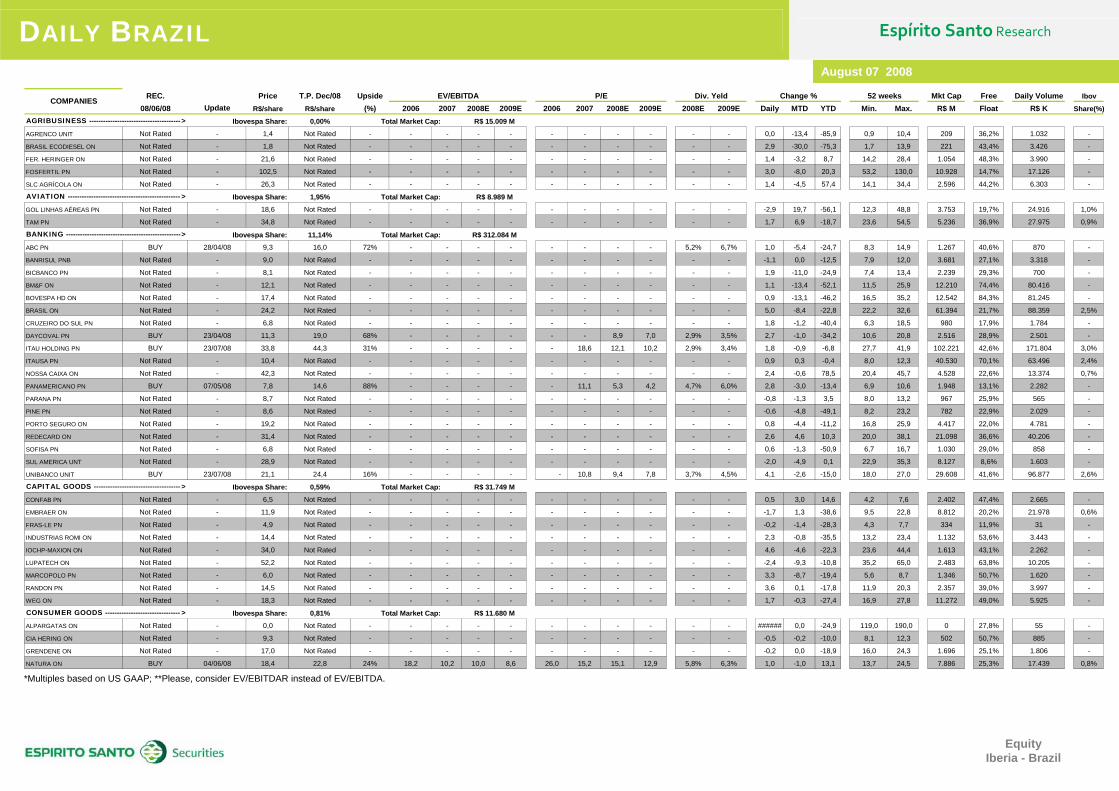
DAILY BRAZIL Espírito Santo Research
August 07 2008
Equity Iberia - Brazil
REC. Price T.P. Dec/08 Upside Mkt Cap Free Daily Volume Ibov
08/06/08 Update R$/share R$/share (%) 2006 2007 2008E 2009E 2006 2007 2008E 2009E 2008E 2009E Daily MTD YTD Min. Max. R$ M Float R$ K Share(%)
Ibovespa Share: 0,00% Total Market Cap:
AGRENCO UNIT Not Rated - 1,4 Not Rated - - - - - - - - - - - 0,0 -13,4 -85,9 0,9 10,4 209 36,2% 1.032 -
BRASIL ECODIESEL ON Not Rated - 1,8 Not Rated - - - - - - - - - - - 2,9 -30,0 -75,3 1,7 13,9 221 43,4% 3.426 -
FER. HERINGER ON Not Rated - 21,6 Not Rated - - - - - - - - - - - 1,4 -3,2 8,7 14,2 28,4 1.054 48,3% 3.990 -
FOSFERTIL PN Not Rated - 102,5 Not Rated - - - - - - - - - - - 3,0 -8,0 20,3 53,2 130,0 10.928 14,7% 17.126 -
SLC AGRÍCOLA ON Not Rated - 26,3 Not Rated - - - - - - - - - - - 1,4 -4,5 57,4 14,1 34,4 2.596 44,2% 6.303 -
Ibovespa Share: 1,95% Total Market Cap:
GOL LINHAS AÉREAS PN Not Rated - 18,6 Not Rated - - - - - - - - - - - -2,9 19,7 -56,1 12,3 48,8 3.753 19,7% 24.916 1,0%
TAM PN Not Rated - 34,8 Not Rated - - - - - - - - - - - 1,7 6,9 -18,7 23,6 54,5 5.236 36,9% 27.975 0,9%
Ibovespa Share: 11,14% Total Market Cap:
ABC PN BUY 28/04/08 9,3 16,0 72% - - - - - - - - 5,2% 6,7% 1,0 -5,4 -24,7 8,3 14,9 1.267 40,6% 870 -
BANRISUL PNB Not Rated - 9,0 Not Rated - - - - - - - - - - - -1,1 0,0 -12,5 7,9 12,0 3.681 27,1% 3.318 -
BICBANCO PN Not Rated - 8,1 Not Rated - - - - - - - - - - - 1,9 -11,0 -24,9 7,4 13,4 2.239 29,3% 700 -
BM&F ON Not Rated - 12,1 Not Rated - - - - - - - - - - - 1,1 -13,4 -52,1 11,5 25,9 12.210 74,4% 80.416 -
BOVESPA HD ON Not Rated - 17,4 Not Rated - - - - - - - - - - - 0,9 -13,1 -46,2 16,5 35,2 12.542 84,3% 81.245 -
BRASIL ON Not Rated - 24,2 Not Rated - - - - - - - - - - - 5,0 -8,4 -22,8 22,2 32,6 61.394 21,7% 88.359 2,5%
CRUZEIRO DO SUL PN Not Rated - 6,8 Not Rated - - - - - - - - - - - 1,8 -1,2 -40,4 6,3 18,5 980 17,9% 1.784 -
DAYCOVAL PN BUY 23/04/08 11,3 19,0 68% - - - - - - 8,9 7,0 2,9% 3,5% 2,7 -1,0 -34,2 10,6 20,8 2.516 28,9% 2.501 -
ITAU HOLDING PN BUY 23/07/08 33,8 44,3 31% - - - - - 18,6 12,1 10,2 2,9% 3,4% 1,8 -0,9 -6,8 27,7 41,9 102.221 42,6% 171.804 3,0%
ITAUSA PN Not Rated - 10,4 Not Rated - - - - - - - - - - - 0,9 0,3 -0,4 8,0 12,3 40.530 70,1% 63.496 2,4%
NOSSA CAIXA ON Not Rated - 42,3 Not Rated - - - - - - - - - - - 2,4 -0,6 78,5 20,4 45,7 4.528 22,6% 13.374 0,7%
PANAMERICANO PN BUY 07/05/08 7,8 14,6 88% - - - - - 11,1 5,3 4,2 4,7% 6,0% 2,8 -3,0 -13,4 6,9 10,6 1.948 13,1% 2.282 -
PARANA PN Not Rated - 8,7 Not Rated - - - - - - - - - - - -0,8 -1,3 3,5 8,0 13,2 967 25,9% 565 -
PINE PN Not Rated - 8,6 Not Rated - - - - - - - - - - - -0,6 -4,8 -49,1 8,2 23,2 782 22,9% 2.029 -
PORTO SEGURO ON Not Rated - 19,2 Not Rated - - - - - - - - - - - 0,8 -4,4 -11,2 16,8 25,9 4.417 22,0% 4.781 -
REDECARD ON Not Rated - 31,4 Not Rated - - - - - - - - - - - 2,6 4,6 10,3 20,0 38,1 21.098 36,6% 40.206 -
SOFISA PN Not Rated - 6,8 Not Rated - - - - - - - - - - - 0,6 -1,3 -50,9 6,7 16,7 1.030 29,0% 858 -
SUL AMERICA UNT Not Rated - 28,9 Not Rated - - - - - - - - - - - -2,0 -4,9 0,1 22,9 35,3 8.127 8,6% 1.603 -
UNIBANCO UNIT BUY 23/07/08 21,1 24,4 16% - - - - - 10,8 9,4 7,8 3,7% 4,5% 4,1 -2,6 -15,0 18,0 27,0 29.608 41,6% 96.877 2,6%
Ibovespa Share: 0,59% Total Market Cap:
CONFAB PN Not Rated - 6,5 Not Rated - - - - - - - - - - - 0,5 3,0 14,6 4,2 7,6 2.402 47,4% 2.665 -
EMBRAER ON Not Rated - 11,9 Not Rated - - - - - - - - - - - -1,7 1,3 -38,6 9,5 22,8 8.812 20,2% 21.978 0,6%
FRAS-LE PN Not Rated - 4,9 Not Rated - - - - - - - - - - - -0,2 -1,4 -28,3 4,3 7,7 334 11,9% 31 -
INDUSTRIAS ROMI ON Not Rated - 14,4 Not Rated - - - - - - - - - - - 2,3 -0,8 -35,5 13,2 23,4 1.132 53,6% 3.443 -
IOCHP-MAXION ON Not Rated - 34,0 Not Rated - - - - - - - - - - - 4,6 -4,6 -22,3 23,6 44,4 1.613 43,1% 2.262 -
LUPATECH ON Not Rated - 52,2 Not Rated - - - - - - - - - - - -2,4 -9,3 -10,8 35,2 65,0 2.483 63,8% 10.205 -
MARCOPOLO PN Not Rated - 6,0 Not Rated - - - - - - - - - - - 3,3 -8,7 -19,4 5,6 8,7 1.346 50,7% 1.620 -
RANDON PN Not Rated - 14,5 Not Rated - - - - - - - - - - - 3,6 0,1 -17,8 11,9 20,3 2.357 39,0% 3.997 -
WEG ON Not Rated - 18,3 Not Rated - - - - - - - - - - - 1,7 -0,3 -27,4 16,9 27,8 11.272 49,0% 5.925 -
Ibovespa Share: 0,81% Total Market Cap:
ALPARGATAS ON Not Rated - 0,0 Not Rated - - - - - - - - - - - ###### 0,0 -24,9 119,0 190,0 0 27,8% 55 -
CIA HERING ON Not Rated - 9,3 Not Rated - - - - - - - - - - - -0,5 -0,2 -10,0 8,1 12,3 502 50,7% 885 -
GRENDENE ON Not Rated - 17,0 Not Rated - - - - - - - - - - - -0,2 0,0 -18,9 16,0 24,3 1.696 25,1% 1.806 -
NATURA ON BUY 04/06/08 18,4 22,8 24% 18,2 10,2 10,0 8,6 26,0 15,2 15,1 12,9 5,8% 6,3% 1,0 -1,0 13,1 13,7 24,5 7.886 25,3% 17.439 0,8%
Change % 52 weeksCOMPANIES Div. YeldP/EEV/EBITDA
R$ 11.680 M
>AGRIBUSINESS ---------------------------------------
>AVIATION ------------------------------------------------
>BANKING -------------------------------------------------
>CAPITAL GOODS -------------------------------------
>CONSUMER GOODS --------------------------------
R$ 31.749 M
R$ 15.009 M
R$ 8.989 M
R$ 312.084 M
*Multiples based on US GAAP; **Please, consider EV/EBITDAR instead of EV/EBITDA.

DAILY BRAZIL Espírito Santo Research
August 07 2008
Equity Iberia - Brazil
REC. Price T.P. Dec/08 Upside Mkt Cap Free Daily Volume Ibov
08/06/08 Update R$/share R$/share (%) 2006 2007 2008E 2009E 2006 2007 2008E 2009E 2008E 2009E Daily MTD YTD Min. Max. R$ M Float R$ K Share(%)
CONSUMER GOODS (Cont.)
POSITIVO INF. ON Not Rated - 13,3 Not Rated - - - - - - - - - - - -0,2 -5,1 -68,9 12,6 48,6 1.163 28,6% 3.788 -
PROVIDENCIA ON BUY 04/06/08 5,1 13,3 162% - 7,4 4,6 3,9 - 195,5 7,8 6,7 51,2% 3,1% 2,2 -6,1 -50,8 4,9 16,0 434 30,8% 402 -
Ibovespa Share: 0,00% Total Market Cap:ANHANGUERA UNIT Under Revision 10/07/08 31,0 Under Revision - - - - - - - - - - - 0,0 1,6 -18,4 21,0 39,0 3.121 45,7% 3.699 -
ESTACIO UNIT Not Rated - 23,5 Not Rated - - - - - - - - - - - 0,0 - 56,5 9,5 26,5 5.540 25,5% 336 -
KROTON UNIT Not Rated - 28,0 Not Rated - - - - - - - - - - - 0,0 -3,1 0,0 19,7 45,5 6.164 39,8% 627 -
SEB UNIT BUY 03/07/08 20,5 32,9 60% 0,0 37,1 -5,0 -2,7 0,0 nm 0,0 0,0 1,4% 2,5% 2,6 -3,9 -20,0 19,6 33,0 828 24,3% 1.624 -
Ibovespa Share: 9,21% Total Market Cap:AES TIETE ON BUY 01/07/08 18,5 23,4 26% 6,0 7,5 6,4 6,1 9,6 12,4 10,9 10,0 9,2% 10,0% 0,7 0,7 -2,7 14,3 20,0 7.053 37,0% 4.599 -
AES TIETE PN BUY 01/07/08 18,5 23,1 25% 6,0 6,4 6,4 6,1 9,7 10,4 10,9 10,0 9,2% 10,0% 2,2 -1,9 14,9 12,6 18,6 7.053 37,0% 7.670 -
CELESC PNB Not Rated - 48,6 Not Rated - - - - - - - - - - - 1,3 0,8 14,9 30,7 49,7 1.875 17,4% 4.709 0,2%
CEMIG ON Not Rated - 32,2 Not Rated - - - - - - - - - - - -1,7 1,7 4,6 24,0 37,8 15.958 59,3% 1.770 -
CEMIG PN Not Rated - 36,5 Not Rated - - - - - - - - - - - -2,4 0,7 23,5 25,5 42,2 18.100 59,3% 73.807 2,0%
CESP PNB NEUTRAL 05/08/08 30,3 29,4 -3% 12,1 13,4 9,9 8,1 n.a. 79,6 31,3 27,9 3,0% 3,4% -0,8 4,8 -29,7 23,0 49,7 9.907 36,7% 38.668 1,8%
COELCE PNB NEUTRAL 09/05/08 19,0 25,9 36% 7,0 4,9 3,7 3,0 10,8 6,8 6,1 5,0 15,6% 19,2% 0,3 -2,6 -0,8 15,7 23,1 1.479 22,6% 760 -
COPEL PNB Not Rated - 32,0 Not Rated - - - - - - - - - - - 0,5 -1,0 23,2 23,0 34,6 8.757 41,7% 27.906 0,8%
CPFL ENERGIA Not Rated - 36,0 Not Rated - - - - - - - - - - - 0,0 -1,0 11,3 27,8 43,0 17.277 16,2% 17.738 0,6%
ELETROBRAS ON Not Rated - 30,5 Not Rated - - - - - - - - - - - -2,4 2,8 32,7 19,8 31,8 34.537 22,0% 43.819 1,1%
ELETROBRAS PNB Not Rated - 26,7 Not Rated - - - - - - - - - - - -1,3 2,9 24,9 18,7 28,1 30.177 22,0% 34.779 1,1%
ELET. METROPOLITANA PNB SELL 12/05/08 36,8 38,3 4% 4,7 5,6 5,2 4,8 11,9 9,4 8,5 7,9 11,2% 12,0% 0,8 -2,5 3,1 22,8 40,8 6.157 50,8% 23.766 0,9%
ENERGIAS DO BRASIL ON Not Rated - 33,8 Not Rated - - - - - - - - - - - 2,0 -0,7 20,1 21,4 35,9 5.578 34,9% 15.789 -
EQUATORIAL ON BUY 06/08/08 15,2 24,0 58% - 4,1 3,6 3,3 - 6,6 7,2 7,9 12,8% 12,0% 1,3 -3,2 -13,2 14,3 20,5 1.605 44,5% 3.923 -
LIGHT ON NEUTRAL 05/08/08 25,3 31,1 23% 8,5 7,4 6,5 6,1 n.a. 5,4 14,7 12,8 7,6% 7,5% 3,4 -2,3 -11,2 20,2 32,3 5.139 7,5% 6.229 0,3%
TRACTEBEL ON Not Rated - 24,2 Not Rated - - - - - - - - - - - 1,8 -1,0 15,1 16,5 25,3 15.816 21,3% 14.931 -
TRANS. PAULISTA PN Not Rated - 55,0 Not Rated - - - - - - - - - - - 1,3 0,0 51,7 28,9 54,7 8.211 21,0% 13.733 0,4%
Ibovespa Share: 4,27% Total Market Cap:
AMBEV PN NEUTRAL 04/06/08 102,9 136,3 32% 10,2 10,0 7,5 6,6 24,2 28,1 17,6 15,4 3,8% 4,3% 3,4 7,0 -20,1 88,4 144,3 63.224 29,7% 46.699 1,0%
JBS ON Not Rated - 6,9 Not Rated - - - - - - - - - - - -3,1 -15,2 18,8 4,3 10,3 9.923 21,2% 21.491 0,6%
MARFRIG ON Not Rated - 18,5 Not Rated - - - - - - - - - - - 4,6 -8,8 16,0 12,9 24,3 3.773 24,4% 6.452 -
M DIAS BRANCO ON Not Rated - 22,0 Not Rated - - - - - - - - - - - 2,5 2,4 -12,5 16,7 30,7 2.530 31,8% 3.313 -
MINERVA ON Not Rated - 8,7 Not Rated - - - - - - - - - - - -2,3 1,1 -18,5 7,0 20,4 649 21,6% 674 -
PERDIGÃO ON NEUTRAL 04/06/08 45,4 55,3 22% 16,3 12,4 9,7 7,6 42,5 28,6 15,9 13,0 1,8% 2,2% 1,2 5,1 3,0 26,6 55,0 9.489 54,7% 31.483 1,1%
SADIA PN NEUTRAL 04/06/08 12,1 14,6 21% 11,7 8,0 9,2 6,9 13,0 10,0 13,2 10,0 2,2% 2,9% 0,9 4,4 21,4 7,3 14,3 8.237 50,9% 28.164 1,0%
SOUZA CRUZ ON NEUTRAL 04/08/08 43,0 50,7 18% 9,0 10,5 8,7 7,8 14,1 16,2 14,0 12,5 6,9% 7,6% 0,5 0,1 -5,3 31,9 56,0 13.145 24,7% 13.771 0,5%
Ibovespa Share: 0,00% Total Market Cap:AMIL ON Not Rated - 12,2 Not Rated - - - - - - - - - - - -3,9 -5,9 -21,8 9,1 17,4 4.397 25,2% 3.411 -
CREMER ON Not Rated - 13,9 Not Rated - - - - - - - - - - - 4,1 -3,3 -18,2 12,1 22,2 468 83,4% 2.076 -
DASA ON Not Rated - 38,8 Not Rated - - - - - - - - - - - -1,4 4,7 7,4 29,3 45,4 2.227 67,6% 9.431 -
DROGASIL ON Not Rated - 13,5 Not Rated - - - - - - - - - - - 2,3 -3,6 -6,6 11,3 16,7 847 51,9% 1.501 -
MEDIAL ON BUY 30/07/08 17,0 37,7 122% 18,4 20,6 6,0 4,0 - - 9,1 7,3 1,0% 1,8% -0,1 -2,9 -26,9 13,3 28,9 1.177 50,0% 4.287 -
ODONTOPREV ON Not Rated - 40,6 Not Rated - - - - - - - - - - - 0,7 -1,7 -8,4 35,0 59,6 1.035 62,1% 2.862 -
PROFARMA ON Not Rated - 16,1 Not Rated - - - - - - - - - - - -3,1 9,2 -53,5 15,0 40,1 587 27,3% 659 -
TEMPO PART. ON Not Rated - 6,3 Not Rated - - - - - - - - - - - -2,5 -3,7 -8,5 4,3 8,0 1.083 48,8% 369 -
Change % 52 weeks
R$ 110.969 M
COMPANIES Div. YeldP/EEV/EBITDA
R$ 15.653 M
R$ 194.679 M
R$ 11.822 M
>EDUCATION ---------------------------------------------------
>ELECTRIC UTILITIES ------------------------------------
>FOOD, BEVERAGES & TOBACCO -----------------
>HEALTH CARE -----------------------------------------------
*Multiples based on US GAAP; **Please, consider EV/EBITDAR instead of EV/EBITDA.
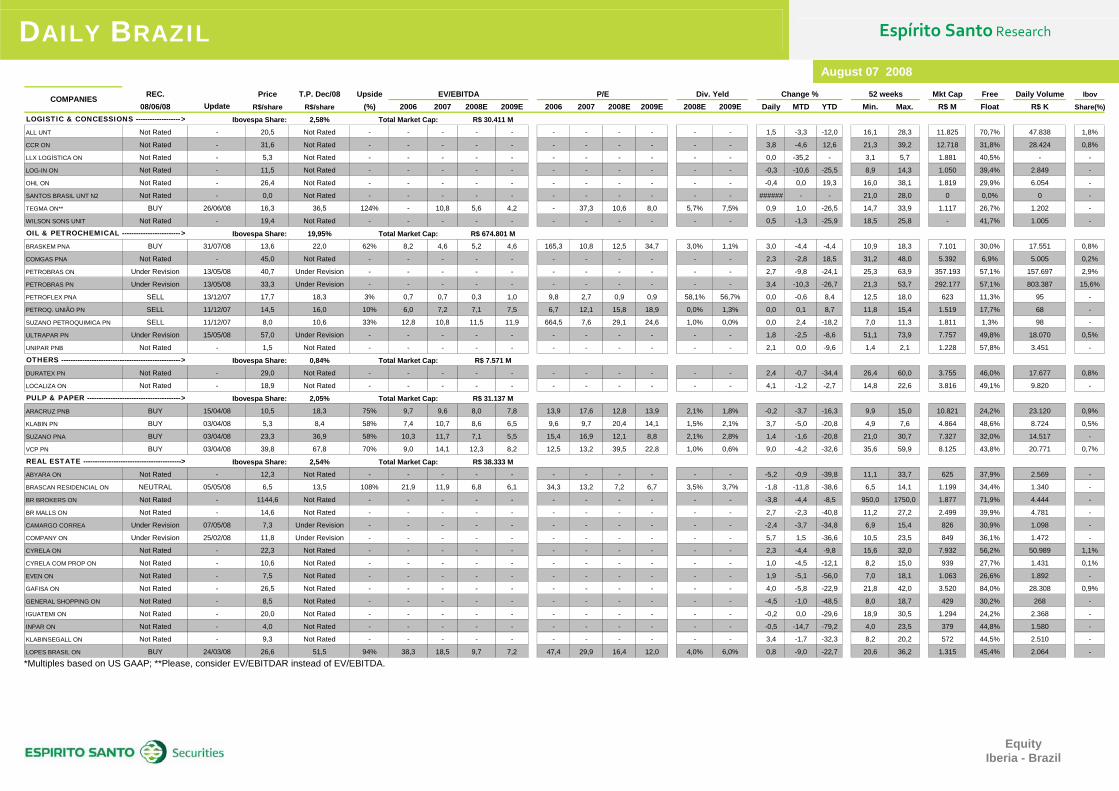
DAILY BRAZIL Espírito Santo Research
August 07 2008
Equity Iberia - Brazil
REC. Price T.P. Dec/08 Upside Mkt Cap Free Daily Volume Ibov
08/06/08 Update R$/share R$/share (%) 2006 2007 2008E 2009E 2006 2007 2008E 2009E 2008E 2009E Daily MTD YTD Min. Max. R$ M Float R$ K Share(%)
Ibovespa Share: 2,58% Total Market Cap:
ALL UNT Not Rated - 20,5 Not Rated - - - - - - - - - - - 1,5 -3,3 -12,0 16,1 28,3 11.825 70,7% 47.838 1,8%
CCR ON Not Rated - 31,6 Not Rated - - - - - - - - - - - 3,8 -4,6 12,6 21,3 39,2 12.718 31,8% 28.424 0,8%
LLX LOGÍSTICA ON Not Rated - 5,3 Not Rated - - - - - - - - - - - 0,0 -35,2 - 3,1 5,7 1.881 40,5% - -
LOG-IN ON Not Rated - 11,5 Not Rated - - - - - - - - - - - -0,3 -10,6 -25,5 8,9 14,3 1.050 39,4% 2.849 -
OHL ON Not Rated - 26,4 Not Rated - - - - - - - - - - - -0,4 0,0 19,3 16,0 38,1 1.819 29,9% 6.054 -
SANTOS BRASIL UNT N2 Not Rated - 0,0 Not Rated - - - - - - - - - - - ###### - - 21,0 28,0 0 0,0% 0 -
TEGMA ON** BUY 26/06/08 16,3 36,5 124% - 10,8 5,6 4,2 - 37,3 10,6 8,0 5,7% 7,5% 0,9 1,0 -26,5 14,7 33,9 1.117 26,7% 1.202 -
WILSON SONS UNIT Not Rated - 19,4 Not Rated - - - - - - - - - - - 0,5 -1,3 -25,9 18,5 25,8 - 41,7% 1.005 -
Ibovespa Share: 19,95% Total Market Cap:
BRASKEM PNA BUY 31/07/08 13,6 22,0 62% 8,2 4,6 5,2 4,6 165,3 10,8 12,5 34,7 3,0% 1,1% 3,0 -4,4 -4,4 10,9 18,3 7.101 30,0% 17.551 0,8%
COMGAS PNA Not Rated - 45,0 Not Rated - - - - - - - - - - - 2,3 -2,8 18,5 31,2 48,0 5.392 6,9% 5.005 0,2%
PETROBRAS ON Under Revision 13/05/08 40,7 Under Revision - - - - - - - - - - - 2,7 -9,8 -24,1 25,3 63,9 357.193 57,1% 157.697 2,9%
PETROBRAS PN Under Revision 13/05/08 33,3 Under Revision - - - - - - - - - - - 3,4 -10,3 -26,7 21,3 53,7 292.177 57,1% 803.387 15,6%
PETROFLEX PNA SELL 13/12/07 17,7 18,3 3% 0,7 0,7 0,3 1,0 9,8 2,7 0,9 0,9 58,1% 56,7% 0,0 -0,6 8,4 12,5 18,0 623 11,3% 95 -
PETROQ. UNIÃO PN SELL 11/12/07 14,5 16,0 10% 6,0 7,2 7,1 7,5 6,7 12,1 15,8 18,9 0,0% 1,3% 0,0 0,1 8,7 11,8 15,4 1.519 17,7% 68 -
SUZANO PETROQUIMICA PN SELL 11/12/07 8,0 10,6 33% 12,8 10,8 11,5 11,9 664,5 7,6 29,1 24,6 1,0% 0,0% 0,0 2,4 -18,2 7,0 11,3 1.811 1,3% 98 -
ULTRAPAR PN Under Revision 15/05/08 57,0 Under Revision - - - - - - - - - - - 1,8 -2,5 -8,6 51,1 73,9 7.757 49,8% 18.070 0,5%
UNIPAR PNB Not Rated - 1,5 Not Rated - - - - - - - - - - - 2,1 0,0 -9,6 1,4 2,1 1.228 57,8% 3.451 -
Ibovespa Share: 0,84% Total Market Cap:
DURATEX PN Not Rated - 29,0 Not Rated - - - - - - - - - - - 2,4 -0,7 -34,4 26,4 60,0 3.755 46,0% 17.677 0,8%
LOCALIZA ON Not Rated - 18,9 Not Rated - - - - - - - - - - - 4,1 -1,2 -2,7 14,8 22,6 3.816 49,1% 9.820 -
Ibovespa Share: 2,05% Total Market Cap:
ARACRUZ PNB BUY 15/04/08 10,5 18,3 75% 9,7 9,6 8,0 7,8 13,9 17,6 12,8 13,9 2,1% 1,8% -0,2 -3,7 -16,3 9,9 15,0 10.821 24,2% 23.120 0,9%
KLABIN PN BUY 03/04/08 5,3 8,4 58% 7,4 10,7 8,6 6,5 9,6 9,7 20,4 14,1 1,5% 2,1% 3,7 -5,0 -20,8 4,9 7,6 4.864 48,6% 8.724 0,5%
SUZANO PNA BUY 03/04/08 23,3 36,9 58% 10,3 11,7 7,1 5,5 15,4 16,9 12,1 8,8 2,1% 2,8% 1,4 -1,6 -20,8 21,0 30,7 7.327 32,0% 14.517 -
VCP PN BUY 03/04/08 39,8 67,8 70% 9,0 14,1 12,3 8,2 12,5 13,2 39,5 22,8 1,0% 0,6% 9,0 -4,2 -32,6 35,6 59,9 8.125 43,8% 20.771 0,7%
Ibovespa Share: 2,54% Total Market Cap:
ABYARA ON Not Rated - 12,3 Not Rated - - - - - - - - - - - -5,2 -0,9 -39,8 11,1 33,7 625 37,9% 2.569 -
BRASCAN RESIDENCIAL ON NEUTRAL 05/05/08 6,5 13,5 108% 21,9 11,9 6,8 6,1 34,3 13,2 7,2 6,7 3,5% 3,7% -1,8 -11,8 -38,6 6,5 14,1 1.199 34,4% 1.340 -
BR BROKERS ON Not Rated - 1144,6 Not Rated - - - - - - - - - - - -3,8 -4,4 -8,5 950,0 1750,0 1.877 71,9% 4.444 -
BR MALLS ON Not Rated - 14,6 Not Rated - - - - - - - - - - - 2,7 -2,3 -40,8 11,2 27,2 2.499 39,9% 4.781 -
CAMARGO CORREA Under Revision 07/05/08 7,3 Under Revision - - - - - - - - - - - -2,4 -3,7 -34,8 6,9 15,4 826 30,9% 1.098 -
COMPANY ON Under Revision 25/02/08 11,8 Under Revision - - - - - - - - - - - 5,7 1,5 -36,6 10,5 23,5 849 36,1% 1.472 -
CYRELA ON Not Rated - 22,3 Not Rated - - - - - - - - - - - 2,3 -4,4 -9,8 15,6 32,0 7.932 56,2% 50.989 1,1%
CYRELA COM PROP ON Not Rated - 10,6 Not Rated - - - - - - - - - - - 1,0 -4,5 -12,1 8,2 15,0 939 27,7% 1.431 0,1%
EVEN ON Not Rated - 7,5 Not Rated - - - - - - - - - - - 1,9 -5,1 -56,0 7,0 18,1 1.063 26,6% 1.892 -
GAFISA ON Not Rated - 26,5 Not Rated - - - - - - - - - - - 4,0 -5,8 -22,9 21,8 42,0 3.520 84,0% 28.308 0,9%
GENERAL SHOPPING ON Not Rated - 8,5 Not Rated - - - - - - - - - - - -4,5 -1,0 -48,5 8,0 18,7 429 30,2% 268 -
IGUATEMI ON Not Rated - 20,0 Not Rated - - - - - - - - - - - -0,2 0,0 -29,6 18,9 30,5 1.294 24,2% 2.368 -
INPAR ON Not Rated - 4,0 Not Rated - - - - - - - - - - - -0,5 -14,7 -79,2 4,0 23,5 379 44,8% 1.580 -
KLABINSEGALL ON Not Rated - 9,3 Not Rated - - - - - - - - - - - 3,4 -1,7 -32,3 8,2 20,2 572 44,5% 2.510 -
LOPES BRASIL ON BUY 24/03/08 26,6 51,5 94% 38,3 18,5 9,7 7,2 47,4 29,9 16,4 12,0 4,0% 6,0% 0,8 -9,0 -22,7 20,6 36,2 1.315 45,4% 2.064 -
Div. Yeld Change % 52 weeksP/EEV/EBITDA
R$ 30.411 M
COMPANIES
R$ 31.137 M
>LOGISTIC & CONCESSIONS -------------------
R$ 38.333 M>REAL ESTATE ------------------------------------------
>PULP & PAPER ----------------------------------------
>OIL & PETROCHEMICAL -------------------------
>OTHERS --------------------------------------------------- R$ 7.571 M
R$ 674.801 M
*Multiples based on US GAAP; **Please, consider EV/EBITDAR instead of EV/EBITDA.

DAILY BRAZIL Espírito Santo Research
August 07 2008
Equity Iberia - Brazil
REC. Price T.P. Dec/08 Upside Mkt Cap Free Daily Volume Ibov
08/06/08 Update R$/share R$/share (%) 2006 2007 2008E 2009E 2006 2007 2008E 2009E 2008E 2009E Daily MTD YTD Min. Max. R$ M Float R$ K Share(%)
REAL ESTATE (Cont.)
MRV ON Not Rated - 33,5 Not Rated - - - - - - - - - - - 0,3 -7,2 -12,0 25,0 45,4 4.556 47,5% 13.384 -
MULTIPLAN ON Not Rated - 17,5 Not Rated - - - - - - - - - - - 0,6 -2,9 -19,8 16,3 28,0 2.587 27,0% 2.085 -
PDG REALTY ON Not Rated - 22,2 Not Rated - - - - - - - - - - - 1,3 -6,8 -11,9 17,6 28,7 3.240 55,9% 11.297 -
RODOBENS ON Not Rated - 20,4 Not Rated - - - - - - - - - - - 1,0 -1,2 -4,4 16,5 25,4 991 26,1% 931 -
ROSSI ON Not Rated - 13,1 Not Rated - - - - - - - - - - - 6,3 -1,6 -45,1 9,9 29,7 2.071 61,9% 16.258 0,5%
Ibovespa Share: 4,19% Total Market Cap:
B2W GLOBAL ON Not Rated - 59,5 Not Rated - - - - - - - - - - - 4,4 -3,4 -19,6 49,5 94,7 6.747 40,2% 35.636 1,3%
GLOBEX PN Not Rated - 30,5 Not Rated - - - - - - - - - - - 0,0 - - 26,0 40,0 3.792 19,5% 0 -
GUARARAPES ON Not Rated - 40,5 Not Rated - - - - - - - - - - - 6,6 1,3 -39,2 37,5 95,2 2.527 18,1% 1.429 -
LOJAS AMERICANAS PN Not Rated - 11,9 Not Rated - - - - - - - - - - - 3,3 -3,4 -25,8 9,5 20,4 8.959 47,1% 32.608 1,1%
LOJAS RENNER ON Not Rated - 32,1 Not Rated - - - - - - - - - - - 3,8 -1,6 -12,4 25,3 45,2 3.898 88,8% 29.312 1,0%
MARISA ON Not Rated - 5,1 Not Rated - - - - - - - - - - - 11,6 7,5 -41,6 3,8 12,2 941 0,0% 2.075 -
PÃO AÇUCAR PN NEUTRAL 04/06/08 37,0 45,4 23% 7,9 11,0 8,6 7,4 49,7 36,9 20,4 15,1 1,2% 1,6% 0,8 3,1 8,3 26,3 41,7 8.702 40,0% 16.153 0,7%
Ibovespa Share: 25,77% Total Market Cap:
CSN ON BUY 01/08/08 57,9 89,5 55% 3,4 10,0 7,4 4,7 4,8 14,5 12,3 8,2 3,3% 4,9% 2,7 -8,0 10,0 28,2 86,3 46.563 43,3% 172.348 2,9%
GERDAU PN NEUTRAL 01/08/08 32,1 43,8 36% 4,9 13,6 5,7 4,8 7,8 20,8 9,5 8,1 3,1% 3,7% 1,4 -7,6 23,3 19,0 42,6 45.976 51,1% 135.408 3,3%
METAL. GERDAU PN BUY 01/08/08 43,7 64,7 48% - - - - - - - - 0,0% 0,0% 0,4 -7,4 24,2 23,8 58,5 18.026 77,7% 35.961 1,1%
MMX ON NEUTRAL 01/08/08 15,8 22,9 45% neg. neg. 136,9 10,0 neg. 18,5 69,2 21,3 0,4% 1,2% 1,7 -10,6 -22,6 8,0 26,4 4.822 40,5% 50.194 -
USIMINAS ON BUY 01/08/08 59,7 118,7 99% 7,1 7,8 4,8 4,2 12,2 13,2 9,3 7,2 3,8% 4,8% 0,5 -11,2 8,2 44,5 97,5 30.262 61,0% 31.984 0,6%
USIMINAS PNA BUY 01/08/08 61,2 110,6 81% 5,9 7,6 5,3 4,5 10,1 12,9 9,6 7,4 3,7% 4,7% -0,5 -10,9 14,3 39,0 95,8 31.022 61,0% 160.859 3,2%
VALE ON BUY 01/08/08 42,2 69,4 65% 6,2 10,7 5,9 3,9 4,9 13,6 9,0 6,6 2,0% 3,9% 1,4 -12,1 -29,3 35,8 72,7 225.375 61,4% 211.166 3,0%
VALE PNA BUY 01/08/08 36,7 64,8 76% 5,8 9,3 5,2 3,4 4,3 11,7 7,8 5,7 2,3% 4,5% 1,9 -11,8 -28,4 29,8 59,2 196.055 61,4% 823.543 11,8%
Ibovespa Share: 0,88% Total Market Cap:
COSAN ON Not Rated - 28,4 Not Rated - - - - - - - - - - - 1,6 -9,1 34,6 18,5 34,2 7.751 32,7% 36.366 0,9%
GUARANI ON Not Rated - 8,8 Not Rated - - - - - - - - - - - 0,0 -0,6 -17,5 8,5 13,8 1.472 22,8% 918 -
SÃO MARTINHO ON Not Rated - 25,0 Not Rated - - - - - - - - - - - 4,2 -9,4 18,8 16,1 30,3 2.825 29,8% 3.244 -
Ibovespa Share: 6,72% Total Market Cap:
AMERICAN BANKNOTE ON Not Rated - 17,1 Not Rated - - - - - - - - - - - 0,5 0,1 8,0 12,5 21,6 880 52,8% 1.783 -
BEMATECH ON Not Rated - 7,4 Not Rated - - - - - - - - - - - 2,2 0,8 -21,2 6,0 17,3 404 58,5% 1.977 -
BRASIL TEL PART PN Not Rated - 23,3 Not Rated - - - - - - - - - - - 2,6 -5,8 -6,7 18,8 28,1 8.480 73,3% 12.896 0,8%
BRASIL TEL SA PN Not Rated - 18,6 Not Rated - - - - - - - - - - - 3,2 -3,2 5,4 12,2 21,4 10.445 21,4% 13.176 0,7%
CONTAX PN Not Rated - 39,4 Not Rated - - - - - - - - - - - 2,2 -0,4 -21,0 34,3 55,8 625 58,1% 1.153 -
CSU CARDSYSTEM ON Not Rated - 4,4 Not Rated - - - - - - - - - - - 4,3 -5,8 -27,1 4,1 9,6 212 29,7% 132 -
DATASUL ON Not Rated - 22,7 Not Rated - - - - - - - - - - - 0,2 -0,7 20,8 12,8 24,0 658 36,9% 2.685 -
GVT HOLDING ON Not Rated - 37,5 Not Rated - - - - - - - - - - - 3,2 -6,8 1,6 26,0 42,0 4.754 69,0% 18.091 -
NET SERVIÇOS PN Not Rated - 19,5 Not Rated - - - - - - - - - - - 2,6 -2,2 -12,4 17,1 31,7 6.490 54,4% 29.728 1,4%
TELEMAR ON Not Rated - 43,0 Not Rated - - - - - - - - - - - 3,5 1,4 -28,8 37,1 74,2 16.431 36,2% 16.871 0,6%
TELEMAR PN Not Rated - 37,7 Not Rated - - - - - - - - - - - 4,6 -3,2 5,9 32,3 47,6 14.387 36,2% 28.983 1,6%
TELEMAR NORTE LESTE PNA Not Rated - 92,2 Not Rated - - - - - - - - - - - 2,4 -3,8 33,4 51,5 99,0 21.988 17,8% 14.971 0,3%
TELESP PN Not Rated - 48,0 Not Rated - - - - - - - - - - - 2,2 4,1 9,7 39,3 59,2 24.289 12,0% 3.929 0,3%
Change % 52 weeks
R$ 134.501 M
COMPANIES Div. YeldP/EEV/EBITDA
R$ 35.567 M
R$ 598.101 M
R$ 12.048 M
>RETAIL -----------------------------------------------------
>STEEL & MINING -------------------------------------
>SUGAR & ETHANOL --------------------------------
>TELECOM / IT / MEDIA -----------------------------
*Multiples based on US GAAP; **Please, consider EV/EBITDAR instead of EV/EBITDA.
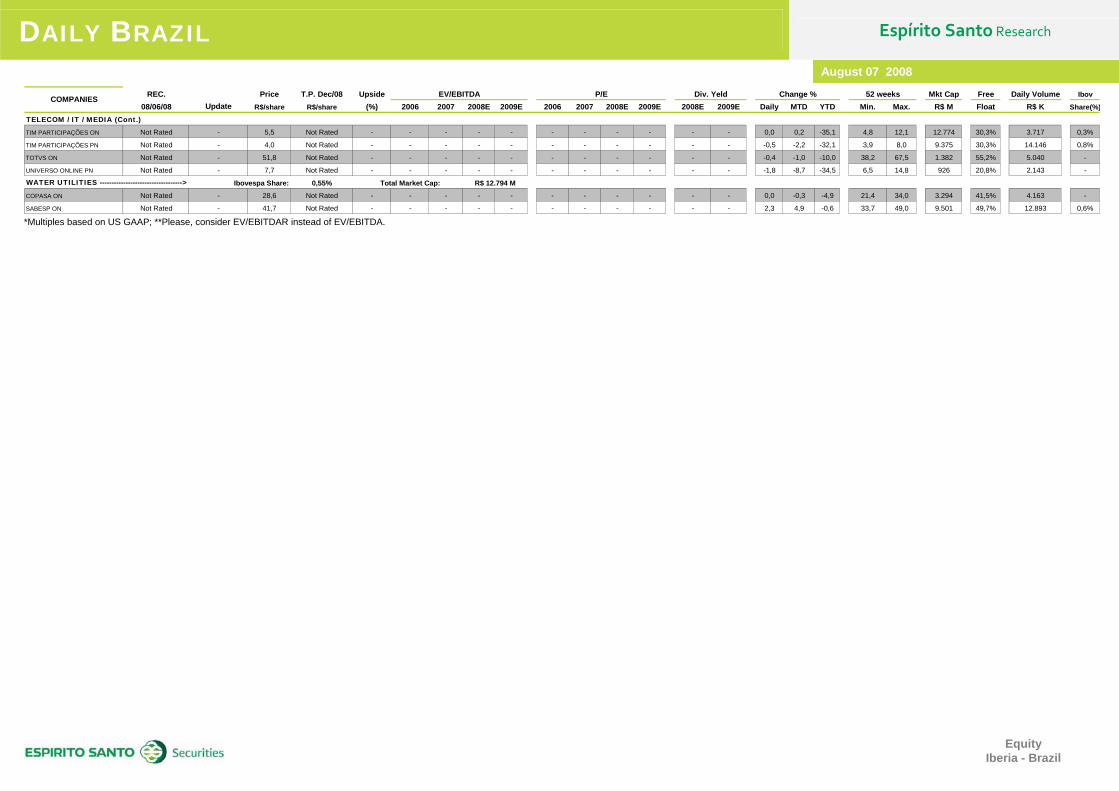
DAILY BRAZIL Espírito Santo Research
August 07 2008
Equity Iberia - Brazil
REC. Price T.P. Dec/08 Upside Mkt Cap Free Daily Volume Ibov
08/06/08 Update R$/share R$/share (%) 2006 2007 2008E 2009E 2006 2007 2008E 2009E 2008E 2009E Daily MTD YTD Min. Max. R$ M Float R$ K Share(%)
TELECOM / IT / MEDIA (Cont.)
TIM PARTICIPAÇÕES ON Not Rated - 5,5 Not Rated - - - - - - - - - - - 0,0 0,2 -35,1 4,8 12,1 12.774 30,3% 3.717 0,3%
TIM PARTICIPAÇÕES PN Not Rated - 4,0 Not Rated - - - - - - - - - - - -0,5 -2,2 -32,1 3,9 8,0 9.375 30,3% 14.146 0,8%
TOTVS ON Not Rated - 51,8 Not Rated - - - - - - - - - - - -0,4 -1,0 -10,0 38,2 67,5 1.382 55,2% 5.040 -
UNIVERSO ONLINE PN Not Rated - 7,7 Not Rated - - - - - - - - - - - -1,8 -8,7 -34,5 6,5 14,8 926 20,8% 2.143 -
Ibovespa Share: 0,55% Total Market Cap:
COPASA ON Not Rated - 28,6 Not Rated - - - - - - - - - - - 0,0 -0,3 -4,9 21,4 34,0 3.294 41,5% 4.163 -
SABESP ON Not Rated - 41,7 Not Rated - - - - - - - - - - - 2,3 4,9 -0,6 33,7 49,0 9.501 49,7% 12.893 0,6%
52 weeksCOMPANIES Div. YeldP/EEV/EBITDA
R$ 12.794 M>WATER UTILITIES -----------------------------------
Change %
*Multiples based on US GAAP; **Please, consider EV/EBITDAR instead of EV/EBITDA.

E q u i t y I b e r i a - B r a z i l
ANALYST STOCK RATING BUY: Expect the company to perform better than the primary market index over the next 12 months. NEUTRAL: Expect the company to perform approximately in line with the primary market index over the next 12 months. SELL: Expect the company to underperform the primary market index over the next 12 months. Espírito Santo Research has issued this report for information purposes only. All the information contained in this report is based upon information available to the public and has been obtained from sources believed to be reliable, but Espírito Santo Research does not guarantee its accuracy or completeness. The opinions expressed herein are our present opinions only, and are subject to change without prior notice. Espírito Santo Research is not under any obligation to update or keep current the information and the opinions expressed herein. This report is not, and should not be construed as, an offer or a solicitation to buy or sell any securities or related financial instruments. The investment discussed or recommended in this report may be unsuitable for investors depending on their specific investment objectives and financial position. Where an investment is denominated in a currency other than the investor's currency, changes in rates of exchange may have an adverse effect on the value, price of, or income derived from the investment. Past performance is not necessarily a guide to future performance. Income from investments may fluctuate. The price or value of the investments to which this report relates, either directly or indirectly, may fall or rise against the interest of investors. The securities mentioned in this publication may not be eligible for sale in some states or countries. Espírito Santo Research does not accept any kind of liability for losses or damages which may arise from the use of this report. This report cannot be reproduced, in whole or in part, in any form or by any means, without Espírito Santo. The Espírito Santo Research is a trademark and aggregates the teams of analysis from Banco Espírito Santo, S.A. (Portugal) and its affiliates BES Securities do Brasil, S.A - Corretora de Câmbio e Valores Mobiliários, (Brazil) and Espírito Santo Investment, S.A.U., Sociedad de Valores (Spain). Until the date of publication of the present report, none of these institutions held business relations with the company object of this analysis, with the possibility however, of establishing one due to its activities.
Not disregarding provision stated in the “disclaimer” above, the analyst(s) of investment responsible for this report declare the following:
_ the analysis(es)/recommendation(s) herewith described reflect only and exclusively his(their) individual opinion(s), being developed independently and autonomously, even as far as BES Securities is concerned; _the BES Securities does not hold direct or indirect stake in the capital of the company(companies) object of analysis(es)/recommendation(s) in this report, but the Grupo Banco Espírito Santo in which it takes part, holds direct shareholding stake, and in some cases indirect, in the capital of the companies: Cia. Providência Indústria e Comércio, Bradesco, Bradespar and its associated companies CVRD and CPFL Energia; and Brasilcel and its associated companies Telesp Celular Participações, Celular CRT Participações, Tele Sudeste Celular Participações, Tele Centro Oeste Participações and Tele Leste Celular Participações; and UOL. Bradesco is a direct shareholder of BES Securities’ parent company.. With the exception of the companies mentioned before, the BES Securities does not hold direct or indirect stake in the capital of the other companies object of analysis(es/recommendations in this report, as well as it was not involved in the acquisition alienation and intermediation of securities issue by these companies in the market; _the analyst(s) does(do) not maintain relationship with any individual working for the company(companies) which securities was(were) target of analysis(es)/recommendation(s) in this report; _ the analyst(s) does(do) not hold, directly or indirectly, securities issued by the company(companies) object of analysis(es)/recommendation(s) in this report, which correspond to 5% (five percent) or more of the individual assets, not even until the date of publication, or is(are) involved in the acquisition, alienation and intermediation of securities issued by the company(companies) in the market; _ the analyst(s) does(do) not receive, nor does BES Securities, payment for services provided, nor maintain commercial relations with company object of analysis(es)/recommendation(s), or with individual or legal entity, fund or universality of rights that act on the behalf of company’s interest; _ the fixed compensation(s) and eventual variable compensation(s) are not related to pricing of securities issued by the company object of analysis(es)/recommendation(s) in this report. The variable compensation, eventually received, is conditioned to the fulfilment of qualitative and quantitative premises established by the BES Securities board, among which, net result of activities.

GLOBAL RESEARCH COORDINATOR Miguel Frasquilho [email protected] +351 21 310 6457
BES SECURITIES DO BRASIL Gilberto Pereira de Souza
+55 11 3074 7325
BRAZIL EQUITY RESEARCH Gilberto Pereira de Souza [email protected] +55 11 3074 7325
Alexandre Kogake Claudio [email protected] +55 11 3074 7327
Juliana Chu [email protected] +55 11 3074 7320
Luiz Carlos Cesta [email protected] +55 11 3074 7322
Mariana Moraes de Barros [email protected] +55 11 3074 7356
Rodrigo Bonsaver [email protected] +55 11 3074 7412
MACROECONOMIC RESEARCH Carlos Almeida Andrade [email protected] +351 21 310 6493
Jankiel Ap. Lima dos Santos [email protected] +55 11 3074 7344
SALES EQUITY BRAZIL – Local Rui Marques [email protected] +55 11 3074 7103
Andre Julião [email protected] +55 11 3074 7392
David Matos [email protected] +55 11 3074 7012
Karin Augustinská [email protected] +55 11 3074 7390
SALES - EQUITY BRAZIL - Iberia
Igor Maresti [email protected] +351 21 319 9735
TRADING BRAZIL – EQUITY AND BM&F Luiz Eduardo Sposito [email protected] +55 11 3074 7393
Gustavo Vieira de Oliveira [email protected] +55 11 3074 7394
Jorge Alexandre G. de Almeida [email protected] +55 11 3074 7010
Luiz H. Giannini [email protected] +55 11 3074 7391
Marcos Prado [email protected] +55 11 3074 7410
Mauricio A. Camargo [email protected] +55 11 3074 7385
Maurício Albernaz [email protected] +55 11 3074 7009
Ney Mendonça de Aquino [email protected] +55 11 3074 7340
Ricardo Copia [email protected] +55 11 3074 7398
Simone Klein [email protected] +55 11 3074 7011
São Paulo Desk [email protected] +55 11 3074 7400
FIXED INCOME BRAZIL
Gianmarco Gomes Sales & Trading [email protected] +55 11 3074 7581
FIXED INCOME EUROPE
Carlos Pinto [email protected] +351 21 310 95 81
Filipe Worsdell Sales & Trading [email protected] +351 21 310 95 83
Marta Martin Corporate Desk [email protected] +34 91 400 53 52
Bárbara Braamcamp Corporate Desk [email protected] +351 21 310 95 69
BANCO ESPÍRITO SANTO ESPIRITO SANTO DE
INVESTIMENTO ESPIRITO SANTO INVESTMENT ESPÍRITO SANTO INVESTMENT
Av. da Liberdade, 195 1250 - 142 Lisboa
PORTUGAL
Rua Alexandre Herculano, 38 1269 - 161 Lisboa
PORTUGAL
Calle Serrano, 88 28006 Madrid
SPAIN
Av. Brigadeiro Faria Lima,3729 – 6º 04538-905 São Paulo
BRAZIL Ombudsman: 0800-7700668