daily income fund (hdixx) (hosgx) short ... - … bond fund (hosbx) stock index fund (hstix) value...
TRANSCRIPT
Daily Income Fund (HDIXX)
Short-Term Government Securities Fund (HOSGX)
Short-Term Bond Fund (HOSBX)
Stock Index Fund (HSTIX)
Value Fund (HOVLX)
Growth Fund (HNASX)
Small-Company Stock Fund (HSCSX)
International Value Fund (HISIX)
DECEMBER 31,
2013
an
nu
alre
po
rt


Table of Contents
PERFORMANCE EVALUATIONDaily Income Fund 2Short-Term Government Securities Fund and Short-Term Bond Fund 4Stock Index Fund 8Value Fund 10Growth Fund 12Small-Company Stock Fund 14International Value Fund 16
EXPENSE EXAMPLE 18
REGULATORY AND SHAREHOLDER MATTERS 20
REPORT OF INDEPENDENT REGISTERED PUBLIC ACCOUNTING FIRM 27
PORTFOLIO OF INVESTMENTSDaily Income Fund 28Short-Term Government Securities Fund 30Short-Term Bond Fund 34Stock Index Fund 44Value Fund 45Growth Fund 46Small-Company Stock Fund 48International Value Fund 50
STATEMENTS OF ASSETS AND LIABILITIES 52
STATEMENTS OF OPERATIONS 54
STATEMENTS OF CHANGES IN NET ASSETS 56
FINANCIAL HIGHLIGHTSDaily Income Fund 58Short-Term Government Securities Fund 59Short-Term Bond Fund 60Stock Index Fund 61Value Fund 62Growth Fund 63Small-Company Stock Fund 64International Value Fund 65
NOTES TO FINANCIAL STATEMENTS 66
DIRECTORS AND OFFICERS 72
APPENDIX—S&P 500 STOCK MASTER PORTFOLIO 76
The investment commentaries on the following pageswere prepared for each fund by its portfolio manager.The views expressed are those of the portfoliomanager for each fund as of December 31, 2013, andmay have changed since that date. The opinionsstated may contain forward-looking statements and
may discuss the impact of domestic and foreignmarkets, industry and economic trends andgovernmental regulations of the funds and theirholdings. Such statements are subject to uncertainty,and the impact on the funds might be materiallydifferent from what is described here.

P E R F O R M A N C E E V A L U A T I O N P R E P A R E D B Y T H E F U N D ’ SI N V E S T M E N T A D V I S E R , R E A D V I S E R S C O R P O R A T I O N
Daily Income Fund
FUND PERFORMANCEThe Daily Income Fund earned a total return of 0.01% for2013. The seven-day effective annualized yield was 0.01% atDecember 31, 2013, unchanged from a year earlier. Interestincome for the Fund is netted against operating expenses. Withinterest income at historic lows, RE Advisers continues towaive fees and/or reimburse expenses to assist the Fund inmaintaining a positive yield. As long as the Federal Reserve(Fed) continues to maintain a federal funds rate close to zero,the Daily Income Fund will continue to earn very little interestincome.
MARKET CONDITIONSDuring 2013, the Fed continued its policy of historically lowshort-term interest rates, which was initially established inDecember 2008 with the goal of stimulating economic activity.The Fed held the target rate for the federal funds rate between0.0% and 0.25% for the fifth full calendar year. As a result,short-term money market interest rates remained very lowthroughout the year.
The Fed bases its policies on measures of economic growthand inflation. Economic growth, as measured by GDP, was1.8% in the first quarter of 2013, 2.5% in the second quarterand 4.1% in the third quarter. The unemployment rate beganthe year at 7.9% and declined to 6.7% in December. Inflationremained subdued throughout the year, and corporate cashbalances remained high.
As the year began, the Fed continued its actions to support theeconomy by purchasing mortgage-backed and longer-termTreasury securities at a rate of approximately $85 billion permonth. Guidance from the Federal Open Market Committee(FOMC), the Fed’s policy-making group, continued to indicatethat short-term interest rates would remain exceptionally low
until the unemployment rate declined to 6.5%—so long asinflation and inflation expectations remained in check. In May2013, the FOMC observed that the economy was expanding ata moderate pace and noted improvements in the labor market.The Committee began to suggest that it may consider tapering,or reducing, the amount of monthly mortgage and Treasurypurchases due to improvements in the economy.
At its meeting in December, the FOMC announced that it wouldbegin tapering asset purchases by $10 billion per monthstarting in January 2014. Furthermore, the Committeeindicated its expectation to continue to taper asset purchases,should expected improvements in the labor marketsmaterialize, and to take a measured approach in scaling backits bond-buying program. However, the FOMC also indicatedthat based on its assessment of various economic factors thetargeted range for the federal funds rate would be maintainedat a low level well-past the time that the unemployment ratedeclines below 6.5%.
OUTLOOKGoing into 2014, the economy appears to have finally gatheredsteam. Growth in GDP eclipsed 4.0% in the third quarter of2013, and fourth quarter 2013 measures are expected to showcontinued strength. The economy cruised through thegovernment shut-down without a measurable impact, the fiscalpicture is improving with some restraint in spending, andemployment growth is increasing. As confidence returns, aself-sustaining, more normal recovery appears to be closerthan at any time in the past five years.
Investors in the Daily Income Fund can anticipate a stableshare price but little investment return until the Fed shifts froman accommodative to a neutral policy stance and creditdemand increases.
2 Performance Evaluation
Daily Income Fund
AVERAGE ANNUAL TOTAL RETURNS 1 Year 5 Year 10 Year
periods ended 12/31/13
Daily Income Fund 0.01% 0.07% 1.45%
The returns quoted in the above table represent past performance, which is no guarantee of future results. Current performance may be higheror lower than that shown above. Returns and the principal value of your investment may be worth more or less than its original cost. Aninvestment in the Daily Income Fund is not insured or guaranteed by the Federal Deposit Insurance Corporation (FDIC) or any othergovernment agency. While the Daily Income Fund seeks to maintain a constant $1.00 per share price, it is possible to lose money investing inthe Fund. The Daily Income Fund’s average annual total returns are net of any fee waivers and reimbursements. Returns do not reflect taxesthat the shareholder may pay on Fund distributions or the redemption of Fund shares.
YIELD
Annualized 7-day effective yield quoted 12/31/13 0.01%
SECURITY DIVERSIFICATION on 12/31/12 on 12/31/13
(% of total investments)
Commercial paper 59.3% 73.0%U.S. Government obligations 21.0% 17.2%Corporate bonds 10.1% 0.7%Short-term and other assets 9.6% 9.1%
Total 100.0% 100.0%
MATURITY on 12/31/12 on 12/31/13
Average Weighted Maturity 46 days 43 days
Performance Evaluation 3

P E R F O R M A N C E E V A L U A T I O N P R E P A R E D B Y T H E F U N D ’ SI N V E S T M E N T A D V I S E R , R E A D V I S E R S C O R P O R A T I O N
Short-Term Government Securities and Short-TermBond Funds
FUND PERFORMANCEThe Short-Term Government Securities Fund returned-0.72% for 2013 compared to the benchmark’s return of-0.19%. While the asset-backed sector made a positivecontribution to Fund performance, its effect was limited givenits small size relative to other sectors in the Fund. The largecash position was the second best sector performer but wasstill a drag on results relative to the Index. The weakest sectorwas the corporate sector due to its heavy exposure to export-import bank guaranteed aircraft and equipment financingissues. These issues tend to be longer maturity securities thatwere especially hard hit by the fall in the five-year Treasurynote whose yield rose more than 100 basis points in 2013.
The Short-Term Bond Fund returned 1.64% in 2013compared to the benchmark’s return of 0.32%. Most of theFund’s sectors helped to boost performance. The asset-backedsector was a strong performer and the mortgage-backed sectorhad very strong relative and absolute performance. Theweakest relative performing sector was municipals, whichsuffered in general not only from rising rates but also from thenegative publicity surrounding the Detroit, Michigan bankruptcyfiling in July and the media’s subsequent focus on PuertoRico’s financial condition. Please note a few things about theFund’s Puerto Rico positions, namely 1) the Fund had nopositions previous to the onslaught of negative stories 2) theFund owns only insured paper guaranteed by a stronglycapitalized financial entity and bonds backed by a dedicatedrevenue stream to meet debt service requirements and 3) thepositions in total were an absolute positive contributor toperformance in 2013.
MARKET CONDITIONSThe bond market entered 2013 with the expectation of modesteconomic growth, low inflation and a continuation of theFederal Reserve’s zero interest policy and bond buyingprograms (known as Quantitative Easing). While theeconomy’s growth rate was indeed modest and marketsupportive, inflation as measured by the Consumer Price Index(CPI) was weaker than expected. This suggested that areduction in the Fed’s highly stimulative monetary policy wasextremely unlikely, particularly given the still elevatedunemployment rate, which in 2013 remained over the 6.5%threshold necessary to even begin discussing hiking short-terminterest rates. Although the domestic auto and housing marketscontinued their post-financial crisis rebounds, other concernscontinued to support the market, including, but not limited to,Europe’s recession, fears of slower Chinese growth, Japanesemonetary stimulus and ongoing political dysfunctions inWashington. While U.S. Treasury yields declined modestly andreached their low for the year in early May, the market was
then hit with a one-two punch: first with the release of theApril 30/May 1 Federal Open Market Committee (FOMC)minutes, in which the bond market interpreted that a potentialreduction in Fed bond buying was likely, and second by BenBernanke’s press conference following the June 19 FOMCmeeting, where a fairly specific timetable for reducing bondpurchases (“tapering”) was laid out. Treasury yields rosesharply and didn’t reach a peak for the year until earlySeptember. The market expected the Fed to announce the firsttaper after the September 18 FOMC meeting but was caughtoff guard once again as the Fed delayed the decision to begintapering. The pause was due, at least in part, to a tightening infinancial market conditions, which was primarily due to taperingtalk in the first place. Yields then declined into October asmarket hysteria over raising the debt ceiling resulted in multiplecasualties including a marked fall in consumer sentiment andseveral large money market funds dumping U.S. Treasury bills.Once the debt ceiling crisis passed the market started to focusonce again on tapering worries, which came to fruition onDecember 18 following the FOMC meeting and theCommittee’s announcement that tapering would begin inJanuary 2014. Yields ended the year noticeably higher thantheir October interim lows.
GDP expanded a rather modest 2.0% in the year endedSeptember 30, 2013, as compared to 3.1% in the year earlierperiod. This growth helped generate an average of 187,000 jobgains per month in 2013, which is slightly below the 194,000average in 2012. This still leaves total employment nearly1.2 million below the January 2008 peak. The Decemberunemployment rate declined to 6.7% from 7.9% a year earlieras job gains and labor force participation rate loses combinedto substantially lower the rate. The broader U-6 unemploymentrate fell from 14.4% to 13.1% during the same time period. TheConsumer Price Index (CPI) rose at a 1.2% rate for the yearended November 30, 2013, as compared to 1.8% in the yearearlier period while the Core CPI (excludes the volatile foodand energy sectors) rose 1.7% and 1.9%, respectively, for thesame time periods.
The ISM Manufacturing Index averaged 53.9 in 2013 ascompared to 51.7 in 2012. Confirming this growth is IndustrialProduction which rose 3.2% for the year ended November 30,2013, and now stands at an all-time high after exceeding thelevel of the previous peak seen in December 2007. U.S. autosales averaged 15.5 million in 2013 as compared to14.4 million in 2012. Total retail sales rose 4.1% in 2013 ascompared to a 5.2% in 2012. Housing starts averaged 918,000for the year ended November 30, 2013, as compared to755,000 in the year earlier period while existing home salesaveraged 5.1 million and 4.6 million, respectively, for the same
4 Performance Evaluation

time period. The University of Michigan Consumer ConfidenceSentiment Index averaged 79.2 in 2013 as compared to 76.5 in2012.
The FOMC continues to maintain its federal funds rate target ina range of 0.00% to 0.25%. At the December FOMC meeting,the Fed announced a measured reduction in its AssetPurchase Program (QE3) by forecasting that starting inJanuary 2014 it will lower its monthly purchases by $10 billionand will likely reduce bond purchases further in measuredsteps assuming labor markets continue to improve and inflationstarts to trend in the other direction and towards the FOMC’s2.0% longer-run goal. The FOMC now anticipates that thefederal funds rate will be held in the current range well past thetime the unemployment rate declines below 6.5%.
OUTLOOKThe Federal Reserve is forecasting 3.0% GDP growth for 2014along with a drop in the unemployment rate below the 6.5%threshold. While the Fed has generally been too optimistic inforecasting economic growth, this time it is likely they mayactually be surprised on the upside. On the domestic front, theinterest sensitive sectors—autos and housing—should remainfirm while continued job gains should keep consumersentiment rising and wallets open. On the business front,recent stock market strength—notwithstanding the early 2014hiccup—seems to be confirming an underlying strength to theeconomy and a capital spending boom seems overdue. Thefiscal drag from Washington has pretty much passed, and it islikely that China and Japan will support world growth whileEurope looks like it may be finally coming out of the woods.Eurozone currency members saw November IndustrialProduction rise at the fastest pace in 3 1⁄2 years and Novemberretail sales rose at the fastest pace on record. It may not be acoincidence that Greece was the best performing bond marketin 2013.
The Fed learned in the spring and summer of 2013 that marketperception is everything as the mere mention of reducing bond
purchases led to a violent bond market reaction, which wasfollowed by repeated Fed speakers denying that tapering hadanything to do with a tighter monetary policy. This marketreaction likely played a major role in the Fed not tapering inSeptember as more time was needed to prepare the marketsfor the event itself, and by extending the forward guidance onzero short-term rates the Fed is attempting to limit the damageto the bond market. As the Fed’s balance sheet has grownever larger, the FOMC hawks have noted that benefits such aslower interest rates, more accommodative financial conditionsand a stronger economy may be more than offset by assetbubbles, looser loan covenants and just the sheer difficulty ofunwinding such a gargantuan amount of assets without majormarket disruptions.
While the Fed can argue all they want that tapering is nottightening, one of the primary reasons asset purchases weremade was because the Fed could not push the federal fundsrate below 0%; hence to be more accommodative, the Fed’sbalance sheet was greatly expanded above normal levels. Asthe growth rate of purchases slows and, ultimately, as thebalance sheet starts to shrink, the Fed becomes lessaccommodative by definition. Tapering is the first step in whatis likely to be a very long process in the eventual normalizationof interest rates.
The Fed will likely continue to anchor the fed funds rate at 0%for the foreseeable future and, as a result, interest rates canonly rise so far even with Fed tapering about to start. At thismoment in time the first rate hike looks like a late 2015probability, and as calendar year 2014 progresses, this 2015event may start to affect investor psychology, particularly if theFed adheres to the market’s perceived pace of tapering whichis a $10 billion reduction in asset purchases per FOMCmeeting in 2014. Given this somewhat limited market upsideand tight credit spreads, we anticipate continuing to maintainexcess liquidity in the Funds until more attractive investmentopportunities present themselves.
Performance Evaluation 5

Short-Term Government Securities Fund
AVERAGE ANNUAL TOTAL RETURNS 1 Year 5 Year 10 Year
periods ended 12/31/13
Short-Term Government Securities Fund -0.72% 1.64% 2.53%BofA Merrill Lynch 1-5 Year U.S. Treasury Index -0.19% 1.57% 3.09%
SECURITY DIVERSIFICATION on 12/31/12 on 12/31/13
(% of total investments)
Government-guaranteed agencies 57.7% 50.6%Corporate bonds 11.6% 15.3%U.S. Treasuries 9.2% 6.5%Municipal bonds 2.8% 5.7%Mortgage-backed securities 3.8% 3.5%Asset-backed securities 1.2% 0.5%Short-term and other assets 13.7% 17.9%
Total 100.0% 100.0%
MATURITY on 12/31/12 on 12/31/13
Average Weighted Maturity 2.85 years 2.94 years
PERFORMANCE COMPARISON
10
11
12
$14
13
Short-Term Government Securities Fund
BofA Merrill Lynch 1-5 Year U.S. Treasury Index
in th
ousa
nds
$12,836
$13,558
Dec 13Dec 12Dec 11Dec 10Dec 09Dec 08Dec 07Dec 06Dec 05Dec 04Dec 03
Comparison of the change in value of a $10,000 investment in the Fund and the BofA Merrill Lynch 1-5 Year U.S. Treasury Index made onDecember 31, 2003.
The returns quoted in the above table and chart represent past performance, which is no guarantee of future results. Current performance may behigher or lower than that shown above. Returns and the principal value of your investment will fluctuate such that shares, when redeemed, maybe worth more or less than their original cost. The Short-Term Government Securities Fund’s average annual total returns are net of any feewaivers and reimbursements. Returns do not reflect taxes that the shareholder may pay on Fund distributions or the redemption of Fund shares.
6 Performance Evaluation

Short-Term Bond Fund
AVERAGE ANNUAL TOTAL RETURNS 1 Year 5 Year 10 Year
periods ended 12/31/13
Short-Term Bond Fund 1.64% 5.91% 3.86%BofA Merrill Lynch 1-5 Year Corp./Gov. Index 0.32% 2.98% 3.41%
SECURITY DIVERSIFICATION on 12/31/12 on 12/31/13
(% of total investments)
Municipal bonds 17.9% 24.7%Corporate bonds 22.0% 18.9%Asset-backed securities 14.7% 16.2%Yankee bonds 17.9% 13.2%Mortgage-backed securities 7.2% 4.7%U.S. Government obligations 3.3% 3.6%Short-term and other assets 17.0% 18.7%
Total 100.0% 100.0%
MATURITY on 12/31/12 on 12/31/13
Average Weighted Maturity 2.86 years 2.81 years
PERFORMANCE COMPARISON
10
11
12
$15
13
14Short-Term Bond Fund
BofA Merrill Lynch 1-5 Year Corp./Gov. Index
in th
ousa
nds
$13,988
$14,601
Dec 13Dec 12Dec 11Dec 10Dec 09Dec 08Dec 07Dec 06Dec 05Dec 04Dec 03
Comparison of the change in value of a $10,000 investment in the Fund and the BofA Merrill Lynch 1-5 Year Corp./Gov. Index made onDecember 31, 2003.
The returns quoted in the above table and chart represent past performance, which is no guarantee of future results. Current performance may behigher or lower than that shown above. Returns and the principal value of your investment will fluctuate such that shares, when redeemed, maybe worth more or less than their original cost. The Short-Term Bond Fund’s average annual total returns are net of any fee waivers andreimbursements. Returns do not reflect taxes that the shareholder may pay on Fund distributions or the redemption of Fund shares.
Performance Evaluation 7

P E R F O R M A N C E E V A L U A T I O N P R E P A R E D B Y T H E F U N D ’ SI N V E S T M E N T A D V I S E R , B L A C K R O C K F U N D A D V I S O R S
Stock Index Fund
INDEX AND FUND PERFORMANCEFor the 12 months ended December 31, 2013, the U.S. largecap market metric and the Fund’s benchmark, the Standard &Poor’s (S&P) 500® Stock Index, advanced 32.39%. The S&P500® Index is a market capitalization-weighted index composedof 500 common stocks issued by large-capitalizationcompanies in a wide range of industries. The stocks included inthe index collectively represent a substantial portion of allcommon stocks publicly traded in the United States. The StockIndex Fund advanced 31.72% for the year, tracking the Indexby design and lagging a bit due to deductions for Fund feesand costs. The Index is not managed and does not incur anyfees; it is not possible to invest directly in the Index.
From a sector perspective, the consumer-driven areas of theS&P 500® Index were strong performers in 2013. Consumerdiscretionary stocks (+43.08%) generated stellar returns, asdid health care (+41.46%), industrials (+40.68%) and financials(+35.63%). Significant gains also came from the informationtechnology sector (+28.43%), consumer staples (+26.14%),materials (+25.60%) and energy (+25.07%). Even the relativelyweaker sectors posted large returns, including utilities(+13.21%) and telecommunication services (+11.47%).
During the 12-month period, as changes were made to thecomposition of the S&P 500® Index, the Master Portfolio inwhich the Fund invests purchased and sold securities tomaintain its objective of replicating the risks and return of thebenchmark index.
MARKET CONDITIONSU.S. equity markets began 2013 with a powerful relief rallyafter the United States averted the worst of its potential fiscalcrisis with a last-minute tax deal. The rally softened inFebruary, however, as economic momentum slowed. Later inthe first quarter, a stalemate presidential election in Italy and asevere banking crisis in Cyprus reminded investors thatpolitical and financial instability in Europe continued to poserisks. The ascent of equities persevered as increased globalliquidity kept interest rates low and investors turned to riskierasset classes in search of yield.
As the year progressed, the direction of stock markets becameincreasingly dominated by speculation around the future ofmonetary policy. Sluggish U.S. growth, ironically, was often
conducive to positive stock market performance as weakeconomic data reinforced investors’ expectations that the U.S.Federal Reserve would maintain its accommodative stance.Additionally, the modest pace of economic growth bode well forcorporate profit margins as the U.S. recovery was strongenough to support revenues while nearly stagnant wagegrowth kept costs low.
After peaking in late May, stock markets recoiled when FedChairman Bernanke mentioned the possibility of graduallyreducing (or “tapering”) monetary stimulus before the end of2013. Volatility picked up considerably as many investorsmisinterpreted the Fed’s remarks as signaling the end of lowshort-term interest rates. However, equities staged a swift mid-summer rebound when the Fed’s tone turned more dovish.Later in the third quarter, mixed economic data drove highvolatility as it made investors increasingly anxious about whenand how much the Fed would scale back on its monthly assetpurchase program. Also concerning was the escalation of therevolution in Egypt and the civil war in Syria, events that fueledhigher oil prices, an additional headwind for global growth.
September brought another sharp rally as the Fed defiedmarket expectations with its decision to delay tapering its assetpurchases. On the geopolitical front, the turmoil in Egypt andSyria subsided and the re-election of Angela Merkel asChancellor of Germany was welcomed as a continuation of thestatus quo. The equity market advance was interrupted againin late September when the U.S. teetered on breaching thenational debt ceiling and political brinksmanship led to a partialgovernment shutdown. The rally quickly resumed in mid-October when politicians engineered a compromise to reopenthe government and extend the debt ceiling until early 2014.
As economic indicators improved later in the fall, investorsgrappled with rising uncertainty around the timing of theanticipated Fed taper. This anxiety was ultimately relievedwhen the central bank announced the commencement oftapering in mid-December. Investors reacted positively to thispolicy move as it signaled the Fed’s perception of realimprovement in U.S. growth. Sentiment was also buoyed bythe extension of the Fed’s expected time horizon formaintaining low short-term interest rates.
8 Performance Evaluation

Stock Index Fund
AVERAGE ANNUAL TOTAL RETURNS 1 Year 5 Year 10 Year
periods ended 12/31/13
Stock Index Fund 31.72% 17.33% 6.79%Standard & Poor’s 500 Stock Index 32.39% 17.94% 7.41%
INDUSTRY DIVERSIFICATION
% of TotalLong-Term
Investmentsat 12/31/13*
% of TotalLong-Term
Investmentsat 12/31/13*
Information technology 18.6% Energy 10.3%Financials 16.2% Consumer staples 9.8%Health care 13.0% Materials 3.5%Consumer discretionary 12.5% Utilities 2.9%Industrials 10.9% Telecommunication services 2.3%
Total 100.0%
TOP TEN EQUITY HOLDINGS
% of TotalLong-Term
Investmentsat 12/31/13*
% of TotalLong-Term
Investmentsat 12/31/13*
Apple, Inc. 3.1% Johnson & Johnson 1.6%Exxon Mobil Corp. 2.7% Chevron Corp. 1.5%Google, Inc. (Class A) 1.9% Procter & Gamble Co. (The) 1.3%Microsoft Corp. 1.7% JPMorgan Chase & Co. 1.3%General Electric Co. 1.7% Wells Fargo & Co. 1.3%
PERFORMANCE COMPARISON
8
10
12
$22
14
16
18
20 Stock Index Fund
Standard & Poor's 500 Stock Index
in th
ousa
nds
$19,280
$20,428
Dec 13Dec 12Dec 11Dec 10Dec 09Dec 08Dec 07Dec 06Dec 05Dec 04Dec 03
Comparison of the change in value of a $10,000 investment in the Fund and the Standard & Poor's 500 Stock Index made on December 31, 2003.
The returns quoted in the above table and chart represent past performance, which is no guarantee of future results. Current performance may behigher or lower than that shown above. Returns and the principal value of your investment will fluctuate such that shares, when redeemed, maybe worth more or less than their original cost. The Stock Index Fund's average annual total returns are net of any fee waivers andreimbursements. Returns do not reflect taxes that the shareholder may pay on Fund distributions or the redemption of Fund shares.
*Holdings information is for the S&P 500 Stock Master Portfolio, managed by BlackRock Fund Advisors, the Portfolio in which the Stock IndexFund invests all of its investable assets. Please refer to the Appendix for the complete semi-annual report of the S&P 500 Stock Master Portfolio.
Performance Evaluation 9

P E R F O R M A N C E E V A L U A T I O N P R E P A R E D B Y T H E F U N D ’ SI N V E S T M E N T A D V I S E R , R E A D V I S E R S C O R P O R A T I O N
Value Fund
FUND PERFORMANCEThe Value Fund increased 35.74% for 2013 and its benchmarkindex, the unmanaged Standard & Poor’s 500® Stock Index,increased 32.39%. The Fund’s outperformance relative to theIndex was due primarily to the performance of its health care,industrials and information technology sector holdings.
PORTFOLIO REVIEWThe Fund held a significantly greater percentage of its assetsin health care related stocks compared with the overall Index.The positive effects of the Fund’s overweighted position in thehealth care sector were slightly reduced by stock selectionwithin the sector. Bristol-Myers Squibb was the largest stockholding in the Fund and also made the greatest contribution tothe Fund’s return. AbbVie, Inc. was also a meaningfulcontributor to the Fund’s health care results for 2013.
The Fund also benefited from its overweighted position in theindustrials sector. Stock selection within this sector wasfavorable as the Fund’s industrial positions appreciated morethan their Index counterparts and well outpaced the Index’sreturn. Parker Hannifin Corp., Honeywell International, Inc. andSouthwest Airlines Company were significant contributors.
The Fund’s information technology holdings rebounded from atough 2012 and delivered significantly positive returns in 2013.The Fund held a slightly underweight position in the informationtechnology sector compared with the overall Index; howeverstock selection was positive for performance as the Fund’sinformation technology holdings appreciated more than theIndex’s sector holdings and more than the Index overall. Withininformation technology, Hewlett-Packard, Leidos Holdings andTE Connectivity were the stocks that made the greatestcontributions.
While a modestly positive contributor to absolute returns, theFund’s consumer discretionary positions detracted fromrelative results, due to the performance of positions in CooperTire & Rubber Company and Dillard’s, Inc.
This was a strong and broad-based bull market. Only two ofthe stocks in the portfolio depreciated, and all of the sectorpositions (except cash) contributed positively to the Fund’sreturn.
ADT Limited and Pentair were eliminated from the Fund’sportfolio and the proceeds deployed into other stocks. Dell Inc.was taken private when it was acquired by a consortium led bythe founder Michael Dell.
OUTLOOKThe general consensus now appears to be that U.S. GDPgrowth will be about 2% for 2013 and gradually reach 3% in thesecond half of 2014. The reasons for this come fromstrengthening manufacturing and capital equipment data forNovember 2013 and many good initial signs for December2013 growth as well. The labor market seems to be slowlyimproving and housing continues its long grinding recovery.Though uncertainty remains regarding tax policy, generalregulation and the unknown impact of the Affordable Care Act,the recent clarifications and decisions regarding financialregulation have perhaps generated a perception that theresulting statutes will not be as onerous as once feared, andthat has provided some general optimism.
Recent commentary by the Federal Reserve concerningbacking away from Quantitative Easing has been taken prettymuch in stride more recently, but that may in part be due tomore ebullience surrounding the economic outlook for 2014.That should be construed as positive and a sign for confidencein the overall economy.
The last five years of an uncertain fiscal and economicenvironment led to corporate management decisions, on themargin, to return a greater portion of capital to shareholders viastock repurchases and dividends. While there are noguarantees, it is possible that 2014 may prove to be a pivotalor transition year for capital deployment. During the last severalyears, return of capital in the form of stock repurchases anddividend payments has been a rewarding use of cash forcompanies and their shareholders. Going forward, anaccelerating economy will call for more capital to be deployedin assets and employees to generate returns. We are on thelookout for these investment opportunities.
In this environment, as well as others, we continue to searchfor companies with strong earnings potential and healthybalance sheets that are trading at attractive valuations.
10 Performance Evaluation
Value FundAVERAGE ANNUAL TOTAL RETURNS 1 Year 5 Year 10 Year
periods ended 12/31/13
Value Fund 35.74% 17.55% 8.25%Standard & Poor’s 500 Stock Index 32.39% 17.94% 7.41%
INDUSTRY DIVERSIFICATION
% of TotalInvestmentat 12/31/13
% of TotalInvestmentat 12/31/13
Health care 21.1% Consumer discretionary 6.7%Industrials 20.1% Materials 6.1%Energy 14.7% Consumer staples 4.2%Information technology 13.1% Short-term and other assets 4.8%Financials 9.2%
Total 100.0%
TOP TEN EQUITY HOLDINGS
% of TotalInvestmentat 12/31/13
% of TotalInvestmentat 12/31/13
Bristol-Myers Squibb Co. 5.2% General Electric Co. 3.6%Pfizer Inc. 4.2% Cisco Systems, Inc. 3.5%Parker-Hannifin Corp. 3.9% Genuine Parts Co. 3.2%Dow Chemical Co. (The) 3.9% Avery Dennison Corp. 3.2%Intel Corp. 3.6% JPMorgan Chase & Co. 3.2%
PERFORMANCE COMPARISON
8
10
12
$24
14
16
18
20
22 Value Fund
Standard & Poor's 500 Stock Index
in th
ousa
nds
$20,428
$22,090
Dec 13Dec 12Dec 11Dec 10Dec 09Dec 08Dec 07Dec 06Dec 05Dec 04Dec 03
Comparison of the change in value of a $10,000 investment in the Fund and the Standard & Poor’s 500 Stock Index made on December 31,2003.
The returns quoted in the above table and chart represent past performance, which is no guarantee of future results. Current performance may behigher or lower than that shown above. Returns and the principal value of your investment will fluctuate such that shares, when redeemed, maybe worth more or less than their original cost. The Value Fund’s average annual total returns are net of any fee waivers and reimbursements.Returns do not reflect taxes that the shareholder may pay on Fund distributions or the redemption of Fund shares.
Performance Evaluation 11

P E R F O R M A N C E E V A L U A T I O N P R E P A R E D B Y T H E F U N D ’ SS U B A D V I S E R , T . R O W E P R I C E A S S O C I A T E S
Growth Fund
PERFORMANCEThe Homestead Growth Fund posted a robust 43.40% gain forthe 12-month period and significantly outperformed the Russell1000 Growth Index, which returned 33.48%. Stock selectioncontributed the most to performance relative to the Index,especially in the consumer discretionary, health care andinformation technology sectors. Sector allocation also added torelative performance. An underweight position in consumerstaples and overweight positions in consumer discretionaryand health care were beneficial.
PORTFOLIO REVIEWThe consumer discretionary sector contributed the most to theportfolio’s performance relative to the Index. Stock selection,especially Internet and catalog retail names, and an overweightposition in the sector aided results. Netflix and priceline.comwere among the portfolio’s top contributors within the sector.Continued subscription growth, improving brand perceptionand lack of strong competition drove shares of Netflix higher.The company also has been expanding internationally and itsoriginal content has seen growing popularity. Online travelcompany priceline.com benefited from consumers’ increasedtravel-related spending, particularly on rental cars. Thecompany continues to take market share from other onlinetravel companies, aided by its smartphone apps, whichfrequent travelers find particularly helpful.
Health care was also an area of outperformance for theportfolio, driven by Gilead Sciences and ValeantPharmaceuticals International. Gilead Sciences continues toperform well, driven by its widely prescribed HIV treatments.The company is also making progress in oncology. Itstreatment for certain types of cancer has shown positive resultsduring early trials. Investors viewed the acquisition of Bausch &Lomb by Valeant Pharmaceuticals in May favorably. Theacquisition expands the company’s offerings into the eyehealth market.
Google drove results in the information technology sector. Thecompany benefited from the popularity of smartphones runningon its Android operating system and higher advertising salesvolume in both the traditional and mobile marketplace.
The portfolio’s telecommunication services sectorunderperformed over the past 12 months, mainly due to stock
selection. Crown Castle International was a notable detractor.The company, along with other wireless communication towercompanies and real estate investment trusts, was affected byrising interest rates, as investors tend to seek securities with alower risk profile when the yield is comparable.
Two chemical companies—Praxair and Sherwin-Williams—weighed on results versus the Index in the materials sector.The share prices of both companies were up over 20% for theyear, but lagged the performance of the broader sector.Currency exchange headwinds buffeted Praxair, as thecompany generates over half of its sales outside of the U.S.,notably in Brazil, Europe and Canada. Sherwin-Williams wasaffected after Mexican regulators twice denied its acquisition ofComex Mexico. In addition, the company lost a lead paintlitigation case in California.
OUTLOOKWe seek to invest in large-cap growth companies that, in ourview, are well established in their industries and have thepotential for above-average earnings growth. We focus oncompanies with leading market positions, seasonedmanagement and strong financial fundamentals. Ourinvestment approach reflects our belief that solid companyfundamentals (with emphasis on strong growth in earnings pershare or operating cash flow), combined with a positiveindustry outlook, ultimately will reward investors with stronginvestment performance.
Equities were driven higher in 2013 as investors moved out ofsafer assets and into riskier areas of the market. We see acontinuation of this trend as we move into 2014, although on amore moderate scale. We are generally optimistic about theenvironment for equities for several reasons. First, globaleconomic growth should pick up, with Europe appearing to beon track to follow the U.S. trajectory. Second, stock valuationsremain attractive overall despite last year’s strongperformance. Third, inflation remains under control. As long asinterest rates do not rise too precipitously in the comingmonths, we believe large-cap growth stocks can perform well.While a moderate correction in equities is always a possibility,we do not anticipate a significant sell-off, and we believe weare well positioned to participate in the ongoing bull market weenvision.
12 Performance Evaluation

Growth Fund
AVERAGE ANNUAL TOTAL RETURNS 1 Year 5 Year 10 Year
periods ended 12/31/13
Growth Fund* 43.40% 23.67% 8.72%Russell 1000 Growth Index 33.48% 20.39% 7.83%Standard & Poor’s 500 Stock Index 32.39% 17.94% 7.41%
INDUSTRY DIVERSIFICATION
% of TotalInvestmentat 12/31/13
% of TotalInvestmentat 12/31/13
Information technology 25.9% Materials 3.9%Consumer discretionary 23.9% Energy 3.9%Health care 16.2% Consumer staples 3.1%Industrials 14.5% Telecommunication services 2.8%Financials 4.1% Short-term and other assets 1.7%
Total 100.0%
TOP TEN EQUITY HOLDINGS
% of TotalInvestmentat 12/31/13
% of TotalInvestmentat 12/31/13
Google Inc. (Class A) 5.8% Crown Castle International Corp. 2.8%Amazon.com, Inc. 5.2% Danaher Corp. 2.6%Gilead Sciences, Inc. 4.2% Boeing Co. (The) 2.6%priceline.com, Inc. 3.1% MasterCard Inc. (Class A) 2.6%Precision Castparts Corp. 2.8% McKesson Corp. 2.3%
PERFORMANCE COMPARISON
5
10
15
$25
20
Growth Fund*
Russell 1000 Growth IndexStandard & Poor's 500 Stock Index
in th
ousa
nds
$20,428$21,254
$23,066
Dec 13Dec 12Dec 11Dec 10Dec 09Dec 08Dec 07Dec 06Dec 05Dec 04Dec 03
Comparison of the change in value of a $10,000 investment in the Fund and its benchmark indices made on December 31, 2003.
The returns quoted in the above table and chart represent past performance, which is no guarantee of future results. Current performance may behigher or lower than that shown above. Returns and the principal value of your investment will fluctuate such that shares, when redeemed, maybe worth more or less than their original cost. The Growth Fund’s average annual total returns are net of any fee waivers and reimbursements.Returns do not reflect taxes that the shareholder may pay on Fund distributions or the redemption of Fund shares.
*Performance information for the Growth Fund (formerly the Nasdaq-100 Index Tracking StockSM Fund) reflects its previous investment strategyfrom inception through December 5, 2008, of matching, as closely as possible, before expenses, the performance of the Nasdaq-100 Stock Index.
Performance Evaluation 13

P E R F O R M A N C E E V A L U A T I O N P R E P A R E D B Y T H E F U N D ’ SI N V E S T M E N T A D V I S E R , R E A D V I S E R S C O R P O R A T I O N
Small-Company Stock Fund
FUND PERFORMANCEThe Fund increased 36.58% in 2013 while its benchmark, theRussell 2000 Index, increased 38.82%. While the market’sadvance was strong and broadly based, small-company stocksgenerally outperformed large-company stocks by a narrowmargin, as represented by the major stock market indexes.
PORTFOLIO REVIEWThe Fund’s results were aided largely by the performance ofstocks in the financials, materials and energy sectors. Thoughthe Fund’s sector weighting in financials was less than theIndex’s, stock selection was favorable as the Fund’s positionsappreciated more than the Index’s sector holdings and morethan the Index overall. Texas Capital Bancshares and EncoreCapital Group, Inc. led the sector.
Materials, led by PolyOne and Westlake Chemical, increasedmore than the Index’s materials sector and the Index overall.
Stock selection was also favorable for the energy sector. Eventhough the Fund was underweighted in energy compared withthe Index, the Fund’s holdings appreciated substantially morethan the Index’s energy sector positions and the overall Index.Cimarex Energy Company was the prime contributor to theFund’s energy sector results.
Though the Fund’s positions in the industrial, informationtechnology and health care industries appreciated during theyear, the Fund’s industrial and information technology holdingsdid not keep pace with their respective Index sectors and theoverall Index, and as such, detracted from results compared tothe benchmark. The Fund’s health care holdings had betterresults than the overall Index, but trailed the Index’s healthcare sector. The stocks of Werner Enterprises Inc., ManTechInternational Corporation and STERIS Corporation wereamong those positions that appreciated but did not keep pacewith the overall market.
As it will in any strong equity market, the Fund’s cash positionwas negative for performance relative to the Index, which hasno cash component.
New names added to the Fund during the year included: TexasCapital Bancshares, Inc., a Dallas based bank focused oncommercial lending throughout Texas; American VanguardCorp., a developer and marketer of chemical products foragricultural and commercial use; Francesca’s HoldingsCorporation, a retailer of women’s apparel, jewelry,accessories and gifts; BJ’s Restaurants, Inc., an owner of achain of restaurants featuring a menu of beer, pizza and avariety of grilled items; National Penn Bancshares, Inc., theholding company for Boyertown, PA based National PennBank, which provides a variety of commercial and retailbanking services; and Myers Industries, Inc., a manufacturer ofplastic and rubber products for industrial, automotive,commercial and consumer markets. WhiteWave FoodsCompany was spun out of Dean Foods Company during theyear. WhiteWave Foods Co. produces and markets dairy anddairy alternative products.
OUTLOOKAs 2014 commences, indicators for the economy provideconflicting evidence of an accelerating economy. Recenthousing reports and the producer manufacturing index giveencouragement; while stuttering employment statistics—though much improved since 2008—call into question whetherthe economy will break out of its present tepid 2% growth.
The Federal Reserve’s effort to move away from its presenteasy money policy has resulted in slightly higher interest rates.In spite of the uptick in interest rates, economic forecasts havemoved a bit higher recently, with expectations for close to 3%GDP growth by the end of 2014. Unfinished regulations,uncertain fiscal policy and the rough introduction of theAffordable Care Act in 2014 remain for businesses to contendwith. Unlike previous Januaries, there seems to be a bit moreoptimism as we enter the fifth year of the economic recovery.
We appreciate your continued trust and investment.
14 Performance Evaluation

Small-Company Stock Fund
AVERAGE ANNUAL TOTAL RETURNS 1 Year 5 Year 10 Year
periods ended 12/31/13
Small-Company Stock Fund 36.58% 26.14% 11.89%Russell 2000 Index 38.82% 20.08% 9.07%
INDUSTRY DIVERSIFICATION
% of TotalInvestmentat 12/31/13
% of TotalInvestmentat 12/31/13
Industrials 26.2% Information technology 8.7%Financials 14.3% Health care 2.0%Consumer discretionary 13.7% Energy 1.7%Consumer staples 10.1% Short-term and other assets 13.8%Materials 9.5%
Total 100.0%
TOP TEN EQUITY HOLDINGS
% of TotalInvestmentat 12/31/13
% of TotalInvestmentat 12/31/13
iShares Russell 2000 Value ETF 4.8% Fred’s Inc. (Class A) 3.2%iShares Core S&P Small-Cap ETF 4.7% Werner Enterprises, Inc. 3.1%Applied Industrial Technologies, Inc. 3.6% Rofin-Sinar Technologies Inc. 3.0%Texas Capital Bancshares, Inc. 3.6% ManTech International Corp. 2.9%Olin Corp. 3.6% Knight Transportation, Inc. 2.8%
PERFORMANCE COMPARISON
5
10
15
$35
20
25
30 Small-Company Stock Fund
Russell 2000 Index
in th
ousa
nds $23,827
$30,766
Dec 13Dec 12Dec 11Dec 10Dec 09Dec 08Dec 07Dec 06Dec 05Dec 04Dec 03
Comparison of the change in value of a $10,000 investment in the Fund and the Russell 2000 Index made on December 31, 2003.
The returns quoted in the above table and chart represent past performance, which is no guarantee of future results. Current performance may behigher or lower than that shown above. Returns and the principal value of your investment will fluctuate such that shares, when redeemed, maybe worth more or less than their original cost. The Small-Company Stock Fund’s average annual total returns are net of any fee waivers andreimbursements. Returns do not reflect taxes that the shareholder may pay on Fund distributions or the redemption of Fund shares.
Performance Evaluation 15

P E R F O R M A N C E E V A L U A T I O N P R E P A R E D B Y T H E F U N D ’ SS U B A D V I S E R , M E R C A T O R A S S E T M A N A G E M E N T , L . P .
International Value Fund
FUND PERFORMANCEFor the twelve-month period ending December 31, 2013, theFund returned 23.44%, outperforming the MSCI EAFE Index,which returned 22.78%.
PORTFOLIO REVIEWThe portfolio continued to benefit from the overweight incontinental Europe, especially in financials. Three of our bestperformers were southern European banks, Intesa Sanpaolo,Banco Popular and Banco Espirito Santo, which were helpedby macro-economic and fiscal improvements in Italy, Spain andPortugal. European insurers, Aegon and AXA, which havesubstantial life insurance businesses, also performed well dueto their positive sensitivity to rising long-term interest rates inthe U.S. In addition, several of our more cyclically-orientedinvestments in Europe, such as Saint-Gobain and Cap Geminiin France, Adecco in Switzerland and Daimler in Germany, hadstrong returns as investors began to anticipate a long-awaitedrebound in economic activity.
Lixil, a Japanese stock we began buying in the third quarter,performed well as investors began to appreciate the company’simproved fundamentals following several sizable acquisitions.Mori Seiki, a Japanese machine tool company, was abeneficiary of stronger global growth and further weakness inthe yen. Japanese financial stocks also outperformed. Nissan,however, was one of our worst performers, reportingdisappointing earnings as a result of depressed emergingmarket demand and excess capacity.
Emerging markets in general remained weak during the fourthquarter and significantly lagged the developed world for theyear. In particular, our investments in Thailand were a drag onperformance as political turmoil created uncertainty.
During the fourth quarter, we purchased one new security,Italian-based Generali. We also sold out of three positionsduring the quarter: Vivendi, Teva Pharmaceutical and RossiResidencial.
It is worth noting that portfolio turnover in 2013 was about 17%,near the lower end of our historic range. This illustrates ourstrong conviction regarding our investment positioning. This istrue not only with regard to Europe, where we had investedearly, but also relative to our export-oriented focus in Japan,our avoidance or minimal exposure to what we believed wereovervalued markets such as Australia and Canada, and ourrelatively low weight in emerging market equities.
OUTLOOKFollowing five difficult years for the global economy, we believewe are finally returning to a more normal environmentcharacterized by low yet positive economic growth, low inflationand less volatility.
Within Europe we believe the financial sector still offers valuedespite the strong performance in 2013. The sector’s rally fromdistressed levels was largely related to a decline in equity riskpremium as investors began to realize that the Eurozone wasnot going to break apart. Earnings for European banks haveyet to recover but as loan quality improves, provisions(amounts set aside to cover estimated credit losses andtreated as expenses on company balance sheets) will fall,providing a significant boost to profits. In addition the increasein loan demand that normally coincides with an economicrecovery will result in strong revenue growth over the next fewyears. Valuations remain compelling particularly in Spain,Portugal and Italy with bank stocks in the portfolio trading onaverage at 70% of book value.
Japan’s economic recovery has surprised many skeptics.Following more than two decades of low or no growth, Japan’sGDP is accelerating on the back of highly stimulative actionsfrom the central bank. We expect quantitative easing tocontinue through the year and the economy should be furtherbolstered by Prime Minister Abe’s planned structural reforms.In addition, the weak yen, which lost 25% of its value relative tothe dollar in 2013, should continue to provide a tailwind forJapan’s exporters. Although the equity market increased 56%in local currency terms over the past year, earnings more thandoubled, resulting in a contraction in price/earnings multiples.As a result the Japanese market still trades at a modest14 times earnings.
Under the leadership of new premier Xi Jinping, China isattempting to reform the economy to improve its chances ofmaintaining stable growth. Among the targets for reform arethe financial sector, industrial overcapacity, political graft, localgovernment debt and social policies. These reforms maydampen Chinese demand and ultimately world commodityprices, as China is a leading consumer of most industrialcommodities.
Thailand has been beset by political instability aimed atreplacing the current government. This is nothing new. Overthe past 80 years Thailand has had 25 elections, 19constitutions and 18 coups or attempts, yet the market hasalways recovered to new highs. We believe that this currentperiod of volatility may be an interesting point to add to ourexisting positions.
We believe that, with discipline and patience, our actions willcontinue to pay off. In 2013, we saw our investment style comeback into favor as a strong focus on fundamental analysis andvaluation was rewarded by the market. We believe the macrobackdrop should allow this to continue into 2014, and we areconfident that our disciplined approach to stock selection andportfolio management will continue to add value.
16 Performance Evaluation

International Value Fund
AVERAGE ANNUAL TOTAL RETURNS 1 Year 5 Year 10 Year
periods ended 12/31/13
International Value Fund* 23.44% 10.00% 6.67%MSCI® EAFE® Index 22.78% 12.44% 6.91%
COUNTRY DIVERSIFICATION
% of TotalInvestmentat 12/31/13
% of TotalInvestmentat 12/31/13
Japan 16.6% Thailand 3.5%France 12.8% Hong Kong 3.4%Switzerland 11.6% Portugal 2.0%Britain 11.4% Denmark 2.0%Italy 7.0% Singapore 1.8%Germany 7.0% Canada 1.7%Netherlands 6.4% China 0.9%Republic of South Korea 3.7% Brazil 0.8%Spain 3.6% Short-term and other assets 3.8%
Total 100.0%
TOP TEN EQUITY HOLDINGS
% of TotalInvestmentat 12/31/13
% of TotalInvestmentat 12/31/13
AEGON NV 3.8% AXA SA 2.7%WPP Group plc 3.0% Compagnie de Saint-Gobain SA 2.6%Intesa Sanpaolo SpA 2.9% BAE Systems plc 2.6%Daimler AG REG 2.9% DSM NV 2.5%MS & AD Insurance Group Holdings, Inc. 2.8% IBERDROLA SA 2.5%
PERFORMANCE COMPARISON
5
10
15
$25
20
International Value Fund*
MSCI EAFE Index
in th
ousa
nds
$19,081$19,520
Dec 13Dec 12Dec 11Dec 10Dec 09Dec 08Dec 07Dec 06Dec 05Dec 04Dec 03
Comparison of the change in value of a $10,000 investment in the Fund and the MSCI® EAFE® Index made on December 31, 2003. The returnsquoted in the above table and chart represent past performance, which is no guarantee of future results. Current performance may be higher orlower than that shown above. Returns and the principal value of your investment will fluctuate such that shares, when redeemed, may be worthmore or less than their original cost. The International Value Fund’s average annual total returns are net of any fee waivers and reimbursements.Returns do not reflect taxes that the shareholder may pay on Fund distributions or the redemption of Fund shares.
*The performance information for the International Value Fund (formerly the International Stock Index Fund) reflects its investment experience inthe State Street MSCI® EAFE® Index Portfolio from inception through October 16, 2005, and in the Vanguard Developed Markets Index Fund fromOctober 17, 2005 to June 9, 2006. Mercator Asset Management, L.P.‘s role as subadvisor began on June 12, 2006.
Performance Evaluation 17

Expense Example
As a shareholder, you incur two types of costs: (1) transactioncosts; and (2) ongoing costs, including management fees,service fees, and other fund expenses. This example isintended to help you understand your ongoing costs (in dollars)of investing in each of the Homestead Funds and to comparethese costs with the ongoing costs of investing in other mutualfunds.
The example is based on an investment of $1,000 invested atJuly 1, 2013 and held through December 31, 2013.
ACTUAL EXPENSESThe first line for each Fund in the table on the following pageprovides information about actual account values and actualexpenses. You may use the information in this line, togetherwith the amount you invested, to estimate the expenses thatyou paid over the period. Simply divide your account value by$1,000 (for example, an $8,600 account value divided by$1,000 = 8.6), then multiply the result by the number in the firstline under the heading entitled “Expenses Paid During thePeriod” to estimate the expenses you paid on your accountduring this period.
Individual Retirement Arrangements (IRAs) and EducationalSavings Accounts (ESAs) are charged a $15.00 annualcustodial fee. The charge is automatically deducted from youraccount in the fourth quarter of each year or, if you close youraccount, at the time of redemption. A fee is collected for eachIRA or ESA, as distinguished by account type (Traditional IRA,
Roth IRA, or ESA) and Social Security Number. For example, ifyou have both a Traditional IRA and a Roth IRA account, eachwould be charged a fee. But only one fee would be collectedfor each account type, regardless of the number of Funds heldby each account type. These fees are not included in theexample below. If included, the costs shown would be higher.
HYPOTHETICAL EXAMPLE FOR COMPARISON PURPOSESThe second line for each Fund in the table on the followingpage provides information about hypothetical account valuesand hypothetical expenses based on the Fund’s actualexpense ratio and an assumed rate of return of 5% per yearbefore expenses, which is not the Fund’s actual return. Thehypothetical account values and expenses may not be used toestimate the actual ending account balance or expenses youpaid for the period. You may use this information to comparethe ongoing costs of investing in the Funds and other funds. Todo so, compare this 5% hypothetical example with the 5%hypothetical examples that appear in the shareholder reports ofthe other funds.
Please note that the expenses shown in the table are meant tohighlight your ongoing costs only and do not reflect thecustodial account fee. Therefore, the hypothetical informationin the example is useful in comparing your ongoing costs only,and will not help you determine the relative total costs ofowning different funds. In addition, if the custodial account feewas included, your costs would have been higher.
18 Expense Example

Beginning AccountValue
July 1, 2013
Ending AccountValue
December 31,2013
Expenses PaidDuring the Perioda
AnnualizedExpense Ratio
for the SixMonth Period
EndedDecember 31,
2013
DAILY INCOME FUNDActual Return . . . . . . . . . . . . . . . . . . . . . . . . . . . . . . $1,000.00 $1,000.05 $0.45 0.09%Hypothetical (5% return before expenses) . . . . . . . $1,000.00 $1,025.01 $0.46 0.09%
SHORT-TERM GOVERNMENT SECURITIES FUNDActual Return . . . . . . . . . . . . . . . . . . . . . . . . . . . . . . $1,000.00 $ 999.20 $3.48 0.69%Hypothetical (5% return before expenses) . . . . . . . $1,000.00 $1,021.92 $3.52 0.69%
SHORT-TERM BOND FUNDActual Return . . . . . . . . . . . . . . . . . . . . . . . . . . . . . . $1,000.00 $1,007.32 $3.63 0.72%Hypothetical (5% return before expenses) . . . . . . . $1,000.00 $1,021.78 $3.66 0.72%
STOCK INDEX FUNDb
Actual Return . . . . . . . . . . . . . . . . . . . . . . . . . . . . . . $1,000.00 $1,162.52 $2.87 0.53%Hypothetical (5% return before expenses) . . . . . . . $1,000.00 $1,022.76 $2.69 0.53%
VALUE FUNDActual Return . . . . . . . . . . . . . . . . . . . . . . . . . . . . . . $1,000.00 $1,151.01 $3.28 0.61%Hypothetical (5% return before expenses) . . . . . . . $1,000.00 $1,022.36 $3.09 0.61%
GROWTH FUNDActual Return . . . . . . . . . . . . . . . . . . . . . . . . . . . . . . $1,000.00 $1,274.23 $5.41 0.95%Hypothetical (5% return before expenses) . . . . . . . $1,000.00 $1,020.60 $4.83 0.95%
SMALL-COMPANY STOCK FUNDActual Return . . . . . . . . . . . . . . . . . . . . . . . . . . . . . . $1,000.00 $1,182.05 $4.74 0.86%Hypothetical (5% return before expenses) . . . . . . . $1,000.00 $1,021.03 $4.40 0.86%
INTERNATIONAL VALUE FUNDActual Return . . . . . . . . . . . . . . . . . . . . . . . . . . . . . . $1,000.00 $1,200.09 $5.17 0.94%Hypothetical (5% return before expenses) . . . . . . . $1,000.00 $1,020.66 $4.77 0.94%
a. The dollar amounts shown as “Expenses Paid During the Period” are equal to each Fund’s annualized expense ratio multiplied by the averageaccount value over the period, multiplied by 184, then divided by 365.
b. The Stock Index Fund is a feeder fund that invests substantially all of its assets in a Master Portfolio. The example reflects the expenses ofboth the feeder fund and the Master Portfolio.
Expense Example 19

Regulatory and Shareholder Matters
PROXY VOTING POLICIES AND PROCEDURESThe policies and procedures used to determine how to voteproxies relating to the Funds’ portfolio securities are availableonline at homesteadfunds.com and, without charge, uponrequest by calling 800-258-3030. This information is alsoavailable on the Securities and Exchange Commission’swebsite at sec.gov.
PROXY VOTING RECORDFor the most recent twelve-month period ended June 30,information regarding how proxies relating to portfoliosecurities were voted on behalf of each of the Funds isavailable, without charge, upon request by calling800-258-3030 and on the Securities and ExchangeCommission’s website at sec.gov.
QUARTERLY DISCLOSURE OF PORTFOLIO HOLDINGSThe Funds file complete schedules of portfolio holdings withthe Securities and Exchange Commission for the first and thirdquarters of each fiscal year on Form N-Q. Portfolio holdings forthe second and fourth quarters of each fiscal year are filed aspart of the Funds’ semi-annual and annual reports. The Funds’Form N-Q, semi-annual and annual reports are available onthe Commission’s website at sec.gov, and may be reviewedand copied at the Commission’s Public Reference Room inWashington, DC. Information on the operation of the PublicReference Room may be obtained by calling 800-SEC-0330.The most recent quarterly portfolio holdings and semi-annualand annual report also can be accessed on the Funds’ websiteat homesteadfunds.com.
BOARD OF DIRECTORS’ CONSIDERATIONS INAPPROVING THE INVESTMENT MANAGEMENTAGREEMENTSHomestead Funds, Inc. (“Homestead”) and RE AdvisersCorporation (“RE Advisers”) have entered into investmentmanagement agreements (the “Investment ManagementAgreements”), pursuant to which RE Advisers is responsiblefor the day-to-day investment management of the assets of thefollowing series of Homestead: the Daily Income Fund, theShort-Term Bond Fund, the Short-Term Government SecuritiesFund, the Small-Company Stock Fund and the Value Fund,and for the supervision of the subadvisers to the Growth Fundand the International Value Fund (each series, a “Fund” and,collectively, the “Funds”).
In connection with the renewal of the Investment ManagementAgreements between each Fund and RE Advisers in 2013, theFunds’ Board of Directors requested, reviewed and considereda wide variety of written materials, presentations and otherinformation, culminating in the Board’s approval of eachInvestment Management Agreement at its September 19-20,2013 meeting.
In preparation for this consideration and approval, the Funds’outside counsel requested that RE Advisers provide the Board
written materials including significant information about REAdvisers’ affiliates, personnel and operations. Pursuant to thisrequest, RE Advisers provided, and the Board, including theIndependent Directors, considered and discussed, informationregarding: (a) the level of the advisory fees that RE Adviserscharges a Fund compared with the fees charged tocomparable mutual funds; (b) each Fund’s overall fees andoperating expenses compared with similar mutual funds;(c) each Fund’s performance compared with similar mutualfunds; (d) the investment management and other services REAdvisers provides; (e) RE Advisers’ investment managementpersonnel; (f) RE Advisers’ financial condition; (g) RE Advisers’brokerage practices (including any soft dollar arrangements);(h) RE Advisers’ profitability; and (i) RE Advisers’ complianceprogram.
During the meeting, the Directors had an opportunity to discussthis information with officers and other personnel of REAdvisers, including senior executives, representatives from thelegal, compliance and finance departments and investmentpersonnel. The Board posed questions to theserepresentatives and engaged in substantive discussions withthem concerning the proposed investment process. The Boardalso reviewed the proposed reapproval of the InvestmentManagement Agreements with representatives of RE Advisersand with legal counsel. RE Advisers’ management stated thatthere were no differences between the current InvestmentManagement Agreements and the Investment ManagementAgreements that the Board was being asked to reapprove.
In reaching their determinations relating to the reapproval ofthe Investment Management Agreements, the Directors,including the Independent Directors, considered all factors theybelieved relevant, including the factors discussed below. Intheir deliberations, the Board did not identify any particularinformation that was all important or controlling, and the Boardattributed different weights to the various factors.
In particular, the Board focused on the following:
Nature, Extent and Quality of Services. The Board reviewedthe services provided by RE Advisers, and the Board, includingthe Independent Directors, found that RE Advisers continued toprovide high quality advisory and administrative services to theFunds.
In connection with their consideration of RE Advisers’ servicesspecifically, the Board focused on the favorable attributes ofRE Advisers, including (i) an investment philosophy orientedtoward long-term performance; (ii) effective processes used inoverseeing subadviser activities with respect to the GrowthFund’s and International Value Fund’s administration,investment management and compliance activities; (iii) highlyskilled professionals with a depth of experience; and (iv) afavorable history and reputation. The Board discussed with
20 Regulatory and Shareholder Matters

senior officers of RE Advisers whether there had been anypersonnel changes made, noting that the investmentmanagement staff had experienced no turnover.
Investment Performance of the Funds and the Adviser. TheBoard examined the performance information for the Fundsprovided by RE Advisers. The Board reviewed the averageannual total returns for the Funds for the last one, three, fiveand ten years ended December 31, 2012, and compared thereturns to those of the relevant indexes for the same timeperiods, as well as the comparative returns for the trailing 12months ending June 30, 2013. The Board also reviewed datasheets issued by Morningstar, Inc. (“Morningstar Reports”),which, among other things, provided performance and expenseinformation related to the Funds for the same periods. TheBoard compared the performance of each Fund over the sameperiod with funds in the Fund’s peer group, a group of similar-sized funds selected by RE Advisers with the same investmentobjective.
Daily Income FundThe Board first reviewed the performance of the Daily IncomeFund, noting that the Fund earned a total return of 0.01% forthe trailing 12 months ending June 30, 2013, and its seven-dayeffective annualized yield was 0.01%.
The Board discussed the decline in the Fund’s, as well asalmost all money market funds’, performance since 2010 andnoted RE Advisers’ explanation that low returns were a directresult of the Federal Reserve’s actions to keep the federalfunds rate at historic lows in an effort to shore up the financialmarkets and prevent a deepening of the economic crisis. TheBoard further noted that the Fund’s performance was in linewith the performance of other money market funds over therelevant periods.
The Board noted that the advisory fees that the Daily IncomeFund was contractually obligated to pay to RE Advisers are stillvoluntarily being waived by RE Advisers to the extentnecessary to assist the Fund in attempting to maintain apositive yield. Also, the Board considered the challengesconfronted by RE Advisers due to amended Rule 2a-7 of theInvestment Company Act of 1940, which, among other things,makes it difficult to partially offset the Fund’s lower returns bylengthening the Fund’s average maturity. The Board noted thatthe average maturity of the Fund was 44 days on June 30,2013 and had remained stable over the previous 12-monthperiod.
Short-Term Government Securities FundNext, the Board reviewed the performance of the Short-TermGovernment Securities Fund, noting that the Fund’s total returnwas 0.19% for the trailing twelve months ending June 30,2013, and, on an annualized basis, was 1.18% for the 3-yearperiod ending June 30, 2013 and 2.42% for the 5-year periodending June 30, 2013, compared to the return of its benchmarkindex, the BofA Merrill Lynch 1-5 Year U.S. Treasury Index,which had returns of -0.03%, 1.45% and 2.77% for the sameperiods.
The Board considered the peer group data provided by REAdvisers, noting that the Fund outperformed in terms of total
return each member of the Fund’s peer group for the trailing12-month, 3-year and 5-year periods ending June 30, 2013.The Board noted several reasons for the Fund’s relativeoutperformance of its peer group and its strong performancecompared to its benchmark index.
Short-Term Bond FundNext, the Board reviewed the performance of the Short-TermBond Fund, noting that the Fund’s total return was 3.25% forthe trailing 12 months ending June 30, 2013, and, on anannualized basis, was 3.06% for the 3-year period endingJune 30, 2013 and 5.00% for the 5-year period endingJune 30, 2013, compared to the return of its benchmark index,the BofA Merrill Lynch 1-5 Year Corp./Govt. Index, whichreturned 0.72%, 2.06% and 3.38% for the same periods.
The Board considered the peer group data provided by REAdvisers, noting that the Fund outperformed each of the fundsin the Fund’s peer group in terms of total return for the 12-month, 3-year and 5-year periods ending June 30, 2013.Additionally, the Board noted the recognition that RE Advisershas received in connection with the relatively strongperformance of the Fund. The Board cited the Fund’s favorablewrite-ups in several publications, which noted the Fund’sstrong performance relative to peer funds.
Stock Index FundThe Board compared the performance of the Stock Index Fundto its benchmark index, noting that the Fund’s total return was19.96% for the trailing 12 months ending June 30, 2013, and,on an annualized basis, 17.79% for the 3-year period endingJune 30, 2013, and 6.42% for the 5-year period endingJune 30, 2013, which was comparable to the Standard &Poor’s 500 Stock Index’s returns of 20.60%, 18.45% and7.01% for the same time periods, indicating an acceptable levelof tracking error when factoring in the Fund’s expenses.
The Board considered the fact that the Fund is an index funddesigned to match and not outperform the Standard & Poor’s500 Stock Index.
Value FundThe Board compared the Value Fund’s performance to itsbenchmark index, noting that the Fund’s total return was25.89% for the trailing 12-month period ending June 30, 2013,and, on an annualized basis, 17.86% for the 3-year periodending June 30, 2013, and 7.40% for the 5-year period endingJune 30, 2013, while its benchmark indexes, the Russell 1000Value Index, returned 25.32%, 18.51% and 6.67% and theStandard & Poor’s 500 Stock Index returned 20.60%, 18.45%and 7.01% for the same periods.
The Board considered the peer group data provided by REAdvisers, noting that the Fund outperformed, in terms of totalreturn, all of the funds in the Fund’s peer group for the trailing12 months ending June 30, 2013, three out of the five peerfunds for the 3-year period ending June 30, 2013, and all butone of the five peer funds for the 5-year period ending June 30,2013. The Board noted the recognition that RE Advisers hasreceived in connection with the relatively strong long-termperformance of the Fund.
Regulatory and Shareholder Matters 21
Small-Company Stock FundNext, the Board reviewed the strong performance of the Small-Company Stock Fund. The Board compared the Small-Company Stock Fund’s performance to its benchmark index,noting that the Fund’s total return was 26.93% for the trailing12 months ending June 30, 2013, and, on an annualized basis,was 22.03% for the 3-year period ending June 30, 2013, and14.27% for the 5-year period ending June 30, 2013, whileoutperforming the Russell 2000 Index, its benchmark index,which returned 24.21%, 18.67% and 8.77% for the sameperiods.
The Board considered the peer group data provided by REAdvisers, noting that the Fund outperformed two out of the fourfunds for the 12-month period ending June 30, 2013, three outof the four funds for the 3-year period ending June 30, 2013,and all of the funds in the Fund’s peer group for the 5-yearperiod ending June 30, 2013. The Board noted the recognitionthat RE Advisers has received in connection with the relativelystrong performance of the Fund. The Board cited the favorablewrite-ups of the Fund, noting the Fund’s strong performance, inseveral publications.
Comparative Fees and Expense Ratios. The Boardconsidered the net total expense ratio, advisory feecomparisons and other information for each Fund provided byRE Advisers against the average expense ratio, advisory feesand other information of the funds in each Fund’s peer groupidentified. The Board determined that the expense ratio foreach equity Fund generally was near the median for its peergroup. The Board recognized that the Growth Fund and Small-Company Stock Fund both continued to experience significantgrowth in terms of net assets in the past year. Despite thisasset growth, both Funds remain relatively small in terms ofasset size in comparison to the funds in their respective peergroups, and the total fees received by RE Advisers from eachFund continue to be relatively modest. While the managementfee and expense ratio for each fixed-income Fund was higherthan the median for its peer group, the Board noted eachFund’s small size in terms of assets. As a consequence, theBoard found that the total income RE Advisers earns at thecurrent levels of fees at these Funds remains modest.
The Board also discussed the services provided to the Fundsby RE Advisers, and the fees charged for those services underthe Investment Management Agreements. The Board reviewedinformation concerning the fee and expense ratios for theFunds, which were for periods ending December 31, 2012, aswell as comparative information with respect to similarproducts.
The Board noted that RE Advisers paid out of its legitimateprofits certain shareholder servicing and sub-transfer agencyfees charged by various intermediaries in conjunction with theFunds’ participation on those intermediaries’ platforms. Whilethe Funds’ advisory fees had remained stable, the Boarddetermined that the payment of the intermediary fees was not afactor in determining the Funds’ advisory fees. The Boardfurther noted that legitimate profits from advisory fees may beused by advisers to pay certain costs of Funds that could becharacterized as distribution-related costs.
Daily Income FundThe Board noted that the Fund’s advisory fee was 0.50% butthat the Fund’s total expense ratio after the fee waiver by REAdvisers was 0.15%. The Board recognized RE Adviser’ssubstantial financial commitment to waive the Daily IncomeFund’s expenses to the extent necessary to maintain a positiveyield.
Short-Term Government Securities FundThe Board noted that the Fund’s net total expense ratio andadvisory fee were higher than the median of the expense ratiosand advisory fees of the funds in the Fund’s peer group.
Short-Term Bond FundThe Board noted that the Fund’s net total expense ratio washigher than four of the five funds in the Fund’s peer group andthat the advisory fee was the same as one fund in the Fund’speer group and higher than the other four funds in the Fund’speer group. The Board recognized that the Fund remainsrelatively small in terms of assets and that fee breakpointsmight be warranted if the Fund were to grow significantly insize.
Stock Index FundThe Board noted that the Fund’s net total expense ratio andmanagement fee were each at the median of the expenseratios and management fees of the funds in the Fund’s peergroup. The Fund’s management fee consists of theadministration fee charged by RE Advisers and the feecharged by the adviser of the index portfolio for managing thatfund. The Board also noted that the Fund’s expense ratios andadvisory fees generally were in-line with those of other indexfunds, noting that such expenses and fees are generally lowerthan those of actively-managed funds.
Value FundThe Board noted that the Fund’s net total expense ratio andadvisory fee were lower than the median of the expense ratiosand advisory fees of the funds in the Fund’s peer group.
Growth FundThe Board noted that the Fund’s net total expense ratio andadvisory fee were lower than the median of the expense ratiosand advisory fees of the funds in Fund’s peer group. The Boardalso considered RE Advisers’ agreement to contractually limitfees and reimburse expenses to the extent necessary to keepthe Growth Fund’s total annual operating expenses fromexceeding 0.95% of the Fund’s average daily net assets until atleast April 30, 2014.
Small-Company Stock FundThe Board noted that the Fund’s net total expense ratio andadvisory fee were at the median of the expense ratios andadvisory fees of the funds in the Fund’s peer group.
International Value FundThe Board noted that the Fund’s net total expense ratio andadvisory fee were lower than the median of the expense ratiosand advisory fees of the funds in the Fund’s peer group. TheBoard also considered RE Advisers’ agreement to contractuallylimit fees and reimburse expenses to the extent necessary to
22 Regulatory and Shareholder Matters
keep the International Value Fund’s total annual operatingexpenses from exceeding 0.99% of the Fund’s average dailynet assets until at least April 30, 2014.
Cost of Services and Profits Realized by the Adviser. TheBoard considered the cost of the services provided by REAdvisers. The Board reviewed the information it had requestedfrom RE Advisers concerning its profitability from the fees andthe services provided to the Funds and the financial conditionof RE Advisers for various past periods. The Board consideredthe profit margin information for RE Advisers’ investmentcompany business as a whole, as well as RE Advisers’profitability data for the Funds. The Board reviewed REAdvisers’ assumptions and methods of cost allocation used inpreparing Fund-specific profitability data. The Board alsodiscussed with RE Advisers the basis for its belief that itsmethods of allocation were reasonable and consistent acrossits business.
The Board determined that the Funds’ expense figures werewithin the applicable peer group range. In addition, the Boardconsidered its discussion with representatives of RE Advisersabout the fees being charged to the Funds and considered theother administrative services provided by RE Advisers to theFunds. In light of the foregoing, the Board, including theIndependent Directors, determined that the management feeswere reasonable in relation to the wide array of customerservices provided to the Funds’ shareholders. In view of theinformation presented, the Board concluded that each Fund’smanagement fee was reasonable.
The Board noted and discussed the additional servicesprovided by RE Advisers to the Funds compared to otherinvestment products managed by RE Advisers, and noted that,in the cases of the Growth Fund and International Value Fund,RE Advisers, and not the Fund, would pay the subadvisoryfees to the subadviser. The Board determined that RE Advisersshould be entitled to earn a reasonable level of profits for theservices it provides to the Funds. The Board also recognizedthat RE Advisers had made significant investments in thebusiness of the Funds and had not fully recovered the sumsinvested. Based on its review, the Board, including theIndependent Directors, concluded that RE Advisers’ level ofprofitability was low due to the increase in expense waivers forthe Daily Income Fund.
Economies of Scale. The Board considered the extent towhich economies of scale would be realized as the Fundsgrow, and whether fee levels reflect these economies of scalefor the benefit of each Fund’s shareholders. The Board wassatisfied that the current fee structure is appropriate.
Fall-Out Benefits. The Board considered other actual andpotential financial benefits that RE Advisers may derive from itsrelationship with the Funds. The Board noted, however, thatthe Funds benefit from the vast array of resources availablethrough RE Advisers and NRECA.
CONCLUSIONThe Independent Directors subsequently discussed theproposed approval in detail during an executive session atwhich no representative of RE Advisers was present.
Based on the Board’s deliberation and evaluation of theinformation described above, the Board, including theIndependent Directors, unanimously reapproved theInvestment Management Agreements and concluded that themanagement fee rates and projected total expense ratios werefair and reasonable in relation to the services to be provided tothe Funds and such other matters as the Board consideredrelevant in the exercise of its reasonable judgment. In thecourse of its deliberations, the Board did not identify anyparticular information that was all-important or controlling.
BOARD OF DIRECTORS’ CONSIDERATION IN APPROVINGTHE T. ROWE PRICE SUB-ADVISORY AGREEMENT(Growth Fund only). RE Advisers, on behalf of the GrowthFund, has entered into a subadvisory agreement (“SubadvisoryAgreement”) with T. Rowe Price Associates, Inc. (“T. RowePrice”), pursuant to which T. Rowe Price is responsible for theday-to-day management of the assets of the Growth Fund, aseries of Homestead.
At its September 19-20, 2013 meeting, the Board requestedand received written materials from T. Rowe Price regarding:(a) the investment performance of T. Rowe Price; (b) the levelof the subadvisory fees that T. Rowe Price charges; (c) theinvestment management and other services T. Rowe Priceprovides under the Subadvisory Agreement to manage theassets of the Growth Fund; (d) T. Rowe Price’s investmentmanagement personnel; (e) T. Rowe Price’s financialcondition; and (f) T. Rowe Price’s compliance program.
The Board based its consideration and evaluation on a varietyof specific factors discussed at the meeting, including:
‰ the nature, extent and quality of the services provided tothe Growth Fund under the Subadvisory Agreement;
‰ investment performance of the Fund and T. Rowe Price;‰ fees charged by T. Rowe Price and expense ratio;‰ the costs of services and profits realized by T. RowePrice; and
‰ the fall-out benefits to T. Rowe Price.
The Board’s consideration with respect to each of the abovefactors is set forth below.
Nature, Extent and Quality of Services. As noted above, theBoard considered the nature, extent and quality of the servicesthat is provided by T. Rowe Price to the Growth Fund and theresources T. Rowe Price dedicates to the Fund. In this regard,the Board evaluated, among other things, T. Rowe Price’spersonnel, experience, track record and compliance program.The Directors considered information concerning theinvestment philosophy and investment process used byT. Rowe Price in managing the Growth Fund. In this context,the Directors considered T. Rowe Price’s in-house researchcapabilities, as well as other resources available to T. RowePrice, including research services available to T. Rowe Priceas a result of securities transactions affected for investmentadvisory clients of T. Rowe Price. The Board considered themanagerial and financial resources available to T. Rowe Priceand concluded that they would be sufficient to meet anyreasonably foreseeable obligations under the currentSubadvisory Agreement.
Regulatory and Shareholder Matters 23

The Board also considered the quality of the services providedby T. Rowe Price and the quality of the resources available tothe Growth Fund. The Board was advised that the standard ofcare under the current Subadvisory Agreement wascomparable to that found in many investment advisoryagreements. The Board considered T. Rowe Price’sexperience and reputation, the professional qualifications of itspersonnel and the size and functions of its staff. The Boardconsidered the complexity of managing the Growth Fundrelative to other types of funds.
The Board further concluded that the services to be providedby T. Rowe Price should continue to benefit the Growth Fundand its shareholders, and also concluded that the investmentphilosophy, process and research capabilities of T. Rowe Pricecontinue to be appropriate for the Fund. The Board concludedthat the scope of the services provided to the Fund by T. RowePrice were consistent with the Growth Fund’s operationalrequirements, including, in addition to its investment objective,compliance with the Fund’s investment restrictions and tax andreporting requirements. The Board concluded, within thecontext of their overall conclusions regarding the SubadvisoryAgreement, that the nature, extent and quality of servicesprovided supported the reapproval of the SubadvisoryAgreement.
Investment Performance of the Fund and T. Rowe Price. TheBoard examined the performance information for the Fundprovided by T. Rowe Price. The Directors noted that T. RowePrice became the Fund’s subadviser on December 5, 2008,and that before that date, the Fund had a different investmentstrategy in which it tried to match the performance of theNasdaq-100 Index. The Board reviewed the average annualtotal returns for the Fund for the last four calendar years, theonly relevant period since the Fund was managed pursuant toa different investment strategy prior to that period. The Boardnoted that that the Fund’s total return was 19.06% for thetrailing 12 months ending June 30, 2013, and, on anannualized basis, was 18.37% for the 3-year period endingJune 30, 2013, and 8.88% for the 5-year period endingJune 30, 2013, while its benchmark indexes, the Russell 1000Growth Index returned 17.07%, 18.68% and 7.47% andStandard & Poor’s 500 stock index returned 20.60%, 18.45%and 7.01% for the same periods.
The Board considered other information provided by REAdvisers and T. Rowe Price, noting that the Fund outperformedall but one of the funds in the Fund’s peer group identified byRE Advisers for the one-year and three-year periods, and all ofsuch funds for the five-year period ending June 30, 2013.
As noted above, the Board received information about theperformance of accounts managed by T. Rowe Price with asimilar investment objective to the Growth Fund and comparedsuch performance to the prior performance of the Fund and torelevant performance benchmarks. After reviewing these andrelated factors, the Directors concluded, within the context oftheir overall conclusions regarding the SubadvisoryAgreement, that the performance of the accounts managed byT. Rowe Price with a similar investment objective to the GrowthFund’s investment objective was sufficient to merit reapprovalof the Subadvisory Agreement.
Comparative Fees Charged by T. Rowe Price and ExpenseRatios. The Board considered the fees paid to T. Rowe Priceunder the current Subadvisory Agreement. This informationincluded comparison of the Growth Fund’s subadvisory fee tothat charged by T. Rowe Price to other accounts with a similarinvestment objective to the Fund as well as the currentmanagement fee to be paid to RE Advisers under the existingInvestment Management Agreement. The Board also took intoaccount the anticipated demands, complexity and quality of theinvestment management of the Fund.
The Board noted RE Advisers’ and T. Rowe Price’s statedjustification for the fees to be payable by the Fund, whichincluded information about the services to be provided to theGrowth Fund. After reviewing these and related factors, theBoard concluded, within the context of its overall conclusionsregarding the Subadvisory Agreement, that the subadvisoryfees to be charged to the Fund were fair and reasonable, andthat the anticipated costs of these services generally supportedthe approval of the Agreement.
Costs of Services and Profits Realized by T. Rowe Price. TheBoard considered the compensation indirectly to be receivedby T. Rowe Price from its relationship with the Growth Fund.The Directors noted that RE Advisers would continue to pay T.Rowe Price from the management fees received from theFund.
Fall-Out Benefits to T. Rowe Price. The Board alsoconsidered possible conflicts of interest associated with theprovision of investment advisory services by T. Rowe Price toother clients. The Board considered the procedures of T. RowePrice designed to fulfill its fiduciary duties to advisory clientswith respect to possible conflicts of interest, including the codeof ethics, the integrity of the systems in place toensure compliance with the foregoing, and the record of T.Rowe Price in these matters. The Board also received andconsidered information concerning procedures of T. RowePrice with respect to the execution of portfolio transactions.
CONCLUSIONBased on the Board’s deliberation and its evaluation of theinformation described above, the Board, including all of theIndependent Directors, unanimously reapproved theSubadvisory Agreement and concluded that the compensationunder the Subadvisory Agreement is fair and reasonable inlight of such services and expenses and such other matters asthe Board considered to be relevant in the exercise of itsreasonable judgment. In the course of its deliberations, theBoard did not identify any particular information that was all-important or controlling.
BOARD OF DIRECTORS’ CONSIDERATION IN APPROVINGTHE MERCATOR SUBADVISORY AGREEMENT(International Value Fund only). RE Advisers, on behalf of theInternational Value Fund, has entered into a subadvisoryagreement (“Subadvisory Agreement”) with Mercator AssetManagement, L.P. (“Mercator”), pursuant to which Mercator isresponsible for the day-to-day investment management of theassets of the International Value Fund, a series of Homestead.
At its September 19-20, 2013 meeting, the Board requestedand received written materials from Mercator regarding: (a) the
24 Regulatory and Shareholder Matters

investment performance of Mercator; (b) the level of thesubadvisory fees that Mercator charges compared with thefees charged in connection with mutual funds comparable tothe International Value Fund; (c) the investment managementand other services Mercator provides under the SubadvisoryAgreement to manage the assets of the International ValueFund; (d) Mercator’s investment management personnel;(e) Mercator’s financial condition; and (f) Mercator’scompliance program.
The Board based its consideration and evaluation on a varietyof specific factors discussed at the meeting, including:
‰ the nature, extent and quality of the services provided tothe International Value Fund under the SubadvisoryAgreement;
‰ investment performance of the Fund and Mercator;‰ fees charged by Mercator and expense ratio;‰ the costs of services and profits realized by Mercator;and
‰ the fall-out benefits to Mercator.
The Board’s consideration with respect to each of the abovefactors is set forth below.
Nature, Extent and Quality of Services. As noted above, theBoard considered the nature, extent and quality of the servicesprovided by Mercator to the International Value Fund and theresources Mercator dedicates to the Fund. In this regard, theBoard evaluated, among other things, Mercator’s personnel,experience, track record and compliance program. TheDirectors considered information concerning the investmentphilosophy and investment process used by Mercator inmanaging the International Value Fund. In this context, theDirectors considered Mercator’s in-house research capabilities,as well as other resources available to Mercator, includingresearch services available to Mercator as a result of securitiestransactions effected for investment advisory clients ofMercator. The Board considered the managerial and financialresources available to Mercator and concluded that they weresufficient to meet any reasonably foreseeable obligations underthe current Subadvisory Agreement.
The Board was advised that the standard of care under thecurrent Subadvisory Agreement was comparable to that foundin many investment agreements. The Board consideredMercator’s experience and reputation, the professionalqualifications of its personnel and the size and functions of itsstaff. The Board considered the complexity of managing theInternational Value Fund relative to other types of funds.
The Board concluded that the services provided by Mercatorshould continue to benefit the International Value Fund and itsshareholders and also concluded that the investmentphilosophy, process and research capabilities of Mercatorcontinue to be appropriate for the Fund, given its investmentobjective and strategy. The Board concluded that the scope ofthe services provided to the Fund by Mercator were consistentin large part with the International Value Fund’s operationalrequirements, but that there was room for improvement incertain operational areas. The Board, including theIndependent Directors, concluded, within the context of their
overall conclusions regarding the Subadvisory Agreement, thatthe nature, extent and quality of services provided supportedthe reapproval of the Subadvisory Agreement.
Investment Performance of the Fund and Mercator. TheBoard examined the performance information for the Fundprovided by Mercator. The Directors noted that Mercatorbecame the Fund’s sub-adviser on June 12, 2006. The Boardreviewed the average annual total returns for the Fund for thelast one, three and five years ended June 30, 2012. The Boardnoted that that the Fund’s total return was 19.29% for thetrailing 12 months ending June 30, 2013, and, on anannualized basis, was 7.21% for the 3-year period endingJune 30, 2013, and -.035% for the 5-year period endingJune 30, 2013, while the MSCI EAFE Index, its benchmarkindex, returned 18.62%, 10.04% and -0.63 for the sameperiods.
The Board considered the performance information providedby RE Advisers, noting that the Fund outperformed each fundin the Fund’s peer group for the one-year period endingJune 30, 2013, underperformed all but one of the funds in thepeer group for the 3-year period ending June 30, 2013, andunderperformed three out of the five peer funds for the 5-yearperiod ending June 30, 2013. The Board noted the explanationby representatives of Mercator that this underperformance isprimarily attributable to the fact that Mercator’s investment stylehas been out of favor in the near term and that style isbeginning to return back in favor as indicated by the recentrelative improvement in the Fund’s performance. The Boardnoted that Mercator is a value manager and that it did not strayfrom its style. The Fund performed more favorably whencompared to international value funds than the entire universeof international funds.
As noted above, the Board received information about theperformance of accounts managed by Mercator with a similarinvestment objective as that of the International Value Fundand compared such performance to the prior performance ofthe Fund and to relevant performance benchmarks. The Boardreviewed performance over various time periods, includingone-, three-, five- and ten-year periods, performance underdifferent market conditions and during different phases of themarket cycle and the volatility of Mercator’s returns. Afterreviewing these and related factors, the Directors concluded,within the context of their overall conclusions regarding theSubadvisory Agreement, that the performance of the accountsmanaged by Mercator with a similar investment objective to theInternational Value Fund’s investment objective was sufficientto merit reapproval of the Subadvisory Agreement.
Comparative Fees Charged by Mercator and ExpenseRatios. The Board considered the fees paid to Mercatorunder the current Subadvisory Agreement. The Boardcompared the International Value Fund’s subadvisory fee tothat charged by Mercator to other accounts with a similarinvestment objective to the Fund as well as the currentmanagement fee to be paid to RE Advisers under the existingInvestment Management Agreement. The Board also took intoaccount the anticipated demands, complexity and quality of theinvestment management of the Fund. The Board noted REAdvisers’ and Mercator’s stated justification for the fees to be
Regulatory and Shareholder Matters 25

payable by the Fund, which included information about theservices to be provided to the International Value Fund. Afterreviewing these and related factors, the Board concluded,within the context of their overall conclusions regarding theSubadvisory Agreement, that the subadvisory fees to becharged to the Fund were fair and reasonable, and that theanticipated costs of these services generally supported theapproval of the Agreement.
Costs of Services and Profits Realized by Mercator. TheBoard considered the compensation indirectly received byMercator from its relationship with the International ValueFund. The Directors noted that RE Advisers would continue topay Mercator from the management fees received from theFund.
Fall-Out Benefits to Mercator. The Board also consideredpossible conflicts of interest associated with the provision ofinvestment advisory services by Mercator to other clients. The
Board considered the procedures of Mercator designed to fulfillits fiduciary duties to advisory clients with respect to possibleconflicts of interest, including the code of ethics, the integrity ofthe systems in place to ensure compliance with the foregoingand the record of Mercator in these matters. The Board alsoreceived and considered information concerning procedures ofMercator with respect to the execution of portfolio transactions.
CONCLUSIONBased on the Board’s deliberation and its evaluation of theinformation described above, the Board, including all of theIndependent Directors, unanimously reapproved theSubadvisory Agreement and concluded that the compensationunder the Subadvisory Agreement is fair and reasonable inlight of such services and expenses and such other matters asthe Board considered to be relevant in the exercise of itsreasonable judgment. In the course of its deliberations, theBoard did not identify any particular information that was all-important or controlling.
26 Regulatory and Shareholder Matters

Report of Independent Registered PublicAccounting Firm
To the Board of Directors of Homestead Funds, Inc. and Shareholders of Daily Income Fund, Short-Term Govern-ment Securities Fund, Short-Term Bond Fund, Stock Index Fund, Value Fund, Growth Fund, Small-Company StockFund, and International Value Fund:
In our opinion, the accompanying statements of assets and liabilities, including the portfolios of investments, and therelated statements of operations and of changes in net assets and the financial highlights present fairly, in allmaterial respects, the financial position of Daily Income Fund, Short-Term Government Securities Fund, Short-TermBond Fund, Stock Index Fund, Value Fund, Growth Fund, Small-Company Stock Fund, and International ValueFund (comprising Homestead Funds, Inc., hereafter referred to as the “Funds”) at December 31, 2013, and theresults of each of their operations for the year then ended, the changes in each of their net assets for the two yearsin the period then ended and the financial highlights for each of the five years in the period then ended, in conformitywith accounting principles generally accepted in the United States of America. These financial statements and finan-cial highlights (hereafter referred to as “financial statements”) are the responsibility of the Funds’ management; ourresponsibility is to express an opinion on these financial statements based on our audits. We conducted our audits ofthese financial statements in accordance with the standards of the Public Company Accounting Oversight Board(United States). Those standards require that we plan and perform the audit to obtain reasonable assurance aboutwhether the financial statements are free of material misstatement. An audit includes examining, on a test basis,evidence supporting the amounts and disclosures in the financial statements, assessing the accounting principlesused and significant estimates made by management, and evaluating the overall financial statement presentation.We believe that our audits, which included confirmation of securities at December 31, 2013 by correspondence withthe custodian and brokers, provide a reasonable basis for our opinion.
Baltimore, MarylandFebruary 28, 2014
Report of Independent Registered Public Accounting Firm 27

P O R T F O L I O O F I N V E S T M E N T S : Daily Income FundDecember 31, 2013
CORPORATE BONDSInterest
Rate/Yield Maturity Date Face Amount Value
(0.7% of portfolio)
General Electric Capital Corp. . . . . . . . . . . . . . . . . . . . . . . . . . . . . . . . . . . . 2.10% 01/07/14 $1,480,000 $ 1,480,454
Total Corporate Bonds (Cost $1,480,454) 1,480,454
COMMERCIAL PAPER(73.0% of portfolio)
American Honda Finance Corp. . . . . . . . . . . . . . . . . . . . . . . . . . . . . . . . . . . 0.06 01/08/14 3,000,000 2,999,965American Honda Finance Corp. . . . . . . . . . . . . . . . . . . . . . . . . . . . . . . . . . . 0.09 01/23/14 2,500,000 2,499,862American Honda Finance Corp. . . . . . . . . . . . . . . . . . . . . . . . . . . . . . . . . . . 0.10 03/06/14 4,000,000 3,999,289BMW US Capital LLC (a) . . . . . . . . . . . . . . . . . . . . . . . . . . . . . . . . . . . . . . . 0.09 01/23/14 2,000,000 1,999,890BMW US Capital LLC (a) . . . . . . . . . . . . . . . . . . . . . . . . . . . . . . . . . . . . . . . 0.10 01/27/14 1,400,000 1,399,899BMW US Capital LLC (a) . . . . . . . . . . . . . . . . . . . . . . . . . . . . . . . . . . . . . . . 0.11 02/04/14 2,000,000 1,999,792BMW US Capital LLC (a) . . . . . . . . . . . . . . . . . . . . . . . . . . . . . . . . . . . . . . . 0.09 02/04/14 4,000,000 3,999,660BMW US Capital LLC (a) . . . . . . . . . . . . . . . . . . . . . . . . . . . . . . . . . . . . . . . 0.09 02/10/14 1,000,000 999,900Chevron Corp. (a) . . . . . . . . . . . . . . . . . . . . . . . . . . . . . . . . . . . . . . . . . . . . . 0.06 01/08/14 3,000,000 2,999,965Chevron Corp. (a) . . . . . . . . . . . . . . . . . . . . . . . . . . . . . . . . . . . . . . . . . . . . . 0.09 03/03/14 2,000,000 1,999,695Chevron Corp. (a) . . . . . . . . . . . . . . . . . . . . . . . . . . . . . . . . . . . . . . . . . . . . . 0.09 03/04/14 5,000,000 4,999,225Coca-Cola Co. (a) . . . . . . . . . . . . . . . . . . . . . . . . . . . . . . . . . . . . . . . . . . . . . 0.12 01/22/14 1,000,000 999,930Coca-Cola Co. (a) . . . . . . . . . . . . . . . . . . . . . . . . . . . . . . . . . . . . . . . . . . . . . 0.08 02/14/14 500,000 499,951Coca-Cola Co. (a) . . . . . . . . . . . . . . . . . . . . . . . . . . . . . . . . . . . . . . . . . . . . . 0.10 02/18/14 1,200,000 1,199,840Coca-Cola Co. (a) . . . . . . . . . . . . . . . . . . . . . . . . . . . . . . . . . . . . . . . . . . . . . 0.10 03/19/14 250,000 249,946Coca-Cola Co. (a) . . . . . . . . . . . . . . . . . . . . . . . . . . . . . . . . . . . . . . . . . . . . . 0.11 03/24/14 1,700,000 1,699,574Conocophillips Qatar Funding Ltd. (a) . . . . . . . . . . . . . . . . . . . . . . . . . . . . . 0.10 01/28/14 1,700,000 1,699,873Conocophillips Qatar Funding Ltd. (a) . . . . . . . . . . . . . . . . . . . . . . . . . . . . . 0.08 02/04/14 2,300,000 2,299,826Conocophillips Qatar Funding Ltd. (a) . . . . . . . . . . . . . . . . . . . . . . . . . . . . . 0.10 02/07/14 1,400,000 1,399,856Conocophillips Qatar Funding Ltd. (a) . . . . . . . . . . . . . . . . . . . . . . . . . . . . . 0.10 02/21/14 1,000,000 999,858Conocophillips Qatar Funding Ltd. (a) . . . . . . . . . . . . . . . . . . . . . . . . . . . . . 0.10 02/25/14 1,000,000 999,847Conocophillips Qatar Funding Ltd. (a) . . . . . . . . . . . . . . . . . . . . . . . . . . . . . 0.10 03/03/14 3,000,000 2,999,492Exxon Mobil Corp. . . . . . . . . . . . . . . . . . . . . . . . . . . . . . . . . . . . . . . . . . . . . . 0.08 01/22/14 2,000,000 1,999,907Exxon Mobil Corp. . . . . . . . . . . . . . . . . . . . . . . . . . . . . . . . . . . . . . . . . . . . . . 0.09 02/03/14 4,000,000 3,999,670General Electric Capital Corp. . . . . . . . . . . . . . . . . . . . . . . . . . . . . . . . . . . . 0.10 01/03/14 1,500,000 1,499,992General Electric Capital Corp. . . . . . . . . . . . . . . . . . . . . . . . . . . . . . . . . . . . 0.13 01/07/14 2,000,000 1,999,957General Electric Capital Corp. . . . . . . . . . . . . . . . . . . . . . . . . . . . . . . . . . . . 0.11 02/03/14 1,000,000 999,899General Electric Capital Corp. . . . . . . . . . . . . . . . . . . . . . . . . . . . . . . . . . . . 0.12 02/06/14 1,500,000 1,499,820General Electric Capital Corp. . . . . . . . . . . . . . . . . . . . . . . . . . . . . . . . . . . . 0.11 02/24/14 3,000,000 2,999,505Google Inc. (a) . . . . . . . . . . . . . . . . . . . . . . . . . . . . . . . . . . . . . . . . . . . . . . . . 0.12 04/02/14 2,500,000 2,499,242Google Inc. (a) . . . . . . . . . . . . . . . . . . . . . . . . . . . . . . . . . . . . . . . . . . . . . . . . 0.10 04/02/14 1,500,000 1,499,621Honeywell International (a) . . . . . . . . . . . . . . . . . . . . . . . . . . . . . . . . . . . . . . 0.10 02/28/14 1,000,000 999,839John Deere Bank S.A. (a) . . . . . . . . . . . . . . . . . . . . . . . . . . . . . . . . . . . . . . . 0.08 01/08/14 4,000,000 3,999,938John Deere Bank S.A. (a) . . . . . . . . . . . . . . . . . . . . . . . . . . . . . . . . . . . . . . . 0.10 01/10/14 1,000,000 999,975John Deere Capital Corp. (a) . . . . . . . . . . . . . . . . . . . . . . . . . . . . . . . . . . . . 0.18 01/16/14 1,150,000 1,149,914John Deere Financial Inc. (a) . . . . . . . . . . . . . . . . . . . . . . . . . . . . . . . . . . . . 0.08 01/14/14 2,000,000 1,999,942Medtronic Inc. (a) . . . . . . . . . . . . . . . . . . . . . . . . . . . . . . . . . . . . . . . . . . . . . . 0.08 01/22/14 6,300,000 6,299,706Medtronic Inc. (a) . . . . . . . . . . . . . . . . . . . . . . . . . . . . . . . . . . . . . . . . . . . . . . 0.10 03/13/14 4,000,000 3,999,211Metlife Funding Inc. . . . . . . . . . . . . . . . . . . . . . . . . . . . . . . . . . . . . . . . . . . . . 0.08 02/11/14 6,000,000 5,999,453Metlife Funding Inc. . . . . . . . . . . . . . . . . . . . . . . . . . . . . . . . . . . . . . . . . . . . . 0.11 02/11/14 2,250,000 2,249,718Metlife Funding Inc. . . . . . . . . . . . . . . . . . . . . . . . . . . . . . . . . . . . . . . . . . . . . 0.09 03/18/14 2,000,000 1,999,620PACCAR Financial Corp. . . . . . . . . . . . . . . . . . . . . . . . . . . . . . . . . . . . . . . . 0.09 01/03/14 4,000,000 3,999,980Parker Hannifin Corp. (a) . . . . . . . . . . . . . . . . . . . . . . . . . . . . . . . . . . . . . . . 0.07 01/02/14 1,600,000 1,599,997Parker Hannifin Corp. (a) . . . . . . . . . . . . . . . . . . . . . . . . . . . . . . . . . . . . . . . 0.07 01/30/14 5,000,000 4,999,718Parker Hannifin Corp. (a) . . . . . . . . . . . . . . . . . . . . . . . . . . . . . . . . . . . . . . . 0.07 02/05/14 3,000,000 2,999,796Pfizer Inc. (a) . . . . . . . . . . . . . . . . . . . . . . . . . . . . . . . . . . . . . . . . . . . . . . . . . 0.07 03/05/14 2,000,000 1,999,755Pfizer Inc. (a) . . . . . . . . . . . . . . . . . . . . . . . . . . . . . . . . . . . . . . . . . . . . . . . . . 0.08 03/20/14 2,000,000 1,999,653Pfizer Inc. (a) . . . . . . . . . . . . . . . . . . . . . . . . . . . . . . . . . . . . . . . . . . . . . . . . . 0.09 03/20/14 4,000,000 3,999,220Proctor & Gamble Co. (a) . . . . . . . . . . . . . . . . . . . . . . . . . . . . . . . . . . . . . . . 0.12 02/28/14 3,500,000 3,499,323Proctor & Gamble Co. (a) . . . . . . . . . . . . . . . . . . . . . . . . . . . . . . . . . . . . . . . 0.08 03/07/14 3,000,000 2,999,567Proctor & Gamble Co. (a) . . . . . . . . . . . . . . . . . . . . . . . . . . . . . . . . . . . . . . . 0.10 03/10/14 3,000,000 2,999,433Toyota Motor Credit Corp. . . . . . . . . . . . . . . . . . . . . . . . . . . . . . . . . . . . . . . . 0.09 02/13/14 3,000,000 2,999,677Toyota Motor Credit Corp. . . . . . . . . . . . . . . . . . . . . . . . . . . . . . . . . . . . . . . . 0.15 02/26/14 4,000,000 3,999,067
28 Portfolio of Investments The accompanying notes are an integral part of these financial statements.
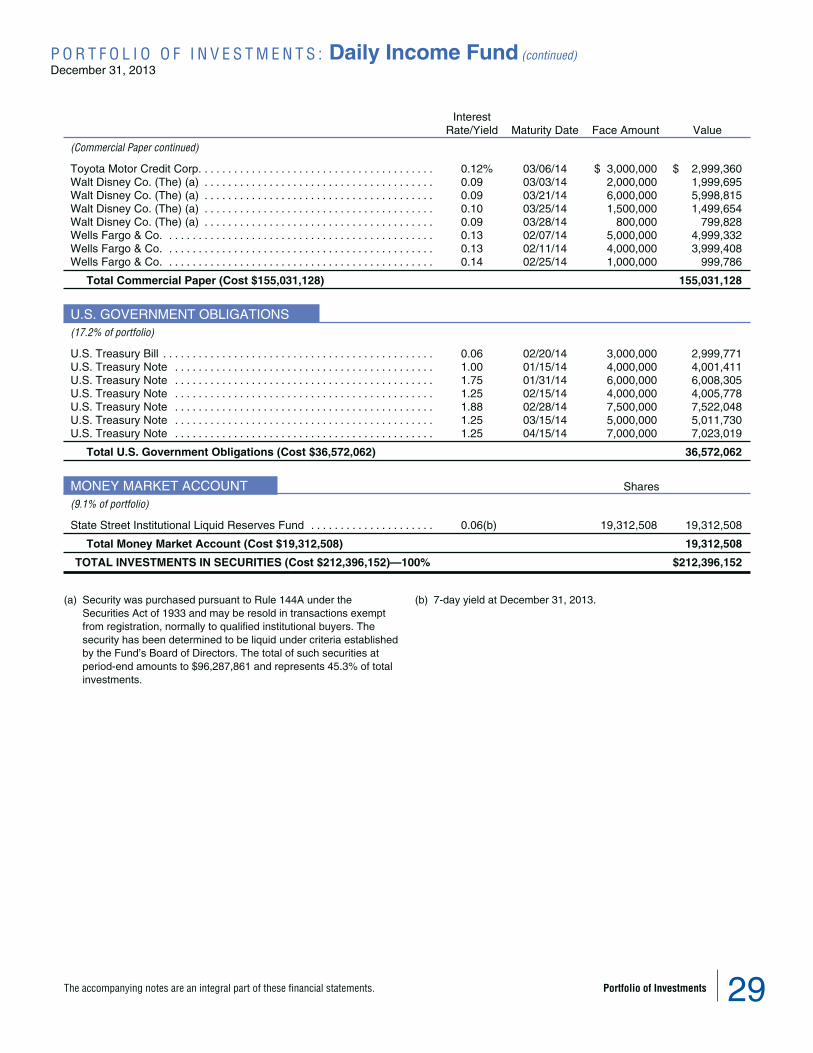
P O R T F O L I O O F I N V E S T M E N T S : Daily Income Fund (continued)December 31, 2013
InterestRate/Yield Maturity Date Face Amount Value
(Commercial Paper continued)
Toyota Motor Credit Corp. . . . . . . . . . . . . . . . . . . . . . . . . . . . . . . . . . . . . . . . 0.12% 03/06/14 $ 3,000,000 $ 2,999,360Walt Disney Co. (The) (a) . . . . . . . . . . . . . . . . . . . . . . . . . . . . . . . . . . . . . . . 0.09 03/03/14 2,000,000 1,999,695Walt Disney Co. (The) (a) . . . . . . . . . . . . . . . . . . . . . . . . . . . . . . . . . . . . . . . 0.09 03/21/14 6,000,000 5,998,815Walt Disney Co. (The) (a) . . . . . . . . . . . . . . . . . . . . . . . . . . . . . . . . . . . . . . . 0.10 03/25/14 1,500,000 1,499,654Walt Disney Co. (The) (a) . . . . . . . . . . . . . . . . . . . . . . . . . . . . . . . . . . . . . . . 0.09 03/28/14 800,000 799,828Wells Fargo & Co. . . . . . . . . . . . . . . . . . . . . . . . . . . . . . . . . . . . . . . . . . . . . . 0.13 02/07/14 5,000,000 4,999,332Wells Fargo & Co. . . . . . . . . . . . . . . . . . . . . . . . . . . . . . . . . . . . . . . . . . . . . . 0.13 02/11/14 4,000,000 3,999,408Wells Fargo & Co. . . . . . . . . . . . . . . . . . . . . . . . . . . . . . . . . . . . . . . . . . . . . . 0.14 02/25/14 1,000,000 999,786
Total Commercial Paper (Cost $155,031,128) 155,031,128
U.S. GOVERNMENT OBLIGATIONS(17.2% of portfolio)
U.S. Treasury Bill . . . . . . . . . . . . . . . . . . . . . . . . . . . . . . . . . . . . . . . . . . . . . . 0.06 02/20/14 3,000,000 2,999,771U.S. Treasury Note . . . . . . . . . . . . . . . . . . . . . . . . . . . . . . . . . . . . . . . . . . . . 1.00 01/15/14 4,000,000 4,001,411U.S. Treasury Note . . . . . . . . . . . . . . . . . . . . . . . . . . . . . . . . . . . . . . . . . . . . 1.75 01/31/14 6,000,000 6,008,305U.S. Treasury Note . . . . . . . . . . . . . . . . . . . . . . . . . . . . . . . . . . . . . . . . . . . . 1.25 02/15/14 4,000,000 4,005,778U.S. Treasury Note . . . . . . . . . . . . . . . . . . . . . . . . . . . . . . . . . . . . . . . . . . . . 1.88 02/28/14 7,500,000 7,522,048U.S. Treasury Note . . . . . . . . . . . . . . . . . . . . . . . . . . . . . . . . . . . . . . . . . . . . 1.25 03/15/14 5,000,000 5,011,730U.S. Treasury Note . . . . . . . . . . . . . . . . . . . . . . . . . . . . . . . . . . . . . . . . . . . . 1.25 04/15/14 7,000,000 7,023,019
Total U.S. Government Obligations (Cost $36,572,062) 36,572,062
MONEY MARKET ACCOUNT Shares
(9.1% of portfolio)
State Street Institutional Liquid Reserves Fund . . . . . . . . . . . . . . . . . . . . . 0.06(b) 19,312,508 19,312,508
Total Money Market Account (Cost $19,312,508) 19,312,508
TOTAL INVESTMENTS IN SECURITIES (Cost $212,396,152)—100% $212,396,152
(a) Security was purchased pursuant to Rule 144A under theSecurities Act of 1933 and may be resold in transactions exemptfrom registration, normally to qualified institutional buyers. Thesecurity has been determined to be liquid under criteria establishedby the Fund’s Board of Directors. The total of such securities atperiod-end amounts to $96,287,861 and represents 45.3% of totalinvestments.
(b) 7-day yield at December 31, 2013.
The accompanying notes are an integral part of these financial statements. Portfolio of Investments 29
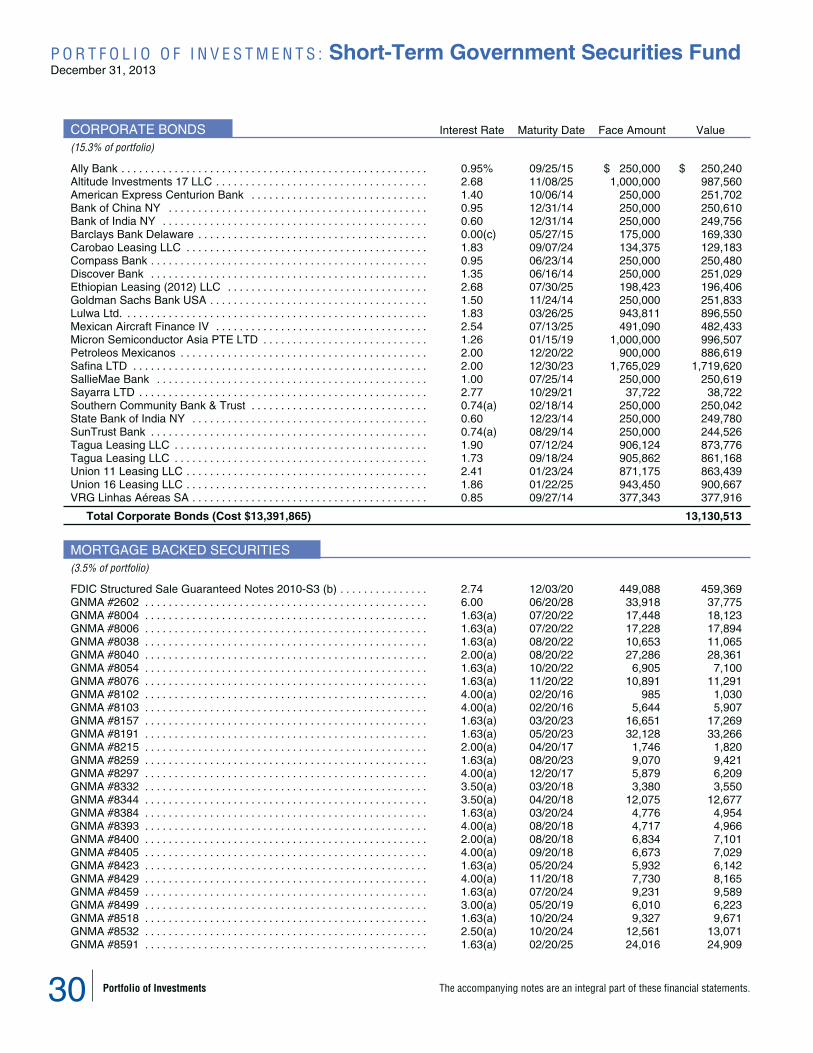
P O R T F O L I O O F I N V E S T M E N T S : Short-Term Government Securities FundDecember 31, 2013
CORPORATE BONDS Interest Rate Maturity Date Face Amount Value
(15.3% of portfolio)
Ally Bank . . . . . . . . . . . . . . . . . . . . . . . . . . . . . . . . . . . . . . . . . . . . . . . . . . . . 0.95% 09/25/15 $ 250,000 $ 250,240Altitude Investments 17 LLC . . . . . . . . . . . . . . . . . . . . . . . . . . . . . . . . . . . . 2.68 11/08/25 1,000,000 987,560American Express Centurion Bank . . . . . . . . . . . . . . . . . . . . . . . . . . . . . . 1.40 10/06/14 250,000 251,702Bank of China NY . . . . . . . . . . . . . . . . . . . . . . . . . . . . . . . . . . . . . . . . . . . . 0.95 12/31/14 250,000 250,610Bank of India NY . . . . . . . . . . . . . . . . . . . . . . . . . . . . . . . . . . . . . . . . . . . . . 0.60 12/31/14 250,000 249,756Barclays Bank Delaware . . . . . . . . . . . . . . . . . . . . . . . . . . . . . . . . . . . . . . . 0.00(c) 05/27/15 175,000 169,330Carobao Leasing LLC . . . . . . . . . . . . . . . . . . . . . . . . . . . . . . . . . . . . . . . . . 1.83 09/07/24 134,375 129,183Compass Bank . . . . . . . . . . . . . . . . . . . . . . . . . . . . . . . . . . . . . . . . . . . . . . . 0.95 06/23/14 250,000 250,480Discover Bank . . . . . . . . . . . . . . . . . . . . . . . . . . . . . . . . . . . . . . . . . . . . . . . 1.35 06/16/14 250,000 251,029Ethiopian Leasing (2012) LLC . . . . . . . . . . . . . . . . . . . . . . . . . . . . . . . . . . 2.68 07/30/25 198,423 196,406Goldman Sachs Bank USA . . . . . . . . . . . . . . . . . . . . . . . . . . . . . . . . . . . . . 1.50 11/24/14 250,000 251,833Lulwa Ltd. . . . . . . . . . . . . . . . . . . . . . . . . . . . . . . . . . . . . . . . . . . . . . . . . . . . 1.83 03/26/25 943,811 896,550Mexican Aircraft Finance IV . . . . . . . . . . . . . . . . . . . . . . . . . . . . . . . . . . . . 2.54 07/13/25 491,090 482,433Micron Semiconductor Asia PTE LTD . . . . . . . . . . . . . . . . . . . . . . . . . . . . 1.26 01/15/19 1,000,000 996,507Petroleos Mexicanos . . . . . . . . . . . . . . . . . . . . . . . . . . . . . . . . . . . . . . . . . . 2.00 12/20/22 900,000 886,619Safina LTD . . . . . . . . . . . . . . . . . . . . . . . . . . . . . . . . . . . . . . . . . . . . . . . . . . 2.00 12/30/23 1,765,029 1,719,620SallieMae Bank . . . . . . . . . . . . . . . . . . . . . . . . . . . . . . . . . . . . . . . . . . . . . . 1.00 07/25/14 250,000 250,619Sayarra LTD . . . . . . . . . . . . . . . . . . . . . . . . . . . . . . . . . . . . . . . . . . . . . . . . . 2.77 10/29/21 37,722 38,722Southern Community Bank & Trust . . . . . . . . . . . . . . . . . . . . . . . . . . . . . . 0.74(a) 02/18/14 250,000 250,042State Bank of India NY . . . . . . . . . . . . . . . . . . . . . . . . . . . . . . . . . . . . . . . . 0.60 12/23/14 250,000 249,780SunTrust Bank . . . . . . . . . . . . . . . . . . . . . . . . . . . . . . . . . . . . . . . . . . . . . . . 0.74(a) 08/29/14 250,000 244,526Tagua Leasing LLC . . . . . . . . . . . . . . . . . . . . . . . . . . . . . . . . . . . . . . . . . . . 1.90 07/12/24 906,124 873,776Tagua Leasing LLC . . . . . . . . . . . . . . . . . . . . . . . . . . . . . . . . . . . . . . . . . . . 1.73 09/18/24 905,862 861,168Union 11 Leasing LLC . . . . . . . . . . . . . . . . . . . . . . . . . . . . . . . . . . . . . . . . . 2.41 01/23/24 871,175 863,439Union 16 Leasing LLC . . . . . . . . . . . . . . . . . . . . . . . . . . . . . . . . . . . . . . . . . 1.86 01/22/25 943,450 900,667VRG Linhas Aéreas SA . . . . . . . . . . . . . . . . . . . . . . . . . . . . . . . . . . . . . . . . 0.85 09/27/14 377,343 377,916
Total Corporate Bonds (Cost $13,391,865) 13,130,513
MORTGAGE BACKED SECURITIES(3.5% of portfolio)
FDIC Structured Sale Guaranteed Notes 2010-S3 (b) . . . . . . . . . . . . . . . 2.74 12/03/20 449,088 459,369GNMA #2602 . . . . . . . . . . . . . . . . . . . . . . . . . . . . . . . . . . . . . . . . . . . . . . . . 6.00 06/20/28 33,918 37,775GNMA #8004 . . . . . . . . . . . . . . . . . . . . . . . . . . . . . . . . . . . . . . . . . . . . . . . . 1.63(a) 07/20/22 17,448 18,123GNMA #8006 . . . . . . . . . . . . . . . . . . . . . . . . . . . . . . . . . . . . . . . . . . . . . . . . 1.63(a) 07/20/22 17,228 17,894GNMA #8038 . . . . . . . . . . . . . . . . . . . . . . . . . . . . . . . . . . . . . . . . . . . . . . . . 1.63(a) 08/20/22 10,653 11,065GNMA #8040 . . . . . . . . . . . . . . . . . . . . . . . . . . . . . . . . . . . . . . . . . . . . . . . . 2.00(a) 08/20/22 27,286 28,361GNMA #8054 . . . . . . . . . . . . . . . . . . . . . . . . . . . . . . . . . . . . . . . . . . . . . . . . 1.63(a) 10/20/22 6,905 7,100GNMA #8076 . . . . . . . . . . . . . . . . . . . . . . . . . . . . . . . . . . . . . . . . . . . . . . . . 1.63(a) 11/20/22 10,891 11,291GNMA #8102 . . . . . . . . . . . . . . . . . . . . . . . . . . . . . . . . . . . . . . . . . . . . . . . . 4.00(a) 02/20/16 985 1,030GNMA #8103 . . . . . . . . . . . . . . . . . . . . . . . . . . . . . . . . . . . . . . . . . . . . . . . . 4.00(a) 02/20/16 5,644 5,907GNMA #8157 . . . . . . . . . . . . . . . . . . . . . . . . . . . . . . . . . . . . . . . . . . . . . . . . 1.63(a) 03/20/23 16,651 17,269GNMA #8191 . . . . . . . . . . . . . . . . . . . . . . . . . . . . . . . . . . . . . . . . . . . . . . . . 1.63(a) 05/20/23 32,128 33,266GNMA #8215 . . . . . . . . . . . . . . . . . . . . . . . . . . . . . . . . . . . . . . . . . . . . . . . . 2.00(a) 04/20/17 1,746 1,820GNMA #8259 . . . . . . . . . . . . . . . . . . . . . . . . . . . . . . . . . . . . . . . . . . . . . . . . 1.63(a) 08/20/23 9,070 9,421GNMA #8297 . . . . . . . . . . . . . . . . . . . . . . . . . . . . . . . . . . . . . . . . . . . . . . . . 4.00(a) 12/20/17 5,879 6,209GNMA #8332 . . . . . . . . . . . . . . . . . . . . . . . . . . . . . . . . . . . . . . . . . . . . . . . . 3.50(a) 03/20/18 3,380 3,550GNMA #8344 . . . . . . . . . . . . . . . . . . . . . . . . . . . . . . . . . . . . . . . . . . . . . . . . 3.50(a) 04/20/18 12,075 12,677GNMA #8384 . . . . . . . . . . . . . . . . . . . . . . . . . . . . . . . . . . . . . . . . . . . . . . . . 1.63(a) 03/20/24 4,776 4,954GNMA #8393 . . . . . . . . . . . . . . . . . . . . . . . . . . . . . . . . . . . . . . . . . . . . . . . . 4.00(a) 08/20/18 4,717 4,966GNMA #8400 . . . . . . . . . . . . . . . . . . . . . . . . . . . . . . . . . . . . . . . . . . . . . . . . 2.00(a) 08/20/18 6,834 7,101GNMA #8405 . . . . . . . . . . . . . . . . . . . . . . . . . . . . . . . . . . . . . . . . . . . . . . . . 4.00(a) 09/20/18 6,673 7,029GNMA #8423 . . . . . . . . . . . . . . . . . . . . . . . . . . . . . . . . . . . . . . . . . . . . . . . . 1.63(a) 05/20/24 5,932 6,142GNMA #8429 . . . . . . . . . . . . . . . . . . . . . . . . . . . . . . . . . . . . . . . . . . . . . . . . 4.00(a) 11/20/18 7,730 8,165GNMA #8459 . . . . . . . . . . . . . . . . . . . . . . . . . . . . . . . . . . . . . . . . . . . . . . . . 1.63(a) 07/20/24 9,231 9,589GNMA #8499 . . . . . . . . . . . . . . . . . . . . . . . . . . . . . . . . . . . . . . . . . . . . . . . . 3.00(a) 05/20/19 6,010 6,223GNMA #8518 . . . . . . . . . . . . . . . . . . . . . . . . . . . . . . . . . . . . . . . . . . . . . . . . 1.63(a) 10/20/24 9,327 9,671GNMA #8532 . . . . . . . . . . . . . . . . . . . . . . . . . . . . . . . . . . . . . . . . . . . . . . . . 2.50(a) 10/20/24 12,561 13,071GNMA #8591 . . . . . . . . . . . . . . . . . . . . . . . . . . . . . . . . . . . . . . . . . . . . . . . . 1.63(a) 02/20/25 24,016 24,909
30 Portfolio of Investments The accompanying notes are an integral part of these financial statements.

PORTFOLIO OF INVESTMENTS: Short-Term Government Securities Fund (continued)December 31, 2013
Interest Rate Maturity Date Face Amount Value
(Mortgage Backed Securities continued)
GNMA #8638 . . . . . . . . . . . . . . . . . . . . . . . . . . . . . . . . . . . . . . . . . . . . . . . . 1.63%(a) 06/20/25 $ 11,042 $ 11,433GNMA #8648 . . . . . . . . . . . . . . . . . . . . . . . . . . . . . . . . . . . . . . . . . . . . . . . . 1.63(a) 07/20/25 19,094 19,835GNMA #8663 . . . . . . . . . . . . . . . . . . . . . . . . . . . . . . . . . . . . . . . . . . . . . . . . 2.00(a) 07/20/25 14,137 14,695GNMA #8680 . . . . . . . . . . . . . . . . . . . . . . . . . . . . . . . . . . . . . . . . . . . . . . . . 3.50(a) 08/20/20 8,781 9,214GNMA #8687 . . . . . . . . . . . . . . . . . . . . . . . . . . . . . . . . . . . . . . . . . . . . . . . . 2.50(a) 08/20/25 3,685 3,757GNMA #8702 . . . . . . . . . . . . . . . . . . . . . . . . . . . . . . . . . . . . . . . . . . . . . . . . 3.00(a) 10/20/20 4,768 4,967GNMA #8747 . . . . . . . . . . . . . . . . . . . . . . . . . . . . . . . . . . . . . . . . . . . . . . . . 1.63(a) 11/20/25 8,832 9,157GNMA #8807 . . . . . . . . . . . . . . . . . . . . . . . . . . . . . . . . . . . . . . . . . . . . . . . . 1.63(a) 07/20/21 9,956 10,340GNMA #8836 . . . . . . . . . . . . . . . . . . . . . . . . . . . . . . . . . . . . . . . . . . . . . . . . 1.63(a) 09/20/21 10,220 10,615GNMA #8847 . . . . . . . . . . . . . . . . . . . . . . . . . . . . . . . . . . . . . . . . . . . . . . . . 1.63(a) 04/20/26 11,831 12,251GNMA #8869 . . . . . . . . . . . . . . . . . . . . . . . . . . . . . . . . . . . . . . . . . . . . . . . . 1.63(a) 11/20/21 31,894 33,065GNMA #8873 . . . . . . . . . . . . . . . . . . . . . . . . . . . . . . . . . . . . . . . . . . . . . . . . 2.50(a) 11/20/21 15,541 16,004GNMA #8877 . . . . . . . . . . . . . . . . . . . . . . . . . . . . . . . . . . . . . . . . . . . . . . . . 1.63(a) 05/20/26 2,761 2,859GNMA #8883 . . . . . . . . . . . . . . . . . . . . . . . . . . . . . . . . . . . . . . . . . . . . . . . . 1.63(a) 12/20/21 11,169 11,579GNMA #8915 . . . . . . . . . . . . . . . . . . . . . . . . . . . . . . . . . . . . . . . . . . . . . . . . 1.63(a) 02/20/22 10,523 10,913GNMA #8934 . . . . . . . . . . . . . . . . . . . . . . . . . . . . . . . . . . . . . . . . . . . . . . . . 1.63(a) 03/20/22 18,903 19,604GNMA #8978 . . . . . . . . . . . . . . . . . . . . . . . . . . . . . . . . . . . . . . . . . . . . . . . . 1.63(a) 05/20/22 46,372 48,013GNMA #80053 . . . . . . . . . . . . . . . . . . . . . . . . . . . . . . . . . . . . . . . . . . . . . . . 1.63(a) 03/20/27 2,542 2,637GNMA #80058 . . . . . . . . . . . . . . . . . . . . . . . . . . . . . . . . . . . . . . . . . . . . . . . 1.63(a) 04/20/27 2,449 2,536GNMA #80185 . . . . . . . . . . . . . . . . . . . . . . . . . . . . . . . . . . . . . . . . . . . . . . . 1.63(a) 04/20/28 23,161 23,984GNMA #80264 . . . . . . . . . . . . . . . . . . . . . . . . . . . . . . . . . . . . . . . . . . . . . . . 1.63(a) 03/20/29 19,746 20,481GNMA #80283 . . . . . . . . . . . . . . . . . . . . . . . . . . . . . . . . . . . . . . . . . . . . . . . 1.63(a) 05/20/29 16,028 16,598GNMA #80300 . . . . . . . . . . . . . . . . . . . . . . . . . . . . . . . . . . . . . . . . . . . . . . . 1.63(a) 07/20/29 14,091 14,639GNMA #80309 . . . . . . . . . . . . . . . . . . . . . . . . . . . . . . . . . . . . . . . . . . . . . . . 1.63(a) 08/20/29 6,681 6,941GNMA #80363 . . . . . . . . . . . . . . . . . . . . . . . . . . . . . . . . . . . . . . . . . . . . . . . 1.63(a) 01/20/30 48,946 50,769GNMA #80426 . . . . . . . . . . . . . . . . . . . . . . . . . . . . . . . . . . . . . . . . . . . . . . . 1.63(a) 07/20/30 2,020 2,099GNMA #80452 . . . . . . . . . . . . . . . . . . . . . . . . . . . . . . . . . . . . . . . . . . . . . . . 1.63(a) 09/20/30 15,128 15,716GNMA #80475 . . . . . . . . . . . . . . . . . . . . . . . . . . . . . . . . . . . . . . . . . . . . . . . 1.63(a) 12/20/30 25,705 26,654GNMA #80577 . . . . . . . . . . . . . . . . . . . . . . . . . . . . . . . . . . . . . . . . . . . . . . . 1.63(a) 02/20/32 3,424 3,552GNMA #80684 . . . . . . . . . . . . . . . . . . . . . . . . . . . . . . . . . . . . . . . . . . . . . . . 1.63(a) 04/20/33 10,053 10,411GNMA #81129 . . . . . . . . . . . . . . . . . . . . . . . . . . . . . . . . . . . . . . . . . . . . . . . 2.13(a) 10/20/34 212,498 220,747GNMA #510280 . . . . . . . . . . . . . . . . . . . . . . . . . . . . . . . . . . . . . . . . . . . . . . 6.00 08/15/14 416 417GNMA #583189 . . . . . . . . . . . . . . . . . . . . . . . . . . . . . . . . . . . . . . . . . . . . . . 4.50 02/20/17 19,797 21,078GNMA #607494 . . . . . . . . . . . . . . . . . . . . . . . . . . . . . . . . . . . . . . . . . . . . . . 5.00 04/15/19 15,516 16,525GNMA #616274 . . . . . . . . . . . . . . . . . . . . . . . . . . . . . . . . . . . . . . . . . . . . . . 5.00 02/15/19 16,030 17,124GNMA 1996-4 . . . . . . . . . . . . . . . . . . . . . . . . . . . . . . . . . . . . . . . . . . . . . . . 7.00 04/16/26 2,883 3,220GNMA 2001-53 . . . . . . . . . . . . . . . . . . . . . . . . . . . . . . . . . . . . . . . . . . . . . . 5.50 10/20/31 8,653 8,876GNMA 2001-53 . . . . . . . . . . . . . . . . . . . . . . . . . . . . . . . . . . . . . . . . . . . . . . 0.52(a) 10/20/31 1,596 1,599GNMA 2002-15 . . . . . . . . . . . . . . . . . . . . . . . . . . . . . . . . . . . . . . . . . . . . . . 5.50 11/20/31 16,572 17,175GNMA 2002-20 . . . . . . . . . . . . . . . . . . . . . . . . . . . . . . . . . . . . . . . . . . . . . . 4.50 03/20/32 17,128 18,425GNMA 2003-11 . . . . . . . . . . . . . . . . . . . . . . . . . . . . . . . . . . . . . . . . . . . . . . 4.00 10/17/29 26,074 27,449GNMA 2003-12 . . . . . . . . . . . . . . . . . . . . . . . . . . . . . . . . . . . . . . . . . . . . . . 4.50 02/20/32 8,754 9,020GNMA 2003-26 . . . . . . . . . . . . . . . . . . . . . . . . . . . . . . . . . . . . . . . . . . . . . . 0.62(a) 04/16/33 7,726 7,785GNMA 2003-97 . . . . . . . . . . . . . . . . . . . . . . . . . . . . . . . . . . . . . . . . . . . . . . 4.50 03/20/33 29,221 30,838GNMA 2004-102 . . . . . . . . . . . . . . . . . . . . . . . . . . . . . . . . . . . . . . . . . . . . . 5.50 04/20/34 52,506 57,942GNMA 2004-17 . . . . . . . . . . . . . . . . . . . . . . . . . . . . . . . . . . . . . . . . . . . . . . 4.50 12/20/33 72,324 77,029GNMA 2010-113 . . . . . . . . . . . . . . . . . . . . . . . . . . . . . . . . . . . . . . . . . . . . . 2.50 02/16/40 443,166 436,167GNMA #MA0668 . . . . . . . . . . . . . . . . . . . . . . . . . . . . . . . . . . . . . . . . . . . . . 2.00 12/20/27 234,246 226,918NCUA Guaranteed Notes 2010-C1 . . . . . . . . . . . . . . . . . . . . . . . . . . . . . . 1.60 10/29/20 592,720 597,170
Total Mortgage Backed Securities (Cost $2,958,177) 3,024,769
ASSET BACKED SECURITIES(0.5% of portfolio)
Small Business Administration 98-20D . . . . . . . . . . . . . . . . . . . . . . . . . . . 6.15 04/01/18 9,847 10,454Small Business Administration 98-20E . . . . . . . . . . . . . . . . . . . . . . . . . . . 6.30 05/01/18 12,501 13,389Small Business Administration 98-20H . . . . . . . . . . . . . . . . . . . . . . . . . . . 6.15 08/01/18 5,260 5,597Small Business Administration 99-20D . . . . . . . . . . . . . . . . . . . . . . . . . . . 6.15 04/01/19 17,132 18,474Small Business Administration 04-20B . . . . . . . . . . . . . . . . . . . . . . . . . . . 4.72 02/01/24 49,670 53,184
The accompanying notes are an integral part of these financial statements. Portfolio of Investments 31

PORTFOLIO OF INVESTMENTS: Short-Term Government Securities Fund (continued)December 31, 2013
InterestRate/Yield Maturity Date Face Amount Value
(Asset Backed Securities continued)
Small Business Administration 04-20C . . . . . . . . . . . . . . . . . . . . . . . . . . . . . 4.34% 03/01/24 $ 75,344 $ 79,359Small Business Administration 05-10E . . . . . . . . . . . . . . . . . . . . . . . . . . . . . 4.54 09/01/15 8,576 8,746Small Business Administration Pool # 100075 . . . . . . . . . . . . . . . . . . . . . . . 3.50 05/25/19 20,176 20,009Small Business Administration Pool # 502261 . . . . . . . . . . . . . . . . . . . . . . . 1.38(a) 10/25/17 8,779 8,765Small Business Administration Pool # 502684 . . . . . . . . . . . . . . . . . . . . . . . 1.25(a) 07/25/19 2,295 2,326Small Business Administration Pool # 503278 . . . . . . . . . . . . . . . . . . . . . . . 0.88(a) 02/25/21 19,414 19,434Small Business Administration Pool # 503463 . . . . . . . . . . . . . . . . . . . . . . . 1.13(a) 09/25/21 4,291 4,281Small Business Administration Pool # 504305 . . . . . . . . . . . . . . . . . . . . . . . 0.88(a) 10/25/23 4,440 4,410Small Business Investment Companies 02-20K . . . . . . . . . . . . . . . . . . . . . . 5.08 11/01/22 17,005 18,443Small Business Investment Companies 04-10A . . . . . . . . . . . . . . . . . . . . . . 4.12 03/10/14 21,949 22,078Small Business Investment Companies 04-10B . . . . . . . . . . . . . . . . . . . . . . 4.68 09/10/14 22,047 22,583Small Business Investment Companies 04-P10A . . . . . . . . . . . . . . . . . . . . . 4.50 02/10/14 6,858 6,876Small Business Investment Companies 05-10B . . . . . . . . . . . . . . . . . . . . . . 4.94 09/10/15 66,478 68,754Small Business Investment Companies 05-P10A . . . . . . . . . . . . . . . . . . . . . 4.64 02/10/15 17,181 17,834Small Business Investment Companies 07-10A . . . . . . . . . . . . . . . . . . . . . . 5.38 03/10/17 20,490 22,115
Total Asset Backed Securities (Cost $401,053) 427,111
MUNICIPAL BONDS(5.7% of portfolio)
Carmel, Indiana Redevelopment District . . . . . . . . . . . . . . . . . . . . . . . . . . . . 7.80 01/15/29 500,000 583,785Cook County, Illinois Community Consolidated School District . . . . . . . . . . 0.00(c) 12/01/15 1,050,000 1,038,492DuPage & Cook County Illinois Community School District . . . . . . . . . . . . . 5.25 01/01/26 110,000 120,544Hamilton Township, New Jersey Board of Education . . . . . . . . . . . . . . . . . . 5.53 08/15/24 700,000 720,790Illinois Housing Development Authority, Illinois . . . . . . . . . . . . . . . . . . . . . . . 4.13 10/20/16 595,000 620,823Jefferson County Colorado . . . . . . . . . . . . . . . . . . . . . . . . . . . . . . . . . . . . . . . 0.00(c) 03/01/16 200,000 197,640Miami-Dade County, Florida Educational Facilities Authority . . . . . . . . . . . 4.70 04/01/14 560,000 565,230Rio Rancho, New Mexico New Event Center . . . . . . . . . . . . . . . . . . . . . . . . 5.00 06/01/20 1,000,000 1,058,370
Total Municipal Bonds (Cost $4,907,271) 4,905,674
U. S. GOVERNMENT AND AGENCY OBLIGATIONS(57.1% of portfolio)
Government Trust Certificate (Israel Trust) . . . . . . . . . . . . . . . . . . . . . . . . . . 0.00(c) 04/01/15 2,750,000 2,711,838National Archives Facility Trust . . . . . . . . . . . . . . . . . . . . . . . . . . . . . . . . . . . . 8.50 09/01/19 33,311 39,933Overseas Private Investment Corp. . . . . . . . . . . . . . . . . . . . . . . . . . . . . . . . . 3.46(d) 07/12/14 1,000,000 1,151,130Overseas Private Investment Corp. . . . . . . . . . . . . . . . . . . . . . . . . . . . . . . . . 1.84(d) 07/12/14 1,500,000 1,605,237Overseas Private Investment Corp. . . . . . . . . . . . . . . . . . . . . . . . . . . . . . . . . 0.61(e) 12/22/15 1,500,000 1,510,217Overseas Private Investment Corp. . . . . . . . . . . . . . . . . . . . . . . . . . . . . . . . . 3.50(e) 05/02/16 1,000,000 1,177,200Overseas Private Investment Corp. . . . . . . . . . . . . . . . . . . . . . . . . . . . . . . . . 3.56(d) 04/23/17 3,000,000 3,616,059Overseas Private Investment Corp. . . . . . . . . . . . . . . . . . . . . . . . . . . . . . . . . 1.50(e) 11/17/17 1,000,000 995,113Overseas Private Investment Corp. . . . . . . . . . . . . . . . . . . . . . . . . . . . . . . . . 1.32(d) 02/19/18 3,050,000 3,007,568Overseas Private Investment Corp. . . . . . . . . . . . . . . . . . . . . . . . . . . . . . . . . 1.55(e) 03/15/18 3,600,000 3,762,670Overseas Private Investment Corp. . . . . . . . . . . . . . . . . . . . . . . . . . . . . . . . . 0.68(e) 04/30/18 2,000,000 2,014,120Overseas Private Investment Corp. . . . . . . . . . . . . . . . . . . . . . . . . . . . . . . . . 1.84(e) 06/10/18 1,000,000 1,077,587Overseas Private Investment Corp. . . . . . . . . . . . . . . . . . . . . . . . . . . . . . . . . 5.66(e) 06/10/18 900,000 1,312,319Overseas Private Investment Corp. . . . . . . . . . . . . . . . . . . . . . . . . . . . . . . . . 1.14(e) 06/10/18 4,000,000 4,093,144Overseas Private Investment Corp. . . . . . . . . . . . . . . . . . . . . . . . . . . . . . . . . 0.78(e) 07/07/19 1,000,000 1,010,273Overseas Private Investment Corp. . . . . . . . . . . . . . . . . . . . . . . . . . . . . . . . . 2.53(e) 07/07/19 1,000,000 1,120,340Overseas Private Investment Corp. . . . . . . . . . . . . . . . . . . . . . . . . . . . . . . . . 0.83(e) 11/08/19 2,000,000 1,994,576Overseas Private Investment Corp. . . . . . . . . . . . . . . . . . . . . . . . . . . . . . . . . 1.34(e) 11/20/19 2,000,000 2,070,074Overseas Private Investment Corp. . . . . . . . . . . . . . . . . . . . . . . . . . . . . . . . . 1.50(e) 11/15/20 1,000,000 978,300Overseas Private Investment Corp. . . . . . . . . . . . . . . . . . . . . . . . . . . . . . . . . 3.37 05/15/21 848,453 886,018Overseas Private Investment Corp. . . . . . . . . . . . . . . . . . . . . . . . . . . . . . . . . 2.07 05/15/21 889,800 884,596Philippine Power Trust I (b) . . . . . . . . . . . . . . . . . . . . . . . . . . . . . . . . . . . . . . . 5.40 09/26/18 297,619 319,190Private Export Funding Corp. . . . . . . . . . . . . . . . . . . . . . . . . . . . . . . . . . . . . . 2.53 07/15/16 500,000 518,631The Financing Corp. . . . . . . . . . . . . . . . . . . . . . . . . . . . . . . . . . . . . . . . . . . . . 0.00(c) 10/06/17 500,000 471,103The Financing Corp. . . . . . . . . . . . . . . . . . . . . . . . . . . . . . . . . . . . . . . . . . . . . 0.00(c) 02/08/18 500,000 466,608
32 Portfolio of Investments The accompanying notes are an integral part of these financial statements.
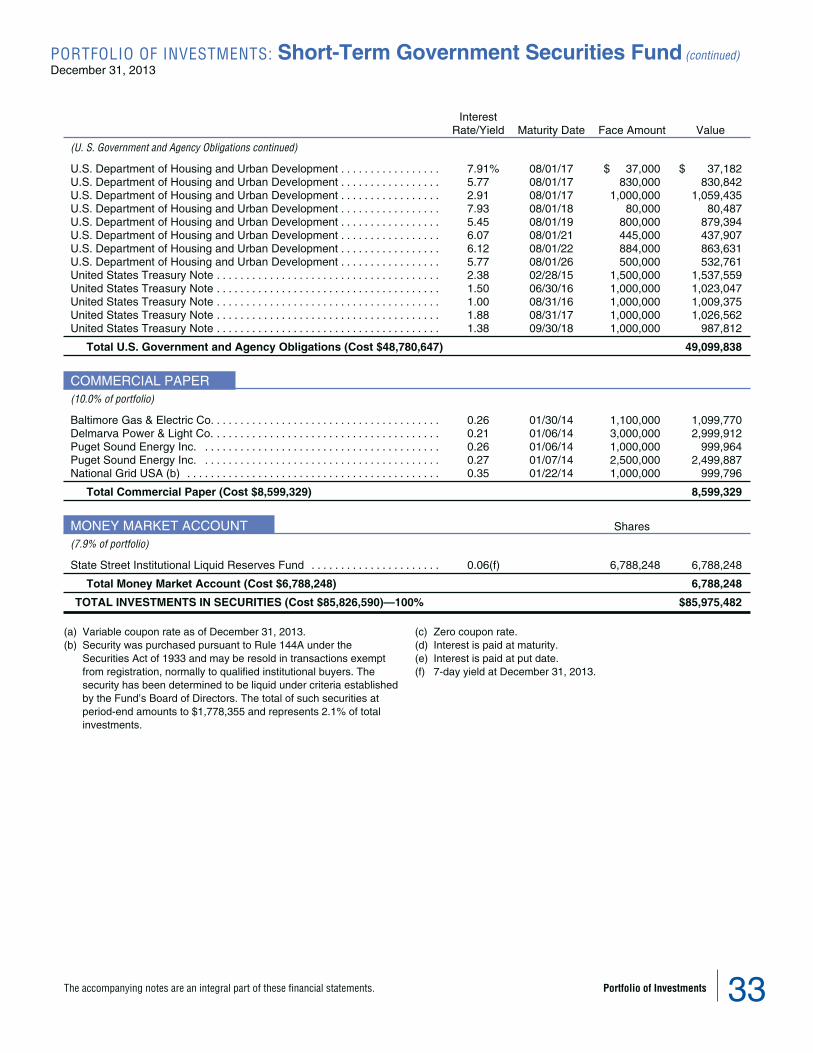
PORTFOLIO OF INVESTMENTS: Short-Term Government Securities Fund (continued)December 31, 2013
InterestRate/Yield Maturity Date Face Amount Value
(U. S. Government and Agency Obligations continued)
U.S. Department of Housing and Urban Development . . . . . . . . . . . . . . . . . 7.91% 08/01/17 $ 37,000 $ 37,182U.S. Department of Housing and Urban Development . . . . . . . . . . . . . . . . . 5.77 08/01/17 830,000 830,842U.S. Department of Housing and Urban Development . . . . . . . . . . . . . . . . . 2.91 08/01/17 1,000,000 1,059,435U.S. Department of Housing and Urban Development . . . . . . . . . . . . . . . . . 7.93 08/01/18 80,000 80,487U.S. Department of Housing and Urban Development . . . . . . . . . . . . . . . . . 5.45 08/01/19 800,000 879,394U.S. Department of Housing and Urban Development . . . . . . . . . . . . . . . . . 6.07 08/01/21 445,000 437,907U.S. Department of Housing and Urban Development . . . . . . . . . . . . . . . . . 6.12 08/01/22 884,000 863,631U.S. Department of Housing and Urban Development . . . . . . . . . . . . . . . . . 5.77 08/01/26 500,000 532,761United States Treasury Note . . . . . . . . . . . . . . . . . . . . . . . . . . . . . . . . . . . . . . 2.38 02/28/15 1,500,000 1,537,559United States Treasury Note . . . . . . . . . . . . . . . . . . . . . . . . . . . . . . . . . . . . . . 1.50 06/30/16 1,000,000 1,023,047United States Treasury Note . . . . . . . . . . . . . . . . . . . . . . . . . . . . . . . . . . . . . . 1.00 08/31/16 1,000,000 1,009,375United States Treasury Note . . . . . . . . . . . . . . . . . . . . . . . . . . . . . . . . . . . . . . 1.88 08/31/17 1,000,000 1,026,562United States Treasury Note . . . . . . . . . . . . . . . . . . . . . . . . . . . . . . . . . . . . . . 1.38 09/30/18 1,000,000 987,812
Total U.S. Government and Agency Obligations (Cost $48,780,647) 49,099,838
COMMERCIAL PAPER(10.0% of portfolio)
Baltimore Gas & Electric Co. . . . . . . . . . . . . . . . . . . . . . . . . . . . . . . . . . . . . . . 0.26 01/30/14 1,100,000 1,099,770Delmarva Power & Light Co. . . . . . . . . . . . . . . . . . . . . . . . . . . . . . . . . . . . . . . 0.21 01/06/14 3,000,000 2,999,912Puget Sound Energy Inc. . . . . . . . . . . . . . . . . . . . . . . . . . . . . . . . . . . . . . . . . 0.26 01/06/14 1,000,000 999,964Puget Sound Energy Inc. . . . . . . . . . . . . . . . . . . . . . . . . . . . . . . . . . . . . . . . . 0.27 01/07/14 2,500,000 2,499,887National Grid USA (b) . . . . . . . . . . . . . . . . . . . . . . . . . . . . . . . . . . . . . . . . . . . 0.35 01/22/14 1,000,000 999,796
Total Commercial Paper (Cost $8,599,329) 8,599,329
MONEY MARKET ACCOUNT Shares
(7.9% of portfolio)
State Street Institutional Liquid Reserves Fund . . . . . . . . . . . . . . . . . . . . . . 0.06(f) 6,788,248 6,788,248
Total Money Market Account (Cost $6,788,248) 6,788,248
TOTAL INVESTMENTS IN SECURITIES (Cost $85,826,590)—100% $85,975,482
(a) Variable coupon rate as of December 31, 2013.(b) Security was purchased pursuant to Rule 144A under the
Securities Act of 1933 and may be resold in transactions exemptfrom registration, normally to qualified institutional buyers. Thesecurity has been determined to be liquid under criteria establishedby the Fund’s Board of Directors. The total of such securities atperiod-end amounts to $1,778,355 and represents 2.1% of totalinvestments.
(c) Zero coupon rate.(d) Interest is paid at maturity.(e) Interest is paid at put date.(f) 7-day yield at December 31, 2013.
The accompanying notes are an integral part of these financial statements. Portfolio of Investments 33

P O R T F O L I O O F I N V E S T M E N T S : Short-Term Bond FundDecember 31, 2013
CORPORATE BONDS Interest Rate Maturity Date Face Amount Value
(18.9% of portfolio)
BASIC INDUSTRIES—1.9%Caterpillar Inc. . . . . . . . . . . . . . . . . . . . . . . . . . . . . . . . . . . . . . . . . . . . . . . 1.50% 06/26/17 $ 500,000 $ 497,576Danaher Corp. . . . . . . . . . . . . . . . . . . . . . . . . . . . . . . . . . . . . . . . . . . . . . . 1.30 06/23/14 525,000 527,391Dun & Bradstreet Corp. . . . . . . . . . . . . . . . . . . . . . . . . . . . . . . . . . . . . . . . 2.88 11/15/15 990,000 1,015,254Eaton Corp. . . . . . . . . . . . . . . . . . . . . . . . . . . . . . . . . . . . . . . . . . . . . . . . . 0.57(a) 06/16/14 1,025,000 1,026,296General Dynamics Corp. . . . . . . . . . . . . . . . . . . . . . . . . . . . . . . . . . . . . . . 1.38 01/15/15 775,000 782,672General Electric Co. . . . . . . . . . . . . . . . . . . . . . . . . . . . . . . . . . . . . . . . . . . 0.85 10/09/15 550,000 552,569General Electric Co. . . . . . . . . . . . . . . . . . . . . . . . . . . . . . . . . . . . . . . . . . . 5.25 12/06/17 3,900,000 4,414,574Rockwell Collins Inc. . . . . . . . . . . . . . . . . . . . . . . . . . . . . . . . . . . . . . . . . . 0.59(a) 12/15/16 1,175,000 1,174,992
Total Basic Industries 9,991,324
CONSUMER STAPLES—0.3%BeveragesPepsico Inc. . . . . . . . . . . . . . . . . . . . . . . . . . . . . . . . . . . . . . . . . . . . . . . . . 0.70 02/26/16 525,000 522,277Pepsico Inc. . . . . . . . . . . . . . . . . . . . . . . . . . . . . . . . . . . . . . . . . . . . . . . . . 0.45(a) 02/26/16 525,000 525,347Personal ProductsColgate-Palmolive Co. . . . . . . . . . . . . . . . . . . . . . . . . . . . . . . . . . . . . . . . . 0.90 05/01/18 550,000 525,341
Total Consumer Staples 1,572,965
CONSUMER DISCRETIONARY—0.2%Food and Staples RetailingWal-Mart Stores Inc. . . . . . . . . . . . . . . . . . . . . . . . . . . . . . . . . . . . . . . . . . 1.95 12/15/18 1,175,000 1,170,761
Total Consumer Discretionary 1,170,761
ENERGY—0.9%Oil, Gas, & Consumable FuelsChevron Corp. . . . . . . . . . . . . . . . . . . . . . . . . . . . . . . . . . . . . . . . . . . . . . . 0.89 06/24/16 2,075,000 2,079,926Chevron Corp. . . . . . . . . . . . . . . . . . . . . . . . . . . . . . . . . . . . . . . . . . . . . . . 1.10 12/05/17 475,000 464,547Chevron Corp. . . . . . . . . . . . . . . . . . . . . . . . . . . . . . . . . . . . . . . . . . . . . . . 1.72 06/24/18 975,000 971,320Questar Corp. . . . . . . . . . . . . . . . . . . . . . . . . . . . . . . . . . . . . . . . . . . . . . . . 2.75 02/01/16 1,500,000 1,545,545
Total Energy 5,061,338
FINANCE—6.3%Commercial BanksBank of America NA . . . . . . . . . . . . . . . . . . . . . . . . . . . . . . . . . . . . . . . . . 0.52(a) 06/15/16 2,025,000 2,006,856Bank of America NA . . . . . . . . . . . . . . . . . . . . . . . . . . . . . . . . . . . . . . . . . 0.54(a) 06/15/17 1,550,000 1,520,739JP Morgan Chase Bank NA . . . . . . . . . . . . . . . . . . . . . . . . . . . . . . . . . . . 0.57(a) 06/13/16 12,625,000 12,558,656Key Bank NA . . . . . . . . . . . . . . . . . . . . . . . . . . . . . . . . . . . . . . . . . . . . . . . 7.41 10/15/27 1,050,000 1,137,707Landesbank Baden-Wuerttemberg NY . . . . . . . . . . . . . . . . . . . . . . . . . . 5.05 12/30/15 100,000 106,769Union Bank NA . . . . . . . . . . . . . . . . . . . . . . . . . . . . . . . . . . . . . . . . . . . . . . 5.95 05/11/16 525,000 581,773WestLB AG, NY . . . . . . . . . . . . . . . . . . . . . . . . . . . . . . . . . . . . . . . . . . . . . 4.80 07/15/15 275,000 290,524Consumer FinanceGeneral Electric Capital Corp. . . . . . . . . . . . . . . . . . . . . . . . . . . . . . . . . . 0.39(a) 09/15/14 2,350,000 2,352,033General Electric Capital Corp. . . . . . . . . . . . . . . . . . . . . . . . . . . . . . . . . . 1.06(a) 12/20/17 1,100,000 1,098,319HSBC Finance Corp. . . . . . . . . . . . . . . . . . . . . . . . . . . . . . . . . . . . . . . . . . 0.49(a) 01/15/14 1,650,000 1,650,016InsuranceBerkshire Hathaway Finance Corp. . . . . . . . . . . . . . . . . . . . . . . . . . . . . . 1.50 01/10/14 625,000 625,146Genworth Global Funding . . . . . . . . . . . . . . . . . . . . . . . . . . . . . . . . . . . . . 0.43(a) 04/15/14 4,675,000 4,671,003Capital MarketsMorgan Stanley . . . . . . . . . . . . . . . . . . . . . . . . . . . . . . . . . . . . . . . . . . . . . 0.54(a) 01/09/14 1,775,000 1,775,027Morgan Stanley . . . . . . . . . . . . . . . . . . . . . . . . . . . . . . . . . . . . . . . . . . . . . 4.10 01/26/15 700,000 724,011Vesey Street Investment Trust I . . . . . . . . . . . . . . . . . . . . . . . . . . . . . . . . 4.40 09/01/16 2,275,000 2,442,690
Total Finance 33,541,269
34 Portfolio of Investments The accompanying notes are an integral part of these financial statements.

P O R T F O L I O O F I N V E S T M E N T S : Short-Term Bond Fund (continued)December 31, 2013
Interest Rate Maturity Date Face Amount Value
(Corporate Bonds continued)
HEALTH CARE—1.4%Health Care Equipment & SuppliesBaxter International Inc. . . . . . . . . . . . . . . . . . . . . . . . . . . . . . . . . . . . . . . 0.41%(a) 12/11/14 $ 825,000 $ 826,043Baxter International Inc. . . . . . . . . . . . . . . . . . . . . . . . . . . . . . . . . . . . . . . 0.95 06/01/16 825,000 824,911Baxter International Inc. . . . . . . . . . . . . . . . . . . . . . . . . . . . . . . . . . . . . . . 1.85 01/15/17 2,250,000 2,274,190Johnson & Johnson . . . . . . . . . . . . . . . . . . . . . . . . . . . . . . . . . . . . . . . . . . 1.20 05/15/14 1,375,000 1,379,106Thermo Fisher Scientific Inc. . . . . . . . . . . . . . . . . . . . . . . . . . . . . . . . . . . 2.05 02/21/14 750,000 751,229Health Care Providers & ServicesUnitedHealth Group Inc. . . . . . . . . . . . . . . . . . . . . . . . . . . . . . . . . . . . . . . 0.85 10/15/15 550,000 552,202PharmaceuticalsEli Lilly and Co. . . . . . . . . . . . . . . . . . . . . . . . . . . . . . . . . . . . . . . . . . . . . . 6.57 01/01/16 1,025,000 1,143,210
Total Health Care 7,750,891
INFORMATION TECHNOLOGY—2.7%Computers & PeripheralsIntel Corp. . . . . . . . . . . . . . . . . . . . . . . . . . . . . . . . . . . . . . . . . . . . . . . . . . . 1.35 12/15/17 950,000 938,922Apple Inc. . . . . . . . . . . . . . . . . . . . . . . . . . . . . . . . . . . . . . . . . . . . . . . . . . . 1.00 05/03/18 8,150,000 7,880,618IT ServicesHewlett Packard Co. . . . . . . . . . . . . . . . . . . . . . . . . . . . . . . . . . . . . . . . . . 1.79(a) 09/19/14 3,700,000 3,731,428SoftwareMicrosoft Corp. . . . . . . . . . . . . . . . . . . . . . . . . . . . . . . . . . . . . . . . . . . . . . . 0.88 11/15/17 250,000 246,134Microsoft Corp. . . . . . . . . . . . . . . . . . . . . . . . . . . . . . . . . . . . . . . . . . . . . . . 1.00 05/01/18 900,000 878,017Microsoft Corp. . . . . . . . . . . . . . . . . . . . . . . . . . . . . . . . . . . . . . . . . . . . . . . 1.63 12/06/18 675,000 665,803
Total Information Technology 14,340,922
TRANSPORTATION—1.0%Road & RailBurlington Northern & Santa Fe Railway Co. . . . . . . . . . . . . . . . . . . . . . 4.58 01/15/21 748,423 806,426Burlington Northern & Santa Fe Railway Co. . . . . . . . . . . . . . . . . . . . . . 4.83 01/15/23 119,786 128,480Consolidated Rail Corp. . . . . . . . . . . . . . . . . . . . . . . . . . . . . . . . . . . . . . . 6.76 05/25/15 17,845 17,935CSX Transportation Inc. . . . . . . . . . . . . . . . . . . . . . . . . . . . . . . . . . . . . . . 8.38 10/15/14 199,286 210,341CSX Transportation Inc. . . . . . . . . . . . . . . . . . . . . . . . . . . . . . . . . . . . . . . 9.00 05/15/15 575,000 632,823GATX Corp. . . . . . . . . . . . . . . . . . . . . . . . . . . . . . . . . . . . . . . . . . . . . . . . . 8.75 05/15/14 125,000 128,732Skyway Concession Co. LLC (b) . . . . . . . . . . . . . . . . . . . . . . . . . . . . . . . 0.53(a) 06/30/17 3,825,000 3,442,500Union Pacific Railroad Co. . . . . . . . . . . . . . . . . . . . . . . . . . . . . . . . . . . . . 6.85 01/02/19 48,288 53,392
Total Transportation 5,420,629
UTILITIES—4.2%Electric & GasAmeren Illinois Co. . . . . . . . . . . . . . . . . . . . . . . . . . . . . . . . . . . . . . . . . . . 6.20 06/15/16 5,000,000 5,548,535Duke Energy Indiana Inc. . . . . . . . . . . . . . . . . . . . . . . . . . . . . . . . . . . . . . 0.60(a) 07/11/16 1,450,000 1,451,823Entergy Louisiana LLC . . . . . . . . . . . . . . . . . . . . . . . . . . . . . . . . . . . . . . . 1.88 12/15/14 1,800,000 1,823,976Georgia Power Co. . . . . . . . . . . . . . . . . . . . . . . . . . . . . . . . . . . . . . . . . . . 0.56(a) 03/15/16 850,000 850,058Georgia Power Co. . . . . . . . . . . . . . . . . . . . . . . . . . . . . . . . . . . . . . . . . . . 0.64(a) 08/15/16 4,100,000 4,101,131Idaho Power Corp. . . . . . . . . . . . . . . . . . . . . . . . . . . . . . . . . . . . . . . . . . . . 6.03 07/15/18 925,000 1,060,238Michigan Consolidated Gas Co. . . . . . . . . . . . . . . . . . . . . . . . . . . . . . . . . 8.25 05/01/14 1,370,000 1,404,373NSTAR Electric Co. . . . . . . . . . . . . . . . . . . . . . . . . . . . . . . . . . . . . . . . . . . 4.88 04/15/14 600,000 607,481TelephoneAmeritech Capital Funding Corp. . . . . . . . . . . . . . . . . . . . . . . . . . . . . . . . 6.45 01/15/18 1,200,000 1,359,760AT&T Inc. . . . . . . . . . . . . . . . . . . . . . . . . . . . . . . . . . . . . . . . . . . . . . . . . . . 0.88 02/13/15 1,350,000 1,352,850AT&T Inc. . . . . . . . . . . . . . . . . . . . . . . . . . . . . . . . . . . . . . . . . . . . . . . . . . . 0.80 12/01/15 675,000 673,292AT&T Inc. . . . . . . . . . . . . . . . . . . . . . . . . . . . . . . . . . . . . . . . . . . . . . . . . . . 0.90 02/12/16 1,350,000 1,343,141Southwestern Bell Telephone Co. . . . . . . . . . . . . . . . . . . . . . . . . . . . . . . 7.00 07/01/15 525,000 571,577Verizon Communications, Inc. . . . . . . . . . . . . . . . . . . . . . . . . . . . . . . . . . 1.95 03/28/14 500,000 501,836
Total Utilities 22,650,071
Total Corporate Bonds (Cost $100,393,682) 101,500,170
The accompanying notes are an integral part of these financial statements. Portfolio of Investments 35

P O R T F O L I O O F I N V E S T M E N T S : Short-Term Bond Fund (continued)December 31, 2013
YANKEE BONDS Interest Rate Maturity Date Face Amount Value
(13.2% of portfolio)
Abbey National Treasury Services plc . . . . . . . . . . . . . . . . . . . . . . . . . . . 2.88% 04/25/14 $ 750,000 $ 755,129African Development Bank . . . . . . . . . . . . . . . . . . . . . . . . . . . . . . . . . . . . 6.88 10/15/15 4,825,000 5,265,523BAA Funding Ltd. (b) . . . . . . . . . . . . . . . . . . . . . . . . . . . . . . . . . . . . . . . . . 2.50 06/25/17 275,000 278,632Canadian National Railway Co. . . . . . . . . . . . . . . . . . . . . . . . . . . . . . . . . 7.20 01/02/16 1,390,229 1,530,465CNOOC Finance (2013) Ltd. . . . . . . . . . . . . . . . . . . . . . . . . . . . . . . . . . . 1.13 05/09/16 575,000 572,882Commonwealth Bank of Australia (b) . . . . . . . . . . . . . . . . . . . . . . . . . . . 1.50(a) 03/31/17 800,000 802,531Compagnie de Financement Foncier (b) . . . . . . . . . . . . . . . . . . . . . . . . . 2.25 03/07/14 700,000 702,397Compagnie de Financement Foncier . . . . . . . . . . . . . . . . . . . . . . . . . . . . 0.20(a) 03/22/17 2,100,000 2,032,934Daimler Finance NA LLC (b) . . . . . . . . . . . . . . . . . . . . . . . . . . . . . . . . . . . 0.84(a) 01/09/15 400,000 401,339Daimler Finance NA LLC (b) . . . . . . . . . . . . . . . . . . . . . . . . . . . . . . . . . . . 1.25 01/11/16 1,175,000 1,175,830DEPFA ACS Bank (b) . . . . . . . . . . . . . . . . . . . . . . . . . . . . . . . . . . . . . . . . 4.88 10/28/15 500,000 520,034Dexia Crédit Local (b) . . . . . . . . . . . . . . . . . . . . . . . . . . . . . . . . . . . . . . . . 2.75 01/10/14 925,000 925,416Dexia Crédit Local (b) . . . . . . . . . . . . . . . . . . . . . . . . . . . . . . . . . . . . . . . . 2.75 04/29/14 5,175,000 5,213,968Dexia Crédit Local (b) . . . . . . . . . . . . . . . . . . . . . . . . . . . . . . . . . . . . . . . . 0.72(a) 04/29/14 375,000 375,529Dexia Municipal Agency . . . . . . . . . . . . . . . . . . . . . . . . . . . . . . . . . . . . . . 0.16(a) 06/20/14 900,000 897,135Dexia Municipal Agency . . . . . . . . . . . . . . . . . . . . . . . . . . . . . . . . . . . . . . 5.25 02/16/17 1,100,000 1,219,599Diageo Capital plc . . . . . . . . . . . . . . . . . . . . . . . . . . . . . . . . . . . . . . . . . . . 0.63 04/29/16 1,375,000 1,367,443Eni Coordination Center SA . . . . . . . . . . . . . . . . . . . . . . . . . . . . . . . . . . . 4.80 08/10/15 1,775,000 1,875,286France Telecom . . . . . . . . . . . . . . . . . . . . . . . . . . . . . . . . . . . . . . . . . . . . . 4.38 07/08/14 6,200,000 6,317,155France Telecom . . . . . . . . . . . . . . . . . . . . . . . . . . . . . . . . . . . . . . . . . . . . . 2.13 09/16/15 825,000 840,854GlaxoSmithKline Capital Corp. . . . . . . . . . . . . . . . . . . . . . . . . . . . . . . . . . 0.70 03/18/16 925,000 921,073Hydro-Quebec . . . . . . . . . . . . . . . . . . . . . . . . . . . . . . . . . . . . . . . . . . . . . . 6.27 01/03/26 80,000 93,949Hypothekenbank Frankfurt International SA . . . . . . . . . . . . . . . . . . . . . . 0.37(a) 03/24/14 1,300,000 1,297,329Hypothekenbank Frankfurt International SA . . . . . . . . . . . . . . . . . . . . . . 0.18(a) 07/12/16 930,000 872,038Iberdrola Finance Ireland Ltd. (b) . . . . . . . . . . . . . . . . . . . . . . . . . . . . . . . 3.80 09/11/14 775,000 790,556ING Bank NV (b) . . . . . . . . . . . . . . . . . . . . . . . . . . . . . . . . . . . . . . . . . . . . 2.00 09/25/15 2,625,000 2,668,488International Bank for Reconstruction and Development . . . . . . . . . . . . 0.00(d) 02/15/15 820,000 815,393Korea Development Bank . . . . . . . . . . . . . . . . . . . . . . . . . . . . . . . . . . . . . 8.00 01/23/14 500,000 502,053Mitsubishi Corp. . . . . . . . . . . . . . . . . . . . . . . . . . . . . . . . . . . . . . . . . . . . . . 2.75 09/16/15 300,000 309,270Norsk Hydro ASA . . . . . . . . . . . . . . . . . . . . . . . . . . . . . . . . . . . . . . . . . . . . 9.13 07/15/14 2,125,000 2,222,667RIO Tinto Finance USA plc . . . . . . . . . . . . . . . . . . . . . . . . . . . . . . . . . . . . 0.79(a) 06/19/15 1,975,000 1,979,691Sanofi-Aventis . . . . . . . . . . . . . . . . . . . . . . . . . . . . . . . . . . . . . . . . . . . . . . 1.63 03/28/14 500,000 501,532Santander US Debt SA Unipersonal (b) . . . . . . . . . . . . . . . . . . . . . . . . . 3.72 01/20/15 900,000 917,934Scottish Power Ltd. . . . . . . . . . . . . . . . . . . . . . . . . . . . . . . . . . . . . . . . . . . 5.38 03/15/15 4,675,000 4,899,063Société Générale SCF . . . . . . . . . . . . . . . . . . . . . . . . . . . . . . . . . . . . . . . . 1.66(a) 03/19/14 1,400,000 1,403,491Société Générale SCF . . . . . . . . . . . . . . . . . . . . . . . . . . . . . . . . . . . . . . . . 1.71(a) 06/19/14 1,400,000 1,406,523Statoil ASA . . . . . . . . . . . . . . . . . . . . . . . . . . . . . . . . . . . . . . . . . . . . . . . . . 1.95 11/08/18 325,000 322,225Total Capital . . . . . . . . . . . . . . . . . . . . . . . . . . . . . . . . . . . . . . . . . . . . . . . . 3.00 06/24/15 900,000 932,231Total Capital Canada Ltd. . . . . . . . . . . . . . . . . . . . . . . . . . . . . . . . . . . . . . 1.63 01/28/14 5,075,000 5,079,390Total Capital Canada Ltd. . . . . . . . . . . . . . . . . . . . . . . . . . . . . . . . . . . . . . 0.62(a) 01/15/16 1,175,000 1,181,211Total Capital International SA . . . . . . . . . . . . . . . . . . . . . . . . . . . . . . . . . . 1.00 08/12/16 2,000,000 2,003,374TransCanada PipeLines Ltd. . . . . . . . . . . . . . . . . . . . . . . . . . . . . . . . . . . 0.88 03/02/15 1,000,000 1,002,907TransCanada PipeLines Ltd. . . . . . . . . . . . . . . . . . . . . . . . . . . . . . . . . . . 0.75 01/15/16 3,575,000 3,566,048Vodafone Group plc . . . . . . . . . . . . . . . . . . . . . . . . . . . . . . . . . . . . . . . . . . 0.90 02/19/16 850,000 852,976Vodafone Group plc . . . . . . . . . . . . . . . . . . . . . . . . . . . . . . . . . . . . . . . . . . 0.62(a) 02/19/16 850,000 849,604Volkswagen International Finance NV (b) . . . . . . . . . . . . . . . . . . . . . . . . 1.15 11/20/15 650,000 655,275
Total Yankee Bonds (Cost $70,578,693) 71,116,372
ASSET BACKED SECURITIES(16.2% of portfolio)
Access Group Inc. 01 . . . . . . . . . . . . . . . . . . . . . . . . . . . . . . . . . . . . . . . . 0.60(a) 05/25/29 1,511,087 1,365,998Access Group Inc. 04-A . . . . . . . . . . . . . . . . . . . . . . . . . . . . . . . . . . . . . . 0.50(a) 04/25/29 919,222 902,418Access Group Inc. 05-B . . . . . . . . . . . . . . . . . . . . . . . . . . . . . . . . . . . . . . 0.47(a) 07/25/22 507,931 505,076Ally Master Owner Trust 12-1 . . . . . . . . . . . . . . . . . . . . . . . . . . . . . . . . . . 0.97(a) 02/15/17 2,175,000 2,183,700Ally Master Owner Trust 13-1 . . . . . . . . . . . . . . . . . . . . . . . . . . . . . . . . . . 0.62(a) 02/15/18 925,000 924,009Ally Master Owner Trust 13-1 . . . . . . . . . . . . . . . . . . . . . . . . . . . . . . . . . . 1.00 02/15/18 925,000 924,255American Credit Acceptance Receivable 13-1 (b) . . . . . . . . . . . . . . . . . 1.45 04/16/18 741,573 740,842Axis Equipment Finance Receivables LLC 12-1 (b) . . . . . . . . . . . . . . . . 1.25 03/20/15 27,584 27,625
36 Portfolio of Investments The accompanying notes are an integral part of these financial statements.

P O R T F O L I O O F I N V E S T M E N T S : Short-Term Bond Fund (continued)December 31, 2013
Interest Rate Maturity Date Face Amount Value
(Asset Backed Securities continued)
Axis Equipment Finance Receivables LLC 13-1 (b) . . . . . . . . . . . . . . . . 1.75% 03/20/17 $ 1,360,736 $ 1,367,560Bush Truck Leasing LLC II-A (b) . . . . . . . . . . . . . . . . . . . . . . . . . . . . . . . 5.00 09/25/18 189,289 188,403CCR Inc. MT-100 Payment Rights Master Trust 12-C (b) . . . . . . . . . . . 4.75 07/10/22 1,750,000 1,722,788CIT Marine Trust 99-A . . . . . . . . . . . . . . . . . . . . . . . . . . . . . . . . . . . . . . . . 6.25 11/15/19 61,531 62,266Community Reinvestment Revenue Notes 19 (b) . . . . . . . . . . . . . . . . . 4.68 08/01/35 393,792 386,346CPS Auto Trust 11-A (b) . . . . . . . . . . . . . . . . . . . . . . . . . . . . . . . . . . . . . . 2.82 04/16/18 331,119 334,923CPS Auto Trust 11-B (b) . . . . . . . . . . . . . . . . . . . . . . . . . . . . . . . . . . . . . . 3.68 09/17/18 197,797 201,923CPS Auto Trust 11-C (b) . . . . . . . . . . . . . . . . . . . . . . . . . . . . . . . . . . . . . . 4.21 03/15/19 337,572 345,725CPS Auto Trust 12-A (b) . . . . . . . . . . . . . . . . . . . . . . . . . . . . . . . . . . . . . . 2.78 06/17/19 287,109 289,650CPS Auto Trust 13-A (b) . . . . . . . . . . . . . . . . . . . . . . . . . . . . . . . . . . . . . . 1.31 06/15/20 1,081,355 1,064,168CPS Auto Trust 13-B (b) . . . . . . . . . . . . . . . . . . . . . . . . . . . . . . . . . . . . . . 1.82 09/15/20 1,788,218 1,774,454CPS Auto Trust 13-C (b) . . . . . . . . . . . . . . . . . . . . . . . . . . . . . . . . . . . . . . 1.64 04/16/18 3,167,911 3,170,091CPS Auto Trust 13-D (b) . . . . . . . . . . . . . . . . . . . . . . . . . . . . . . . . . . . . . . 1.54 07/16/18 650,000 649,947Credit Acceptance Auto Loan Trust 12-2 (b) . . . . . . . . . . . . . . . . . . . . . . 2.21 09/15/20 550,000 552,815Edlinc Student Loan Funding Trust 12-A (b) . . . . . . . . . . . . . . . . . . . . . . 3.17(a) 10/01/25 5,437,240 5,413,480First Financial Credit Card Master Note Trust II 10-D (b) . . . . . . . . . . . 3.72 06/17/19 1,725,000 1,732,852First Investors Auto Owner Trust 12-1A (b) . . . . . . . . . . . . . . . . . . . . . . . 1.96 11/15/17 128,523 129,043Flagship Credit Auto Trust 13-2 (b) . . . . . . . . . . . . . . . . . . . . . . . . . . . . . 1.94 01/15/19 1,897,082 1,896,924Ford Credit Floorplan Master Owner Trust 13-5 . . . . . . . . . . . . . . . . . . . 1.50 09/15/18 3,325,000 3,354,483Ford Credit Floorplan Master Owner Trust 13-5 . . . . . . . . . . . . . . . . . . . 0.64(a) 09/15/18 3,325,000 3,333,156FRS I LLC 13-1 (b) . . . . . . . . . . . . . . . . . . . . . . . . . . . . . . . . . . . . . . . . . . 1.80 04/15/43 335,775 333,142HLSS Servicer Advance Receivable 13-T5 (b) . . . . . . . . . . . . . . . . . . . . 1.98 08/15/46 1,375,000 1,375,688HLSS Servicer Advance Receivable 13-T7 (b) . . . . . . . . . . . . . . . . . . . . 1.78 11/15/46 1,300,000 1,297,790KeyCorp Student Loan Trust 00-A . . . . . . . . . . . . . . . . . . . . . . . . . . . . . . 0.56(a) 05/25/29 1,312,256 1,213,083KeyCorp Student Loan Trust 00-B . . . . . . . . . . . . . . . . . . . . . . . . . . . . . . 0.55(a) 07/25/29 1,290,729 1,080,098KeyCorp Student Loan Trust 01-A . . . . . . . . . . . . . . . . . . . . . . . . . . . . . . 0.52(a) 06/27/31 667,133 592,842KeyCorp Student Loan Trust 04-A . . . . . . . . . . . . . . . . . . . . . . . . . . . . . . 0.54(a) 10/28/41 1,767,739 1,738,979KeyCorp Student Loan Trust 04-A . . . . . . . . . . . . . . . . . . . . . . . . . . . . . . 0.67(a) 01/27/43 759,570 663,523KeyCorp Student Loan Trust 05-A . . . . . . . . . . . . . . . . . . . . . . . . . . . . . . 0.48(a) 09/28/26 381,269 379,920KeyCorp Student Loan Trust 05-A . . . . . . . . . . . . . . . . . . . . . . . . . . . . . . 0.65(a) 09/27/40 644,963 554,651KeyCorp Student Loan Trust 06-A . . . . . . . . . . . . . . . . . . . . . . . . . . . . . . 0.44(a) 06/27/29 2,897,608 2,856,184Marriott Vacation Club Owners Trust 08-1A (b) . . . . . . . . . . . . . . . . . . . 7.20 05/20/30 173,644 186,178National Collegiate Student Loan Trust 04-1 . . . . . . . . . . . . . . . . . . . . . 0.51(a) 06/25/27 2,426,081 2,324,537National Collegiate Student Loan Trust 05-1 . . . . . . . . . . . . . . . . . . . . . 0.30(a) 10/26/26 51,407 51,275National Collegiate Student Loan Trust 05-3 . . . . . . . . . . . . . . . . . . . . . 0.40(a) 07/25/28 373,463 363,427National Collegiate Student Loan Trust 06-1 . . . . . . . . . . . . . . . . . . . . . 0.35(a) 05/25/26 423,801 415,051Nationstar Mortgage Advance Receivables Trust 13-T2 (b) . . . . . . . . . 1.68 06/20/46 1,750,000 1,747,340Santander Drive Auto Receivables Trust 11-2 . . . . . . . . . . . . . . . . . . . . 2.66 01/15/16 1,388,570 1,396,021SLC Student Loan Trust 06-A . . . . . . . . . . . . . . . . . . . . . . . . . . . . . . . . . . 0.54(a) 07/15/36 3,275,000 2,998,030SLC Student Loan Trust 06-A . . . . . . . . . . . . . . . . . . . . . . . . . . . . . . . . . . 0.69(a) 07/15/36 6,250,000 5,040,206SLM Student Loan Trust 03-B . . . . . . . . . . . . . . . . . . . . . . . . . . . . . . . . . 0.64(a) 03/15/22 6,413,769 6,273,718SLM Student Loan Trust 04-A . . . . . . . . . . . . . . . . . . . . . . . . . . . . . . . . . 0.44(a) 03/16/20 685,268 678,838SLM Student Loan Trust 04-B . . . . . . . . . . . . . . . . . . . . . . . . . . . . . . . . . 0.44(a) 06/15/21 901,630 890,981SLM Student Loan Trust 04-B . . . . . . . . . . . . . . . . . . . . . . . . . . . . . . . . . 0.57(a) 03/15/24 5,275,000 4,756,926SLM Student Loan Trust 05-A . . . . . . . . . . . . . . . . . . . . . . . . . . . . . . . . . 0.38(a) 12/15/20 69,959 69,640SLM Student Loan Trust 05-A . . . . . . . . . . . . . . . . . . . . . . . . . . . . . . . . . 0.44(a) 06/15/23 3,550,000 3,351,836SLM Student Loan Trust 06-A . . . . . . . . . . . . . . . . . . . . . . . . . . . . . . . . . 0.38(a) 06/15/22 933,147 929,721SLM Student Loan Trust 06-A . . . . . . . . . . . . . . . . . . . . . . . . . . . . . . . . . 0.43(a) 12/15/23 2,050,000 1,975,429SLM Student Loan Trust 06-C . . . . . . . . . . . . . . . . . . . . . . . . . . . . . . . . . 0.37(a) 06/15/21 385,936 385,200SLM Student Loan Trust 07-A . . . . . . . . . . . . . . . . . . . . . . . . . . . . . . . . . 0.36(a) 09/15/25 2,404,486 2,295,144Small Business Administration 02-20K . . . . . . . . . . . . . . . . . . . . . . . . . . 5.08 11/01/22 59,519 64,550Small Business Administration 05-10E . . . . . . . . . . . . . . . . . . . . . . . . . . 4.54 09/01/15 21,439 21,865SNAAC Auto Receivables Trust 13-1 (b) . . . . . . . . . . . . . . . . . . . . . . . . . 1.14 07/16/18 824,965 824,300Tidewater Auto Receivable Trust 12-A (b) . . . . . . . . . . . . . . . . . . . . . . . 1.21 08/15/15 271,405 271,382World Financial Network Credit Card Trust 13-B . . . . . . . . . . . . . . . . . . 0.91 03/16/20 2,075,000 2,061,730
Total Asset Backed Securities (Cost $84,727,507) 87,004,145
The accompanying notes are an integral part of these financial statements. Portfolio of Investments 37

P O R T F O L I O O F I N V E S T M E N T S : Short-Term Bond Fund (continued)December 31, 2013
MORTGAGE BACKED SECURITIES Interest Rate Maturity Date Face Amount Value
(4.7% of portfolio)
ABN Amro Mortgage Corp. 03-9 . . . . . . . . . . . . . . . . . . . . . . . . . . . . . . . 4.52% 08/25/18 $ 263,684 $ 260,600Accredited Mortgage Loan Trust 03-1 . . . . . . . . . . . . . . . . . . . . . . . . . . . 4.33(a) 06/25/33 160,723 139,836ACE Securities Corp. 06-ASL1 . . . . . . . . . . . . . . . . . . . . . . . . . . . . . . . . . 0.45(a) 02/25/36 475,363 172,181ACE Securities Corp. 06-GP1 . . . . . . . . . . . . . . . . . . . . . . . . . . . . . . . . . 0.42(a) 02/25/31 85,775 79,419ACE Securities Corp. 06-SL1 . . . . . . . . . . . . . . . . . . . . . . . . . . . . . . . . . . 0.49(a) 09/25/35 161,616 121,187Adjustable Rate Mortgage Trust 05-10 . . . . . . . . . . . . . . . . . . . . . . . . . . 2.71(a) 01/25/36 118,212 95,858American Business Financial Services 02-1 . . . . . . . . . . . . . . . . . . . . . . 7.01 12/15/32 77,748 61,494American Home Mortgage Investment Trust 05-01 . . . . . . . . . . . . . . . . 2.35(a) 06/25/45 198,817 193,077American Home Mortgage Investment Trust 05-03 . . . . . . . . . . . . . . . . 4.97 09/25/35 29,129 29,043Amresco Residential Securities 98-1 . . . . . . . . . . . . . . . . . . . . . . . . . . . . 7.57 10/25/27 65,741 67,613Banc of America Alternative Loan Trust Inc. 07-2 . . . . . . . . . . . . . . . . . 5.75 06/25/37 174,159 128,394Banc of America Funding Corp. 04-A . . . . . . . . . . . . . . . . . . . . . . . . . . . 5.77(a) 09/20/34 25,693 25,880Banc of America Funding Corp. 05-G . . . . . . . . . . . . . . . . . . . . . . . . . . . 5.16(a) 10/20/35 482,398 467,979Banc of America Funding Corp. 07-5 . . . . . . . . . . . . . . . . . . . . . . . . . . . . 6.50 07/25/37 74,826 78,123Banc of America Mortgage Securities Inc. 02-J . . . . . . . . . . . . . . . . . . . 3.56(a) 09/25/32 3,381 3,378Banc of America Mortgage Securities Inc. 05-1 . . . . . . . . . . . . . . . . . . . 5.00 02/25/20 23,490 24,216Banc of America Mortgage Securities Inc. 05-C . . . . . . . . . . . . . . . . . . . 2.92(a) 04/25/35 52,929 45,664Bayview Financial Acquisition Trust 06-D . . . . . . . . . . . . . . . . . . . . . . . . 5.93 12/28/36 4,450,000 4,265,418Bayview Financial Asset Trust 07-SR1A (b) . . . . . . . . . . . . . . . . . . . . . . 0.61(a) 03/25/37 235,076 156,330Bear Stearns Adjustable Rate Mortgage Trust 04-10 . . . . . . . . . . . . . . 2.70(a) 01/25/35 338,280 335,326Bear Stearns Adjustable Rate Mortgage Trust 05-12 . . . . . . . . . . . . . . 5.38(a) 02/25/36 59,784 55,811Bear Stearns ALT-A Trust 04-11 . . . . . . . . . . . . . . . . . . . . . . . . . . . . . . . 2.76(a) 11/25/34 21,328 18,278Bear Stearns ALT-A Trust 05-4 . . . . . . . . . . . . . . . . . . . . . . . . . . . . . . . . 2.65(a) 05/25/35 131,771 124,386Bear Stearns ALT-A Trust 05-9 . . . . . . . . . . . . . . . . . . . . . . . . . . . . . . . . 5.00(a) 11/25/35 67,332 51,770Bear Stearns ALT-A Trust 06-6 . . . . . . . . . . . . . . . . . . . . . . . . . . . . . . . . 2.67(a) 11/25/36 204,735 149,773Bear Stearns Asset Backed Securities Trust 03-3 . . . . . . . . . . . . . . . . . 0.76(a) 06/25/43 64,327 63,601Bear Stearns Asset Backed Securities Trust 04-HE5 . . . . . . . . . . . . . . 2.04(a) 07/25/34 272,423 227,821Bear Stearns Structured Products Inc., 00-1 (b) . . . . . . . . . . . . . . . . . . . 10.37(a) 08/28/33 4,764 4,300CDC Mortgage Capital Trust 02-HE1 . . . . . . . . . . . . . . . . . . . . . . . . . . . 0.79(a) 01/25/33 417,729 402,928Chase Mortgage Finance Corp. 05-A1 . . . . . . . . . . . . . . . . . . . . . . . . . . 5.01(a) 12/25/35 23,318 23,039Chaseflex Trust 05-2 . . . . . . . . . . . . . . . . . . . . . . . . . . . . . . . . . . . . . . . . . 6.00 06/25/35 131,881 118,424CITICORP Mortgage Securities, Inc. 07-1 . . . . . . . . . . . . . . . . . . . . . . . 5.50 01/25/22 35,844 36,138CITICORP Mortgage Securities, Inc. 07-1 . . . . . . . . . . . . . . . . . . . . . . . 5.89(c) 03/25/37 292,679 287,923Citigroup Mortgage Loan Trust, Inc. 05-7 . . . . . . . . . . . . . . . . . . . . . . . . 2.32(a) 09/25/35 310,218 232,137Cityscape Home Equity Loan Trust 96-2 . . . . . . . . . . . . . . . . . . . . . . . . . 8.10 08/25/26 81,934 81,933CMO Trust 17 . . . . . . . . . . . . . . . . . . . . . . . . . . . . . . . . . . . . . . . . . . . . . . . 7.25 04/20/18 187 192Conseco Finance Securitizations Corp. 01-2 . . . . . . . . . . . . . . . . . . . . . 6.60 02/01/33 177,815 184,509Contimortgage Home Equity Loan Trust 95-2 . . . . . . . . . . . . . . . . . . . . . 8.10 08/15/25 30,701 30,178Countrywide Alternative Loan Trust 04-24CB . . . . . . . . . . . . . . . . . . . . . 6.00 11/25/34 69,643 70,286Countrywide Alternative Loan Trust 05-11CB . . . . . . . . . . . . . . . . . . . . . 5.50 06/25/35 167,087 152,836Countrywide Alternative Loan Trust 05-43 . . . . . . . . . . . . . . . . . . . . . . . 5.07(a) 10/25/35 52,238 42,133Countrywide Asset Backed Certificate 02-S2 . . . . . . . . . . . . . . . . . . . . . 5.98 01/25/17 151,345 151,956Countrywide Asset Backed Certificate 02-S4 . . . . . . . . . . . . . . . . . . . . . 5.22(a) 10/25/17 222,310 222,298Countrywide Asset Backed Certificate 04-S1 . . . . . . . . . . . . . . . . . . . . . 5.12 02/25/35 62,775 64,104Countrywide Asset Backed Certificate 06-S7 . . . . . . . . . . . . . . . . . . . . . 5.71(a) 11/25/35 144,568 136,104Countrywide Asset Backed Certificate 07-S1 . . . . . . . . . . . . . . . . . . . . . 5.69 11/25/36 144,380 141,416Countrywide Home Loans 03-49 . . . . . . . . . . . . . . . . . . . . . . . . . . . . . . . 2.58(a) 12/19/33 40,817 41,427Countrywide Home Loans 03-J13 . . . . . . . . . . . . . . . . . . . . . . . . . . . . . . 5.25 01/25/24 91,402 89,418Countrywide Home Loans 05-HYB8 . . . . . . . . . . . . . . . . . . . . . . . . . . . . 4.44(a) 12/20/35 152,714 130,103Countrywide Home Loans 06-HYB5 . . . . . . . . . . . . . . . . . . . . . . . . . . . . 2.60(a) 09/20/36 75,124 52,978Credit Suisse First Boston Mortgage 03-21 . . . . . . . . . . . . . . . . . . . . . . 4.75 08/25/18 42,540 43,490Credit Suisse First Boston Mortgage 03-AR24 . . . . . . . . . . . . . . . . . . . . 2.57(a) 10/25/33 270,952 257,850Credit Suisse First Boston Mortgage 03-FFA . . . . . . . . . . . . . . . . . . . . . 6.60(a) 02/25/33 121,080 118,712Credit Suisse First Boston Mortgage 04-AR3 . . . . . . . . . . . . . . . . . . . . . 2.59(a) 04/25/34 78,523 79,488Credit Suisse First Boston Mortgage 05-10 . . . . . . . . . . . . . . . . . . . . . . 5.25 11/25/20 100,078 100,993Credit Suisse First Boston Mortgage 06-2 . . . . . . . . . . . . . . . . . . . . . . . . 5.91(a) 07/25/36 1,120,000 107,103DLJ Mortgage Acceptance Corp. 91-3 . . . . . . . . . . . . . . . . . . . . . . . . . . . 1.95(a) 01/25/21 14,778 14,938Encore Credit Receivables Trust 05-3 . . . . . . . . . . . . . . . . . . . . . . . . . . . 5.01(a) 10/25/35 675,000 635,662FHLMC 2419 . . . . . . . . . . . . . . . . . . . . . . . . . . . . . . . . . . . . . . . . . . . . . . . 5.50 03/15/17 3,100 3,301FHLMC 2586 . . . . . . . . . . . . . . . . . . . . . . . . . . . . . . . . . . . . . . . . . . . . . . . 3.50 12/15/32 1,145 1,144
38 Portfolio of Investments The accompanying notes are an integral part of these financial statements.

P O R T F O L I O O F I N V E S T M E N T S : Short-Term Bond Fund (continued)December 31, 2013
Interest Rate Maturity Date Face Amount Value
(Mortgage Backed Securities continued)
FHLMC 2649 . . . . . . . . . . . . . . . . . . . . . . . . . . . . . . . . . . . . . . . . . . . . . . . 4.50% 07/15/18 $ 155,383 $ 164,433FHLMC 780754 . . . . . . . . . . . . . . . . . . . . . . . . . . . . . . . . . . . . . . . . . . . . . 2.38(a) 08/01/33 5,798 6,160First Alliance Mortgage Loan Trust 94-1 . . . . . . . . . . . . . . . . . . . . . . . . . 5.85 04/25/25 18,164 18,231First Alliance Mortgage Loan Trust 94-2 . . . . . . . . . . . . . . . . . . . . . . . . . 7.63 07/25/25 13,795 14,204First Horizon Mortgage Alternative Mortgage Securities 04-AA3 . . . . . 2.19(a) 09/25/34 35,274 34,341First Horizon Mortgage Pass-Through Trust 05-AR2 . . . . . . . . . . . . . . . 2.69(a) 05/25/35 161,718 147,829FNMA 03-38 . . . . . . . . . . . . . . . . . . . . . . . . . . . . . . . . . . . . . . . . . . . . . . . . 5.00 03/25/23 23,638 24,799FNMA 03-86 . . . . . . . . . . . . . . . . . . . . . . . . . . . . . . . . . . . . . . . . . . . . . . . . 4.50 09/25/18 127,670 135,124FNMA 813842 . . . . . . . . . . . . . . . . . . . . . . . . . . . . . . . . . . . . . . . . . . . . . . 1.83(a) 01/01/35 25,898 27,293GMAC Mortgage Corp. Loan Trust 06-HE3 . . . . . . . . . . . . . . . . . . . . . . 5.75 10/25/36 57,305 55,615GMAC Mortgage Corp. Loan Trust 07-HE1 . . . . . . . . . . . . . . . . . . . . . . 5.95 08/25/37 1,100,000 945,338GNMA 02-15 . . . . . . . . . . . . . . . . . . . . . . . . . . . . . . . . . . . . . . . . . . . . . . . 5.50 11/20/31 12,263 12,709GNMA 03-11 . . . . . . . . . . . . . . . . . . . . . . . . . . . . . . . . . . . . . . . . . . . . . . . 4.00 10/17/29 135,385 142,522GNMA 03-12 . . . . . . . . . . . . . . . . . . . . . . . . . . . . . . . . . . . . . . . . . . . . . . . 4.50 02/20/32 17,508 18,040GNMA 03-26 . . . . . . . . . . . . . . . . . . . . . . . . . . . . . . . . . . . . . . . . . . . . . . . 0.62(a) 04/16/33 17,384 17,515GNMA 04-17 . . . . . . . . . . . . . . . . . . . . . . . . . . . . . . . . . . . . . . . . . . . . . . . 4.50 12/20/33 30,301 32,272GNMA 583189 . . . . . . . . . . . . . . . . . . . . . . . . . . . . . . . . . . . . . . . . . . . . . . 4.50 02/20/17 11,878 12,647Green Tree Financial Corp. 98-5 . . . . . . . . . . . . . . . . . . . . . . . . . . . . . . . 6.22 03/01/30 134,652 143,455GS Mortgage Loan Trust 03-10 . . . . . . . . . . . . . . . . . . . . . . . . . . . . . . . . 2.36(a) 10/25/33 125,783 123,390GS Mortgage Loan Trust 05-8F . . . . . . . . . . . . . . . . . . . . . . . . . . . . . . . . 5.50 10/25/20 45,994 47,275GS Mortgage Loan Trust 05-AR3 . . . . . . . . . . . . . . . . . . . . . . . . . . . . . . . 2.87(a) 05/25/35 93,234 84,526GS Mortgage Loan Trust 05-AR6 . . . . . . . . . . . . . . . . . . . . . . . . . . . . . . . 2.66(a) 09/25/35 68,767 67,711Home Equity Mortgage Trust 06-1 . . . . . . . . . . . . . . . . . . . . . . . . . . . . . . 5.80(a) 05/25/36 1,224,142 1,063,427Home Savings of America 9 . . . . . . . . . . . . . . . . . . . . . . . . . . . . . . . . . . . 3.79(a) 11/25/17 76,982 77,947Home Savings of America 11 . . . . . . . . . . . . . . . . . . . . . . . . . . . . . . . . . . 4.83(a) 01/25/18 87,496 88,498Household Home Equity Loan Trust 06-2 . . . . . . . . . . . . . . . . . . . . . . . . 0.32(a) 03/20/36 845,881 826,533IMPAC Secured Assets Corp. 03-3 . . . . . . . . . . . . . . . . . . . . . . . . . . . . . 4.80(a) 08/25/33 171,998 175,809Indymac Indx Mortgage Loan Trust 04-AR6 . . . . . . . . . . . . . . . . . . . . . . 2.57(a) 10/25/34 11,678 10,984Indymac Indx Mortgage Loan Trust 05-AR15 . . . . . . . . . . . . . . . . . . . . . 4.64(a) 09/25/35 45,309 39,755Indymac Residential Mortgage-Backed Trust 05-L1 (g) . . . . . . . . . . . . . 0.57(a) 07/25/13 265,489 91,606JP Morgan Mortgage Trust 05-A2 . . . . . . . . . . . . . . . . . . . . . . . . . . . . . . 5.03(a) 04/25/35 269,392 265,549Lehman ABS Manufactured Housing Contract 01-B . . . . . . . . . . . . . . . 4.35 04/15/40 83,769 85,989Long Beach Mortgage Loan Trust 05-3 . . . . . . . . . . . . . . . . . . . . . . . . . . 0.45(a) 08/25/45 21,014 20,958Master Adjustable Rate Mortgages Trust 04-13 . . . . . . . . . . . . . . . . . . . 2.64(a) 04/21/34 31,936 32,709Master Adjustable Rate Mortgages Trust 05-1 . . . . . . . . . . . . . . . . . . . . 5.28(a) 01/25/35 38,451 38,620Master Alternative Loans Trust 03-5 . . . . . . . . . . . . . . . . . . . . . . . . . . . . 6.00 08/25/33 62,496 64,636Master Asset Backed Securities Trust 07-NCW (b) . . . . . . . . . . . . . . . . 0.47(a) 05/25/37 577,752 504,299Master Asset Securitization Trust 03-6 . . . . . . . . . . . . . . . . . . . . . . . . . . 5.00 07/25/18 10,703 11,153Master Asset Securitization Trust 07-1 . . . . . . . . . . . . . . . . . . . . . . . . . . 6.00 10/25/22 43,457 42,654Merrill Lynch Mortgage Investors Trust 03-A2 . . . . . . . . . . . . . . . . . . . . 1.85(a) 02/25/33 44,504 44,272Merrill Lynch Mortgage Investors Trust 06-SL1 . . . . . . . . . . . . . . . . . . . 0.53(a) 09/25/36 304,058 281,746Morgan Stanley Capital Inc. 04-1 . . . . . . . . . . . . . . . . . . . . . . . . . . . . . . . 5.00 11/25/18 82,628 83,688Morgan Stanley Mortgage Loan Trust 05-5AR . . . . . . . . . . . . . . . . . . . . 5.21(a) 09/25/35 46,416 36,046Morgan Stanley Mortgage Loan Trust 06-1AR . . . . . . . . . . . . . . . . . . . . 2.85(a) 02/25/36 132,763 99,607Morgan Stanley Mortgage Loan Trust 07-10XS . . . . . . . . . . . . . . . . . . . 6.00 07/25/47 611,578 207,077New Century Home Equity Loan Trust 97-NC5 . . . . . . . . . . . . . . . . . . . 7.20(a) 10/25/28 48 48Nomura Asset Acceptance Corporation 06-AF2 . . . . . . . . . . . . . . . . . . . 0.27(a) 08/25/36 187,597 85,503Nomura Asset Acceptance Corporation 07-1 . . . . . . . . . . . . . . . . . . . . . 5.96 03/25/47 233,505 233,264Oakwood Mortgage Investors, Inc. 99-D . . . . . . . . . . . . . . . . . . . . . . . . . 7.84 11/15/29 304,037 295,962Oakwood Mortgage Investors, Inc. 02-A . . . . . . . . . . . . . . . . . . . . . . . . . 0.42(a) 09/15/14 158,110 138,076Option One Mortgage Loan Trust 07-FXD1 . . . . . . . . . . . . . . . . . . . . . . 5.60 01/25/37 87,329 86,941Option One Mortgage Loan Trust 07-FXD2 . . . . . . . . . . . . . . . . . . . . . . 5.90 03/25/37 19,938 19,291Ownit Mortgage Loan Asset Backed Certificate 05-5 . . . . . . . . . . . . . . . 0.46(a) 10/25/36 283,047 270,056Prime Mortgage Trust 05-2 . . . . . . . . . . . . . . . . . . . . . . . . . . . . . . . . . . . . 5.00 07/25/20 50,280 50,847Residential Accredit Loans, Inc. 02-QS9 . . . . . . . . . . . . . . . . . . . . . . . . . 0.77(a) 07/25/32 4,849 4,561Residential Accredit Loans, Inc. 05-QS5 . . . . . . . . . . . . . . . . . . . . . . . . . 5.70 04/25/35 42,251 38,808Residential Accredit Loans, Inc. 06-QS4 . . . . . . . . . . . . . . . . . . . . . . . . . 6.00 04/25/36 365,876 282,720Residential Asset Mortgage Products Inc. 02-RS5 . . . . . . . . . . . . . . . . . 4.75 09/25/32 164,211 158,808Residential Asset Mortgage Products Inc. 03-RZ3 . . . . . . . . . . . . . . . . . 4.62 06/25/33 104,554 99,850Residential Asset Securitization Trust 04-A3 . . . . . . . . . . . . . . . . . . . . . 5.25 06/25/34 58,939 59,257
The accompanying notes are an integral part of these financial statements. Portfolio of Investments 39

P O R T F O L I O O F I N V E S T M E N T S : Short-Term Bond Fund (continued)December 31, 2013
Interest Rate Maturity Date Face Amount Value
(Mortgage Backed Securities continued)
Residential Asset Securitization Trust 05-A14 . . . . . . . . . . . . . . . . . . . . 5.50% 12/25/35 $ 173,445 $ 148,201Residential Funding Mortgage Securities 00-HI5 . . . . . . . . . . . . . . . . . . 7.98 12/25/25 326,409 303,606Residential Funding Mortgage Securities 03-HS2 . . . . . . . . . . . . . . . . . 3.88 07/25/33 7,207 7,182Residential Funding Mortgage Securities I 03-S15 . . . . . . . . . . . . . . . . 4.50 08/25/18 29,903 30,603Residential Funding Mortgage Securities I 05-SA2 . . . . . . . . . . . . . . . . 2.80(a) 06/25/35 39,822 31,771Residential Funding Mortgage Securities I 06-SA1 . . . . . . . . . . . . . . . . 3.88(a) 02/25/36 40,663 34,609Ryland Acceptance Corp. 64 E . . . . . . . . . . . . . . . . . . . . . . . . . . . . . . . . 3.50(a) 04/01/18 25,414 25,561SACO I Trust 05-6 . . . . . . . . . . . . . . . . . . . . . . . . . . . . . . . . . . . . . . . . . . . 0.75(a) 09/25/35 264,960 260,677Salomon Brothers Mortgage Securities 97-LB6 . . . . . . . . . . . . . . . . . . . 6.82 12/25/27 12 12Structured Adjustable Rate Mortgage Loan Trust 04-3AC . . . . . . . . . . 2.37(a) 03/25/34 23,928 23,569Structured Adjustable Rate Mortgage Loan Trust 04-4 . . . . . . . . . . . . . 4.70(a) 04/25/34 782,281 753,477Structured Adjustable Rate Mortgage Loan Trust 04-11 . . . . . . . . . . . . 2.52(a) 08/25/34 46,997 46,116Structured Adjustable Rate Mortgage Loan Trust 04-18 . . . . . . . . . . . . 2.50(a) 12/25/34 89,676 47,742Structured Adjustable Rate Mortgage Loan Trust 05-11 . . . . . . . . . . . . 2.54(a) 05/25/35 377,443 346,646Structured Adjustable Rate Mortgage Loan Trust 06-1 . . . . . . . . . . . . . 2.49(a) 02/25/36 32,606 28,038Structured Adjustable Rate Mortgage Loan Trust 06-4 . . . . . . . . . . . . . 4.95(a) 05/25/36 102,023 77,617Structured Adjustable Rate Mortgage Loan Trust 06-4 . . . . . . . . . . . . . 5.48(a) 05/25/36 97,578 80,963Structured Asset Mortgage Investments 04-AR5 . . . . . . . . . . . . . . . . . . 2.18(a) 10/19/34 31,594 30,635Structured Asset Securities Corp. 98-RF1 (b) . . . . . . . . . . . . . . . . . . . . . 7.20(a) 04/15/27 34,047 34,629Structured Asset Securities Corp. 03-37A . . . . . . . . . . . . . . . . . . . . . . . . 2.48(a) 12/25/33 212,914 208,484Structured Asset Securities Corp. 04-3 . . . . . . . . . . . . . . . . . . . . . . . . . . 5.29(a) 03/25/24 151,987 157,079Terwin Mortgage Trust 04-5HE . . . . . . . . . . . . . . . . . . . . . . . . . . . . . . . . 1.05(a) 06/25/35 471,910 442,664Vanderbilt Mortgage & Finance 03-A . . . . . . . . . . . . . . . . . . . . . . . . . . . . 0.82(a) 05/07/26 249,647 241,566Vericrest Opportunity Loan Trust 13-3 (b) . . . . . . . . . . . . . . . . . . . . . . . . 3.22 05/27/53 747,944 745,140Wachovia Mortgage Loan Trust 06-A . . . . . . . . . . . . . . . . . . . . . . . . . . . 2.66(a) 05/20/36 156,126 153,027Washington Mutual Mortgage Securities Corp. 04-AR3 . . . . . . . . . . . . 2.45(a) 06/25/34 60,055 60,355Washington Mutual Mortgage Securities Corp. 04-AR14 . . . . . . . . . . . 2.40(a) 01/25/35 109,773 109,168Washington Mutual MSC Mortgage Pass-Through
Certificates 03-MS2 . . . . . . . . . . . . . . . . . . . . . . . . . . . . . . . . . . . . . . . 5.00 03/25/18 30,932 31,522Wells Fargo Mortgage Backed Securities Trust 04-B . . . . . . . . . . . . . . . 4.47(a) 02/25/34 17,656 17,607Wells Fargo Mortgage Backed Securities Trust 04-BB . . . . . . . . . . . . . 2.62(a) 01/25/35 926 926Wells Fargo Mortgage Backed Securities Trust 04-E . . . . . . . . . . . . . . . 4.90(a) 05/25/34 26,799 26,777Wells Fargo Mortgage Backed Securities Trust 04-EE . . . . . . . . . . . . . 2.70(a) 12/25/34 21,685 21,766Wells Fargo Mortgage Backed Securities Trust 04-F . . . . . . . . . . . . . . . 4.66(a) 06/25/34 94,142 95,406Wells Fargo Mortgage Backed Securities Trust 04-I . . . . . . . . . . . . . . . 2.65(a) 07/25/34 4,876 4,871Wells Fargo Mortgage Backed Securities Trust 04-K . . . . . . . . . . . . . . . 2.62(a) 07/25/34 100,313 100,301Wells Fargo Mortgage Backed Securities Trust 04-K . . . . . . . . . . . . . . . 4.74(a) 07/25/34 45,958 46,144Wells Fargo Mortgage Backed Securities Trust 04-K . . . . . . . . . . . . . . . 4.74(a) 07/25/34 54,586 54,713Wells Fargo Mortgage Backed Securities Trust 04-R . . . . . . . . . . . . . . 2.62(a) 09/25/34 60,671 61,706Wells Fargo Mortgage Backed Securities Trust 05-AR14 . . . . . . . . . . . 5.33(a) 08/25/35 29,517 30,190Wells Fargo Mortgage Backed Securities Trust 05-AR15 . . . . . . . . . . . 2.62(a) 09/25/35 224,375 221,814Wells Fargo Mortgage Backed Securities Trust 05-AR16 . . . . . . . . . . . 5.16(a) 10/25/35 52,669 51,333Wells Fargo Mortgage Backed Securities Trust 06-AR4 . . . . . . . . . . . . 5.57(a) 04/25/36 43,708 42,116Wells Fargo Mortgage Backed Securities Trust 06-AR19 . . . . . . . . . . . 5.37(a) 12/25/36 26,665 26,164
Total Mortgage Backed Securities (Cost $26,481,188) 25,057,373
MUNICIPAL BONDS(24.7% of portfolio)
Alaska Housing Finance Corp. . . . . . . . . . . . . . . . . . . . . . . . . . . . . . . . . . 2.80 12/01/26 515,000 505,246Alaska Housing Finance Corp. . . . . . . . . . . . . . . . . . . . . . . . . . . . . . . . . . 0.97(a) 06/01/43 5,150,000 5,148,919Alaska Student Loan Corp. . . . . . . . . . . . . . . . . . . . . . . . . . . . . . . . . . . . . 0.67(a) 08/25/31 1,382,166 1,362,429Art Institute of Chicago . . . . . . . . . . . . . . . . . . . . . . . . . . . . . . . . . . . . . . . 1.34 03/01/15 125,000 123,491Atlantic City NJ . . . . . . . . . . . . . . . . . . . . . . . . . . . . . . . . . . . . . . . . . . . . . . 4.00 11/01/16 400,000 427,348Austin TX . . . . . . . . . . . . . . . . . . . . . . . . . . . . . . . . . . . . . . . . . . . . . . . . . . 1.58 09/01/17 3,250,000 3,254,258California, State of . . . . . . . . . . . . . . . . . . . . . . . . . . . . . . . . . . . . . . . . . . . 1.05 02/01/16 925,000 927,470Camden County NJ Improvement Authority . . . . . . . . . . . . . . . . . . . . . . 0.80 07/16/14 1,750,000 1,748,320Casino Reinvestment Development Authority NJ . . . . . . . . . . . . . . . . . . 5.14 06/01/15 725,000 729,495Colorado State Department of Corrections . . . . . . . . . . . . . . . . . . . . . . . 2.26 09/01/17 3,375,000 3,394,845
40 Portfolio of Investments The accompanying notes are an integral part of these financial statements.

P O R T F O L I O O F I N V E S T M E N T S : Short-Term Bond Fund (continued)December 31, 2013
Interest Rate Maturity Date Face Amount Value
(Municipal Bonds continued)
Cuyahoga County Ohio Economic Development . . . . . . . . . . . . . . . . . . 3.22% 12/01/14 $ 1,725,000 $ 1,761,708Desert Sands California Unified School District . . . . . . . . . . . . . . . . . . . 2.28 06/01/19 375,000 355,553Downtown Smyrna Development Authority GA . . . . . . . . . . . . . . . . . . . 3.21 02/01/15 100,000 101,961Energy Northwest, WA . . . . . . . . . . . . . . . . . . . . . . . . . . . . . . . . . . . . . . . 1.06 07/01/15 350,000 351,001Energy Northwest, WA . . . . . . . . . . . . . . . . . . . . . . . . . . . . . . . . . . . . . . . 2.15 07/01/18 850,000 847,952Florida Hurricane Catastrophe Fund Finance Corp. . . . . . . . . . . . . . . . . 1.30 07/01/16 1,750,000 1,752,013Illinois Housing Development Authority . . . . . . . . . . . . . . . . . . . . . . . . . . 5.50 12/01/14 95,000 96,261Illinois Housing Development Authority . . . . . . . . . . . . . . . . . . . . . . . . . . 1.14 01/01/16 375,000 371,539Illinois Municipal Electric Agency . . . . . . . . . . . . . . . . . . . . . . . . . . . . . . . 3.20 02/01/14 890,000 891,282Illinois, State of . . . . . . . . . . . . . . . . . . . . . . . . . . . . . . . . . . . . . . . . . . . . . . 2.00 01/01/14 3,025,000 3,025,000Illinois, State of . . . . . . . . . . . . . . . . . . . . . . . . . . . . . . . . . . . . . . . . . . . . . . 4.03 03/01/14 825,000 829,150Illinois, State of . . . . . . . . . . . . . . . . . . . . . . . . . . . . . . . . . . . . . . . . . . . . . . 1.10 04/01/14 2,650,000 2,650,954Illinois, State of . . . . . . . . . . . . . . . . . . . . . . . . . . . . . . . . . . . . . . . . . . . . . . 4.51 03/01/15 1,645,000 1,704,681Illinois, State of Sales Tax Revenue . . . . . . . . . . . . . . . . . . . . . . . . . . . . 1.36 06/15/16 2,200,000 2,198,416Indiana Bond Bank . . . . . . . . . . . . . . . . . . . . . . . . . . . . . . . . . . . . . . . . . . 1.48 01/15/17 1,285,000 1,283,175Indiana Bond Bank . . . . . . . . . . . . . . . . . . . . . . . . . . . . . . . . . . . . . . . . . . 2.08 01/15/19 300,000 293,202Indianapolis, Indiana Local Public Improvement Bond Bank . . . . . . . . . 1.19 06/01/15 325,000 325,059Indianapolis, Indiana Local Public Improvement Bond Bank . . . . . . . . . 1.58 06/01/16 600,000 597,090Irvine Ranch Water District California Joint Powers Agency . . . . . . . . . 2.61 03/15/14 500,000 502,225Jackson Tennessee Energy Authority . . . . . . . . . . . . . . . . . . . . . . . . . . . 1.15 04/01/16 400,000 395,872Jersey City, NJ . . . . . . . . . . . . . . . . . . . . . . . . . . . . . . . . . . . . . . . . . . . . . . 1.51 09/01/16 950,000 943,578Jobsohio Beverage System, OH . . . . . . . . . . . . . . . . . . . . . . . . . . . . . . . 1.57 01/01/17 925,000 919,358Kentucky Asset/Liability Commission . . . . . . . . . . . . . . . . . . . . . . . . . . . . 2.94 04/01/14 955,000 960,482Lehigh County Authority PA . . . . . . . . . . . . . . . . . . . . . . . . . . . . . . . . . . . 3.44 12/01/18 3,825,000 3,763,303Louisa Virginia Industrial Development Authority . . . . . . . . . . . . . . . . . . 2.50(a) 09/01/30 2,635,000 2,645,145Louisiana State Gas & Fuels Tax . . . . . . . . . . . . . . . . . . . . . . . . . . . . . . . 3.00(a) 05/01/43 550,000 551,166Louisiana State Local Government Environmental Facilities &
Community Development Authority . . . . . . . . . . . . . . . . . . . . . . . . . . 1.11 02/01/16 99,215 99,269Massachusetts Housing Finance Agency . . . . . . . . . . . . . . . . . . . . . . . . 1.17 12/01/15 425,000 424,333Massachusetts Housing Finance Agency . . . . . . . . . . . . . . . . . . . . . . . . 1.31 06/01/16 275,000 272,385Massachusetts Municipal Wholesale Electric Company . . . . . . . . . . . . 0.12(a) 07/01/14 75,000 74,251Miami Dade County Florida Educational Facilities Authority . . . . . . . . . 1.29 04/01/15 325,000 324,369Monroe County Michigan Economic Development Corp. . . . . . . . . . . . 2.35(a) 10/01/24 1,000,000 1,003,450New Jersey Economic Development Authority . . . . . . . . . . . . . . . . . . . . 3.61 09/01/14 650,000 663,780New Jersey Economic Development Authority . . . . . . . . . . . . . . . . . . . . 0.00(d) 02/15/16 6,675,000 6,418,079New Jersey Economic Development Authority . . . . . . . . . . . . . . . . . . . . 1.06 03/01/16 1,400,000 1,388,688New Jersey Economic Development Authority . . . . . . . . . . . . . . . . . . . . 0.00(d) 02/15/17 950,000 881,115New Jersey Economic Development Authority . . . . . . . . . . . . . . . . . . . . 0.00(d) 02/15/18 1,000,000 881,120New Jersey Economic Development Authority . . . . . . . . . . . . . . . . . . . . 0.00(d) 02/15/20 10,450,000 8,166,779New Orleans Louisiana . . . . . . . . . . . . . . . . . . . . . . . . . . . . . . . . . . . . . . . 2.12 09/01/17 825,000 811,610New Orleans Louisiana . . . . . . . . . . . . . . . . . . . . . . . . . . . . . . . . . . . . . . . 2.80 09/01/19 1,725,000 1,664,280New York City, NY Transitional Finance Authority . . . . . . . . . . . . . . . . . 1.80 08/01/18 1,475,000 1,446,060New York City, NY Transitional Finance Authority . . . . . . . . . . . . . . . . . 1.85 05/01/19 2,025,000 1,947,847New York City, NY Transitional Finance Authority . . . . . . . . . . . . . . . . . 2.75 11/01/20 2,695,000 2,628,110North Carolina Housing Finance Agency . . . . . . . . . . . . . . . . . . . . . . . . 4.00 01/01/30 2,025,000 1,977,048North Carolina State Education Assistance Authority . . . . . . . . . . . . . . 0.96(a) 07/25/39 1,153,376 1,154,748Oakland California Redevelopment Agency . . . . . . . . . . . . . . . . . . . . . . 7.25 09/01/15 400,000 418,692Oklahoma Student Loan Authority . . . . . . . . . . . . . . . . . . . . . . . . . . . . . . 0.69(a) 02/25/32 1,280,037 1,268,005Oregon School Boards Association . . . . . . . . . . . . . . . . . . . . . . . . . . . . . 0.00(d) 06/30/15 4,050,000 3,979,530Orleans Parish School Board, Louisiana . . . . . . . . . . . . . . . . . . . . . . . . . 1.85 02/01/14 750,000 750,270Pasadena California Pension Obligation . . . . . . . . . . . . . . . . . . . . . . . . . 1.76(a) 05/15/41 800,000 802,336Pennsylvania Higher Education Assistance Agency (b) . . . . . . . . . . . . 0.71(a) 05/25/27 500,789 498,786Philadelphia Pennsylvania Authority for Industrial Development . . . . . 0.00(d) 04/15/14 785,000 779,850Philadelphia Pennsylvania Authority for Industrial Development . . . . . 0.00(d) 04/15/15 4,075,000 3,942,114Philadelphia Pennsylvania Authority for Industrial Development . . . . . 0.00(d) 04/15/20 5,285,000 3,921,787Puerto Rico, Commonwealth of . . . . . . . . . . . . . . . . . . . . . . . . . . . . . . . . 5.00 07/01/14 1,275,000 1,280,368Puerto Rico, Commonwealth of . . . . . . . . . . . . . . . . . . . . . . . . . . . . . . . . 5.00 07/01/15 1,325,000 1,337,521Puerto Rico, Commonwealth of . . . . . . . . . . . . . . . . . . . . . . . . . . . . . . . . 5.50 07/01/16 750,000 767,332Puerto Rico Highway & Transportation Authority . . . . . . . . . . . . . . . . . . 5.50 07/01/16 875,000 895,221Puerto Rico Highway & Transportation Authority . . . . . . . . . . . . . . . . . . 6.25 07/01/21 2,400,000 2,509,224
The accompanying notes are an integral part of these financial statements. Portfolio of Investments 41
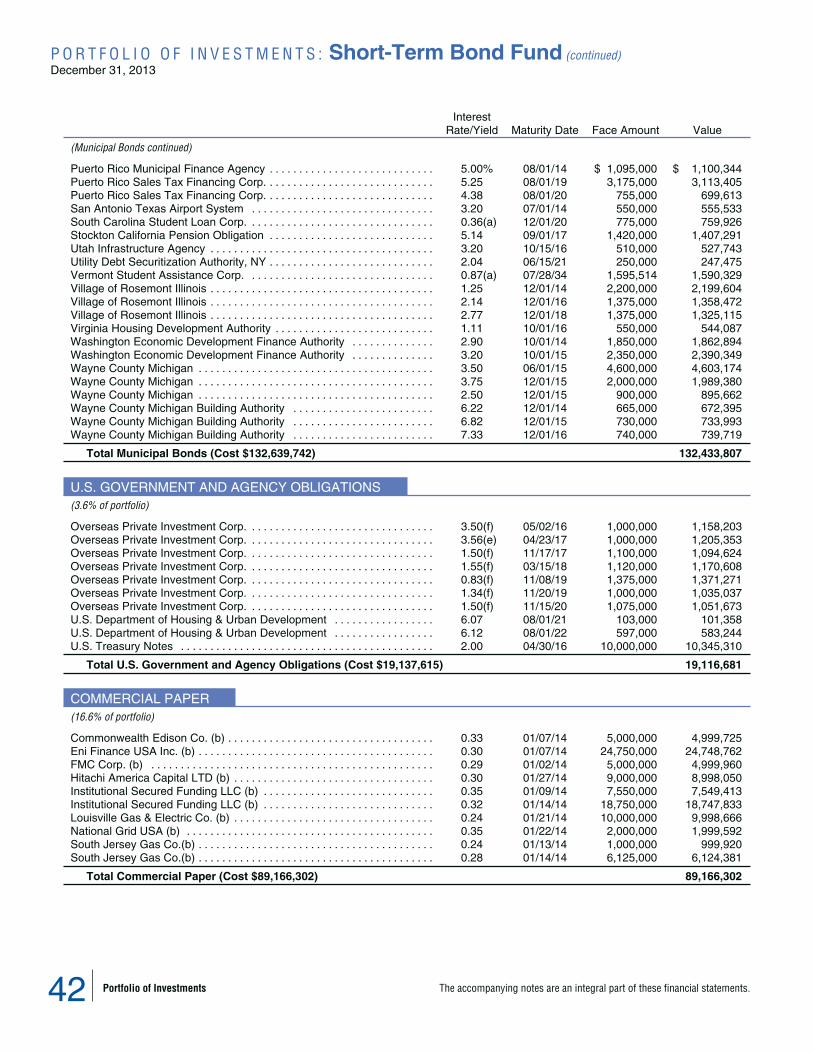
P O R T F O L I O O F I N V E S T M E N T S : Short-Term Bond Fund (continued)December 31, 2013
InterestRate/Yield Maturity Date Face Amount Value
(Municipal Bonds continued)
Puerto Rico Municipal Finance Agency . . . . . . . . . . . . . . . . . . . . . . . . . . . . 5.00% 08/01/14 $ 1,095,000 $ 1,100,344Puerto Rico Sales Tax Financing Corp. . . . . . . . . . . . . . . . . . . . . . . . . . . . . 5.25 08/01/19 3,175,000 3,113,405Puerto Rico Sales Tax Financing Corp. . . . . . . . . . . . . . . . . . . . . . . . . . . . . 4.38 08/01/20 755,000 699,613San Antonio Texas Airport System . . . . . . . . . . . . . . . . . . . . . . . . . . . . . . . 3.20 07/01/14 550,000 555,533South Carolina Student Loan Corp. . . . . . . . . . . . . . . . . . . . . . . . . . . . . . . . 0.36(a) 12/01/20 775,000 759,926Stockton California Pension Obligation . . . . . . . . . . . . . . . . . . . . . . . . . . . . 5.14 09/01/17 1,420,000 1,407,291Utah Infrastructure Agency . . . . . . . . . . . . . . . . . . . . . . . . . . . . . . . . . . . . . . 3.20 10/15/16 510,000 527,743Utility Debt Securitization Authority, NY . . . . . . . . . . . . . . . . . . . . . . . . . . . . 2.04 06/15/21 250,000 247,475Vermont Student Assistance Corp. . . . . . . . . . . . . . . . . . . . . . . . . . . . . . . . 0.87(a) 07/28/34 1,595,514 1,590,329Village of Rosemont Illinois . . . . . . . . . . . . . . . . . . . . . . . . . . . . . . . . . . . . . . 1.25 12/01/14 2,200,000 2,199,604Village of Rosemont Illinois . . . . . . . . . . . . . . . . . . . . . . . . . . . . . . . . . . . . . . 2.14 12/01/16 1,375,000 1,358,472Village of Rosemont Illinois . . . . . . . . . . . . . . . . . . . . . . . . . . . . . . . . . . . . . . 2.77 12/01/18 1,375,000 1,325,115Virginia Housing Development Authority . . . . . . . . . . . . . . . . . . . . . . . . . . . 1.11 10/01/16 550,000 544,087Washington Economic Development Finance Authority . . . . . . . . . . . . . . 2.90 10/01/14 1,850,000 1,862,894Washington Economic Development Finance Authority . . . . . . . . . . . . . . 3.20 10/01/15 2,350,000 2,390,349Wayne County Michigan . . . . . . . . . . . . . . . . . . . . . . . . . . . . . . . . . . . . . . . . 3.50 06/01/15 4,600,000 4,603,174Wayne County Michigan . . . . . . . . . . . . . . . . . . . . . . . . . . . . . . . . . . . . . . . . 3.75 12/01/15 2,000,000 1,989,380Wayne County Michigan . . . . . . . . . . . . . . . . . . . . . . . . . . . . . . . . . . . . . . . . 2.50 12/01/15 900,000 895,662Wayne County Michigan Building Authority . . . . . . . . . . . . . . . . . . . . . . . . 6.22 12/01/14 665,000 672,395Wayne County Michigan Building Authority . . . . . . . . . . . . . . . . . . . . . . . . 6.82 12/01/15 730,000 733,993Wayne County Michigan Building Authority . . . . . . . . . . . . . . . . . . . . . . . . 7.33 12/01/16 740,000 739,719
Total Municipal Bonds (Cost $132,639,742) 132,433,807
U.S. GOVERNMENT AND AGENCY OBLIGATIONS(3.6% of portfolio)
Overseas Private Investment Corp. . . . . . . . . . . . . . . . . . . . . . . . . . . . . . . . 3.50(f) 05/02/16 1,000,000 1,158,203Overseas Private Investment Corp. . . . . . . . . . . . . . . . . . . . . . . . . . . . . . . . 3.56(e) 04/23/17 1,000,000 1,205,353Overseas Private Investment Corp. . . . . . . . . . . . . . . . . . . . . . . . . . . . . . . . 1.50(f) 11/17/17 1,100,000 1,094,624Overseas Private Investment Corp. . . . . . . . . . . . . . . . . . . . . . . . . . . . . . . . 1.55(f) 03/15/18 1,120,000 1,170,608Overseas Private Investment Corp. . . . . . . . . . . . . . . . . . . . . . . . . . . . . . . . 0.83(f) 11/08/19 1,375,000 1,371,271Overseas Private Investment Corp. . . . . . . . . . . . . . . . . . . . . . . . . . . . . . . . 1.34(f) 11/20/19 1,000,000 1,035,037Overseas Private Investment Corp. . . . . . . . . . . . . . . . . . . . . . . . . . . . . . . . 1.50(f) 11/15/20 1,075,000 1,051,673U.S. Department of Housing & Urban Development . . . . . . . . . . . . . . . . . 6.07 08/01/21 103,000 101,358U.S. Department of Housing & Urban Development . . . . . . . . . . . . . . . . . 6.12 08/01/22 597,000 583,244U.S. Treasury Notes . . . . . . . . . . . . . . . . . . . . . . . . . . . . . . . . . . . . . . . . . . . 2.00 04/30/16 10,000,000 10,345,310
Total U.S. Government and Agency Obligations (Cost $19,137,615) 19,116,681
COMMERCIAL PAPER(16.6% of portfolio)
Commonwealth Edison Co. (b) . . . . . . . . . . . . . . . . . . . . . . . . . . . . . . . . . . . 0.33 01/07/14 5,000,000 4,999,725Eni Finance USA Inc. (b) . . . . . . . . . . . . . . . . . . . . . . . . . . . . . . . . . . . . . . . . 0.30 01/07/14 24,750,000 24,748,762FMC Corp. (b) . . . . . . . . . . . . . . . . . . . . . . . . . . . . . . . . . . . . . . . . . . . . . . . . 0.29 01/02/14 5,000,000 4,999,960Hitachi America Capital LTD (b) . . . . . . . . . . . . . . . . . . . . . . . . . . . . . . . . . . 0.30 01/27/14 9,000,000 8,998,050Institutional Secured Funding LLC (b) . . . . . . . . . . . . . . . . . . . . . . . . . . . . . 0.35 01/09/14 7,550,000 7,549,413Institutional Secured Funding LLC (b) . . . . . . . . . . . . . . . . . . . . . . . . . . . . . 0.32 01/14/14 18,750,000 18,747,833Louisville Gas & Electric Co. (b) . . . . . . . . . . . . . . . . . . . . . . . . . . . . . . . . . . 0.24 01/21/14 10,000,000 9,998,666National Grid USA (b) . . . . . . . . . . . . . . . . . . . . . . . . . . . . . . . . . . . . . . . . . . 0.35 01/22/14 2,000,000 1,999,592South Jersey Gas Co.(b) . . . . . . . . . . . . . . . . . . . . . . . . . . . . . . . . . . . . . . . . 0.24 01/13/14 1,000,000 999,920South Jersey Gas Co.(b) . . . . . . . . . . . . . . . . . . . . . . . . . . . . . . . . . . . . . . . . 0.28 01/14/14 6,125,000 6,124,381
Total Commercial Paper (Cost $89,166,302) 89,166,302
42 Portfolio of Investments The accompanying notes are an integral part of these financial statements.
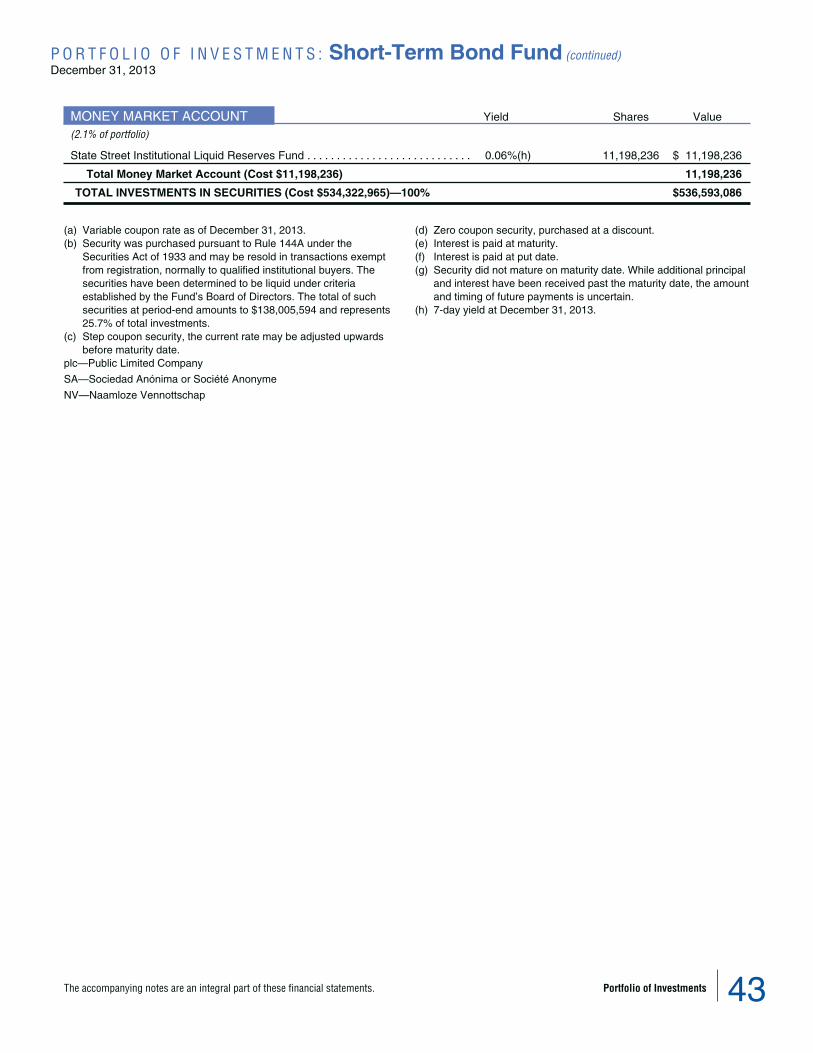
P O R T F O L I O O F I N V E S T M E N T S : Short-Term Bond Fund (continued)December 31, 2013
MONEY MARKET ACCOUNT Yield Shares Value
(2.1% of portfolio)
State Street Institutional Liquid Reserves Fund . . . . . . . . . . . . . . . . . . . . . . . . . . . . 0.06%(h) 11,198,236 $ 11,198,236
Total Money Market Account (Cost $11,198,236) 11,198,236
TOTAL INVESTMENTS IN SECURITIES (Cost $534,322,965)—100% $536,593,086
(a) Variable coupon rate as of December 31, 2013.(b) Security was purchased pursuant to Rule 144A under the
Securities Act of 1933 and may be resold in transactions exemptfrom registration, normally to qualified institutional buyers. Thesecurities have been determined to be liquid under criteriaestablished by the Fund’s Board of Directors. The total of suchsecurities at period-end amounts to $138,005,594 and represents25.7% of total investments.
(c) Step coupon security, the current rate may be adjusted upwardsbefore maturity date.
(d) Zero coupon security, purchased at a discount.(e) Interest is paid at maturity.(f) Interest is paid at put date.(g) Security did not mature on maturity date. While additional principal
and interest have been received past the maturity date, the amountand timing of future payments is uncertain.
(h) 7-day yield at December 31, 2013.
plc—Public Limited Company
SA—Sociedad Anónima or Société Anonyme
NV—Naamloze Vennottschap
The accompanying notes are an integral part of these financial statements. Portfolio of Investments 43

P O R T F O L I O O F I N V E S T M E N T S : Stock Index FundDecember 31, 2013
Cost Value
Investment in S&P 500 Stock Master Portfolio $48,885,160 $103,366,407
Substantially all the assets of the Stock Index Fund are invested in the S&P 500 Stock Master Portfolio managed by BlackRock Fund Advisors. Asof December 31, 2013, the Stock Index Fund’s ownership interest in the S&P 500 Stock Master Portfolio was 1.96%. See the Appendix for theS&P 500 Stock Master Portfolio’s holdings information.
44 Portfolio of Investments The accompanying notes are an integral part of these financial statements.
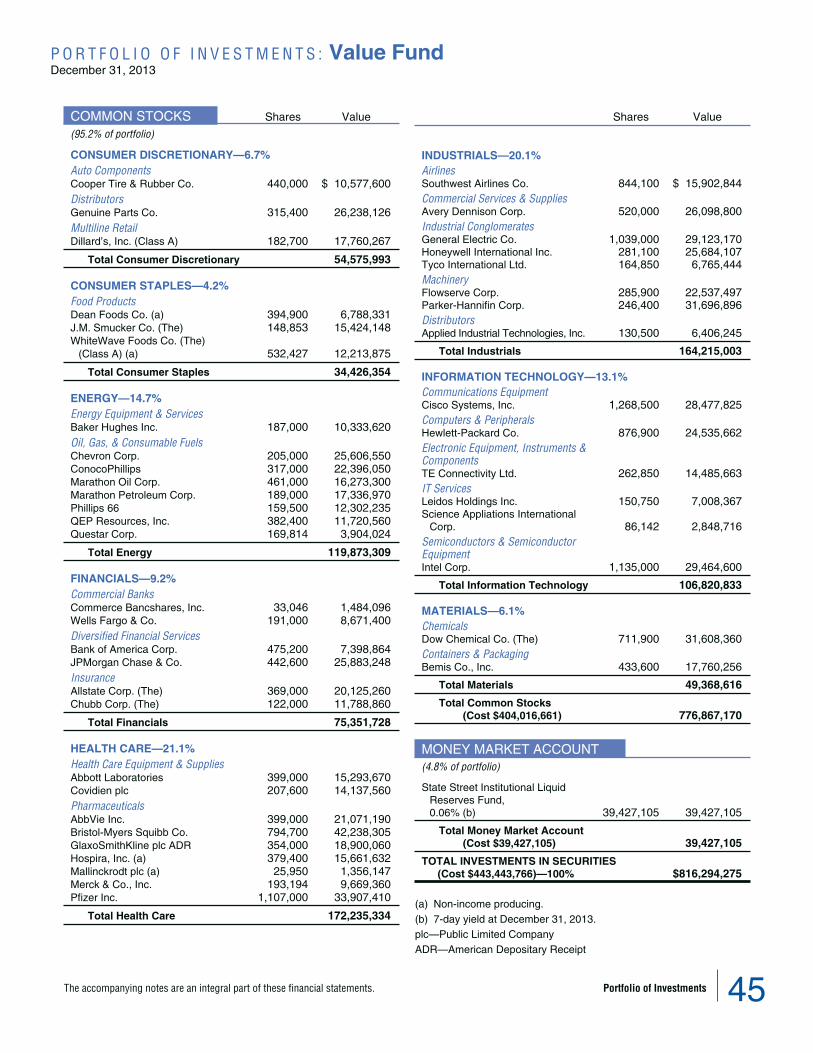
P O R T F O L I O O F I N V E S T M E N T S : Value FundDecember 31, 2013
COMMON STOCKS Shares Value
(95.2% of portfolio)
CONSUMER DISCRETIONARY—6.7%Auto ComponentsCooper Tire & Rubber Co. 440,000 $ 10,577,600DistributorsGenuine Parts Co. 315,400 26,238,126Multiline RetailDillard’s, Inc. (Class A) 182,700 17,760,267
Total Consumer Discretionary 54,575,993
CONSUMER STAPLES—4.2%Food ProductsDean Foods Co. (a) 394,900 6,788,331J.M. Smucker Co. (The) 148,853 15,424,148WhiteWave Foods Co. (The)
(Class A) (a) 532,427 12,213,875
Total Consumer Staples 34,426,354
ENERGY—14.7%Energy Equipment & ServicesBaker Hughes Inc. 187,000 10,333,620Oil, Gas, & Consumable FuelsChevron Corp. 205,000 25,606,550ConocoPhillips 317,000 22,396,050Marathon Oil Corp. 461,000 16,273,300Marathon Petroleum Corp. 189,000 17,336,970Phillips 66 159,500 12,302,235QEP Resources, Inc. 382,400 11,720,560Questar Corp. 169,814 3,904,024
Total Energy 119,873,309
FINANCIALS—9.2%Commercial BanksCommerce Bancshares, Inc. 33,046 1,484,096Wells Fargo & Co. 191,000 8,671,400Diversified Financial ServicesBank of America Corp. 475,200 7,398,864JPMorgan Chase & Co. 442,600 25,883,248InsuranceAllstate Corp. (The) 369,000 20,125,260Chubb Corp. (The) 122,000 11,788,860
Total Financials 75,351,728
HEALTH CARE—21.1%Health Care Equipment & SuppliesAbbott Laboratories 399,000 15,293,670Covidien plc 207,600 14,137,560PharmaceuticalsAbbVie Inc. 399,000 21,071,190Bristol-Myers Squibb Co. 794,700 42,238,305GlaxoSmithKline plc ADR 354,000 18,900,060Hospira, Inc. (a) 379,400 15,661,632Mallinckrodt plc (a) 25,950 1,356,147Merck & Co., Inc. 193,194 9,669,360Pfizer Inc. 1,107,000 33,907,410
Total Health Care 172,235,334
Shares Value
INDUSTRIALS—20.1%AirlinesSouthwest Airlines Co. 844,100 $ 15,902,844Commercial Services & SuppliesAvery Dennison Corp. 520,000 26,098,800Industrial ConglomeratesGeneral Electric Co. 1,039,000 29,123,170Honeywell International Inc. 281,100 25,684,107Tyco International Ltd. 164,850 6,765,444MachineryFlowserve Corp. 285,900 22,537,497Parker-Hannifin Corp. 246,400 31,696,896DistributorsApplied Industrial Technologies, Inc. 130,500 6,406,245
Total Industrials 164,215,003
INFORMATION TECHNOLOGY—13.1%Communications EquipmentCisco Systems, Inc. 1,268,500 28,477,825Computers & PeripheralsHewlett-Packard Co. 876,900 24,535,662Electronic Equipment, Instruments &ComponentsTE Connectivity Ltd. 262,850 14,485,663IT ServicesLeidos Holdings Inc. 150,750 7,008,367Science Appliations International
Corp. 86,142 2,848,716Semiconductors & SemiconductorEquipmentIntel Corp. 1,135,000 29,464,600
Total Information Technology 106,820,833
MATERIALS—6.1%ChemicalsDow Chemical Co. (The) 711,900 31,608,360Containers & PackagingBemis Co., Inc. 433,600 17,760,256
Total Materials 49,368,616
Total Common Stocks(Cost $404,016,661) 776,867,170
MONEY MARKET ACCOUNT(4.8% of portfolio)
State Street Institutional LiquidReserves Fund,0.06% (b) 39,427,105 39,427,105
Total Money Market Account(Cost $39,427,105) 39,427,105
TOTAL INVESTMENTS IN SECURITIES(Cost $443,443,766)—100% $816,294,275
(a) Non-income producing.(b) 7-day yield at December 31, 2013.plc—Public Limited CompanyADR—American Depositary Receipt
The accompanying notes are an integral part of these financial statements. Portfolio of Investments 45

P O R T F O L I O O F I N V E S T M E N T S : Growth FundDecember 31, 2013
COMMON STOCKS Shares Value
(98.3% of portfolio)
CONSUMER DISCRETIONARY—23.9%AutomobilesTesla Motors, Inc. (a) 2,800 $ 421,064Hotels, Restaurants & LeisureChipotle Mexican Grill Inc. (a) 1,700 905,726Ctrip.com International Ltd. (a) 9,500 471,390Hilton Worldwide Holdings Inc. (a) 3,400 75,650Las Vegas Sands Corp. 19,600 1,545,852MGM Resorts International (a) 16,300 383,376Starbucks Corp. 16,000 1,254,240Wynn Resorts, Ltd. 4,300 835,103Household DurablesD.R. Horton, Inc. 31,200 696,384Internet & Catalog RetailAmazon.com, Inc. (a) 9,700 3,868,263Netflix, Inc. (a) 1,700 625,889priceline.com Inc. (a) 2,000 2,324,800MediaDiscovery Communications, Inc. (a) 8,900 746,354Twenty-First Century Fox, Inc. 24,500 861,910Multiline RetailDollar Tree, Inc. (a) 8,800 496,496Specialty RetailFossil, Inc. (a) 3,450 413,793Lowe’s Cos., Inc. 23,800 1,179,290lululemon athletica Inc. (a) 1,800 106,254Tractor Supply Co. 9,600 744,768
Total Consumer Discretionary 17,956,602
CONSUMER STAPLES—3.1%BeveragesGreen Mountain Coffee Roasters, Inc. (a) 2,100 158,718PepsiCo, Inc. 8,500 704,990Food & Staples RetailingWhole Foods Market, Inc. 10,000 578,300Household ProductsProcter & Gamble Co. (The) 11,100 903,651
Total Consumer Staples 2,345,659
ENERGY—3.9%Oil, Gas,& Consumable FuelsAntero Resources Corp. (a) 4,000 253,760Pioneer Natural Resources Co. 6,900 1,270,083Range Resources Corp. 16,132 1,360,089
Total Energy 2,883,932
FINANCIALS—4.1%Capital MarketsMorgan Stanley 29,500 925,120State Street Corp. 15,900 1,166,901TD Ameritrade Holding Corp. 32,300 989,672
Total Financials 3,081,693
Shares Value
HEALTH CARE—16.2%BiotechnologyAlexion Pharmaceuticals Inc. (a) 5,300 $ 705,218Biogen Idec Inc. (a) 5,190 1,451,903Celgene Corp. (a) 7,950 1,343,232Gilead Sciences, Inc. (a) 41,600 3,126,240Regeneron Pharmaceuticals, Inc. (a) 1,800 495,432Vertex Pharmaceuticals, Inc. (a) 3,000 222,900Health Care Equipment & SuppliesIntuitive Surgical, Inc. (a) 700 268,856Health Care Providers & ServicesCardinal Health, Inc. 9,800 654,738McKesson Corp. 10,900 1,759,260Unitedhealth Group Inc. 14,100 1,061,730PharmaceuticalsValeant Pharmaceuticals International,
Inc. (a) 8,800 1,033,120
Total Health Care 12,122,629
INDUSTRIALS—14.5%Aerospace & DefenseBoeing Co. (The) 14,400 1,965,456Precision Castparts Corp. 7,800 2,100,540United Technologies Corp. 4,500 512,100AirlinesUnited Continental Holdings Inc. (a) 23,300 881,439Air Freight & LogisticsFedEx Corp. 9,100 1,308,307MachineryDanaher Corp. 25,700 1,984,040Flowserve Corp. 6,100 480,863Road & RailKansas City Southern 4,200 520,086Wabtec Corp. 8,100 601,587Trading Companies & DistributorsFastenal Co. 11,500 546,365
Total Industrials 10,900,783
INFORMATION TECHNOLOGY—25.9%Communications EquipmentJuniper Networks, Inc. (a) 60,300 1,360,971QUALCOMM, Inc. 12,600 935,550Computers & PeripheralsApple Inc. 2,185 1,226,025Internet Software & ServicesAkamai Technologies, Inc. (a) 16,300 769,034Baidu, Inc. ADR (a) 5,300 942,764eBay Inc. (a) 14,300 784,927Facebook, Inc. (a) 19,900 1,087,734Google Inc. (Class A) (a) 3,850 4,314,733LinkedIn Corp. (a) 2,200 477,026Twitter, Inc. (a) 2,000 127,300IT ServicesCognizant Technology Solutions Corp.,
(Class A) (a) 10,600 1,070,388MasterCard Inc. (Class A) 2,315 1,934,090
46 Portfolio of Investments The accompanying notes are an integral part of these financial statements.

P O R T F O L I O O F I N V E S T M E N T S : Growth Fund (continued)December 31, 2013
Shares Value
(Common Stocks continued)
ServiceNow, Inc. (a) 7,200 $ 403,272Vantiv, Inc. (Class A) (a) 9,500 309,795Visa Inc., Class A 6,400 1,425,152SoftwareNetSuite Inc. (a) 3,100 319,362Red Hat, Inc. (a) 10,500 588,420salesforce.com, Inc. (a) 18,400 1,015,496Workday, Inc. (a) 3,900 324,324
Total Information Technology 19,416,363
MATERIALS—3.9%ChemicalsEcolab Inc. 6,700 698,609Praxair Inc. 7,630 992,129Sherwin-Williams Co. 4,750 871,625Construction MaterialsVulcan Materials Co. 6,600 392,172
Total Materials 2,954,535
TELECOMMUNICATION SERVICES—2.8%Wireless Telecommunication ServicesCrown Castle International Corp. (a) 28,500 2,092,755
Total Telecommunication Services 2,092,755
Total Common Stocks(Cost $51,390,124) 73,754,951
MONEY MARKET ACCOUNT Shares Value
(1.7% of portfolio)
State Street Institutional LiquidReserves Fund, 0.06% (b) 1,245,504 $ 1,245,504
Total Money Market Account(Cost $1,245,504) 1,245,504
TOTAL INVESTMENTS IN SECURITIES(Cost $52,635,628)—100% $75,000,455
(a) Non-income producing.
(b) 7-day yield at December 31, 2013.
ADR—American Depositary Receipt
The accompanying notes are an integral part of these financial statements. Portfolio of Investments 47

P O R T F O L I O O F I N V E S T M E N T S : Small-Company Stock FundDecember 31, 2013
COMMON STOCKS Shares Value
(86.2% of portfolio)
CONSUMER DISCRETIONARY—13.7%Auto ComponentsCooper Tire & Rubber Co. 919,922 $ 22,114,925Diversified Consumer ServicesMatthews International Corp.
(Class A) 317,842 13,543,248Multiline RetailNordstrom, Inc. 90,000 5,562,000RestaurantsBJ’s Restuarants, Inc. (a) 204,117 6,339,874Brinker International, Inc. 200,000 9,268,000Cracker Barrel Old Country Store,
Inc. 210,209 23,137,705Wendy’s Co. (The) 2,040,260 17,791,067Specialty RetailFrancesca’s Holdings Corp. (a) 767,798 14,135,161Sally Beauty Holdings, Inc. (a) 114,000 3,446,220
Total Consumer Discretionary 115,338,200
CONSUMER STAPLES—10.1%Food DistributionCore-Mark Holding Company, Inc. 125,397 9,521,394United Natural Foods, Inc. (a) 159,600 12,032,244Food ProductsDean Foods Co. (a) 287,500 4,942,125J.M. Smucker Co. (The) 40,868 4,234,742WhiteWave Foods Co. (The)
(Class A) (a) 402,509 9,233,556Food & Staples RetailingFred’s, Inc. (Class A) 1,441,175 26,690,561Harris Teeter Supermarkets, Inc. 379,152 18,711,151
Total Consumer Staples 85,365,773
ENERGY—1.7%Energy Equipment & ServicesHelmerich & Payne, Inc. 35,000 2,942,800Oil, Gas, & Consumable FuelsCimarex Energy Co. 59,400 6,231,654QEP Resources, Inc. 26,600 815,290Questar Corp. 26,600 611,534SM Energy Co. 49,000 4,072,390
Total Energy 14,673,668
FINANCIALS—14.3%Commercial BanksCardinal Financial Corp. 997,141 17,948,538Middleburg Financial Corp. 97,700 1,762,508National Bankshares, Inc. (Virginia) 270,402 9,975,130National Penn Bancshares, Inc. 274,543 3,110,572Southcoast Financial Corp. (a) 74,730 444,644Texas Capital Bancshares, Inc. (a) 483,917 30,099,637Valley National Bancorp 1,225,799 12,405,086Consumer FinanceEncore Capital Group, Inc. (a) 456,630 22,950,224Diversified Financial ServicesUMB Financial Corp. 343,244 22,063,724
Total Financials 120,760,063
Shares Value
HEALTH CARE—2.0%Health Care Equipment & SuppliesSTERIS Corp. 342,112 $ 16,438,482
Total Health Care 16,438,482
INDUSTRIALS—26.2%Aerospace & DefenseHuntington Ingalls Industries, Inc. 157,208 14,150,292Triumph Group, Inc. 136,800 10,406,376Construction & EngineeringDycom Industries, Inc. (a) 799,345 22,213,798Orion Marine Group, Inc. (a) 781,365 9,399,821DistributorsApplied Industrial Technologies, Inc. 624,618 30,662,498Electrical EquipmentRofin-Sinar Technologies Inc. (a) 931,499 25,169,103Industrial ConglomeratesCarlisle Companies Inc. 125,600 9,972,640CLARCOR Inc. 87,100 5,604,885Standex International Corp. 19,500 1,226,160MachineryFlowserve Corp. 43,500 3,429,105Gorman-Rupp Co. (The) 541,160 18,090,979Manitowoc Co., Inc. (The) 759,400 17,709,208Regal Beloit Corp. 58,500 4,312,620Road & RailKnight Transportation, Inc. 1,282,082 23,513,384Werner Enterprises, Inc. 1,046,006 25,867,728
Total Industrials 221,728,597
INFORMATION TECHNOLOGY—8.7%Communications EquipmentBelden Inc. 292,585 20,612,613Computers & PeripheralsWestern Digital Corp. 70,000 5,873,000IT ServicesCass Information Systems, Inc. 102,321 6,891,319Computer Services, Inc. 472,346 15,681,887ManTech International Corp. 829,379 24,823,314
Total Information Technology 73,882,133
MATERIALS—9.5%ChemicalsAmerican Vanguard Corp. 501,511 12,181,702Olin Corp. 1,042,465 30,075,115PolyOne Corp. 514,106 18,173,647Polypore International, Inc. (a) 107,200 4,170,080Westlake Chemical Corp. 115,700 14,123,499Containers & PackagingMyers Industries, Inc. 88,274 1,864,347
Total Materials 80,588,390
Total Common Stocks(Cost $483,197,020) 728,775,306
48 Portfolio of Investments The accompanying notes are an integral part of these financial statements.

P O R T F O L I O O F I N V E S T M E N T S : Small-Company Stock Fund (continued)December 31, 2013
EXCHANGE TRADED FUNDS Shares Value
(9.5% of portfolio)
iShares Russell 2000 Value 407,037 $ 40,500,182iShares Core S&P Small-Cap 365,000 39,861,650
Total Exchange Traded Funds(Cost $60,110,281) 80,361,832
MONEY MARKET ACCOUNT Shares Value
(4.3% of portfolio)
State Street Institutional LiquidReserves Fund, 0.06% (b) 36,541,614 $ 36,541,614
Total Money Market Account(Cost $36,541,614) 36,541,614
TOTAL INVESTMENTS IN SECURITIES(Cost $579,848,915)—100% $845,678,752
(a) Non-income producing.(b) 7-day yield at December 31, 2013.
The accompanying notes are an integral part of these financial statements. Portfolio of Investments 49

P O R T F O L I O O F I N V E S T M E N T S : International Value FundDecember 31, 2013
COMMON STOCKS Shares Value
(96.2% of portfolio)
BRAZIL—0.8%Petroleo Brasileiro SA - ADR 129,225 $ 1,780,721
Total Brazil 1,780,721
BRITAIN—11.4%BAE Systems plc 760,050 5,483,602HSBC Holdings plc - ADR 75,550 4,165,072Tesco plc 756,650 4,201,929Vodafone Group plc 1,048,724 4,129,025WPP Group plc 284,250 6,510,444
Total Britain 24,490,072
CANADA—1.7%Encana Corp. 202,550 3,656,027
Total Canada 3,656,027
CHINA—0.9%Guangzhou Automobile Group Co.,
Ltd. 1,829,150 2,005,044
Total China 2,005,044
DENMARK—2.0%Danske Bank Group (a) 182,150 4,184,287
Total Denmark 4,184,287
FRANCE—12.8%AXA SA 204,300 5,689,263Cap Gemini SA 59,550 4,030,664Christian Dior SA 22,250 4,211,500Compagnie de Saint-Gobain SA 99,628 5,488,209GDF SUEZ SA 166,050 3,905,399Total SA 66,750 4,097,076
Total France 27,422,111
GERMANY—7.0%Daimler AG REG 71,300 6,187,729Deutsche Böerse AG 57,200 4,740,388ThyssenKrupp AG (a) 161,850 3,946,722
Total Germany 14,874,839
HONG KONG—3.4%Hutchison Whampoa Ltd. 369,325 5,037,108New World Development Co. Ltd. 1,762,475 2,238,579
Total Hong Kong 7,275,687
ITALY—7.0%Assicurazioni Generali SpA 181,150 4,255,984Eni SpA 182,275 4,404,429Intesa Sanpaolo SpA 2,551,625 6,276,231
Total Italy 14,936,644
JAPAN—16.6%Bridgestone Corp. 114,500 4,338,047Daiwa Securities Group Inc. 402,535 4,031,606LIXIL Group Corp. 88,075 2,417,865Mori Seiki Co., Ltd. 192,750 3,473,572
Shares Value
(Common Stocks continued)
MS & AD Insurance Group Holdings,Inc. 223,055 $ 5,995,488
Nippon Sheet Glass Co. Ltd. (a) 1,671,350 2,179,206Nissan Motor Co., Ltd. 449,200 3,764,297Sumitomo Corp. 359,700 4,520,756Sumitomo Mitsui Trust Holdings, Inc. 926,900 4,904,425
Total Japan 35,625,262
NETHERLANDS—6.4%AEGON NV 868,150 8,227,045DSM NV 68,100 5,359,358
Total Netherlands 13,586,403
PORTUGAL—2.0%Banco Espirito Santo SA (a) 3,063,675 4,375,309
Total Portugal 4,375,309
REPUBLIC OF SOUTH KOREA—3.7%Posco 13,550 4,216,250SK Telecom Co., Ltd. 9,032 1,976,556SK Telecom Co., Ltd. - ADR 69,406 1,708,776
Total Republic of South Korea 7,901,582
SINGAPORE—1.8%Keppel Corp. Ltd. 432,210 3,839,170
Total Singapore 3,839,170
SPAIN—3.6%Banco Popular Espanol SA 381,650 2,305,224IBERDROLA SA 833,132 5,316,843
Total Spain 7,622,067
SWITZERLAND—11.6%Adecco SA REG 61,650 4,894,188Credit Suisse Group AG 155,795 4,808,356Givaudan SA REG 2,382 3,407,605Holcim Ltd. 50,536 3,778,306Novartis AG REG 48,950 3,923,309Roche Holding AG 14,150 3,963,785
Total Switzerland 24,775,549
THAILAND—3.5%Bangkok Bank Public Company Ltd. 275,100 1,497,209Krung Thai Bank Public Company
Ltd. 6,061,875 3,063,637PTT Public Company Ltd. 337,800 2,946,318
Total Thailand 7,507,164
Total Common Stocks(Cost $163,840,198) 205,857,938
50 Portfolio of Investments The accompanying notes are an integral part of these financial statements.

P O R T F O L I O O F I N V E S T M E N T S : International Value Fund (continued)December 31, 2013
MONEY MARKET ACCOUNT Shares Value
(3.8% of portfolio)
State Street Institutional LiquidReserves Fund, 0.06% (b) 8,213,620 $ 8,213,620
Total Money Market Account(Cost $8,213,620) 8,213,620
TOTAL INVESTMENTS IN SECURITIES(Cost $172,053,818)—100% $214,071,558
(a) Non-income producing.
(b) 7-day yield at December 31, 2013.
SA—Sociedad Anónima or Société Anonyme
ADR—American Depositary Receipt
plc—Public Limited Company
AG—Aktiengesellschaft
REG—Registered shares
SpA—Società per Azioni
NV—Naamloze Vennottschap
The accompanying notes are an integral part of these financial statements. Portfolio of Investments 51

S T A T E M E N T S O F A S S E T S A N D L I A B I L I T I E SDecember 31, 2013
ASSETSDaily
Income Fund
Short-TermGovernment
Securities FundShort-TermBond Fund
Investments in securities, at value (cost: $212,396,152; $85,826,590;$534,322,965; $48,885,160; $443,443,766; $52,635,628; $579,848,915;$172,053,818) . . . . . . . . . . . . . . . . . . . . . . . . . . . . . . . . . . . . . . . . . . . . . . . . . . . . $212,396,152 $85,975,482 $536,593,086
Foreign currency (cost $68,191) . . . . . . . . . . . . . . . . . . . . . . . . . . . . . . . . . . . . . . . . — — —Receivables
Investment securities sold . . . . . . . . . . . . . . . . . . . . . . . . . . . . . . . . . . . . . . . . . . — — —Dividends, interest, and tax reclaims . . . . . . . . . . . . . . . . . . . . . . . . . . . . . . . . . 182,055 229,933 2,176,185Capital shares sold . . . . . . . . . . . . . . . . . . . . . . . . . . . . . . . . . . . . . . . . . . . . . . . . 114,117 12,965 790,468
Prepaid expenses . . . . . . . . . . . . . . . . . . . . . . . . . . . . . . . . . . . . . . . . . . . . . . . . . . . 24,458 10,951 52,480
Total assets 212,716,782 86,229,331 539,612,219
LIABILITIES
PayablesInvestment securities purchased . . . . . . . . . . . . . . . . . . . . . . . . . . . . . . . . . . . . . — — 2,688,624Accrued expenses . . . . . . . . . . . . . . . . . . . . . . . . . . . . . . . . . . . . . . . . . . . . . . . . 49,800 29,687 80,389Due to Board Members . . . . . . . . . . . . . . . . . . . . . . . . . . . . . . . . . . . . . . . . . . . . 44,110 17,688 78,546Due to RE Advisers . . . . . . . . . . . . . . . . . . . . . . . . . . . . . . . . . . . . . . . . . . . . . . . 12,851 43,728 321,618Due to custodian . . . . . . . . . . . . . . . . . . . . . . . . . . . . . . . . . . . . . . . . . . . . . . . . . . 229,922 — —Capital shares redeemed . . . . . . . . . . . . . . . . . . . . . . . . . . . . . . . . . . . . . . . . . . . 72,096 6,174 123,446Dividends . . . . . . . . . . . . . . . . . . . . . . . . . . . . . . . . . . . . . . . . . . . . . . . . . . . . . . . . 19 1,550 16,523
Total liabilities 408,798 98,827 3,309,146
NET ASSETS $212,307,984 $86,130,504 $536,303,073
NET ASSETS CONSIST OF:
Unrealized appreciation of investments . . . . . . . . . . . . . . . . . . . . . . . . . . . . . . . . . . $ — $ 148,892 $ 2,270,121Undistributed (over distributed) net investment income . . . . . . . . . . . . . . . . . . . . . (44,110) (18,974) (78,546)Undistributed net realized gain (loss) from investments and futures
transactions . . . . . . . . . . . . . . . . . . . . . . . . . . . . . . . . . . . . . . . . . . . . . . . . . . . . . . — (269) (462,385)Paid-in-capital applicable to outstanding shares of 212,352,054 of Daily Income
Fund, 16,582,773 of Short-Term Government Securities Fund, 102,790,011of Short-Term Bond Fund, 7,513,773 of Stock Index Fund, 17,959,936 ofValue Fund, 9,470,619 of Growth Fund, 22,929,179 of Small-CompanyStock Fund, and 26,436,347 of International Value Fund . . . . . . . . . . . . . . . . . 212,352,094 86,000,855 534,573,883
NET ASSETS $212,307,984 $86,130,504 $536,303,073
NET ASSET VALUE PER SHARE $ 1.00 $ 5.19 $ 5.22
52 Statements of Assets and Liabilities The accompanying notes are an integral part of these financial statements.
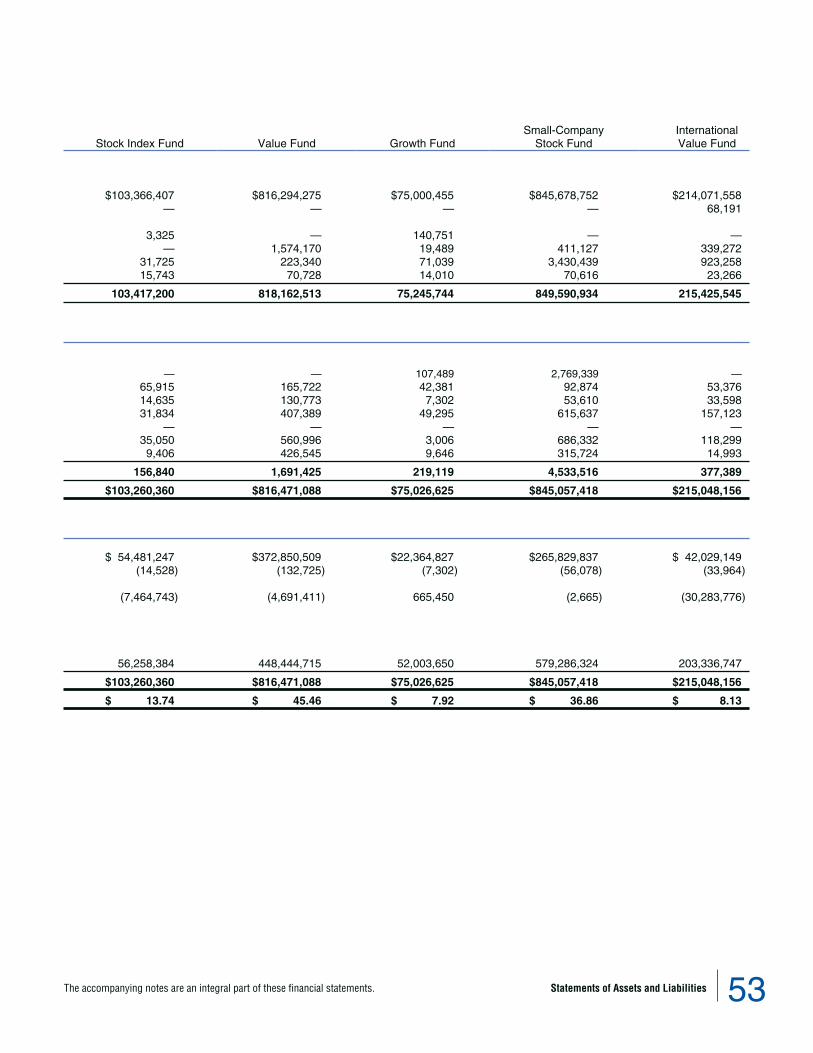
Stock Index Fund Value Fund Growth FundSmall-Company
Stock FundInternationalValue Fund
$103,366,407 $816,294,275 $75,000,455 $845,678,752 $214,071,558— — — — 68,191
3,325 — 140,751 — —— 1,574,170 19,489 411,127 339,272
31,725 223,340 71,039 3,430,439 923,25815,743 70,728 14,010 70,616 23,266
103,417,200 818,162,513 75,245,744 849,590,934 215,425,545
— — 107,489 2,769,339 —65,915 165,722 42,381 92,874 53,37614,635 130,773 7,302 53,610 33,59831,834 407,389 49,295 615,637 157,123
— — — — —35,050 560,996 3,006 686,332 118,299
9,406 426,545 9,646 315,724 14,993
156,840 1,691,425 219,119 4,533,516 377,389
$103,260,360 $816,471,088 $75,026,625 $845,057,418 $215,048,156
$ 54,481,247 $372,850,509 $22,364,827 $265,829,837 $ 42,029,149(14,528) (132,725) (7,302) (56,078) (33,964)
(7,464,743) (4,691,411) 665,450 (2,665) (30,283,776)
56,258,384 448,444,715 52,003,650 579,286,324 203,336,747
$103,260,360 $816,471,088 $75,026,625 $845,057,418 $215,048,156
$ 13.74 $ 45.46 $ 7.92 $ 36.86 $ 8.13
The accompanying notes are an integral part of these financial statements. Statements of Assets and Liabilities 53

S T A T E M E N T S O F O P E R A T I O N SFor the Year Ended December 31, 2013
INVESTMENT INCOMEDaily
Income Fund
Short-TermGovernment
Securities FundShort-TermBond Fund
Interest . . . . . . . . . . . . . . . . . . . . . . . . . . . . . . . . . . . . . . . . . . . . . . . . . . . . . . . . . . . . . . $ 236,383 $ 1,497,543 $11,201,736Dividends . . . . . . . . . . . . . . . . . . . . . . . . . . . . . . . . . . . . . . . . . . . . . . . . . . . . . . . . . . . . — — —Allocated from Master Portfolio
Income . . . . . . . . . . . . . . . . . . . . . . . . . . . . . . . . . . . . . . . . . . . . . . . . . . . . . . . . . . . — — —Expense . . . . . . . . . . . . . . . . . . . . . . . . . . . . . . . . . . . . . . . . . . . . . . . . . . . . . . . . . . — — —
Total investment income 236,383 1,497,543 11,201,736
EXPENSES
Management fees . . . . . . . . . . . . . . . . . . . . . . . . . . . . . . . . . . . . . . . . . . . . . . . . . . . . . 1,038,445 408,494 2,869,281Shareholder servicing fees . . . . . . . . . . . . . . . . . . . . . . . . . . . . . . . . . . . . . . . . . . . . . . 131,684 67,360 163,784Custodian and accounting fees . . . . . . . . . . . . . . . . . . . . . . . . . . . . . . . . . . . . . . . . . . 41,190 64,101 178,272Director and Board meeting expenses . . . . . . . . . . . . . . . . . . . . . . . . . . . . . . . . . . . . 47,279 20,589 103,054Legal and audit fees . . . . . . . . . . . . . . . . . . . . . . . . . . . . . . . . . . . . . . . . . . . . . . . . . . . 32,320 15,424 68,246Registration fees . . . . . . . . . . . . . . . . . . . . . . . . . . . . . . . . . . . . . . . . . . . . . . . . . . . . . . 39,038 23,113 40,228Printing . . . . . . . . . . . . . . . . . . . . . . . . . . . . . . . . . . . . . . . . . . . . . . . . . . . . . . . . . . . . . . 16,862 9,336 28,190Insurance . . . . . . . . . . . . . . . . . . . . . . . . . . . . . . . . . . . . . . . . . . . . . . . . . . . . . . . . . . . . 12,494 5,475 25,216Communication . . . . . . . . . . . . . . . . . . . . . . . . . . . . . . . . . . . . . . . . . . . . . . . . . . . . . . . 5,182 2,541 7,778Other expenses . . . . . . . . . . . . . . . . . . . . . . . . . . . . . . . . . . . . . . . . . . . . . . . . . . . . . . . 11,036 10,188 31,581Administration fees . . . . . . . . . . . . . . . . . . . . . . . . . . . . . . . . . . . . . . . . . . . . . . . . . . . . — — —
Total expenses 1,375,530 626,621 3,515,630
Less fees waived and expenses reimbursed by RE Advisers . . . . . . . . . . . . . . . . . . (1,148,694) — —
Net expenses 226,836 626,621 3,515,630
NET INVESTMENT INCOME (LOSS) 9,547 870,922 7,686,106
REALIZED AND UNREALIZED GAIN(LOSS) ON INVESTMENTS
Net realized gain (loss) on investments . . . . . . . . . . . . . . . . . . . . . . . . . . . . . . . . . . . — 24,920 57,875Net change in unrealized appreciation (depreciation) . . . . . . . . . . . . . . . . . . . . . . . . — (1,430,414) (702,939)
NET GAIN (LOSS) ON INVESTMENTS — (1,405,494) (645,064)
NET INCREASE (DECREASE) IN NET ASSETS FROM OPERATIONS $ 9,547 $ (534,572) $ 7,041,042
(a) Represents realized and unrealized gain on investments allocated from the Master Portfolio.(b) Includes foreign tax witholding expense of $590,969.
54 Statements of Operations The accompanying notes are an integral part of these financial statements.

Stock Index Fund Value Fund Growth FundSmall-Company
Stock FundInternationalValue Fund
$ — $ 16,806 $ 1,015 $ 34,785 $ 6,059— 17,870,030 345,534 8,203,572 5,550,166(b)
1,844,536 — — — —(43,800) — — — —
1,800,736 17,886,836 346,549 8,238,357 5,556,225
— 3,563,379 355,633 4,777,877 1,431,337110,098 394,508 92,895 277,389 103,781
13,798 118,371 38,430 103,769 149,02414,894 157,492 12,536 124,028 41,51229,876 102,663 25,126 83,675 43,69221,476 43,121 21,184 54,593 26,11320,261 82,276 13,484 58,127 15,622
4,396 36,348 483 23,513 9,9161,820 25,140 3,840 17,797 4,7577,621 34,362 2,702 20,547 7,398
219,098 — — — —
443,338 4,557,660 566,313 5,541,315 1,833,152
— — (47,401) — —
443,338 4,557,660 518,912 5,541,315 1,833,152
1,357,398 13,329,176 (172,363) 2,697,042 3,723,073
124,783(a) (2,112,111) 3,654,847 773,592 (2,309,907)22,343,451(a) 202,693,851 16,702,576 183,232,225 39,384,440
22,468,234 200,581,740 20,357,423 184,005,817 37,074,533
$23,825,632 $213,910,916 $20,185,060 $186,702,859 $40,797,606
The accompanying notes are an integral part of these financial statements. Statements of Operations 55

S T A T E M E N T S O F C H A N G E S I N N E T A S S E T S
Daily Income Fund
INCREASE (DECREASE) IN NET ASSETS
Year EndedDecember 31,
2013
Year EndedDecember 31,
2012
OperationsNet investment income (loss) . . . . . . . . . . . . . . . . . . . . . . . . . . . . . . . . . . . . . . . . . . . . . . . . . . . . . $ 9,547 $ 9,263Net realized gain (loss) on investments . . . . . . . . . . . . . . . . . . . . . . . . . . . . . . . . . . . . . . . . . . . . — —Net change in unrealized appreciation (depreciation) . . . . . . . . . . . . . . . . . . . . . . . . . . . . . . . . . — —
Increase (decrease) in net assets from operations 9,547 9,263
Distributions to ShareholdersNet investment income . . . . . . . . . . . . . . . . . . . . . . . . . . . . . . . . . . . . . . . . . . . . . . . . . . . . . . . . . . (20,433) (19,966)Net realized gain on investments . . . . . . . . . . . . . . . . . . . . . . . . . . . . . . . . . . . . . . . . . . . . . . . . . — —Return of capital . . . . . . . . . . . . . . . . . . . . . . . . . . . . . . . . . . . . . . . . . . . . . . . . . . . . . . . . . . . . . . . — —
Total distributions to shareholders (20,433) (19,966)
Capital Share TransactionsNet capital share transactions (See Note 7) . . . . . . . . . . . . . . . . . . . . . . . . . . . . . . . . . . . . . . . . . 3,791,699 13,365,180Redemption fees received (See Note 5) . . . . . . . . . . . . . . . . . . . . . . . . . . . . . . . . . . . . . . . . . . . . — —
Total increase (decrease) in net assets from capital transactions 3,791,699 13,365,180
TOTAL INCREASE (DECREASE) IN NET ASSETS 3,780,813 13,354,477
NET ASSETSBeginning of period . . . . . . . . . . . . . . . . . . . . . . . . . . . . . . . . . . . . . . . . . . . . . . . . . . . . . . . . . . . . . . . 208,527,171 195,172,694
End of period $212,307,984 $208,527,171
Undistributed (over distributed) net investment income (44,110) (33,224)
Value Fund
INCREASE (DECREASE) IN NET ASSETS
Year EndedDecember 31,
2013
Year EndedDecember 31,
2012
OperationsNet investment income (loss) . . . . . . . . . . . . . . . . . . . . . . . . . . . . . . . . . . . . . . . . . . . . . . . . . . . . . $ 13,329,176 $ 12,447,468Net realized gain (loss) on investments . . . . . . . . . . . . . . . . . . . . . . . . . . . . . . . . . . . . . . . . . . . . (2,112,111) 10,450,324Net change in unrealized appreciation (depreciation) . . . . . . . . . . . . . . . . . . . . . . . . . . . . . . . . . 202,693,851 49,125,410
Increase (decrease) in net assets from operations 213,910,916 72,023,202
Distributions to ShareholdersNet investment income . . . . . . . . . . . . . . . . . . . . . . . . . . . . . . . . . . . . . . . . . . . . . . . . . . . . . . . . . . (13,365,968) (12,479,522)Net realized gain on investments . . . . . . . . . . . . . . . . . . . . . . . . . . . . . . . . . . . . . . . . . . . . . . . . . — —Return of capital . . . . . . . . . . . . . . . . . . . . . . . . . . . . . . . . . . . . . . . . . . . . . . . . . . . . . . . . . . . . . . . — —
Total distributions to shareholders (13,365,968) (12,479,522)
Capital Share TransactionsNet capital share transactions (See Note 7) . . . . . . . . . . . . . . . . . . . . . . . . . . . . . . . . . . . . . . . . . 15,380,716 210,510Redemption fees received (See Note 5) . . . . . . . . . . . . . . . . . . . . . . . . . . . . . . . . . . . . . . . . . . . . 1,579 17,281
Total increase (decrease) in net assets from capital transactions 15,382,295 227,791
TOTAL INCREASE (DECREASE) IN NET ASSETS 215,927,243 59,771,471
NET ASSETSBeginning of period . . . . . . . . . . . . . . . . . . . . . . . . . . . . . . . . . . . . . . . . . . . . . . . . . . . . . . . . . . . . . . . 600,543,845 540,772,374
End of period $816,471,088 $600,543,845
Undistributed (over distributed) net investment income (132,725) (95,933)
56 Statements of Changes in Net Assets The accompanying notes are an integral part of these financial statements.

Short-Term GovernmentSecurities Fund Short-Term Bond Fund Stock Index Fund
Year EndedDecember 31,
2013
Year EndedDecember 31,
2012
Year EndedDecember 31,
2013
Year EndedDecember 31,
2012
Year EndedDecember 31,
2013
Year EndedDecember 31,
2012
$ 870,922 $ 1,065,045 $ 7,686,106 $ 10,194,968 $ 1,357,398 $ 1,195,21124,920 93,344 57,875 184,328 124,783 646,146
(1,430,414) 133,261 (702,939) 7,179,644 22,343,451 7,712,581
(534,572) 1,291,650 7,041,042 17,558,940 23,825,632 9,553,938
(876,413) (1,069,833) (7,715,742) (10,216,896) (1,357,830) (1,173,069)(26,503) (94,554) — — — —
— — — — — —
(902,916) (1,164,387) (7,715,742) (10,216,896) (1,357,830) (1,173,069)
(6,561,748) 9,443,024 110,496,641 44,581,757 9,278,733 1,288,367— — — — 120 —
(6,561,748) 9,443,024 110,496,641 44,581,757 9,278,853 1,288,367
(7,999,236) 9,570,287 109,821,941 51,923,801 31,746,655 9,669,236
94,129,740 84,559,453 426,481,132 374,557,331 71,513,705 61,844,469
$86,130,504 $94,129,740 $536,303,073 $426,481,132 $103,260,360 $ 71,513,705
(18,974) (12,831) (78,546) (54,455) (14,528) 23,184
Growth Fund Small-Company Stock Fund International Value Fund
Year EndedDecember 31,
2013
Year EndedDecember 31,
2012
Year EndedDecember 31,
2013
Year EndedDecember 31,
2012
Year EndedDecember 31,
2013
Year EndedDecember 31,
2012
$ (172,363) $ 243 $ 2,697,042 $ 3,077,614 $ 3,723,073 $ 3,824,3353,654,847 2,216,195 773,592 1,030,085 (2,309,907) (3,753,490)
16,702,576 3,643,151 183,232,225 46,077,160 39,384,440 26,147,534
20,185,060 5,859,589 186,702,859 50,184,859 40,797,606 26,218,379
— (2,732) (2,726,757) (3,091,883) (3,630,196) (3,774,702)(2,454,343) (2,511,235) (775,696) (927,135) — —
— — — — — (3,223,967)
(2,454,343) (2,513,967) (3,502,453) (4,019,018) (3,630,196) (6,998,669)
15,459,394 6,054,051 271,474,115 153,753,607 8,498,531 5,741,615123 2,225 9,942 27,777 147 117
15,459,517 6,056,276 271,484,057 153,781,384 8,498,678 5,741,732
33,190,234 9,401,898 454,684,463 199,947,225 45,666,088 24,961,442
41,836,391 32,434,493 390,372,955 190,425,730 169,382,068 144,420,626
$75,026,625 $41,836,391 $845,057,418 $390,372,955 $215,048,156 $169,382,068
(7,302) (4,676) (56,078) (26,363) (33,964) (77,417)
The accompanying notes are an integral part of these financial statements. Statements of Changes in Net Assets 57

F I N A N C I A L H I G H L I G H T S : Daily Income FundFor a Share Outstanding Throughout Each Year
Year Ended December 31,2013 2012 2011 2010 2009
NET ASSET VALUE, BEGINNING OF YEAR $1.00 $1.00 $1.00 $1.00 $1.00
Income from investment operationsNet investment income . . . . . . . . . . . . . . . . . . . . . . . . . . . . . . . —(a,b,c) —(a,b,c) —(a,b,c) —(a,b,c) —(a,b,c)Net realized and unrealized gain (loss) on investments . . . . — — — — —
Total from investment operations — — — — —
DistributionsNet investment income . . . . . . . . . . . . . . . . . . . . . . . . . . . . . . . —(b) —(b) —(b) —(b) —(b)Net realized gain . . . . . . . . . . . . . . . . . . . . . . . . . . . . . . . . . . . . — — — — —
Total distributions — — — — —
Redemption fee (d) — — — — —
NET ASSET VALUE, END OF YEAR $1.00 $1.00 $1.00 $1.00 $1.00
TOTAL RETURN 0.01% 0.01% 0.01% 0.01% 0.31%
RATIOS/SUPPLEMENTAL DATA
Net assets, end of year (thousands) . . . . . . . . . . . . . . . . . . . . . . $212,308 $208,527 $195,173 $187,089 $191,492Ratio of gross expenses before voluntary expense limitation to
average net assets . . . . . . . . . . . . . . . . . . . . . . . . . . . . . . . . . . 0.66% 0.67% 0.68% 0.69% 0.73%Ratio of net investment income to average net assets (a,c) . . . 0.00% 0.00% 0.01% 0.01% 0.30%Ratio of expenses to average net assets (a,c) . . . . . . . . . . . . . . 0.11% 0.15% 0.14% 0.24% 0.47%
(a) Excludes excess investment management fees and otherexpenses voluntarily waived and reimbursed by RE Advisers.
(b) Less than $0.01 per share.
(c) On January 27, 2009, RE Advisers voluntarily and temporarilyreduced the amount of the expense limitation from 0.80% to0.50%. Additionally, effective August 14, 2009, RE Advisers
agreed to further waive fees or reimburse expenses to the extentnecessary to assist the Fund in attempting to maintain a positiveyield. The temporary waiver continued throughout 2010, 2011,2012, and 2013.
(d) The Daily Income Fund does not charge a redemption fee.
58 Financial Highlights The accompanying notes are an integral part of these financial statements.
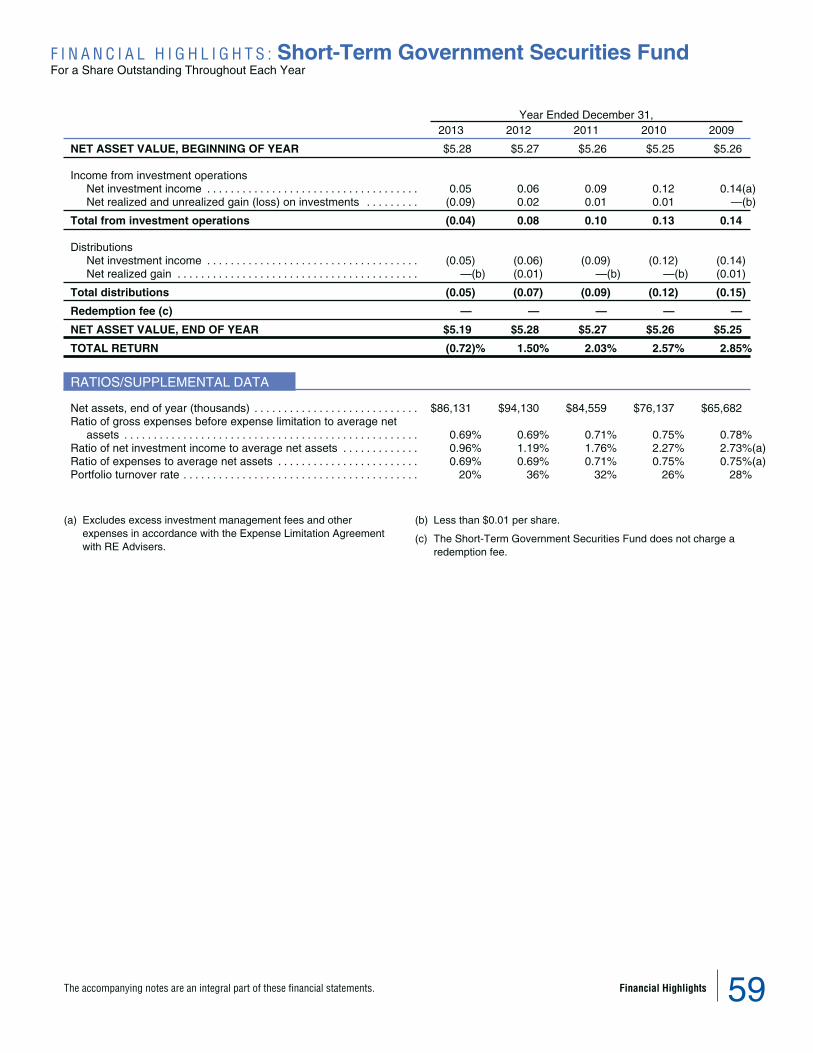
F I N A N C I A L H I G H L I G H T S : Short-Term Government Securities FundFor a Share Outstanding Throughout Each Year
Year Ended December 31,2013 2012 2011 2010 2009
NET ASSET VALUE, BEGINNING OF YEAR $5.28 $5.27 $5.26 $5.25 $5.26
Income from investment operationsNet investment income . . . . . . . . . . . . . . . . . . . . . . . . . . . . . . . . . . . . 0.05 0.06 0.09 0.12 0.14(a)Net realized and unrealized gain (loss) on investments . . . . . . . . . (0.09) 0.02 0.01 0.01 —(b)
Total from investment operations (0.04) 0.08 0.10 0.13 0.14
DistributionsNet investment income . . . . . . . . . . . . . . . . . . . . . . . . . . . . . . . . . . . . (0.05) (0.06) (0.09) (0.12) (0.14)Net realized gain . . . . . . . . . . . . . . . . . . . . . . . . . . . . . . . . . . . . . . . . . —(b) (0.01) —(b) —(b) (0.01)
Total distributions (0.05) (0.07) (0.09) (0.12) (0.15)
Redemption fee (c) — — — — —
NET ASSET VALUE, END OF YEAR $5.19 $5.28 $5.27 $5.26 $5.25
TOTAL RETURN (0.72)% 1.50% 2.03% 2.57% 2.85%
RATIOS/SUPPLEMENTAL DATA
Net assets, end of year (thousands) . . . . . . . . . . . . . . . . . . . . . . . . . . . . $86,131 $94,130 $84,559 $76,137 $65,682Ratio of gross expenses before expense limitation to average net
assets . . . . . . . . . . . . . . . . . . . . . . . . . . . . . . . . . . . . . . . . . . . . . . . . . . 0.69% 0.69% 0.71% 0.75% 0.78%Ratio of net investment income to average net assets . . . . . . . . . . . . . 0.96% 1.19% 1.76% 2.27% 2.73%(a)Ratio of expenses to average net assets . . . . . . . . . . . . . . . . . . . . . . . . 0.69% 0.69% 0.71% 0.75% 0.75%(a)Portfolio turnover rate . . . . . . . . . . . . . . . . . . . . . . . . . . . . . . . . . . . . . . . . 20% 36% 32% 26% 28%
(a) Excludes excess investment management fees and otherexpenses in accordance with the Expense Limitation Agreementwith RE Advisers.
(b) Less than $0.01 per share.
(c) The Short-Term Government Securities Fund does not charge aredemption fee.
The accompanying notes are an integral part of these financial statements. Financial Highlights 59

F I N A N C I A L H I G H L I G H T S : Short-Term Bond FundFor a Share Outstanding Throughout Each Year
Year Ended December 31,2013 2012 2011 2010 2009
NET ASSET VALUE, BEGINNING OF YEAR $5.22 $5.12 $5.19 $5.13 $4.72
Income from investment operationsNet investment income . . . . . . . . . . . . . . . . . . . . . . . . . . . . . . . 0.08 0.13 0.17 0.23 0.33(a)Net realized and unrealized gain (loss) on investments . . . . —(b) 0.10 (0.07) 0.06 0.42
Total from investment operations 0.08 0.23 0.10 0.29 0.75
DistributionsNet investment income . . . . . . . . . . . . . . . . . . . . . . . . . . . . . . . (0.08) (0.13) (0.17) (0.23) (0.33)Net realized gain . . . . . . . . . . . . . . . . . . . . . . . . . . . . . . . . . . . . — — — — (0.01)
Total distributions (0.08) (0.13) (0.17) (0.23) (0.34)
Redemption fee (c) — — — — —
NET ASSET VALUE, END OF YEAR $5.22 $5.22 $5.12 $5.19 $5.13
TOTAL RETURN 1.64% 4.58% 1.90% 5.73% 16.38%
RATIOS/SUPPLEMENTAL DATA
Net assets, end of year (thousands) . . . . . . . . . . . . . . . . . . . . . . $536,303 $426,481 $374,557 $309,006 $246,420Ratio of gross expenses before expense limitation to average
net assets . . . . . . . . . . . . . . . . . . . . . . . . . . . . . . . . . . . . . . . . . 0.74% 0.76% 0.77% 0.80% 0.83%Ratio of net investment income to average net assets . . . . . . . . 1.61% 2.53% 3.22% 4.38% 6.62%(a)Ratio of expenses to average net assets . . . . . . . . . . . . . . . . . . . 0.74% 0.76% 0.77% 0.80% 0.80%(a)Portfolio turnover rate . . . . . . . . . . . . . . . . . . . . . . . . . . . . . . . . . . 32% 44% 31% 38% 52%
(a) Excludes excess investment management fees and otherexpenses in accordance with the Expense Limitation Agreementwith RE Advisers.
(b) Less than $0.01 per share.
(c) The Short-Term Bond Fund does not charge a redemption fee.
60 Financial Highlights The accompanying notes are an integral part of these financial statements.

F I N A N C I A L H I G H L I G H T S : Stock Index FundFor a Share Outstanding Throughout Each Year
Year Ended December 31,2013 2012 2011 2010 2009
NET ASSET VALUE, BEGINNING OF YEAR $10.57 $9.32 $9.31 $8.24 $6.64
Income from investment operationsNet investment income . . . . . . . . . . . . . . . . . . . . . . . . . . . . . . . . . . . 0.18 0.18 0.14 0.12 0.11Net realized and unrealized gain (loss) on investments . . . . . . . . 3.17 1.25 0.01 1.07 1.60
Total from investment operations 3.35 1.43 0.15 1.19 1.71
DistributionsNet investment income . . . . . . . . . . . . . . . . . . . . . . . . . . . . . . . . . . . (0.18) (0.18) (0.14) (0.12) (0.11)Net realized gain . . . . . . . . . . . . . . . . . . . . . . . . . . . . . . . . . . . . . . . . — — — — —
Total distributions (0.18) (0.18) (0.14) (0.12) (0.11)
Redemption fee —(a) — —(a) —(a) —(a)
NET ASSET VALUE, END OF YEAR $13.74 $10.57 $9.32 $9.31 $8.24
TOTAL RETURN 31.72% 15.30% 1.65% 14.47% 25.83%
RATIOS/SUPPLEMENTAL DATA
Net assets, end of year (thousands) . . . . . . . . . . . . . . . . . . . . . . . . . . . $103,260 $71,514 $61,844 $60,624 $51,847Ratio of net investment income to average net assets . . . . . . . . . . . . 1.55% 1.74% 1.52% 1.45% 1.66%Ratio of expenses to average net assets . . . . . . . . . . . . . . . . . . . . . . . 0.56% 0.60% 0.61% 0.62% 0.75%Portfolio turnover rate (b) . . . . . . . . . . . . . . . . . . . . . . . . . . . . . . . . . . . . N/A N/A N/A N/A N/A
(a) Less than $0.01 per share. (b) See Appendix for the portfolio turnover of the S&P 500 StockMaster Portfolio.
The accompanying notes are an integral part of these financial statements. Financial Highlights 61

F I N A N C I A L H I G H L I G H T S : Value FundFor a Share Outstanding Throughout Each Year
Year Ended December 31,2013 2012 2011 2010 2009
NET ASSET VALUE, BEGINNING OF YEAR $34.09 $30.71 $30.70 $27.52 $22.03
Income from investment operationsNet investment income . . . . . . . . . . . . . . . . . . . . . . . . . . . . . . . 0.76 0.71 0.50 0.38 0.40Net realized and unrealized gain (loss) on investments . . . . 11.37 3.38 —(a) 3.18 5.49
Total from investment operations 12.13 4.09 0.50 3.56 5.89
DistributionsNet investment income . . . . . . . . . . . . . . . . . . . . . . . . . . . . . . . (0.76) (0.71) (0.49) (0.38) (0.40)Net realized gain . . . . . . . . . . . . . . . . . . . . . . . . . . . . . . . . . . . . — — — — —
Total distributions (0.76) (0.71) (0.49) (0.38) (0.40)
Redemption fee —(a) —(a) —(a) —(a) —(a)
NET ASSET VALUE, END OF YEAR $45.46 $34.09 $30.71 $30.70 $27.52
TOTAL RETURN 35.74% 13.38% 1.60% 13.05% 26.98%
RATIOS/SUPPLEMENTAL DATA
Net assets, end of year (thousands) . . . . . . . . . . . . . . . . . . . . . . $816,471 $600,544 $540,772 $547,616 $497,076Ratio of net investment income to average net assets . . . . . . . . 1.86% 2.13% 1.59% 1.32% 1.71%Ratio of expenses to average net assets . . . . . . . . . . . . . . . . . . . 0.64% 0.68% 0.70% 0.73% 0.80%Portfolio turnover rate . . . . . . . . . . . . . . . . . . . . . . . . . . . . . . . . . . 2% 2% 6% 4% 3%
(a) Less than $0.01 per share.
62 Financial Highlights The accompanying notes are an integral part of these financial statements.

F I N A N C I A L H I G H L I G H T S : Growth FundFor a Share Outstanding Throughout Each Year
Year Ended December 31,2013 2012 2011 2010 2009
NET ASSET VALUE, BEGINNING OF YEAR $5.71 $5.17 $5.80 $5.02 $3.31
Income from investment operationsNet investment loss . . . . . . . . . . . . . . . . . . . . . . . . . . . . . . . . . . . . . . . — —(a) (0.01) (0.01) —(a)Net realized and unrealized gain (loss) on investments . . . . . . . . . 2.48 0.91 (0.11) 0.79 1.71
Total from investment operations 2.48 0.91 (0.12) 0.78 1.71
DistributionsNet investment income . . . . . . . . . . . . . . . . . . . . . . . . . . . . . . . . . . . . — —(a) — — —Net realized gain . . . . . . . . . . . . . . . . . . . . . . . . . . . . . . . . . . . . . . . . . (0.27) (0.37) (0.51) — —
Total distributions (0.27) (0.37) (0.51) — —
Redemption fee —(a) —(a) —(a) —(a) —(a)
NET ASSET VALUE, END OF YEAR $7.92 $5.71 $5.17 $5.80 $5.02
TOTAL RETURN 43.40% 17.57% (2.09)% 15.54% 51.66%
RATIOS/SUPPLEMENTAL DATA
Net assets, end of year (thousands) . . . . . . . . . . . . . . . . . . . . . . . . . . . . $75,027 $41,836 $32,434 $29,051 $19,059Ratio of gross expenses before expense limitation to average net
assets . . . . . . . . . . . . . . . . . . . . . . . . . . . . . . . . . . . . . . . . . . . . . . . . . . 1.04% 1.11% 1.14% 1.23% 1.74%Ratio of net investment income (loss) to average net assets (b) . . . . . (0.32)% 0.00% (0.19)% (0.17)% (0.09)%Ratio of expenses to average net assets (b) . . . . . . . . . . . . . . . . . . . . . 0.95% 0.95% 0.95% 0.95% 0.95%Portfolio turnover rate . . . . . . . . . . . . . . . . . . . . . . . . . . . . . . . . . . . . . . . . 39% 51% 67% 67% 66%
(a) Less than $0.01 per share. (b) Excludes excess investment management fees and otherexpenses in accordance with the Expense Limitation Agreementwith RE Advisers.
The accompanying notes are an integral part of these financial statements. Financial Highlights 63

F I N A N C I A L H I G H L I G H T S : Small-Company Stock FundFor a Share Outstanding Throughout Each Year
Year Ended December 31,2013 2012 2011 2010 2009
NET ASSET VALUE, BEGINNING OF YEAR $27.10 $22.89 $22.79 $17.04 $11.81
Income from investment operationsNet investment income (loss) . . . . . . . . . . . . . . . . . . . . . . . . . . 0.12 0.22 0.03 0.03 0.10Net realized and unrealized gain (loss) on investments . . . . . 9.79 4.27 0.10 5.75 5.23
Total from investment operations 9.91 4.49 0.13 5.78 5.33
DistributionsNet investment income . . . . . . . . . . . . . . . . . . . . . . . . . . . . . . . . (0.12) (0.22) (0.03) (0.03) (0.10)Net realized gain . . . . . . . . . . . . . . . . . . . . . . . . . . . . . . . . . . . . . (0.03) (0.06) — — —
Total distributions (0.15) (0.28) (0.03) (0.03) (0.10)
Redemption fee —(a) —(a) —(a) —(a) —(a)
NET ASSET VALUE, END OF YEAR $36.86 $27.10 $22.89 $22.79 $17.04
TOTAL RETURN 36.58% 19.63% 0.58% 33.94% 45.10%
RATIOS/SUPPLEMENTAL DATA
Net assets, end of year (thousands) . . . . . . . . . . . . . . . . . . . . . . . . $845,057 $390,373 $190,426 $114,159 $65,833Ratio of net investment income (loss) to average net assets . . . . 0.44% 1.05% 0.17% 0.20% 0.71%Ratio of expenses to average net assets . . . . . . . . . . . . . . . . . . . . 0.91% 1.00% 1.06% 1.17% 1.23%Portfolio turnover rate . . . . . . . . . . . . . . . . . . . . . . . . . . . . . . . . . . . 1% 1% 2% 4% 9%
(a) Less than $0.01 per share.
64 Financial Highlights The accompanying notes are an integral part of these financial statements.

F I N A N C I A L H I G H L I G H T S : International Value FundFor a Share Outstanding Throughout Each Year
Year Ended December 31,2013 2012 2011 2010 2009
NET ASSET VALUE, BEGINNING OF YEAR $6.70 $5.96 $7.57 $7.27 $5.90
Income from investment operationsNet investment income . . . . . . . . . . . . . . . . . . . . . . . . . . . . . . . 0.14 0.16 0.16(a) 0.14(a) 0.18(a)Net realized and unrealized gain (loss) on investments . . . . 1.43 0.87 (1.40) 0.27 1.35
Total from investment operations 1.57 1.03 (1.24) 0.41 1.53
DistributionsNet investment income . . . . . . . . . . . . . . . . . . . . . . . . . . . . . . . (0.14) (0.16) (0.27)(c) (0.11) (0.13)(c)Net realized gain . . . . . . . . . . . . . . . . . . . . . . . . . . . . . . . . . . . . — — — — —Return of capital . . . . . . . . . . . . . . . . . . . . . . . . . . . . . . . . . . . . — (0.13) (0.10)(c) — (0.03)(c)
Total distributions (0.14) (0.29) (0.37) (0.11) (0.16)
Redemption fee —(b) —(b) —(b) —(b) —(b)
NET ASSET VALUE, END OF YEAR $8.13 $6.70 $5.96 $7.57 $7.27
TOTAL RETURN 23.44% 17.41% (16.55)% 5.73% 25.93%
RATIOS/SUPPLEMENTAL DATA
Net assets, end of year (thousands) . . . . . . . . . . . . . . . . . . . . . . $215,048 $169,382 $144,421 $135,455 $122,920Ratio of gross expenses before voluntary expense limitation to
average net assets . . . . . . . . . . . . . . . . . . . . . . . . . . . . . . . . . . 0.96% 0.99% 1.00% 1.02% 1.06%Ratio of net investment income to average net assets . . . . . . . . 1.95% 2.47% 2.44%(a) 2.08%(a) 2.23%(a)Ratio of expenses to average net assets . . . . . . . . . . . . . . . . . . . 0.96% 0.99% 0.99%(a) 0.99%(a) 0.99%(a)Portfolio turnover rate . . . . . . . . . . . . . . . . . . . . . . . . . . . . . . . . . . 19% 23% 34% 44% 47%
(a) Excludes excess investment management fees and otherexpenses in accordance with the Expense Limitation Agreementwith RE Advisers.
(b) Less than $0.01 per share.
(c) Revised to reflect distributions from return of capital per sharewhich were previously reported as distributions from netinvestment income per share. Previously reported amounts weredistributions from net investment income per share of $0.37 and$0.16 in 2011 and 2009 respectively. These revisions did notimpact net assets, total distributions or total return. Refer to Note 2of the Financial Statements for further details.
The accompanying notes are an integral part of these financial statements. Financial Highlights 65

Notes to Financial Statements
1. ORGANIZATIONHomestead Funds, Inc. (“Homestead Funds”) is a Marylandcorporation registered with the Securities and Exchange Commissionunder the Investment Company Act of 1940, as amended (“the Act”),as an open-end management investment company. Homestead Fundscurrently consists of eight funds: Daily Income Fund, Short-TermGovernment Securities Fund, Short-Term Bond Fund, Stock IndexFund, Value Fund, Growth Fund, Small-Company Stock Fund, andInternational Value Fund (the “Funds”).
Each Fund is a separate investment portfolio with distinct investmentobjectives, investment programs, policies and restrictions. Theinvestment objectives of the Funds, as well as the nature and risks ofthe investment activities of each Fund, are set forth more fully inHomestead Funds’ Prospectus and Statement of Additional Information.
The Stock Index Fund seeks to achieve its investment objective byinvesting substantially all of its investable assets in one or moresecurities that are designed to track the performance of the S&P 500Index. At December 31, 2013, the Stock Index Fund was operating as afeeder fund, whereby substantially all of its assets are invested in theS&P 500 Stock Master Portfolio (“Master Portfolio”), an open-endinvestment company managed by BlackRock Fund Advisors. AtDecember 31, 2013, the Stock Index Fund’s investment constituted1.96% of the Master Portfolio. The financial statements of the MasterPortfolio are contained in the Appendix of this report and should be readin conjunction with the financial statements for the Stock Index Fund.
2. SUMMARY OF SIGNIFICANT ACCOUNTING POLICIESSecurity Valuation: Each Fund’s net asset value per share isdetermined as of the close of the New York Stock Exchange (“NYSE”)(usually 4:00 p.m. ET), each day that the NYSE is open for business.The Funds use independent pricing services approved by the Funds’Board of Directors (“Board”) to value the investments. In the event apricing service is unable to provide a price for a particular security orthe price is deemed unreliable, the security is priced at fair value by theFunds’ Adviser, as determined in good faith in accordance with policiesapproved by the Board.
The Board has adopted Portfolio Securities Valuation Policies andProcedures (“Valuation Procedures”) to determine the fair value ofsecurities for which the market prices are not readily available or if theprice is deemed unreliable. The Board has delegated the day-to-dayresponsibility for determining the fair value of securities to the Adviserand the Funds’ sub-advisors. RE Advisers has chartered an internalValuation Committee to oversee the implementation of the ValuationProcedures, oversee the fair valuation decisions of the sub-advisors,monitor the valuation process, and provide quarterly reports to theBoard. The Valuation Committee reports all instances of fair valuationto the Board at each quarterly Board meeting, as applicable.
Generally Accepted Accounting Principles (GAAP) establish adisclosure hierarchy that categorizes the inputs used to value assetsand liabilities at measurement date. These inputs are summarized intothree broad levels as follows:
‰ Level 1—quoted prices in active markets for identicalinvestments;
‰ Level 2—other significant observable inputs (including quotedprices for similar investments, interest rates, prepaymentspeeds, credit risk, etc.); and
‰ Level 3—significant unobservable inputs (including the Fund’sown assumptions in determining the fair valuation ofinvestments).
The inputs or methodologies used to value securities are notnecessarily an indication of the risk associated with investing in thosesecurities. Changes in valuation techniques may result in transfers inor out of an investment’s assigned level within the hierarchy during theperiod.
The Funds use the following valuation techniques to value securitiesby major category as follows:
Registered investment companies are valued at the net asset valuedetermined by the registered investment company after the close of theNYSE. The Funds invest in regulated investment companies that seekto maintain a share price of $1.00 and are categorized as Level 1 in thehierarchy.
Domestic equity securities and exchange traded funds for whichmarket quotations are readily available are valued at the closing priceas reported by an independent pricing service from the primary marketin which the securities trade and are categorized as Level 1.
Foreign equity securities are valued based on the closing price fromthe principal market in which such securities are normally traded. Anindependent pricing service is utilized to fair value foreign equitysecurities based on the impact of market events between the close ofthe foreign exchange and the time the net asset value is calculated.Foreign equity securities that are fair valued are categorized as Level 2in the hierarchy and foreign equity securities not fair valued arecategorized as Level 1.
The valuations for fixed income securities, including corporate,government, municipal, mortgage-backed and asset-backed aretypically the prices provided by independent third party pricingservices, which may use market prices, broker/dealer quotations or avariety of valuation techniques and methodologies, such as benchmarkyields, monthly payment information and issuer spreads.
Fixed income securities utilizing these methods are generallycategorized as Level 2. Fixed income securities that are valued usingonly a broker quote are categorized as Level 3, absent corroboratingmarket data to support the valuation.
Fixed income securities and commercial paper held in the DailyIncome Fund are valued at amortized cost and are categorized asLevel 2 in the hierarchy. Short-term fixed income securities held inportfolios other than the Daily Income Fund and that mature in 60 daysor less at time of purchase are valued at amortized cost, unless it isdetermined that using this method would not reflect the security’s fairvalue and are categorized as Level 2 in the hierarchy. Under theamortized cost method, discounts and premiums on securitiespurchased are amortized over the lives of the respective securities.
66 Notes to Financial Statements
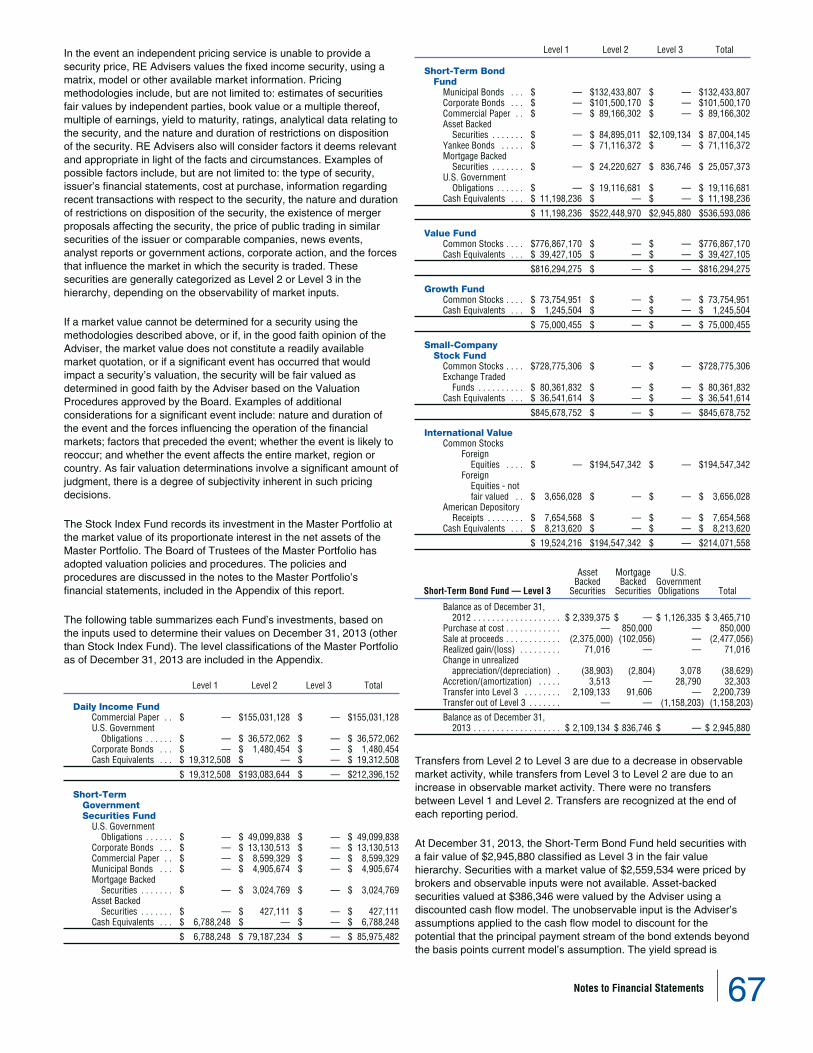
In the event an independent pricing service is unable to provide asecurity price, RE Advisers values the fixed income security, using amatrix, model or other available market information. Pricingmethodologies include, but are not limited to: estimates of securitiesfair values by independent parties, book value or a multiple thereof,multiple of earnings, yield to maturity, ratings, analytical data relating tothe security, and the nature and duration of restrictions on dispositionof the security. RE Advisers also will consider factors it deems relevantand appropriate in light of the facts and circumstances. Examples ofpossible factors include, but are not limited to: the type of security,issuer’s financial statements, cost at purchase, information regardingrecent transactions with respect to the security, the nature and durationof restrictions on disposition of the security, the existence of mergerproposals affecting the security, the price of public trading in similarsecurities of the issuer or comparable companies, news events,analyst reports or government actions, corporate action, and the forcesthat influence the market in which the security is traded. Thesesecurities are generally categorized as Level 2 or Level 3 in thehierarchy, depending on the observability of market inputs.
If a market value cannot be determined for a security using themethodologies described above, or if, in the good faith opinion of theAdviser, the market value does not constitute a readily availablemarket quotation, or if a significant event has occurred that wouldimpact a security’s valuation, the security will be fair valued asdetermined in good faith by the Adviser based on the ValuationProcedures approved by the Board. Examples of additionalconsiderations for a significant event include: nature and duration ofthe event and the forces influencing the operation of the financialmarkets; factors that preceded the event; whether the event is likely toreoccur; and whether the event affects the entire market, region orcountry. As fair valuation determinations involve a significant amount ofjudgment, there is a degree of subjectivity inherent in such pricingdecisions.
The Stock Index Fund records its investment in the Master Portfolio atthe market value of its proportionate interest in the net assets of theMaster Portfolio. The Board of Trustees of the Master Portfolio hasadopted valuation policies and procedures. The policies andprocedures are discussed in the notes to the Master Portfolio’sfinancial statements, included in the Appendix of this report.
The following table summarizes each Fund’s investments, based onthe inputs used to determine their values on December 31, 2013 (otherthan Stock Index Fund). The level classifications of the Master Portfolioas of December 31, 2013 are included in the Appendix.
Level 1 Level 2 Level 3 Total
Daily Income FundCommercial Paper . . $ — $155,031,128 $ — $155,031,128U.S. Government
Obligations . . . . . . $ — $ 36,572,062 $ — $ 36,572,062Corporate Bonds . . . $ — $ 1,480,454 $ — $ 1,480,454Cash Equivalents . . . $ 19,312,508 $ — $ — $ 19,312,508
$ 19,312,508 $193,083,644 $ — $212,396,152
Short-TermGovernmentSecurities Fund
U.S. GovernmentObligations . . . . . . $ — $ 49,099,838 $ — $ 49,099,838
Corporate Bonds . . . $ — $ 13,130,513 $ — $ 13,130,513Commercial Paper . . $ — $ 8,599,329 $ — $ 8,599,329Municipal Bonds . . . $ — $ 4,905,674 $ — $ 4,905,674Mortgage Backed
Securities . . . . . . . $ — $ 3,024,769 $ — $ 3,024,769Asset Backed
Securities . . . . . . . $ — $ 427,111 $ — $ 427,111Cash Equivalents . . . $ 6,788,248 $ — $ — $ 6,788,248
$ 6,788,248 $ 79,187,234 $ — $ 85,975,482
Level 1 Level 2 Level 3 Total
Short-Term BondFund
Municipal Bonds . . . $ — $132,433,807 $ — $132,433,807Corporate Bonds . . . $ — $101,500,170 $ — $101,500,170Commercial Paper . . $ — $ 89,166,302 $ — $ 89,166,302Asset Backed
Securities . . . . . . . $ — $ 84,895,011 $2,109,134 $ 87,004,145Yankee Bonds . . . . . $ — $ 71,116,372 $ — $ 71,116,372Mortgage Backed
Securities . . . . . . . $ — $ 24,220,627 $ 836,746 $ 25,057,373U.S. Government
Obligations . . . . . . $ — $ 19,116,681 $ — $ 19,116,681Cash Equivalents . . . $ 11,198,236 $ — $ — $ 11,198,236
$ 11,198,236 $522,448,970 $2,945,880 $536,593,086
Value FundCommon Stocks . . . . $776,867,170 $ — $ — $776,867,170Cash Equivalents . . . $ 39,427,105 $ — $ — $ 39,427,105
$816,294,275 $ — $ — $816,294,275
Growth FundCommon Stocks . . . . $ 73,754,951 $ — $ — $ 73,754,951Cash Equivalents . . . $ 1,245,504 $ — $ — $ 1,245,504
$ 75,000,455 $ — $ — $ 75,000,455
Small-CompanyStock Fund
Common Stocks . . . . $728,775,306 $ — $ — $728,775,306Exchange Traded
Funds . . . . . . . . . . $ 80,361,832 $ — $ — $ 80,361,832Cash Equivalents . . . $ 36,541,614 $ — $ — $ 36,541,614
$845,678,752 $ — $ — $845,678,752
International ValueCommon Stocks
ForeignEquities . . . . $ — $194,547,342 $ — $194,547,342
ForeignEquities - notfair valued . . $ 3,656,028 $ — $ — $ 3,656,028
American DepositoryReceipts . . . . . . . . $ 7,654,568 $ — $ — $ 7,654,568
Cash Equivalents . . . $ 8,213,620 $ — $ — $ 8,213,620
$ 19,524,216 $194,547,342 $ — $214,071,558
Short-Term Bond Fund — Level 3
AssetBacked
Securities
MortgageBacked
Securities
U.S.GovernmentObligations Total
Balance as of December 31,2012 . . . . . . . . . . . . . . . . . . . $ 2,339,375 $ — $ 1,126,335 $ 3,465,710
Purchase at cost . . . . . . . . . . . . — 850,000 — 850,000Sale at proceeds . . . . . . . . . . . . (2,375,000) (102,056) — (2,477,056)Realized gain/(loss) . . . . . . . . . 71,016 — — 71,016Change in unrealized
appreciation/(depreciation) . (38,903) (2,804) 3,078 (38,629)Accretion/(amortization) . . . . . 3,513 — 28,790 32,303Transfer into Level 3 . . . . . . . . 2,109,133 91,606 — 2,200,739Transfer out of Level 3 . . . . . . . — — (1,158,203) (1,158,203)
Balance as of December 31,2013 . . . . . . . . . . . . . . . . . . . $ 2,109,134 $ 836,746 $ — $ 2,945,880
Transfers from Level 2 to Level 3 are due to a decrease in observablemarket activity, while transfers from Level 3 to Level 2 are due to anincrease in observable market activity. There were no transfersbetween Level 1 and Level 2. Transfers are recognized at the end ofeach reporting period.
At December 31, 2013, the Short-Term Bond Fund held securities witha fair value of $2,945,880 classified as Level 3 in the fair valuehierarchy. Securities with a market value of $2,559,534 were priced bybrokers and observable inputs were not available. Asset-backedsecurities valued at $386,346 were valued by the Adviser using adiscounted cash flow model. The unobservable input is the Adviser’sassumptions applied to the cash flow model to discount for thepotential that the principal payment stream of the bond extends beyondthe basis points current model’s assumption. The yield spread is
Notes to Financial Statements 67
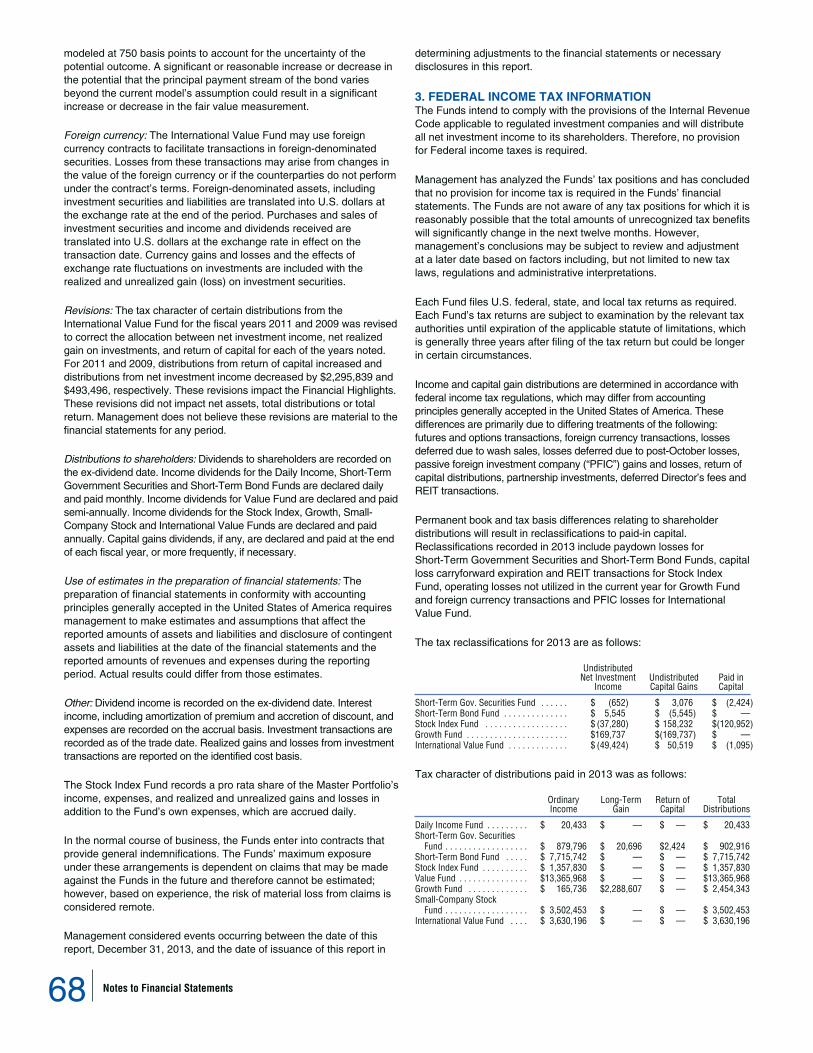
modeled at 750 basis points to account for the uncertainty of thepotential outcome. A significant or reasonable increase or decrease inthe potential that the principal payment stream of the bond variesbeyond the current model’s assumption could result in a significantincrease or decrease in the fair value measurement.
Foreign currency: The International Value Fund may use foreigncurrency contracts to facilitate transactions in foreign-denominatedsecurities. Losses from these transactions may arise from changes inthe value of the foreign currency or if the counterparties do not performunder the contract’s terms. Foreign-denominated assets, includinginvestment securities and liabilities are translated into U.S. dollars atthe exchange rate at the end of the period. Purchases and sales ofinvestment securities and income and dividends received aretranslated into U.S. dollars at the exchange rate in effect on thetransaction date. Currency gains and losses and the effects ofexchange rate fluctuations on investments are included with therealized and unrealized gain (loss) on investment securities.
Revisions: The tax character of certain distributions from theInternational Value Fund for the fiscal years 2011 and 2009 was revisedto correct the allocation between net investment income, net realizedgain on investments, and return of capital for each of the years noted.For 2011 and 2009, distributions from return of capital increased anddistributions from net investment income decreased by $2,295,839 and$493,496, respectively. These revisions impact the Financial Highlights.These revisions did not impact net assets, total distributions or totalreturn. Management does not believe these revisions are material to thefinancial statements for any period.
Distributions to shareholders: Dividends to shareholders are recorded onthe ex-dividend date. Income dividends for the Daily Income, Short-TermGovernment Securities and Short-Term Bond Funds are declared dailyand paid monthly. Income dividends for Value Fund are declared and paidsemi-annually. Income dividends for the Stock Index, Growth, Small-Company Stock and International Value Funds are declared and paidannually. Capital gains dividends, if any, are declared and paid at the endof each fiscal year, or more frequently, if necessary.
Use of estimates in the preparation of financial statements: Thepreparation of financial statements in conformity with accountingprinciples generally accepted in the United States of America requiresmanagement to make estimates and assumptions that affect thereported amounts of assets and liabilities and disclosure of contingentassets and liabilities at the date of the financial statements and thereported amounts of revenues and expenses during the reportingperiod. Actual results could differ from those estimates.
Other: Dividend income is recorded on the ex-dividend date. Interestincome, including amortization of premium and accretion of discount, andexpenses are recorded on the accrual basis. Investment transactions arerecorded as of the trade date. Realized gains and losses from investmenttransactions are reported on the identified cost basis.
The Stock Index Fund records a pro rata share of the Master Portfolio’sincome, expenses, and realized and unrealized gains and losses inaddition to the Fund’s own expenses, which are accrued daily.
In the normal course of business, the Funds enter into contracts thatprovide general indemnifications. The Funds’ maximum exposureunder these arrangements is dependent on claims that may be madeagainst the Funds in the future and therefore cannot be estimated;however, based on experience, the risk of material loss from claims isconsidered remote.
Management considered events occurring between the date of thisreport, December 31, 2013, and the date of issuance of this report in
determining adjustments to the financial statements or necessarydisclosures in this report.
3. FEDERAL INCOME TAX INFORMATIONThe Funds intend to comply with the provisions of the Internal RevenueCode applicable to regulated investment companies and will distributeall net investment income to its shareholders. Therefore, no provisionfor Federal income taxes is required.
Management has analyzed the Funds’ tax positions and has concludedthat no provision for income tax is required in the Funds’ financialstatements. The Funds are not aware of any tax positions for which it isreasonably possible that the total amounts of unrecognized tax benefitswill significantly change in the next twelve months. However,management’s conclusions may be subject to review and adjustmentat a later date based on factors including, but not limited to new taxlaws, regulations and administrative interpretations.
Each Fund files U.S. federal, state, and local tax returns as required.Each Fund’s tax returns are subject to examination by the relevant taxauthorities until expiration of the applicable statute of limitations, whichis generally three years after filing of the tax return but could be longerin certain circumstances.
Income and capital gain distributions are determined in accordance withfederal income tax regulations, which may differ from accountingprinciples generally accepted in the United States of America. Thesedifferences are primarily due to differing treatments of the following:futures and options transactions, foreign currency transactions, lossesdeferred due to wash sales, losses deferred due to post-October losses,passive foreign investment company (“PFIC”) gains and losses, return ofcapital distributions, partnership investments, deferred Director’s fees andREIT transactions.
Permanent book and tax basis differences relating to shareholderdistributions will result in reclassifications to paid-in capital.Reclassifications recorded in 2013 include paydown losses forShort-Term Government Securities and Short-Term Bond Funds, capitalloss carryforward expiration and REIT transactions for Stock IndexFund, operating losses not utilized in the current year for Growth Fundand foreign currency transactions and PFIC losses for InternationalValue Fund.
The tax reclassifications for 2013 are as follows:
UndistributedNet Investment
IncomeUndistributedCapital Gains
Paid inCapital
Short-Term Gov. Securities Fund . . . . . . $ (652) $ 3,076 $ (2,424)Short-Term Bond Fund . . . . . . . . . . . . . . $ 5,545 $ (5,545) $ —Stock Index Fund . . . . . . . . . . . . . . . . . . $ (37,280) $ 158,232 $(120,952)Growth Fund . . . . . . . . . . . . . . . . . . . . . . $169,737 $(169,737) $ —International Value Fund . . . . . . . . . . . . . $ (49,424) $ 50,519 $ (1,095)
Tax character of distributions paid in 2013 was as follows:
OrdinaryIncome
Long-TermGain
Return ofCapital
TotalDistributions
Daily Income Fund . . . . . . . . . $ 20,433 $ — $ — $ 20,433Short-Term Gov. Securities
Fund . . . . . . . . . . . . . . . . . . $ 879,796 $ 20,696 $2,424 $ 902,916Short-Term Bond Fund . . . . . $ 7,715,742 $ — $ — $ 7,715,742Stock Index Fund . . . . . . . . . . $ 1,357,830 $ — $ — $ 1,357,830Value Fund . . . . . . . . . . . . . . . $13,365,968 $ — $ — $13,365,968Growth Fund . . . . . . . . . . . . . $ 165,736 $2,288,607 $ — $ 2,454,343Small-Company Stock
Fund . . . . . . . . . . . . . . . . . . $ 3,502,453 $ — $ — $ 3,502,453International Value Fund . . . . $ 3,630,196 $ — $ — $ 3,630,196
68 Notes to Financial Statements

Tax character of distributions paid in 2012 was as follows:
OrdinaryIncome
Long-TermGain
Return ofCapital
TotalDistributions
Daily Income Fund . . . . . . . $ 19,966 $ — $ — $ 19,966Short-Term Gov. Securities
Fund . . . . . . . . . . . . . . . . $ 1,101,945 $ 62,442 $ — $ 1,164,387Short-Term Bond Fund . . . . $10,216,896 $ — $ — $10,216,896Stock Index Fund . . . . . . . . $ 1,173,069 $ — $ — $ 1,173,069Value Fund . . . . . . . . . . . . . $12,479,522 $ — $ — $12,479,522Growth Fund . . . . . . . . . . . . $ 2,732 $2,511,235 $ — $ 2,513,967Small-Company Stock
Fund . . . . . . . . . . . . . . . . $ 3,091,883 $ 927,135 $ — $ 4,019,018International Value Fund . . . $ 3,774,702 $ — $3,223,967 $ 6,998,669
The tax character of distributable earnings/(accumulated losses) atDecember 31, 2013 was as follows:
UndistributedOrdinaryIncome
UndistributedLong-Term
Gain
NetUnrealized
Appreciation/Depreciation
Capital LossCarryforward/
Late YearLoss Deferral
Daily Income Fund . . $ — $ — $ — $ —Short-Term Gov.
Securities Fund . . . $ — $ — $ 148,892 $ —Short-Term Bond
Fund . . . . . . . . . . . $ — $ — $ 2,270,121 $ (462,385)1
Stock Index Fund . . . $ 107 $ — $ 56,245,000 $ (9,228,496)2
Value Fund . . . . . . . . $ — $ — $372,850,500 $ (4,691,402)3
Growth Fund . . . . . . . $147,070 $637,048 $ 22,246,159 $ —Small-Company Stock
Fund . . . . . . . . . . . $ — $ — $265,829,837 $ —International Value
Fund . . . . . . . . . . . $ — $ — $ 41,405,945 $(29,660,940)4
1 Short-Term Bond Fund : $462,385 expires in 2018.2 Stock Index Fund: $2,916,408 expires in 2016, $1,852,602 expires in 2017, $2,955,984
expires in 2018, and $1,503,502 has no expiration.3 Value Fund: $2,579,300 expires in 2017 and $2,112,102 has no expiration.4 International Value Fund: Late year loss deferral $1,037,638. $359,970 expires in 2016,
$16,584,336 expires in 2017, $5,368,193 expires in 2018, and $6,310,803 has noexpiration.
On December 22, 2010, the Regulated Investment CompanyModernization Act of 2010 (the “Act”) was enacted. Under the Act, netcapital losses may be carried forward indefinitely, and their character isretained as short term and/or long-term losses. Previously, net capitallosses were carried forward for eight years and treated as short termlosses. As a transition rule, the Act requires that postenactment netcapital losses be used before pre-enactment net capital losses. As aresult of this ordering rule, pre-enactment capital loss carryforwardsmay expire unused, whereas under the previous rules these lossesmay have been utilized. This change is effective for fiscal yearsbeginning after the date of enactment.
Short-Term Bond Fund and Stock Index Fund utilized $52,330 and$209,717 of capital loss carryforwards, respectively, in 2013. $120,952of capital loss carryforwards for the Stock Index Fund expired in 2013.
At December 31, 2013, the cost of securities for federal income taxpurposes, the aggregate gross unrealized gain for all securities forwhich there was an excess of value over tax cost and the aggregategross unrealized loss for all securities for which there was an excess oftax cost over value was as follows:
Tax Cost
TaxUnrealized
Gain
TaxUnrealized
(Loss)
NetUnrealizedGain (Loss)
Daily Income Fund . . . . . $212,396,152 $ — $ — $ —Short-Term Government
Securities Fund . . . . . . $ 85,826,590 $ 691,324 $ (542,432) $ 148,892Short-Term Bond
Fund . . . . . . . . . . . . . . $534,322,965 $ 6,971,825 $(4,701,704) $ 2,270,121Value Fund . . . . . . . . . . . $443,443,775 $378,794,525 $(5,944,025) $372,850,500Growth Fund . . . . . . . . . . $ 52,754,296 $ 22,270,178 $ (24,019) $ 22,246,159Small-Company Stock
Fund . . . . . . . . . . . . . . $579,848,915 $268,261,267 $(2,431,430) $265,829,837International Value
Fund . . . . . . . . . . . . . . $172,677,022 $ 46,429,100 $(5,034,564) $ 41,394,536
Net unrealized appreciation/(depreciation) of Stock Index Fund in theMaster Portfolio consists of an allocated portion of the portfolio’sunrealized appreciation/(depreciation). For information pertaining to theunrealized appreciation/(depreciation) for the Master Portfolio, pleaserefer to the Appendix of this report.
4. INVESTMENT TRANSACTIONSPurchases and proceeds from sales of securities, other than short-termand U.S. Government securities, for the period ended December 31,2013, were as follows:
PurchasesProceedsfrom Sale
Short-Term Government Securities Fund . . . . . . . . . . . . . . 10,828,048 5,634,155Short-Term Bond Fund . . . . . . . . . . . . . . . . . . . . . . . . . . . . 194,261,082 115,115,955Value Fund . . . . . . . . . . . . . . . . . . . . . . . . . . . . . . . . . . . . . 14,011,147 29,544,092Growth Fund . . . . . . . . . . . . . . . . . . . . . . . . . . . . . . . . . . . . 33,768,250 21,204,379Small-Company Stock Fund . . . . . . . . . . . . . . . . . . . . . . . . 268,758,313 7,699,806International Value Fund . . . . . . . . . . . . . . . . . . . . . . . . . . . 34,466,946 33,788,860
Purchases and proceeds from sales of long-term U.S. Governmentsecurities, for the period ended December 31, 2013, were as follows:
PurchasesProceedsfrom Sale
Short-Term Government Securities Fund . . . . . . . . . . . . . . . . 4,959,609 19,758,843Short-Term Bond Fund . . . . . . . . . . . . . . . . . . . . . . . . . . . . . . 11,789,063 7,638,576
For information related to investment transactions for the MasterPortfolio, please refer to the Appendix of this report.
5. RELATED PARTIESThe investment management agreements between Homestead Funds,with respect to each Fund (other than the Stock Index Fund), and REAdvisers Corporation (“RE Advisers”), an indirect, wholly-ownedsubsidiary of National Rural Electric Cooperative Association(“NRECA”), provide for an annual investment management fee, thatalso provides for certain administrative services to the Funds, which iscomputed daily and paid monthly, based on each Fund’s average dailynet assets. The annualized management fee rates for the Funds are0.50% of average daily net assets for Daily Income Fund; 0.45% ofaverage daily net assets for Short-Term Government Securities Fund;0.60% of average daily net assets for Short-Term Bond Fund; 0.65% ofaverage daily net assets up to $200 million, 0.50% of average daily netassets up to the next $200 million, 0.40% of average daily net assets inexcess of $400 million for Value Fund; 0.65% of average daily netassets up to $250 million and 0.60% of average daily net assets inexcess of $250 million for the Growth Fund; 0.85% of average daily netassets up to $200 million and 0.75% of average daily net assets inexcess of $200 million for Small-Company Stock Fund; and 0.75% ofaverage daily net assets up to $300 million, 0.65% of average daily netassets up to the next $100 million, 0.55% of average daily net assetsup to the next $100 million, and 0.50% of average daily net assets inexcess of $500 million for International Value Fund.
T. Rowe Price Associates, Inc. (“T. Rowe”) is the Subadvisor for theGrowth Fund and Mercator Asset Management, L.P. (“Mercator”) is theSubadvisor for the International Value Fund. The Subadvisors select,buy, and sell securities under the oversight of RE Advisers and theBoard of Directors. RE Advisers pays the Subadvisors from the fees itreceives from the Funds.
With respect to the Stock Index Fund, an Administrative ServiceAgreement with RE Advisers has been contracted, under whichRE Advisers provides certain administrative services to the Fund.Pursuant to this agreement, RE Advisers receives a fee of 0.25% ofthe Fund’s average daily net assets. In addition, the Stock Index Fundis allocated a management fee from the Master Portfolio, calculated
Notes to Financial Statements 69

daily at an annual rate of 0.05% of its average daily net assets. Thisfee includes advisory, custody, and administrative fees provided by theMaster Portfolio on behalf of its investors. The financial information forthe Master Portfolio is included in the Appendix.
RE Advisers has agreed, as part of the Expense Limitation Agreemententered into with Homestead Funds, with respect to each Fund, towaive its management fee and/or reimburse all Fund operatingexpenses, excluding certain non-recurring expenses, which in any yearexceed 0.80% of the average daily net assets of the Daily IncomeFund and Short-Term Bond Fund, 0.75% of the average daily netassets of the Short-Term Government Securities Fund and Stock IndexFund, 1.25% of the average daily net assets of Value Fund, 0.95% ofthe average daily net assets of Growth Fund, 1.50% of the averagedaily net assets of Small-Company Stock Fund and 0.99% of theaverage daily net assets of the International Value Fund.
On August 14, 2009, RE Advisers agreed to waive fees and/orreimburse expenses, if necessary, in order to assist the Daily IncomeFund in maintaining a minimum yield. The temporary waiver continuedthroughout 2010, 2011, 2012, 2013, and through the date of issuanceof this report.
Pursuant to the Expense Limitation Agreement, management feeswaived for the year ended December 31, 2013, amounted to$1,038,445 for Daily Income Fund and $47,401 for Growth Fund.Additionally, RE Advisers paid the Daily Income Fund $110,249 duringthe period, for expense reimbursements.
Through April 30, 2013, the Stock Index, Value, Growth, Small-Company Stock, and International Value Funds each received a 2%redemption fee on shares sold within 30 days of purchase. EffectiveMay 1, 2013, this redemption fee was eliminated. None of the Fundscurrently assess a redemption fee.
Under a Deferred Compensation Plan (the “Plan”), independentDirectors of the Funds may elect to defer receipt of all or a specifiedportion of their compensation. Deferred amounts are credited with theearnings and losses equal to those made as if the deferred amountswere invested in one or more of the Funds, as designated by eachparticipating Independent Director. Deferred amounts remain in theFund until distributed in accordance with the Plan.
The Funds’ shares are sold through channels including financialintermediaries that may establish a single, omnibus account with thebeneficial owners being individual accounts within the financialintermediary. As of December 31, 2013, there are three such accountsin the Small-Company Stock Fund accounting for 26%, 15% and 13%of the outstanding shares, respectively. Additionally, 73% of theoutstanding shares of the International Value Fund are held in aretirement plan account for the benefit of its participants.
6. OTHERThe Funds may carry a temporary overdrawn balance in their accountwith State Street Bank and Trust Company, the custodian. Theseamounts are reflected on the Statement of Assets and Liabilities as“Due to custodian”. The Funds are assessed interest at the Prime Ratefor overdrafts.
70 Notes to Financial Statements

7. CAPITAL SHARE TRANSACTIONSAs of December 31, 2013, $.01 par value capital shares are authorized for each Fund as follows: 500 million for Daily Income, 200 million forShort-Term Bond Fund, and 100 million for Short-Term Government Securities, Stock Index, Value, Growth, Small-Company Stock, andInternational Value Funds. For 2013 & 2012 transactions in capital shares were as follows:
Shares Sold
Shares IssuedIn Reinvestment
of DividendsTotal Shares
IssuedTotal SharesRedeemed
Net Increase(Decrease)
Period Ended December 31, 2013
In Dollars
Daily Income Fund . . . . . . . . . . . . . . . . . . . . . . . . . . . . . . . . . . . . . . . . . . . . . . . . . $129,779,688 $ 20,065 $129,799,753 $(126,008,054) $ 3,791,699Short-Term Government Securities Fund . . . . . . . . . . . . . . . . . . . . . . . . . . . . . . $ 15,840,723 $ 877,264 $ 16,717,987 $ (23,279,735) $ (6,561,748)Short-Term Bond Fund . . . . . . . . . . . . . . . . . . . . . . . . . . . . . . . . . . . . . . . . . . . . . $193,775,301 $ 7,514,262 $201,289,563 $ (90,792,922) $110,496,641Stock Index Fund . . . . . . . . . . . . . . . . . . . . . . . . . . . . . . . . . . . . . . . . . . . . . . . . . . $ 19,752,587 $ 1,348,412 $ 21,100,999 $ (11,822,266) $ 9,278,733Value Fund . . . . . . . . . . . . . . . . . . . . . . . . . . . . . . . . . . . . . . . . . . . . . . . . . . . . . . . $100,545,390 $12,563,834 $113,109,224 $ (97,728,508) $ 15,380,716Growth Fund . . . . . . . . . . . . . . . . . . . . . . . . . . . . . . . . . . . . . . . . . . . . . . . . . . . . . $ 23,925,412 $ 2,444,697 $ 26,370,109 $ (10,910,715) $ 15,459,394Small-Company Stock Fund . . . . . . . . . . . . . . . . . . . . . . . . . . . . . . . . . . . . . . . . . $389,482,681 $ 3,186,693 $392,669,374 $(121,195,259) $271,474,115International Value Fund . . . . . . . . . . . . . . . . . . . . . . . . . . . . . . . . . . . . . . . . . . . . $ 32,016,846 $ 3,615,203 $ 35,632,049 $ (27,133,518) $ 8,498,531
In Shares
Daily Income Fund . . . . . . . . . . . . . . . . . . . . . . . . . . . . . . . . . . . . . . . . . . . . . . . . . 129,779,688 20,065 129,799,753 (126,008,054) 3,791,699Short-Term Government Securities Fund . . . . . . . . . . . . . . . . . . . . . . . . . . . . . . 3,020,796 167,566 3,188,362 (4,444,578) (1,256,216)Short-Term Bond Fund . . . . . . . . . . . . . . . . . . . . . . . . . . . . . . . . . . . . . . . . . . . . . 37,025,624 1,435,827 38,461,451 (17,356,172) 21,105,279Stock Index Fund . . . . . . . . . . . . . . . . . . . . . . . . . . . . . . . . . . . . . . . . . . . . . . . . . . 1,617,306 98,153 1,715,459 (965,292) 750,167Value Fund . . . . . . . . . . . . . . . . . . . . . . . . . . . . . . . . . . . . . . . . . . . . . . . . . . . . . . . 2,481,032 295,235 2,776,267 (2,433,185) 343,082Growth Fund . . . . . . . . . . . . . . . . . . . . . . . . . . . . . . . . . . . . . . . . . . . . . . . . . . . . . 3,459,874 308,673 3,768,547 (1,630,116) 2,138,431Small-Company Stock Fund . . . . . . . . . . . . . . . . . . . . . . . . . . . . . . . . . . . . . . . . . 12,161,540 86,458 12,247,998 (3,726,112) 8,521,886International Value Fund . . . . . . . . . . . . . . . . . . . . . . . . . . . . . . . . . . . . . . . . . . . . 4,356,777 444,676 4,801,453 (3,647,591) 1,153,862
Year Ended December 31, 2012
In Dollars
Daily Income Fund . . . . . . . . . . . . . . . . . . . . . . . . . . . . . . . . . . . . . . . . . . . . . . . . . $115,149,422 $ 19,655 $115,169,077 $(101,803,897) $ 13,365,180Short-Term Government Securities Fund . . . . . . . . . . . . . . . . . . . . . . . . . . . . . . $ 24,267,697 $ 1,130,656 $ 25,398,353 $ (15,955,329) $ 9,443,024Short-Term Bond Fund . . . . . . . . . . . . . . . . . . . . . . . . . . . . . . . . . . . . . . . . . . . . . $107,305,483 $ 9,932,205 $117,237,688 $ (72,655,931) $ 44,581,757Stock Index Fund . . . . . . . . . . . . . . . . . . . . . . . . . . . . . . . . . . . . . . . . . . . . . . . . . . $ 10,044,306 $ 1,167,828 $ 11,212,134 $ (9,923,767) $ 1,288,367Value Fund . . . . . . . . . . . . . . . . . . . . . . . . . . . . . . . . . . . . . . . . . . . . . . . . . . . . . . . $ 77,570,759 $11,883,046 $ 89,453,805 $ (89,243,295) $ 210,510Growth Fund . . . . . . . . . . . . . . . . . . . . . . . . . . . . . . . . . . . . . . . . . . . . . . . . . . . . . $ 15,535,165 $ 2,505,652 $ 18,040,817 $ (11,986,766) $ 6,054,051Small-Company Stock Fund . . . . . . . . . . . . . . . . . . . . . . . . . . . . . . . . . . . . . . . . . $215,404,441 $ 3,546,846 $218,951,287 $ (65,197,680) $153,753,607International Value Fund . . . . . . . . . . . . . . . . . . . . . . . . . . . . . . . . . . . . . . . . . . . . $ 33,032,382 $ 6,965,182 $ 39,997,564 $ (34,255,949) $ 5,741,615
In Shares
Daily Income Fund . . . . . . . . . . . . . . . . . . . . . . . . . . . . . . . . . . . . . . . . . . . . . . . . . 115,149,422 19,655 115,169,077 (101,803,897) 13,365,180Short-Term Government Securities Fund . . . . . . . . . . . . . . . . . . . . . . . . . . . . . . 4,601,465 214,244 4,815,709 (3,024,456) 1,791,253Short-Term Bond Fund . . . . . . . . . . . . . . . . . . . . . . . . . . . . . . . . . . . . . . . . . . . . . 20,706,257 1,916,154 22,622,411 (14,022,677) 8,599,734Stock Index Fund . . . . . . . . . . . . . . . . . . . . . . . . . . . . . . . . . . . . . . . . . . . . . . . . . . 977,397 110,516 1,087,913 (962,047) 125,866Value Fund . . . . . . . . . . . . . . . . . . . . . . . . . . . . . . . . . . . . . . . . . . . . . . . . . . . . . . . 2,348,226 356,365 2,704,591 (2,694,873) 9,718Growth Fund . . . . . . . . . . . . . . . . . . . . . . . . . . . . . . . . . . . . . . . . . . . . . . . . . . . . . 2,664,126 438,803 3,102,929 (2,048,175) 1,054,754Small-Company Stock Fund . . . . . . . . . . . . . . . . . . . . . . . . . . . . . . . . . . . . . . . . . 8,513,982 130,881 8,644,863 (2,557,606) 6,087,257International Value Fund . . . . . . . . . . . . . . . . . . . . . . . . . . . . . . . . . . . . . . . . . . . . 5,266,567 1,064,954 6,331,521 (5,265,214) 1,066,307
Notes to Financial Statements 71

I N D E P E N D E N T
Directors and Officers(Unaudited)
Each Director serves until his resignation, removal by the board or until his successor is duly elected and qualified. The Statement of Additional Information(“SAI”) has additional information about the Funds’ Directors and officers and is available online at homesteadfunds.com and, without charge, upon request bycalling 800-258-3030.
NAME, ADDRESS ANDDATE OF BIRTH
POSITION(S)HELD WITHTHE FUND
TERM OF OFFICEAND LENGTHOF TIME SERVED
PRINCIPAL OCCUPATION(S)DURING PAST FIVE YEARS
NUMBER OFPORTFOLIOSOVERSEENBY DIRECTOR
OTHERDIRECTORSHIPSHELD BYDIRECTOR
James F. Perna
4301 Wilson BoulevardArlington, VA 22203
12/01/47
Director
Chairman of theBoard
Member ofAudit Committee
Member ofCompensationCommittee
1990-Present Solo Practitioner(attorney)(2008-Present)
Of Counsel, Krooth & Altman LLP(law firm)(2008-Present)
Partner, Krooth & Altman LLP(1981-2007)
8 None
Douglas W. Johnson
4301 Wilson BoulevardArlington, VA 22203
06/02/55
Director
Chairman ofAudit Committee
Member ofCompensationCommittee
2003-Present CEO, Blue Ridge(Electric Membership Corporation)(1979-Present)
8 None
Kenneth R. Meyer
4301 Wilson BoulevardArlington, VA 22203
08/11/44
Director
Chairman ofCompensationCommittee
Member ofAudit Committee
2005-Present Retired(2004-Present)
8 None
Anthony M. Marinello
4301 Wilson BoulevardArlington, VA 22203
04/13/46
Director
Member ofAudit Committee
Member ofCompensationCommittee
1990-Present Retired(2004-Present)
8 None
Sheldon C. Petersen
4301 Wilson BoulevardArlington, VA 22203
02/21/53
Director
Member ofAudit Committee
Member ofCompensationCommittee
2005-Present CEO, National Rural Utilities CooperativeFinance Corporation(1995-Present)
8 None
Mark Rose
4301 Wilson BoulevardArlington, VA 22203
04/19/53
Director
Member ofAudit Committee
Member ofCompensationCommittee
2005-Present CEO and General Manager, BluebonnetElectric Cooperative(2002-Present)
8 None
72 Directors and Officers

NAME, ADDRESS ANDDATE OF BIRTH
POSITION(S)HELD WITHTHE FUND
TERM OF OFFICEAND LENGTHOF TIME SERVED
PRINCIPAL OCCUPATION(S)DURING PAST FIVE YEARS
NUMBER OFPORTFOLIOSOVERSEENBY DIRECTOR
OTHERDIRECTORSHIPSHELD BYDIRECTOR
Peter J. Tonetti
4301 Wilson BoulevardArlington, Virginia 22203
02/11/53
Director
Member ofAudit Committee
Member ofCompensationCommittee
2010-Present Chief Investment Officer, Hamilton College(2008-Present)
Senior Director, Pension Finance andInvestments at Philips Electrics NorthAmerica Corporation(electronics manufacturer)(1988-2008)
8 None
Anthony C. Williams
4301 Wilson BoulevardArlington, VA 22203
01/02/42
Director
Member ofAudit Committee
Member ofCompensationCommittee
1990-Present Retired(2000-Present)
8 None
Directors and Officers 73
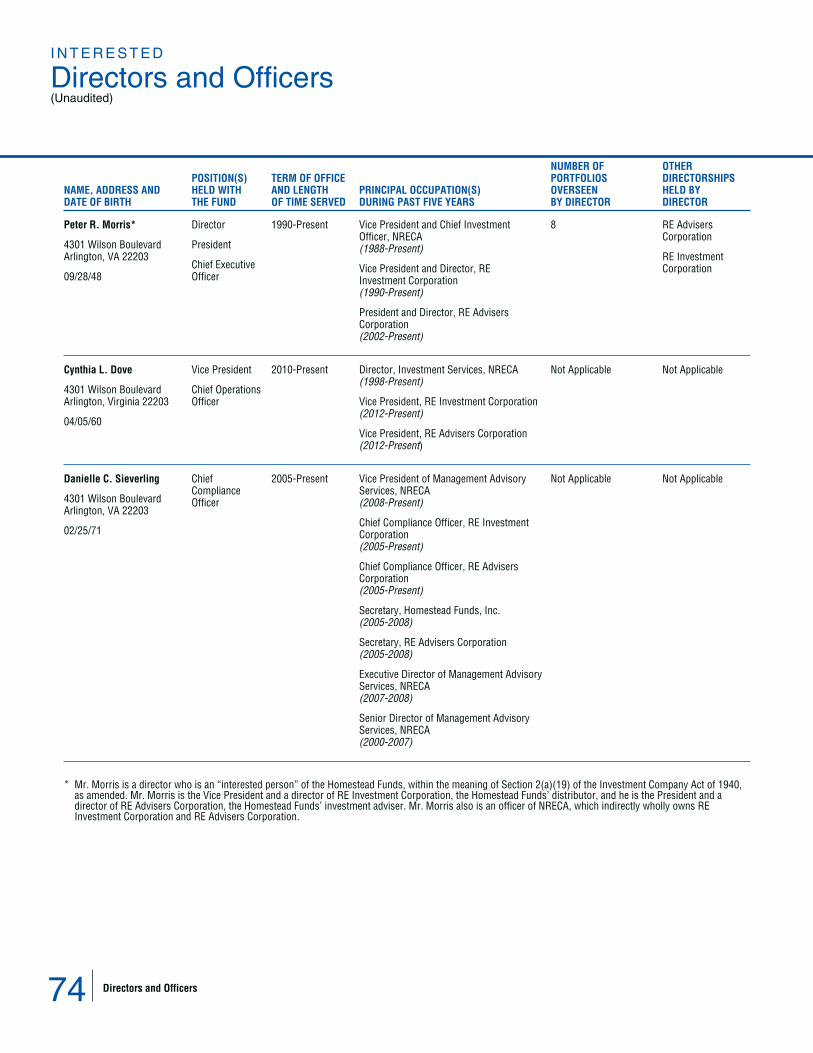
I N T E R E S T E D
Directors and Officers(Unaudited)
NAME, ADDRESS ANDDATE OF BIRTH
POSITION(S)HELD WITHTHE FUND
TERM OF OFFICEAND LENGTHOF TIME SERVED
PRINCIPAL OCCUPATION(S)DURING PAST FIVE YEARS
NUMBER OFPORTFOLIOSOVERSEENBY DIRECTOR
OTHERDIRECTORSHIPSHELD BYDIRECTOR
Peter R. Morris*
4301 Wilson BoulevardArlington, VA 22203
09/28/48
Director
President
Chief ExecutiveOfficer
1990-Present Vice President and Chief InvestmentOfficer, NRECA(1988-Present)
Vice President and Director, REInvestment Corporation(1990-Present)
President and Director, RE AdvisersCorporation(2002-Present)
8 RE AdvisersCorporation
RE InvestmentCorporation
Cynthia L. Dove
4301 Wilson BoulevardArlington, Virginia 22203
04/05/60
Vice President
Chief OperationsOfficer
2010-Present Director, Investment Services, NRECA(1998-Present)
Vice President, RE Investment Corporation(2012-Present)
Vice President, RE Advisers Corporation(2012-Present)
Not Applicable Not Applicable
Danielle C. Sieverling
4301 Wilson BoulevardArlington, VA 22203
02/25/71
ChiefComplianceOfficer
2005-Present Vice President of Management AdvisoryServices, NRECA(2008-Present)
Chief Compliance Officer, RE InvestmentCorporation(2005-Present)
Chief Compliance Officer, RE AdvisersCorporation(2005-Present)
Secretary, Homestead Funds, Inc.(2005-2008)
Secretary, RE Advisers Corporation(2005-2008)
Executive Director of Management AdvisoryServices, NRECA(2007-2008)
Senior Director of Management AdvisoryServices, NRECA(2000-2007)
Not Applicable Not Applicable
* Mr. Morris is a director who is an “interested person” of the Homestead Funds, within the meaning of Section 2(a)(19) of the Investment Company Act of 1940,as amended. Mr. Morris is the Vice President and a director of RE Investment Corporation, the Homestead Funds’ distributor, and he is the President and adirector of RE Advisers Corporation, the Homestead Funds’ investment adviser. Mr. Morris also is an officer of NRECA, which indirectly wholly owns REInvestment Corporation and RE Advisers Corporation.
74 Directors and Officers

NAME, ADDRESS ANDDATE OF BIRTH
POSITION(S)HELD WITHTHE FUND
TERM OF OFFICEAND LENGTHOF TIME SERVED
PRINCIPAL OCCUPATION(S)DURING PAST FIVE YEARS
NUMBER OFPORTFOLIOSOVERSEENBY DIRECTOR
OTHERDIRECTORSHIPSHELD BYDIRECTOR
Kelly B. Whetstone
4301 Wilson BoulevardArlington, VA 22203
11/21/77
Secretary 2008-Present Counsel and Senior Director of SecuritiesCompliance, NRECA(2012-Present)
Counsel and Director of Compliance,NRECA(2007-2012)
Secretary, RE Investment Corporation(2008-Present)
Secretary, RE Advisers Corporation(2008-Present)
Not Applicable Not Applicable
Amy M. DiMauro
4301 Wilson BoulevardArlington, VA 22203
07/29/71
Treasurer 2007-Present Director, Daily Pricing, NRECA(2007-Present)
Treasurer and Director, RE InvestmentCorporation(2007-Present)
Treasurer and Director, RE AdvisersCorporation(2010-Present)
Treasurer and Director, Electric CooperativeLife Insurance Company(2013-Present)
Treasurer and Director, CooperatingInsurance Services, Inc.(2013-Present)
Not Applicable Not Applicable
Directors and Officers 75

P O R T F O L I O O F I N V E S T M E N T S : S&P 500 Stock Master PortfolioDecember 31, 2013
COMMON STOCKS Shares Value
(99.6% of net assets)
Aerospace & Defense—2.8%The Boeing Co. 220,171 $ 30,051,140General Dynamics Corp. 106,557 10,181,521Honeywell International, Inc. 249,896 22,832,998L-3 Communications Holdings, Inc. 28,225 3,016,123Lockheed Martin Corp. 85,687 12,738,229Northrop Grumman Corp. 70,698 8,102,698Precision Castparts Corp. 46,260 12,457,818Raytheon Co. 101,743 9,228,090Rockwell Collins, Inc. 43,031 3,180,852Textron, Inc. 89,538 3,291,417United Technologies Corp. 268,846 30,594,675
Total Aerospace & Defense 145,675,561
Air Freight & Logistics—0.8%C.H. Robinson Worldwide, Inc. 48,291 2,817,297Expeditors International of
Washington, Inc. 65,471 2,897,092FedEx Corp. 94,791 13,628,102United Parcel Service, Inc.,
Class B 227,653 23,921,777
Total Air Freight & Logistics 43,264,268
Airlines—0.2%Delta Air Lines, Inc. 272,467 7,484,669Southwest Airlines Co. 221,886 4,180,332
Total Airlines 11,665,001
Auto Components—0.4%BorgWarner, Inc. 72,471 4,051,854Delphi Automotive PLC 89,180 5,362,393The Goodyear Tire & Rubber Co. 78,630 1,875,325Johnson Controls, Inc. 218,153 11,191,249
Total Auto Components 22,480,821
Automobiles—0.7%Ford Motor Co. 1,256,192 19,383,042General Motors Co. (a) 362,726 14,824,612Harley-Davidson, Inc. 70,417 4,875,673
Total Automobiles 39,083,327
Beverages—2.2%Beam, Inc. 51,933 3,534,560Brown-Forman Corp., Class B 51,602 3,899,563The Coca-Cola Co. 1,209,459 49,962,751Coca-Cola Enterprises, Inc. 76,901 3,393,641Constellation Brands, Inc.,
Class A (a) 53,062 3,734,504Dr Pepper Snapple Group, Inc. 63,899 3,113,159Molson Coors Brewing Co.,
Class B 50,355 2,827,433Monster Beverage Corp. (a)(b) 43,254 2,931,324PepsiCo, Inc. 488,408 40,508,560
Total Beverages 113,905,495
Biotechnology—2.4%Alexion Pharmaceuticals, Inc. (a) 62,454 8,310,129Amgen, Inc. 240,168 27,417,579Biogen Idec, Inc. (a) 75,227 21,044,753Celgene Corp. (a) 131,233 22,173,128Gilead Sciences, Inc. (a)(b) 488,329 36,697,924
Shares Value
Regeneron Pharmaceuticals,Inc. (a)(b) 25,013 $ 6,884,578
Vertex Pharmaceuticals, Inc. (a)(b) 74,445 5,531,264
Total Biotechnology 128,059,355
Building Products—0.1%Allegion PLC (a) 28,442 1,256,852Masco Corp. 113,690 2,588,721
Total Building Products 3,845,573
Capital Markets—2.2%Ameriprise Financial, Inc. 61,956 7,128,038The Bank of New York Mellon
Corp. 365,772 12,780,074BlackRock, Inc. (c) 40,465 12,805,958The Charles Schwab Corp. 369,521 9,607,546E*Trade Financial Corp. (a) 91,464 1,796,353Franklin Resources, Inc. 128,578 7,422,808The Goldman Sachs Group, Inc. 134,237 23,794,851Invesco Ltd. 141,172 5,138,661Legg Mason, Inc. 33,808 1,469,972Morgan Stanley 441,227 13,836,879Northern Trust Corp. 71,543 4,427,796State Street Corp. 139,809 10,260,582T. Rowe Price Group, Inc. 83,082 6,959,779
Total Capital Markets 117,429,297
Chemicals—2.5%Air Products & Chemicals, Inc. 67,285 7,521,117Airgas, Inc. 21,143 2,364,845CF Industries Holdings, Inc. 18,253 4,253,679The Dow Chemical Co. 386,264 17,150,122E.I. du Pont de Nemours & Co. 294,938 19,162,122Eastman Chemical Co. 49,019 3,955,833Ecolab, Inc. 86,360 9,004,757FMC Corp. 42,444 3,202,824International Flavors &
Fragrances, Inc. 25,960 2,232,041LyondellBasell Industries NV,
Class A 139,124 11,168,875Monsanto Co. 167,465 19,518,046The Mosaic Co. 108,530 5,130,213PPG Industries, Inc. 45,230 8,578,322Praxair, Inc. 93,746 12,189,792The Sherwin-Williams Co. 27,431 5,033,588Sigma-Aldrich Corp. 38,110 3,582,721
Total Chemicals 134,048,897
Commercial Banks—2.8%BB&T Corp. 224,499 8,378,302Comerica, Inc. 58,252 2,769,300Fifth Third Bancorp 281,158 5,912,753Huntington Bancshares, Inc. 264,638 2,553,757KeyCorp 285,565 3,832,282M&T Bank Corp. 41,474 4,828,403The PNC Financial Services
Group, Inc. (c) 169,461 13,146,784Regions Financial Corp. 438,712 4,338,862SunTrust Banks, Inc. 170,469 6,274,964US Bancorp 581,627 23,497,731Wells Fargo & Co. 1,526,600 69,307,640
76 Appendix The accompanying notes are an integral part of these financial statements.
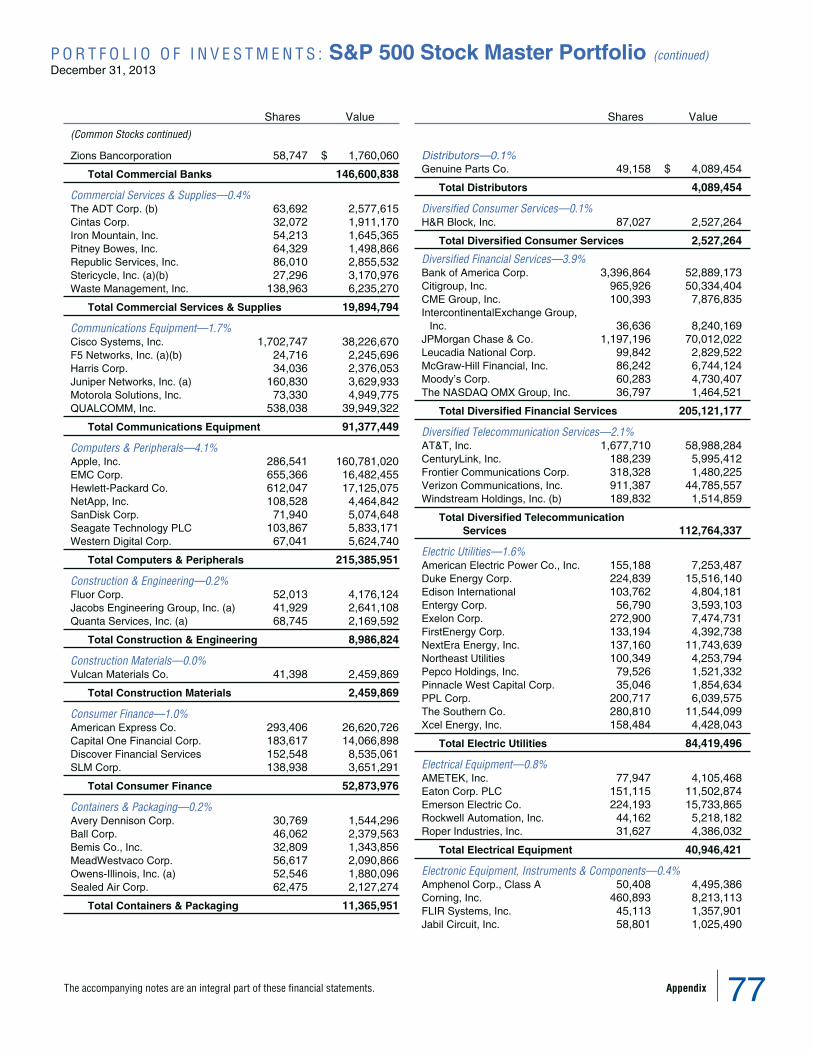
P O R T F O L I O O F I N V E S T M E N T S : S&P 500 Stock Master Portfolio (continued)December 31, 2013
Shares Value
(Common Stocks continued)
Zions Bancorporation 58,747 $ 1,760,060
Total Commercial Banks 146,600,838
Commercial Services & Supplies—0.4%The ADT Corp. (b) 63,692 2,577,615Cintas Corp. 32,072 1,911,170Iron Mountain, Inc. 54,213 1,645,365Pitney Bowes, Inc. 64,329 1,498,866Republic Services, Inc. 86,010 2,855,532Stericycle, Inc. (a)(b) 27,296 3,170,976Waste Management, Inc. 138,963 6,235,270
Total Commercial Services & Supplies 19,894,794
Communications Equipment—1.7%Cisco Systems, Inc. 1,702,747 38,226,670F5 Networks, Inc. (a)(b) 24,716 2,245,696Harris Corp. 34,036 2,376,053Juniper Networks, Inc. (a) 160,830 3,629,933Motorola Solutions, Inc. 73,330 4,949,775QUALCOMM, Inc. 538,038 39,949,322
Total Communications Equipment 91,377,449
Computers & Peripherals—4.1%Apple, Inc. 286,541 160,781,020EMC Corp. 655,366 16,482,455Hewlett-Packard Co. 612,047 17,125,075NetApp, Inc. 108,528 4,464,842SanDisk Corp. 71,940 5,074,648Seagate Technology PLC 103,867 5,833,171Western Digital Corp. 67,041 5,624,740
Total Computers & Peripherals 215,385,951
Construction & Engineering—0.2%Fluor Corp. 52,013 4,176,124Jacobs Engineering Group, Inc. (a) 41,929 2,641,108Quanta Services, Inc. (a) 68,745 2,169,592
Total Construction & Engineering 8,986,824
Construction Materials—0.0%Vulcan Materials Co. 41,398 2,459,869
Total Construction Materials 2,459,869
Consumer Finance—1.0%American Express Co. 293,406 26,620,726Capital One Financial Corp. 183,617 14,066,898Discover Financial Services 152,548 8,535,061SLM Corp. 138,938 3,651,291
Total Consumer Finance 52,873,976
Containers & Packaging—0.2%Avery Dennison Corp. 30,769 1,544,296Ball Corp. 46,062 2,379,563Bemis Co., Inc. 32,809 1,343,856MeadWestvaco Corp. 56,617 2,090,866Owens-Illinois, Inc. (a) 52,546 1,880,096Sealed Air Corp. 62,475 2,127,274
Total Containers & Packaging 11,365,951
Shares Value
Distributors—0.1%Genuine Parts Co. 49,158 $ 4,089,454
Total Distributors 4,089,454
Diversified Consumer Services—0.1%H&R Block, Inc. 87,027 2,527,264
Total Diversified Consumer Services 2,527,264
Diversified Financial Services—3.9%Bank of America Corp. 3,396,864 52,889,173Citigroup, Inc. 965,926 50,334,404CME Group, Inc. 100,393 7,876,835IntercontinentalExchange Group,
Inc. 36,636 8,240,169JPMorgan Chase & Co. 1,197,196 70,012,022Leucadia National Corp. 99,842 2,829,522McGraw-Hill Financial, Inc. 86,242 6,744,124Moody’s Corp. 60,283 4,730,407The NASDAQ OMX Group, Inc. 36,797 1,464,521
Total Diversified Financial Services 205,121,177
Diversified Telecommunication Services—2.1%AT&T, Inc. 1,677,710 58,988,284CenturyLink, Inc. 188,239 5,995,412Frontier Communications Corp. 318,328 1,480,225Verizon Communications, Inc. 911,387 44,785,557Windstream Holdings, Inc. (b) 189,832 1,514,859
Total Diversified TelecommunicationServices 112,764,337
Electric Utilities—1.6%American Electric Power Co., Inc. 155,188 7,253,487Duke Energy Corp. 224,839 15,516,140Edison International 103,762 4,804,181Entergy Corp. 56,790 3,593,103Exelon Corp. 272,900 7,474,731FirstEnergy Corp. 133,194 4,392,738NextEra Energy, Inc. 137,160 11,743,639Northeast Utilities 100,349 4,253,794Pepco Holdings, Inc. 79,526 1,521,332Pinnacle West Capital Corp. 35,046 1,854,634PPL Corp. 200,717 6,039,575The Southern Co. 280,810 11,544,099Xcel Energy, Inc. 158,484 4,428,043
Total Electric Utilities 84,419,496
Electrical Equipment—0.8%AMETEK, Inc. 77,947 4,105,468Eaton Corp. PLC 151,115 11,502,874Emerson Electric Co. 224,193 15,733,865Rockwell Automation, Inc. 44,162 5,218,182Roper Industries, Inc. 31,627 4,386,032
Total Electrical Equipment 40,946,421
Electronic Equipment, Instruments & Components—0.4%Amphenol Corp., Class A 50,408 4,495,386Corning, Inc. 460,893 8,213,113FLIR Systems, Inc. 45,113 1,357,901Jabil Circuit, Inc. 58,801 1,025,490
The accompanying notes are an integral part of these financial statements. Appendix 77

P O R T F O L I O O F I N V E S T M E N T S : S&P 500 Stock Master Portfolio (continued)December 31, 2013
Shares Value
(Common Stocks continued)
TE Connectivity Ltd. 130,693 $ 7,202,491
Total Electronic Equipment,Instruments & Components 22,294,381
Energy Equipment & Services—1.9%Baker Hughes, Inc. 141,155 7,800,225Cameron International Corp. (a) 75,755 4,509,695Diamond Offshore Drilling, Inc. 22,166 1,261,689Ensco PLC, Class A 74,392 4,253,735FMC Technologies, Inc. (a) 75,347 3,933,867Halliburton Co. 270,136 13,709,402Helmerich & Payne, Inc. 34,122 2,868,978Nabors Industries Ltd. 82,769 1,406,245National Oilwell Varco, Inc. 136,338 10,842,961Noble Corp. PLC 80,703 3,023,941Rowan Cos. PLC, Class A (a) 39,603 1,400,362Schlumberger Ltd. 419,413 37,793,306Transocean Ltd. 107,948 5,334,790
Total Energy Equipment &Services 98,139,196
Food & Staples Retailing—2.3%Costco Wholesale Corp. 139,147 16,559,885CVS Caremark Corp. 379,062 27,129,467The Kroger Co. 165,738 6,551,623Safeway, Inc. 78,599 2,559,969Sysco Corp. 185,216 6,686,298Wal-Mart Stores, Inc. 515,251 40,545,101Walgreen Co. 277,347 15,930,812Whole Foods Market, Inc. 118,515 6,853,722
Total Food & Staples Retailing 122,816,877
Food Products—1.6%Archer-Daniels-Midland Co. 209,545 9,094,253Campbell Soup Co. 57,184 2,474,923ConAgra Foods, Inc. 134,357 4,527,831General Mills, Inc. 201,995 10,081,570The Hershey Co. 47,710 4,638,843Hormel Foods Corp. 42,868 1,936,348The J.M. Smucker Co. 33,483 3,469,508Kellogg Co. 81,898 5,001,511Kraft Foods Group, Inc. 189,768 10,232,291McCormick & Co., Inc. 42,055 2,898,431Mead Johnson Nutrition Co. 64,327 5,388,029Mondelez International, Inc., Class A 558,532 19,716,180Tyson Foods, Inc., Class A 86,502 2,894,357
Total Food Products 82,354,075
Gas Utilities—0.1%AGL Resources, Inc. 37,807 1,785,625ONEOK, Inc. 65,697 4,085,039
Total Gas Utilities 5,870,664
Health Care Equipment & Supplies—2.0%Abbott Laboratories 492,417 18,874,344Baxter International, Inc. 172,834 12,020,605Becton Dickinson & Co. 61,813 6,829,718Boston Scientific Corp. (a) 425,230 5,111,264C.R. Bard, Inc. 24,806 3,322,516CareFusion Corp. (a) 67,306 2,680,125Covidien PLC 146,496 9,976,377
Shares Value
DENTSPLY International, Inc. 45,431 $ 2,202,495Edwards Lifesciences Corp. (a)(b) 34,843 2,291,276Intuitive Surgical, Inc. (a) 12,122 4,655,818Medtronic, Inc. 317,946 18,246,921St. Jude Medical, Inc. 92,934 5,757,261Stryker Corp. 94,002 7,063,310Varian Medical Systems, Inc. (a)(b) 33,669 2,615,745Zimmer Holdings, Inc. 54,453 5,074,475
Total Health Care Equipment & Supplies 106,722,250
Health Care Providers & Services—2.0%Aetna, Inc. 117,038 8,027,636AmerisourceBergen Corp. 73,259 5,150,840Cardinal Health, Inc. 108,751 7,265,654Cigna Corp. 88,029 7,700,777DaVita HealthCare Partners,
Inc. (a)(b) 56,223 3,562,852Express Scripts Holding Co. (a) 256,625 18,025,340Humana, Inc. 49,654 5,125,286Laboratory Corp. of America
Holdings (a)(b) 27,834 2,543,193McKesson Corp. 73,156 11,807,378Patterson Cos., Inc. 26,553 1,093,984Quest Diagnostics, Inc. (b) 46,314 2,479,652Tenet Healthcare Corp. (a)(b) 31,601 1,331,034UnitedHealth Group, Inc. 320,624 24,142,987WellPoint, Inc. 94,082 8,692,236
Total Health Care Providers & Services 106,948,849
Health Care Technology—0.1%Cerner Corp. (a)(b) 94,015 5,240,396
Total Health Care Technology 5,240,396
Hotels, Restaurants & Leisure—1.7%Carnival Corp. 139,498 5,603,635Chipotle Mexican Grill, Inc. (a) 9,854 5,250,014Darden Restaurants, Inc. 41,546 2,258,856International Game Technology 79,268 1,439,507Marriott International, Inc., Class A 71,546 3,531,510McDonald’s Corp. 316,889 30,747,740Starbucks Corp. 240,000 18,813,600Starwood Hotels & Resorts
Worldwide, Inc. 60,991 4,845,735Wyndham Worldwide Corp. 41,499 3,058,061Wynn Resorts Ltd. 25,724 4,995,858Yum! Brands, Inc. 141,825 10,723,388
Total Hotels, Restaurants & Leisure 91,267,904
Household Durables—0.4%D.R. Horton, Inc. 90,506 2,020,094Garmin Ltd. 39,169 1,810,391Harman International Industries, Inc. 21,513 1,760,839Leggett & Platt, Inc. 44,972 1,391,434Lennar Corp., Class A 53,248 2,106,491Mohawk Industries, Inc. (a) 19,428 2,892,829Newell Rubbermaid, Inc. 91,465 2,964,381PulteGroup, Inc. 109,794 2,236,504Whirlpool Corp. 24,998 3,921,186
Total Household Durables 21,104,149
78 Appendix The accompanying notes are an integral part of these financial statements.

P O R T F O L I O O F I N V E S T M E N T S : S&P 500 Stock Master Portfolio (continued)December 31, 2013
Shares Value
(Common Stocks continued)
Household Products—2.0%The Clorox Co. 41,097 $ 3,812,158Colgate-Palmolive Co. 279,920 18,253,583Kimberly-Clark Corp. 121,541 12,696,173The Procter & Gamble Co. 865,680 70,475,009
Total Household Products 105,236,923
Independent Power Producers & Energy Traders—0.1%The AES Corp. 209,120 3,034,331NRG Energy, Inc. 103,006 2,958,333
Total Independent Power Producers &Energy Traders 5,992,664
Industrial Conglomerates—2.7%3M Co. 203,697 28,568,504Danaher Corp. 190,953 14,741,572General Electric Co. 3,222,097 90,315,379Tyco International Ltd. 148,186 6,081,553
Total Industrial Conglomerates 139,707,008
Insurance—4.3%ACE Ltd. 108,301 11,212,403Aflac, Inc. 148,447 9,916,260The Allstate Corp. 144,856 7,900,446American International Group, Inc. 468,901 23,937,396Aon PLC 95,875 8,042,954Assurant, Inc. 23,158 1,536,996Berkshire Hathaway, Inc.,
Class B (a) 573,259 67,965,587The Chubb Corp. 80,178 7,747,600Cincinnati Financial Corp. 46,958 2,459,191Genworth Financial, Inc.,
Class A (a) 157,408 2,444,546Hartford Financial Services Group,
Inc. 142,383 5,158,536Lincoln National Corp. 83,550 4,312,851Loews Corp. 97,407 4,698,914Marsh & McLennan Cos., Inc. 174,770 8,451,877MetLife, Inc. 357,025 19,250,788Principal Financial Group, Inc. 87,186 4,299,142The Progressive Corp. 175,795 4,793,930Prudential Financial, Inc. 147,452 13,598,023Torchmark Corp. 28,796 2,250,407The Travelers Cos., Inc. 115,945 10,497,660Unum Group 83,173 2,917,709XL Group PLC 90,067 2,867,733
Total Insurance 226,260,949
Internet & Catalog Retail—1.5%Amazon.com, Inc. (a) 118,078 47,088,326Expedia, Inc. 32,796 2,284,569Netflix, Inc. (a)(b) 18,872 6,948,104priceline.com, Inc. (a) 16,378 19,037,787TripAdvisor, Inc. (a)(b) 35,289 2,922,988
Total Internet & Catalog Retail 78,281,774
Internet Software & Services—3.2%Akamai Technologies, Inc. (a) 56,999 2,689,213eBay, Inc. (a) 371,064 20,367,703Facebook, Inc. (a) 523,802 28,631,017Google, Inc., Class A (a) 89,374 100,162,335
Shares Value
VeriSign, Inc. (a)(b) 41,028 $ 2,452,654Yahoo!, Inc. (a) 300,456 12,150,441
Total Internet Software & Services 166,453,363
IT Services—3.6%Accenture PLC, Class A 202,463 16,646,508Alliance Data Systems Corp. (a) 15,514 4,079,096Automatic Data Processing, Inc. 153,320 12,389,789Cognizant Technology Solutions
Corp., Class A (a) 96,337 9,728,110Computer Sciences Corp. 46,883 2,619,822Fidelity National Information
Services, Inc. 92,718 4,977,102Fiserv, Inc. (a)(b) 82,146 4,850,721International Business Machines
Corp. 325,065 60,972,442Mastercard, Inc., Class A 32,970 27,545,116Paychex, Inc. 103,511 4,712,856Teradata Corp. (a)(b) 52,038 2,367,209Total System Services, Inc. 53,187 1,770,064Visa, Inc., Class A 162,178 36,113,797The Western Union Co. 175,876 3,033,861
Total IT Services 191,806,493
Leisure Equipment & Products—0.1%Hasbro, Inc. 36,816 2,025,248Mattel, Inc. 107,782 5,128,268
Total Leisure Equipment & Products 7,153,516
Life Sciences Tools & Services—0.5%Agilent Technologies, Inc. 105,348 6,024,852Life Technologies Corp. (a) 54,988 4,168,090PerkinElmer, Inc. 35,825 1,477,065Thermo Fisher Scientific, Inc. 115,085 12,814,715Waters Corp. (a)(b) 27,112 2,711,200
Total Life Sciences Tools & Services 27,195,922
Machinery—1.8%Caterpillar, Inc. 202,661 18,403,646Cummins, Inc. 55,493 7,822,848Deere & Co. 121,926 11,135,502Dover Corp. 54,257 5,237,971Flowserve Corp. 44,417 3,501,392Illinois Tool Works, Inc. 130,042 10,933,931Ingersoll-Rand PLC 85,325 5,256,020Joy Global, Inc. 33,847 1,979,711PACCAR, Inc. 112,768 6,672,483Pall Corp. 35,283 3,011,404Parker Hannifin Corp. 47,527 6,113,873Pentair Ltd., Registered Shares 63,482 4,930,647Snap-on, Inc. 18,519 2,028,201Stanley Black & Decker, Inc. 49,432 3,988,668Xylem, Inc. 58,754 2,032,888
Total Machinery 93,049,185
Media—3.7%Cablevision Systems Corp., New
York Group, Class A 68,178 1,222,431CBS Corp., Class B 177,732 11,328,638Comcast Corp., Class A 829,932 43,127,416DIRECTV (a)(b) 155,625 10,752,131
The accompanying notes are an integral part of these financial statements. Appendix 79

P O R T F O L I O O F I N V E S T M E N T S : S&P 500 Stock Master Portfolio (continued)December 31, 2013
Shares Value
(Common Stocks continued)
Discovery Communications, Inc.,Class A (a)(b) 71,870 $ 6,498,485
Gannett Co., Inc. 72,578 2,146,857Graham Holdings Co., Class B 1,387 920,025The Interpublic Group of Cos., Inc. 132,561 2,346,330News Corp., Class A (a) 158,539 2,856,873Omnicom Group, Inc. 81,962 6,095,514Scripps Networks Interactive, Inc.,
Class A 34,890 3,014,845Time Warner Cable, Inc. 89,774 12,164,377Time Warner, Inc. 288,129 20,088,354Twenty-First Century Fox, Inc.,
Class A 624,954 21,985,882Viacom, Inc., Class B 129,249 11,288,608The Walt Disney Co. 520,469 39,763,831
Total Media 195,600,597
Metals & Mining—0.6%Alcoa, Inc. 340,638 3,620,982Allegheny Technologies, Inc. 34,429 1,226,705Cliffs Natural Resources, Inc. (b) 48,825 1,279,703Freeport-McMoRan Copper & Gold,
Inc. 330,623 12,477,712Newmont Mining Corp. 158,558 3,651,591Nucor Corp. 101,341 5,409,583United States Steel Corp. (b) 46,072 1,359,124
Total Metals & Mining 29,025,400
Multi-Utilities—1.1%Ameren Corp. 77,272 2,794,155CenterPoint Energy, Inc. 136,510 3,164,302CMS Energy Corp. 84,714 2,267,794Consolidated Edison, Inc. 93,277 5,156,352Dominion Resources, Inc. 184,853 11,958,141DTE Energy Co. 56,305 3,738,089Integrys Energy Group, Inc. 25,416 1,382,885NiSource, Inc. 99,776 3,280,635PG&E Corp. 143,088 5,763,585Public Service Enterprise Group, Inc. 161,103 5,161,740SCANA Corp. 44,743 2,099,789Sempra Energy 72,386 6,497,367TECO Energy, Inc. 65,052 1,121,496Wisconsin Energy Corp. 72,140 2,982,268
Total Multi-Utilities 57,368,598
Multiline Retail—0.7%Dollar General Corp. (a) 93,833 5,660,007Dollar Tree, Inc. (a) 66,272 3,739,066Family Dollar Stores, Inc. 30,792 2,000,556Kohl’s Corp. 64,106 3,638,016Macy’s, Inc. 117,351 6,266,543Nordstrom, Inc. 45,568 2,816,102Target Corp. 201,302 12,736,378
Total Multiline Retail 36,856,668
Office Electronics—0.1%Xerox Corp. 368,551 4,485,266
Total Office Electronics 4,485,266
Shares Value
Oil, Gas & Consumable Fuels—8.4%Anadarko Petroleum Corp. 160,276 $ 12,713,092Apache Corp. 127,145 10,926,841Cabot Oil & Gas Corp. 134,125 5,198,685Chesapeake Energy Corp. 160,979 4,368,970Chevron Corp. 612,477 76,504,502ConocoPhillips 390,160 27,564,804CONSOL Energy, Inc. 72,912 2,773,573Denbury Resources, Inc. (a) 116,780 1,918,695Devon Energy Corp. 121,542 7,519,804EOG Resources, Inc. 86,935 14,591,171EQT Corp. 47,999 4,309,350Exxon Mobil Corp. 1,391,249 140,794,399Hess Corp. 90,587 7,518,721Kinder Morgan, Inc. 214,428 7,719,408Marathon Oil Corp. 221,858 7,831,587Marathon Petroleum Corp. 95,869 8,794,063Murphy Oil Corp. 55,976 3,631,723Newfield Exploration Co. (a) 43,381 1,068,474Noble Energy, Inc. 114,420 7,793,146Occidental Petroleum Corp. 256,707 24,412,836Peabody Energy Corp. 85,934 1,678,291Phillips 66 190,935 14,726,817Pioneer Natural Resources Co. 45,420 8,360,460QEP Resources, Inc. 57,157 1,751,862Range Resources Corp. 52,045 4,387,914Southwestern Energy Co. (a) 111,686 4,392,610Spectra Energy Corp. 213,389 7,600,916Tesoro Corp. 42,304 2,474,784Valero Energy Corp. 171,835 8,660,484The Williams Cos., Inc. 217,653 8,394,876WPX Energy, Inc. (a)(b) 63,952 1,303,342
Total Oil, Gas & Consumable Fuels 441,686,200
Paper & Forest Products—0.1%International Paper Co. 141,281 6,927,007
Total Paper & ForestProducts 6,927,007
Personal Products—0.2%Avon Products, Inc. 138,143 2,378,823The Estee Lauder Cos., Inc.,
Class A 81,544 6,141,894
Total Personal Products 8,520,717
Pharmaceuticals—5.8%AbbVie, Inc. 506,645 26,755,922Actavis PLC (a) 55,429 9,312,072Allergan, Inc. 94,638 10,512,389Bristol-Myers Squibb Co. 524,378 27,870,691Eli Lilly & Co. 315,750 16,103,250Forest Laboratories, Inc. (a) 75,471 4,530,524Hospira, Inc. (a)(b) 52,827 2,180,698Johnson & Johnson 898,549 82,298,103Merck & Co., Inc. 930,552 46,574,128Mylan, Inc. (a) 121,958 5,292,977Perrigo Co. PLC 42,373 6,502,561Pfizer, Inc. 2,064,039 63,221,515Zoetis, Inc. 159,238 5,205,490
Total Pharmaceuticals 306,360,320
80 Appendix The accompanying notes are an integral part of these financial statements.
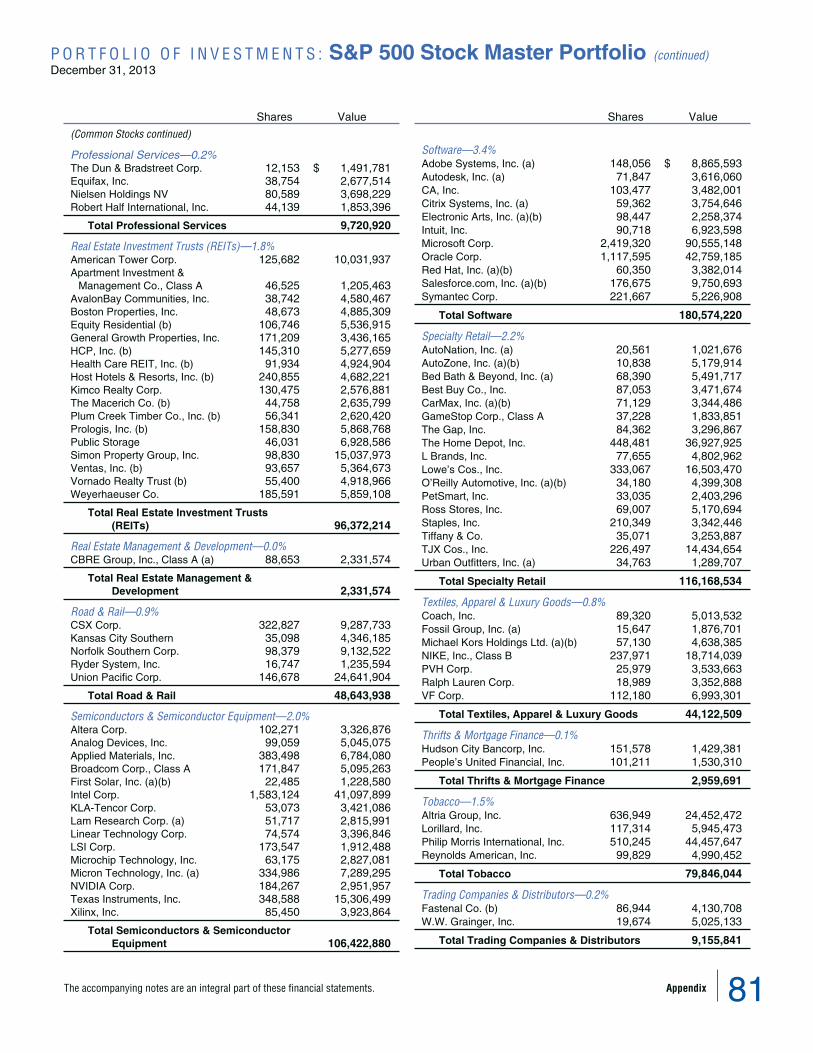
P O R T F O L I O O F I N V E S T M E N T S : S&P 500 Stock Master Portfolio (continued)December 31, 2013
Shares Value
(Common Stocks continued)
Professional Services—0.2%The Dun & Bradstreet Corp. 12,153 $ 1,491,781Equifax, Inc. 38,754 2,677,514Nielsen Holdings NV 80,589 3,698,229Robert Half International, Inc. 44,139 1,853,396
Total Professional Services 9,720,920
Real Estate Investment Trusts (REITs)—1.8%American Tower Corp. 125,682 10,031,937Apartment Investment &
Management Co., Class A 46,525 1,205,463AvalonBay Communities, Inc. 38,742 4,580,467Boston Properties, Inc. 48,673 4,885,309Equity Residential (b) 106,746 5,536,915General Growth Properties, Inc. 171,209 3,436,165HCP, Inc. (b) 145,310 5,277,659Health Care REIT, Inc. (b) 91,934 4,924,904Host Hotels & Resorts, Inc. (b) 240,855 4,682,221Kimco Realty Corp. 130,475 2,576,881The Macerich Co. (b) 44,758 2,635,799Plum Creek Timber Co., Inc. (b) 56,341 2,620,420Prologis, Inc. (b) 158,830 5,868,768Public Storage 46,031 6,928,586Simon Property Group, Inc. 98,830 15,037,973Ventas, Inc. (b) 93,657 5,364,673Vornado Realty Trust (b) 55,400 4,918,966Weyerhaeuser Co. 185,591 5,859,108
Total Real Estate Investment Trusts(REITs) 96,372,214
Real Estate Management & Development—0.0%CBRE Group, Inc., Class A (a) 88,653 2,331,574
Total Real Estate Management &Development 2,331,574
Road & Rail—0.9%CSX Corp. 322,827 9,287,733Kansas City Southern 35,098 4,346,185Norfolk Southern Corp. 98,379 9,132,522Ryder System, Inc. 16,747 1,235,594Union Pacific Corp. 146,678 24,641,904
Total Road & Rail 48,643,938
Semiconductors & Semiconductor Equipment—2.0%Altera Corp. 102,271 3,326,876Analog Devices, Inc. 99,059 5,045,075Applied Materials, Inc. 383,498 6,784,080Broadcom Corp., Class A 171,847 5,095,263First Solar, Inc. (a)(b) 22,485 1,228,580Intel Corp. 1,583,124 41,097,899KLA-Tencor Corp. 53,073 3,421,086Lam Research Corp. (a) 51,717 2,815,991Linear Technology Corp. 74,574 3,396,846LSI Corp. 173,547 1,912,488Microchip Technology, Inc. 63,175 2,827,081Micron Technology, Inc. (a) 334,986 7,289,295NVIDIA Corp. 184,267 2,951,957Texas Instruments, Inc. 348,588 15,306,499Xilinx, Inc. 85,450 3,923,864
Total Semiconductors & SemiconductorEquipment 106,422,880
Shares Value
Software—3.4%Adobe Systems, Inc. (a) 148,056 $ 8,865,593Autodesk, Inc. (a) 71,847 3,616,060CA, Inc. 103,477 3,482,001Citrix Systems, Inc. (a) 59,362 3,754,646Electronic Arts, Inc. (a)(b) 98,447 2,258,374Intuit, Inc. 90,718 6,923,598Microsoft Corp. 2,419,320 90,555,148Oracle Corp. 1,117,595 42,759,185Red Hat, Inc. (a)(b) 60,350 3,382,014Salesforce.com, Inc. (a)(b) 176,675 9,750,693Symantec Corp. 221,667 5,226,908
Total Software 180,574,220
Specialty Retail—2.2%AutoNation, Inc. (a) 20,561 1,021,676AutoZone, Inc. (a)(b) 10,838 5,179,914Bed Bath & Beyond, Inc. (a) 68,390 5,491,717Best Buy Co., Inc. 87,053 3,471,674CarMax, Inc. (a)(b) 71,129 3,344,486GameStop Corp., Class A 37,228 1,833,851The Gap, Inc. 84,362 3,296,867The Home Depot, Inc. 448,481 36,927,925L Brands, Inc. 77,655 4,802,962Lowe’s Cos., Inc. 333,067 16,503,470O’Reilly Automotive, Inc. (a)(b) 34,180 4,399,308PetSmart, Inc. 33,035 2,403,296Ross Stores, Inc. 69,007 5,170,694Staples, Inc. 210,349 3,342,446Tiffany & Co. 35,071 3,253,887TJX Cos., Inc. 226,497 14,434,654Urban Outfitters, Inc. (a) 34,763 1,289,707
Total Specialty Retail 116,168,534
Textiles, Apparel & Luxury Goods—0.8%Coach, Inc. 89,320 5,013,532Fossil Group, Inc. (a) 15,647 1,876,701Michael Kors Holdings Ltd. (a)(b) 57,130 4,638,385NIKE, Inc., Class B 237,971 18,714,039PVH Corp. 25,979 3,533,663Ralph Lauren Corp. 18,989 3,352,888VF Corp. 112,180 6,993,301
Total Textiles, Apparel & Luxury Goods 44,122,509
Thrifts & Mortgage Finance—0.1%Hudson City Bancorp, Inc. 151,578 1,429,381People’s United Financial, Inc. 101,211 1,530,310
Total Thrifts & Mortgage Finance 2,959,691
Tobacco—1.5%Altria Group, Inc. 636,949 24,452,472Lorillard, Inc. 117,314 5,945,473Philip Morris International, Inc. 510,245 44,457,647Reynolds American, Inc. 99,829 4,990,452
Total Tobacco 79,846,044
Trading Companies & Distributors—0.2%Fastenal Co. (b) 86,944 4,130,708W.W. Grainger, Inc. 19,674 5,025,133
Total Trading Companies & Distributors 9,155,841
The accompanying notes are an integral part of these financial statements. Appendix 81

P O R T F O L I O O F I N V E S T M E N T S : S&P 500 Stock Master Portfolio (continued)December 31, 2013
Shares Value
(Common Stocks continued)
Wireless Telecommunication Services—0.2%Crown Castle International
Corp. (a) 106,392 $ 7,812,365
Total Wireless TelecommunicationServices 7,812,365
Total Long-Term Investments(Cost—$3,092,920,793) 5,253,129,437
SHORT-TERM SECURITIES(2.0% of net assets)BlackRock Cash Funds:
Institutional, SL AgencyShares, 0.14% (c)(d)(e) 92,138,359 92,138,359
Prime, SL AgencyShares, 0.11% (c)(d)(e) 11,657,294 11,657,294
Total Short-Term Securities(Cost $103,795,653) 103,795,653
TOTAL INVESTMENTS(Cost $3,196,716,446*)—101.6% 5,356,925,090
LIABILITIES IN EXCESS OFOTHER ASSETS—(1.6)% (85,794,883)
NET ASSETS—100% $5,271,130,207
* As of December 31, 2013, gross unrealized appreciation and grossunrealized depreciation based on cost for federal income tax purposes wereas follows:
Tax cost $2,842,601,670
Gross unrealized appreciation 2,681,943,062Gross unrealized depreciation (167,619,642)
Net unrealized appreciation $2,514,323,420
(a) Non-income producing security.(b) Security, or a portion of security, is on loan.(c) Investments in issuers considered to be an affiliate of the Master Portfolio during the year ended December 31, 2013, for purposes of Section 2(a)(3) of the
Investment Company Act of 1940, as amended, were as follows:
AffiliateShares Held at
December 31, 2012Shares
PurchasedShares
SoldShares Held at
December 31, 2013Value at
December 31, 2013 IncomeRealized
Gain
BlackRock, Inc. 16,465 24,958 (958) 40,465 $12,805,958 $230,088 $72,468BlackRock Cash Funds: Institutional, SL Agency Shares 132,083,169 — (39,944,810)1 92,138,359 $92,138,359 $310,375 $ —BlackRock Cash Funds: Prime, SL Agency Shares 22,497,136 — (10,839,842)1 11,657,294 $11,657,294 $ 40,178 $ —The PNC Financial Services Group, Inc 69,347 103,655 (3,541) 169,461 $13,146,784 $252,982 $41,2271 Represents net shares sold.
(d) Represents the current yield as of report date.(e) All or a portion of security was purchased with the cash collateral from loaned securities.
‰ For Master Portfolio compliance purposes, the Master Portfolio’s industry classifications refer to any one or more of the industry sub-classifications used by one ormore widely recognized market indexes or rating group indexes, and/or as defined by the investment advisor. These definitions may not apply for purposes of thisreport, which may combine such industry sub-classifications for reporting ease.
‰ Financial futures contracts outstanding as of December 31, 2013 were as follows:
ContractsPurchased Issue Exchange Expiration Notional Value
UnrealizedAppreciation
380 S&P 500 E-Mini Index Chicago Mercantile March 2014 $34,980,900 $677,360
‰ Fair Value Measurements — Various inputs are used in determining the fair value of investments and derivative financial instruments. These inputs to valuationtechniques are categorized into a disclosure hierarchy consisting of three broad levels for financial statement purposes as follows:
‰ Level 1 – unadjusted price quotations in active markets/exchanges for identical assets or liabilities that the Master Portfolio has the ability to access
‰ Level 2 – other observable inputs (including, but not limited to, quoted prices for similar assets or liabilities in markets that are active, quoted prices for identicalor similar assets or liabilities in markets that are not active, inputs other than quoted prices that are observable for the assets or liabilities (such as interest rates,yield curves, volatilities, prepayment speeds, loss severities, credit risks and default rates) or other market corroborated inputs)
‰ Level 3 – unobservable inputs based on the best information available in the circumstances, to the extent observable inputs are not available (including theMaster Portfolio’s own assumptions used in determining the fair value of investments and derivative financial instruments)
The hierarchy gives the highest priority to unadjusted quoted prices in active markets for identical assets or liabilities (Level 1 measurements) and the lowest priority tounobservable inputs (Level 3 measurements). Accordingly, the degree of judgment exercised in determining fair value is greatest for instruments categorized inLevel 3. The inputs used to measure fair value may fall into different levels of the fair value hierarchy. In such cases, for disclosure purposes, the fair value hierarchyclassification is determined based on the lowest level input that is significant to the fair value measurement in its entirety.
82 Appendix The accompanying notes are an integral part of these financial statements.
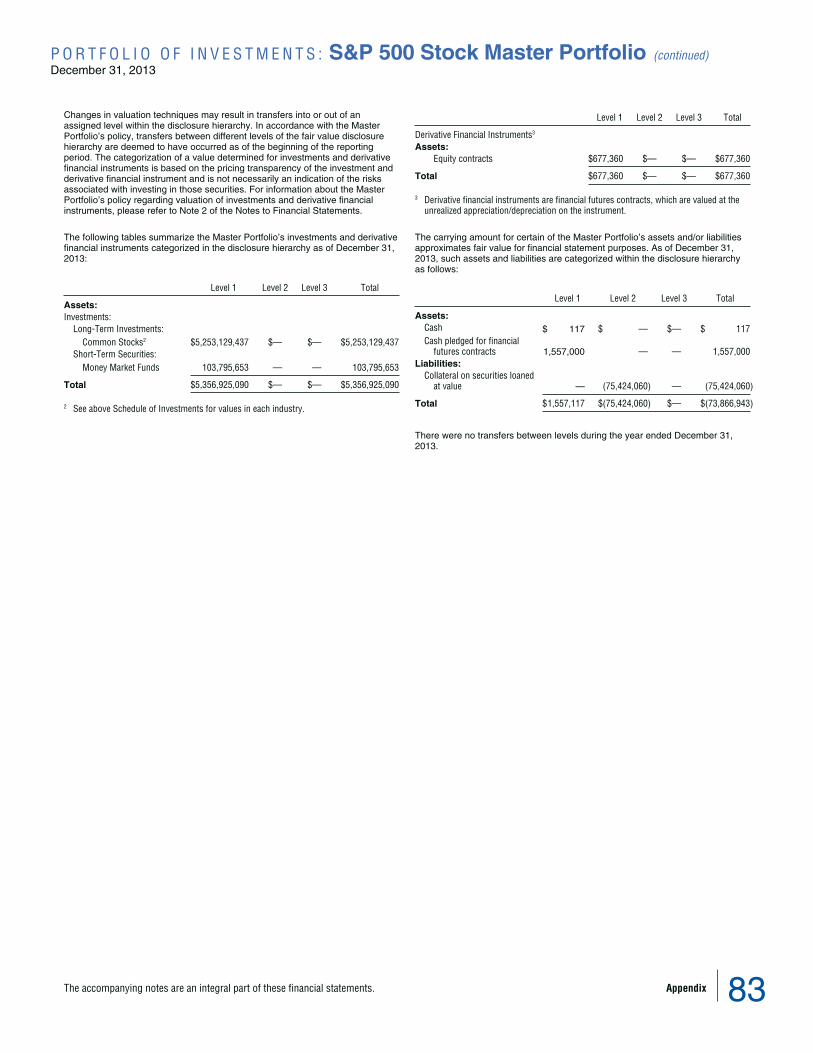
P O R T F O L I O O F I N V E S T M E N T S : S&P 500 Stock Master Portfolio (continued)December 31, 2013
Changes in valuation techniques may result in transfers into or out of anassigned level within the disclosure hierarchy. In accordance with the MasterPortfolio’s policy, transfers between different levels of the fair value disclosurehierarchy are deemed to have occurred as of the beginning of the reportingperiod. The categorization of a value determined for investments and derivativefinancial instruments is based on the pricing transparency of the investment andderivative financial instrument and is not necessarily an indication of the risksassociated with investing in those securities. For information about the MasterPortfolio’s policy regarding valuation of investments and derivative financialinstruments, please refer to Note 2 of the Notes to Financial Statements.
The following tables summarize the Master Portfolio’s investments and derivativefinancial instruments categorized in the disclosure hierarchy as of December 31,2013:
Level 1 Level 2 Level 3 Total
Assets:Investments:
Long-Term Investments:Common Stocks2 $5,253,129,437 $— $— $5,253,129,437
Short-Term Securities:Money Market Funds 103,795,653 — — 103,795,653
Total $5,356,925,090 $— $— $5,356,925,090
2 See above Schedule of Investments for values in each industry.
Level 1 Level 2 Level 3 Total
Derivative Financial Instruments3
Assets:Equity contracts $677,360 $— $— $677,360
Total $677,360 $— $— $677,360
3 Derivative financial instruments are financial futures contracts, which are valued at theunrealized appreciation/depreciation on the instrument.
The carrying amount for certain of the Master Portfolio’s assets and/or liabilitiesapproximates fair value for financial statement purposes. As of December 31,2013, such assets and liabilities are categorized within the disclosure hierarchyas follows:
Level 1 Level 2 Level 3 Total
Assets:Cash $ 117 $ — $— $ 117Cash pledged for financial
futures contracts 1,557,000 — — 1,557,000Liabilities:
Collateral on securities loanedat value — (75,424,060) — (75,424,060)
Total $1,557,117 $(75,424,060) $— $(73,866,943)
There were no transfers between levels during the year ended December 31,2013.
The accompanying notes are an integral part of these financial statements. Appendix 83
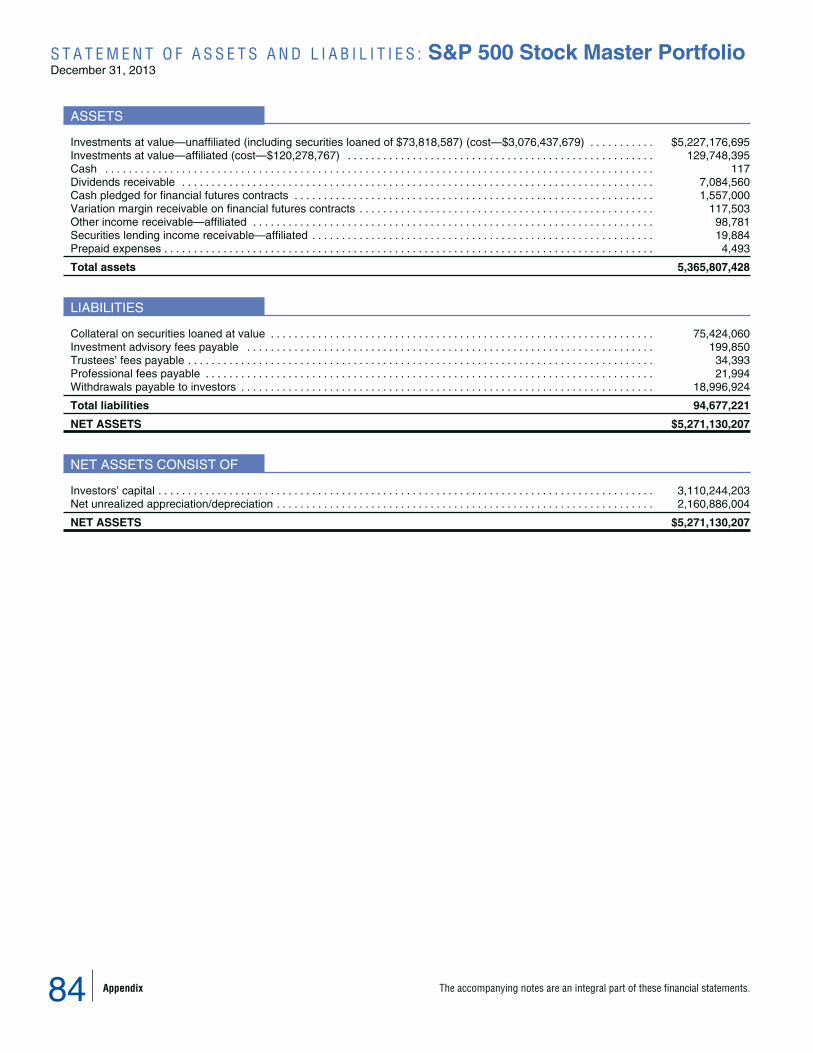
S T A T E M E N T O F A S S E T S A N D L I A B I L I T I E S : S&P 500 Stock Master PortfolioDecember 31, 2013
ASSETS
Investments at value—unaffiliated (including securities loaned of $73,818,587) (cost—$3,076,437,679) . . . . . . . . . . . $5,227,176,695Investments at value—affiliated (cost—$120,278,767) . . . . . . . . . . . . . . . . . . . . . . . . . . . . . . . . . . . . . . . . . . . . . . . . . . . . 129,748,395Cash . . . . . . . . . . . . . . . . . . . . . . . . . . . . . . . . . . . . . . . . . . . . . . . . . . . . . . . . . . . . . . . . . . . . . . . . . . . . . . . . . . . . . . . . . . . . . 117Dividends receivable . . . . . . . . . . . . . . . . . . . . . . . . . . . . . . . . . . . . . . . . . . . . . . . . . . . . . . . . . . . . . . . . . . . . . . . . . . . . . . . . 7,084,560Cash pledged for financial futures contracts . . . . . . . . . . . . . . . . . . . . . . . . . . . . . . . . . . . . . . . . . . . . . . . . . . . . . . . . . . . . . 1,557,000Variation margin receivable on financial futures contracts . . . . . . . . . . . . . . . . . . . . . . . . . . . . . . . . . . . . . . . . . . . . . . . . . . 117,503Other income receivable—affiliated . . . . . . . . . . . . . . . . . . . . . . . . . . . . . . . . . . . . . . . . . . . . . . . . . . . . . . . . . . . . . . . . . . . . 98,781Securities lending income receivable—affiliated . . . . . . . . . . . . . . . . . . . . . . . . . . . . . . . . . . . . . . . . . . . . . . . . . . . . . . . . . . 19,884Prepaid expenses . . . . . . . . . . . . . . . . . . . . . . . . . . . . . . . . . . . . . . . . . . . . . . . . . . . . . . . . . . . . . . . . . . . . . . . . . . . . . . . . . . . 4,493
Total assets 5,365,807,428
LIABILITIES
Collateral on securities loaned at value . . . . . . . . . . . . . . . . . . . . . . . . . . . . . . . . . . . . . . . . . . . . . . . . . . . . . . . . . . . . . . . . . 75,424,060Investment advisory fees payable . . . . . . . . . . . . . . . . . . . . . . . . . . . . . . . . . . . . . . . . . . . . . . . . . . . . . . . . . . . . . . . . . . . . . 199,850Trustees’ fees payable . . . . . . . . . . . . . . . . . . . . . . . . . . . . . . . . . . . . . . . . . . . . . . . . . . . . . . . . . . . . . . . . . . . . . . . . . . . . . . . 34,393Professional fees payable . . . . . . . . . . . . . . . . . . . . . . . . . . . . . . . . . . . . . . . . . . . . . . . . . . . . . . . . . . . . . . . . . . . . . . . . . . . . 21,994Withdrawals payable to investors . . . . . . . . . . . . . . . . . . . . . . . . . . . . . . . . . . . . . . . . . . . . . . . . . . . . . . . . . . . . . . . . . . . . . . 18,996,924
Total liabilities 94,677,221
NET ASSETS $5,271,130,207
NET ASSETS CONSIST OF
Investors’ capital . . . . . . . . . . . . . . . . . . . . . . . . . . . . . . . . . . . . . . . . . . . . . . . . . . . . . . . . . . . . . . . . . . . . . . . . . . . . . . . . . . . . 3,110,244,203Net unrealized appreciation/depreciation . . . . . . . . . . . . . . . . . . . . . . . . . . . . . . . . . . . . . . . . . . . . . . . . . . . . . . . . . . . . . . . . 2,160,886,004
NET ASSETS $5,271,130,207
84 Appendix The accompanying notes are an integral part of these financial statements.

S T A T E M E N T O F O P E R A T I O N S : S&P 500 Stock Master PortfolioYear Ended December 31, 2013
INVESTMENT INCOME
Dividends—unaffiliated . . . . . . . . . . . . . . . . . . . . . . . . . . . . . . . . . . . . . . . . . . . . . . . . . . . . . . . . . . . . . . . . . . . . . . . . . . . . . . $ 83,961,530Dividends—affiliated . . . . . . . . . . . . . . . . . . . . . . . . . . . . . . . . . . . . . . . . . . . . . . . . . . . . . . . . . . . . . . . . . . . . . . . . . . . . . . . . 483,070Securities lending—affiliated—net . . . . . . . . . . . . . . . . . . . . . . . . . . . . . . . . . . . . . . . . . . . . . . . . . . . . . . . . . . . . . . . . . . . . . 259,954Other income—affiliated . . . . . . . . . . . . . . . . . . . . . . . . . . . . . . . . . . . . . . . . . . . . . . . . . . . . . . . . . . . . . . . . . . . . . . . . . . . . . 98,781Income—affiliated . . . . . . . . . . . . . . . . . . . . . . . . . . . . . . . . . . . . . . . . . . . . . . . . . . . . . . . . . . . . . . . . . . . . . . . . . . . . . . . . . . . 90,599Interest . . . . . . . . . . . . . . . . . . . . . . . . . . . . . . . . . . . . . . . . . . . . . . . . . . . . . . . . . . . . . . . . . . . . . . . . . . . . . . . . . . . . . . . . . . . 1,766Foreign taxes withheld . . . . . . . . . . . . . . . . . . . . . . . . . . . . . . . . . . . . . . . . . . . . . . . . . . . . . . . . . . . . . . . . . . . . . . . . . . . . . . . (16,215)
Total income 84,879,485
EXPENSES
Investment advisory . . . . . . . . . . . . . . . . . . . . . . . . . . . . . . . . . . . . . . . . . . . . . . . . . . . . . . . . . . . . . . . . . . . . . . . . . . . . . . . . . 1,993,896Trustees . . . . . . . . . . . . . . . . . . . . . . . . . . . . . . . . . . . . . . . . . . . . . . . . . . . . . . . . . . . . . . . . . . . . . . . . . . . . . . . . . . . . . . . . . . 123,517Professional . . . . . . . . . . . . . . . . . . . . . . . . . . . . . . . . . . . . . . . . . . . . . . . . . . . . . . . . . . . . . . . . . . . . . . . . . . . . . . . . . . . . . . . 39,442
Total expenses 2,156,855
Less fees reimbursed by Manager . . . . . . . . . . . . . . . . . . . . . . . . . . . . . . . . . . . . . . . . . . . . . . . . . . . . . . . . . . . . . . . . . . . . . (162,959)
Total expenses after fees reimbursed 1,993,896
NET INVESTMENT INCOME 82,885,589
REALIZED AND UNREALIZED GAIN (LOSS)
Net realized gain (loss) from:Investments—unaffiliated . . . . . . . . . . . . . . . . . . . . . . . . . . . . . . . . . . . . . . . . . . . . . . . . . . . . . . . . . . . . . . . . . . . . . . . . . . (6,818,010)Investments—affiliated . . . . . . . . . . . . . . . . . . . . . . . . . . . . . . . . . . . . . . . . . . . . . . . . . . . . . . . . . . . . . . . . . . . . . . . . . . . . 113,695Short sales . . . . . . . . . . . . . . . . . . . . . . . . . . . . . . . . . . . . . . . . . . . . . . . . . . . . . . . . . . . . . . . . . . . . . . . . . . . . . . . . . . . . . . 145,294Financial futures contracts . . . . . . . . . . . . . . . . . . . . . . . . . . . . . . . . . . . . . . . . . . . . . . . . . . . . . . . . . . . . . . . . . . . . . . . . . 14,908,930
Net realized gain . . . . . . . . . . . . . . . . . . . . . . . . . . . . . . . . . . . . . . . . . . . . . . . . . . . . . . . . . . . . . . . . . . . . . . . . . . . . . . . . . . . 8,349,909
Net change in unrealized appreciation/depreciation on:Investments . . . . . . . . . . . . . . . . . . . . . . . . . . . . . . . . . . . . . . . . . . . . . . . . . . . . . . . . . . . . . . . . . . . . . . . . . . . . . . . . . . . . . 992,641,860Financial futures contracts . . . . . . . . . . . . . . . . . . . . . . . . . . . . . . . . . . . . . . . . . . . . . . . . . . . . . . . . . . . . . . . . . . . . . . . . . 285,722
Net change in unrealized appreciation/depreciation . . . . . . . . . . . . . . . . . . . . . . . . . . . . . . . . . . . . . . . . . . . . . . . . . . . . . . . 992,927,582
TOTAL REALIZED AND UNREALIZED GAIN 1,001,277,491
NET INCREASE IN NET ASSETS RESULTING FROM OPERATIONS $1,084,163,080
The accompanying notes are an integral part of these financial statements. Appendix 85

S T A T E M E N T S O F C H A N G E S I N N E T A S S E T S : S&P 500 Stock Master Portfolio
INCREASE (DECREASE) IN NET ASSETS
Year EndedDecember 31,
2013
Year EndedDecember 31,
2012
OperationsNet investment income . . . . . . . . . . . . . . . . . . . . . . . . . . . . . . . . . . . . . . . . . . . . . . . . . . . . . . . . . . . . $ 82,885,589 $ 42,606,880Net realized gain . . . . . . . . . . . . . . . . . . . . . . . . . . . . . . . . . . . . . . . . . . . . . . . . . . . . . . . . . . . . . . . . . 8,349,909 213,322,470Net change in unrealized appreciation/depreciation . . . . . . . . . . . . . . . . . . . . . . . . . . . . . . . . . . . . . 992,927,582 27,276,473
Net increase in net assets resulting from operations 1,084,163,080 283,205,823
Capital TransactionsProceeds from contributions . . . . . . . . . . . . . . . . . . . . . . . . . . . . . . . . . . . . . . . . . . . . . . . . . . . . . . . . 3,187,732,511 392,443,684Value of withdrawals . . . . . . . . . . . . . . . . . . . . . . . . . . . . . . . . . . . . . . . . . . . . . . . . . . . . . . . . . . . . . . (718,697,605) (1,066,033,494)
Net increase (decrease) in net assets derived from capital transactions 2,469,034,906 (673,589,810)
NET ASSETSTOTAL INCREASE (DECREASE) IN NET ASSETS 3,553,197,986 (390,383,987)
Beginning of year . . . . . . . . . . . . . . . . . . . . . . . . . . . . . . . . . . . . . . . . . . . . . . . . . . . . . . . . . . . . . . . . . . . . 1,717,932,221 2,108,316,208
End of year $5,271,130,207 $ 1,717,932,221
F I N A N C I A L H I G H L I G H T S : S&P 500 Stock Master Portfolio
For Year Ended December 31,2013 2012 2011 2010 2009
TOTAL INVESTMENT RETURN 32.33% 15.98% 2.13% 15.06% 26.63%
Ratios to Average Net AssetsTotal expenses . . . . . . . . . . . . . . . . . . . . . . . . . . . . . . . . . 0.05% 0.06% 0.06% 0.05% 0.05%Total expenses after fees reimbursed . . . . . . . . . . . . . . . 0.05% 0.05% 0.05% 0.05% 0.05%Net investment income . . . . . . . . . . . . . . . . . . . . . . . . . . . 2.08% 2.22% 2.08% 2.01% 2.35%
SUPPLEMENTAL DATA
Net assets, end of year (000) . . . . . . . . . . . . . . . . . . . . . $5,271,130 $1,717,932 $2,108,316 $2,158,717 $2,049,062Portfolio turnover . . . . . . . . . . . . . . . . . . . . . . . . . . . . . . . . 2% 10% 5% 9% 5%
86 Appendix The accompanying notes are an integral part of these financial statements.

N O T E S T O F I N A N C I A L S T A T E M E N T S : S&P 500 Stock Master Portfolio
1. ORGANIZATIONS&P 500 Stock Master Portfolio (the “Master Portfolio”), a series ofMaster Investment Portfolio (“MIP”), is registered under the InvestmentCompany Act of 1940, as amended (the “1940 Act”), as a diversified,open-end management investment company. MIP is organized as aDelaware statutory trust.
Reorganization: The Board of Trustees of MIP (the “Board”), and theBoard of Master S&P 500 Index Series, a series of Quantitative MasterSeries LLC (the “Target Master Portfolio”), approved the reorganizationof the Target Master Portfolio into the Master Portfolio pursuant towhich the Master Portfolio acquired substantially all of the assets andsubstantially all of the liabilities of the Target Master Portfolio inexchange for beneficial interests of the Master Portfolio (the “MasterReorganization”). The Master Reorganization was approved by theshareholders of each feeder fund that invests its assets in the TargetMaster Portfolio. The Target Master Portfolio is the surviving entity fortax purposes.
The Target Master Portfolio’s net assets and composition of net assetson April 19, 2013, the valuation date of the reorganization, were asfollows:
Net assets . . . . . . . . . . . . . . . . . . . . . . . . . . . . . . . . . . . . . . . . . . . . . . . . $2,515,780,312Investors’ capital . . . . . . . . . . . . . . . . . . . . . . . . . . . . . . . . . . . . . . . . . . . $1,709,840,605Net unrealized appreciation (depreciation) . . . . . . . . . . . . . . . . . . . . . . . $ 805,939,707
For financial reporting purposes, assets received by the MasterPortfolio were recorded at fair value. However, the cost basis of theinvestments being received from the Target Master Portfolio werecarried forward to align ongoing reporting of the Master Portfolio’srealized and unrealized gains and losses for tax purposes.
The net assets of the Master Portfolio before the acquisition were$2,116,282,511. The aggregate net assets of the Master Portfolioimmediately after the acquisition amounted to $4,632,062,823. TheTarget Master Portfolio’s fair value and cost of investments prior to thereorganization were as follows:
Fair Value ofInvestments
Cost ofInvestments
Target Master Portfolio . . . . . . . . . . . . . . . . . . . . . . . $2,451,677,239 $1,645,737,532
The purpose of this transaction was to combine two portfolios managedby BlackRock Fund Advisors (“BFA” or the “Manager”) with the same orsubstantially similar (but not identical) investment objectives, investmentpolicies, strategies, risks and restrictions. The reorganization was atax-free event and was effective on April 22, 2013.
Assuming the acquisition had been completed on January 1, 2013, thebeginning of the fiscal reporting period of the Master Portfolio, the proforma results of operations for the year ended December 31, 2013 areas follows:
‰ Net investment income: $98,196,994‰ Net realized and change in unrealized gain on investments:$1,618,199,797
‰ Net increase in net assets resulting from operations: $1,716,396,791
Because the combined investment portfolios have been managed as asingle integrated portfolio since the acquisition was completed, it is notpracticable to separate the amounts of revenue and earnings of theTarget Master Portfolio that have been included in the MasterPortfolio’s Statement of Operations since April 22, 2013.
Reorganization costs incurred in connection with the reorganizationwere expensed by the Master Portfolio and reimbursed by BFA.
2. SIGNIFICANT ACCOUNTING POLICIESThe Master Portfolio’s financial statements are prepared in conformitywith accounting principles generally accepted in the United States ofAmerica (“US GAAP”), which may require management to makeestimates and assumptions that affect the reported amounts of assetsand liabilities in the financial statements and the reported amounts ofincreases and decreases in net assets from operations during thereporting period. Actual results could differ from those estimates. Thefollowing is a summary of the significant accounting policies followedby the Master Portfolio:
Valuation: US GAAP defines fair value as the price the Master Portfoliowould receive to sell an asset or pay to transfer a liability in an orderlytransaction between market participants at the measurement date. TheMaster Portfolio determines the fair values of its financial instrumentsat market value using independent dealers or pricing services underpolicies approved by the Board of Trustees of MIP (the “Board”). TheBlackRock Global Valuation Methodologies Committee (the “GlobalValuation Committee”) is the committee formed by management todevelop global pricing policies and procedures and to provideoversight of the pricing function for the Master Portfolio for allfinancial instruments.
Equity investments traded on a recognized securities exchange or theNASDAQ Stock Market (“NASDAQ”) are valued at the last reportedsale price that day or the NASDAQ official closing price, if applicable.For equity investments traded on more than one exchange, the lastreported sale price on the exchange where the stock is primarily tradedis used. Equity investments traded on a recognized exchange for whichthere were no sales on that day are valued at the last available bid(long positions) or ask (short positions) price. Financial futurescontracts traded on exchanges are valued at their last sale price.Investments in open-end registered investment companies are valuedat NAV each business day. Short-term securities with remainingmaturities of 60 days or less may be valued at amortized cost, whichapproximates fair value.
In the event that application of these methods of valuation results in aprice for an investment that is deemed not to be representative of themarket value of such investment or if a price is not available, theinvestment will be valued by the Global Valuation Committee, or itsdelegate, in accordance with a policy approved by the Board asreflecting fair value (“Fair Value Assets”). When determining the pricefor Fair Value Assets, the Global Valuation Committee, or its delegate,seeks to determine the price that Master Portfolio might reasonablyexpect to receive from the current sale of that asset in an arm’s-lengthtransaction. Fair value determinations shall be based upon all availablefactors that the Global Valuation Committee, or its delegate, deemrelevant consistent with the principles of fair value measurement whichinclude the market approach, income approach and/or in the case ofrecent investments, the cost approach, as appropriate. The market
Appendix 87
N O T E S T O F I N A N C I A L S T A T E M E N T S : S&P 500 Stock Master Portfolio (continued)
approach generally consists of using comparable market transactions.The income approach generally is used to discount future cash flows topresent value and is adjusted for liquidity as appropriate. These factorsinclude but are not limited to: (i) attributes specific to the investment orasset; (ii) the principal market for the investment or asset; (iii) thecustomary participants in the principal market for the investment orasset; (iv) data assumptions by market participants for the investmentor asset, if reasonably available; (v) quoted prices for similarinvestments or assets in active markets; and (vi) other factors, such asfuture cash flows, interest rates, yield curves, volatilities, prepaymentspeeds, loss severities, credit risks, recovery rates, liquidation amountsand/or default rates. Due to the inherent uncertainty of valuations ofsuch investments, the fair values may differ from the values that wouldhave been used had an active market existed. The Global ValuationCommittee, or its delegate, employs various methods for calibratingvaluation approaches for investments where an active market does notexist, including regular due diligence of the Master Portfolio’s pricingvendors, regular reviews of key inputs and assumptions, transactionalback-testing or disposition analysis to compare unrealized gains andlosses to realized gains and losses, reviews of missing or stale pricesand large movements in market values and reviews of any marketrelated activity. The pricing of all Fair Value Assets is subsequentlyreported to the Board or a committee thereof on a quarterly basis.
Segregation and Collateralization: In cases where a Master Portfolioenters into certain investments (e.g. financial futures contracts) thatwould be “senior securities” for 1940 Act purposes, the Master Portfoliomay segregate or designate on its books and records cash or liquidsecurities having a market value at least equal to the amount of theMaster Portfolio’s future obligations under such investments. Doing soallows the Master Portfolio to not treat the investment as a “seniorsecurity.” Furthermore, if required by an exchange or counterpartyagreement, the Master Portfolio may be required to deliver/depositcash and/or securities to/with an exchange, or broker-dealer orcustodian as collateral for certain investments or obligations.
Investment Transactions and Investment Income: For financialreporting purposes, investment transactions are recorded on the datesthe transactions are entered into (the trade dates). Realized gains andlosses on investment transactions are determined on the identified costbasis. Dividend income is recorded on the ex-dividend dates.Dividends from foreign securities where the ex-dividend date may havepassed are subsequently recorded when the Master Portfolio isinformed of the ex-dividend date. Under the applicable foreign tax laws,a withholding tax at various rates may be imposed on capital gains,dividends and interest. Upon notification from issuers, some of thedividend income received from a real estate investment trust may beredesignated as a reduction of cost of the related investment and/orrealized gain. Interest income, including amortization and accretion ofpremiums and discounts on debt securities, is recognized on theaccrual basis.
Income Taxes: The Target Master Portfolio is classified as a partnershipfor federal income tax purposes. As such, each investor in the TargetMaster Portfolio is treated as the owner of its proportionate share of netassets, income, expenses and realized and unrealized gains and lossesof the Target Master Portfolio. Therefore, no federal income taxprovision is required. It is intended that the Target Master Portfolio’sassets will be managed so an investor in the Target Master Portfolio cansatisfy the requirements of Subchapter M of the Internal Revenue Codeof 1986, as amended.
The Target Master Portfolio files US federal and various state and localtax returns. No income tax returns are currently under examination.The statute of limitations on the Target Master Portfolio’s US federaltax returns remains open for each of the four years endedDecember 31, 2013. The statutes of limitations on the Target MasterPortfolio’s state and local tax returns may remain open for an additionalyear depending upon the jurisdiction.
Management has analyzed tax laws and regulations and theirapplication to the Target Master Portfolio’s facts and circumstancesand does not believe there are any uncertain tax positions that requirerecognition of a tax liability.
Other: Expenses directly related to the Master Portfolio are charged tothe Master Portfolio. Other operating expenses shared by severalfunds are pro rated among those funds on the basis of relative netassets or other appropriate methods.
The Master Portfolio has an arrangement with the custodian wherebyfees may be reduced by credits earned on uninvested cash balances,which, if applicable, are shown as fees paid indirectly in the Statementof Operations. The custodian imposes fees on overdrawn cashbalances, which can be offset by accumulated credits earned or mayresult in additional custody charges.
3. SECURITIES AND OTHER INVESTMENTSPreferred Stock: The Master Portfolio may invest in preferred stock.Preferred stock has a preference over common stock in liquidation(and generally in receiving dividends as well) but is subordinated to theliabilities of the issuer in all respects. As a general rule, the marketvalue of preferred stock with a fixed dividend rate and no conversionelement varies inversely with interest rates and perceived credit risk,while the market price of convertible preferred stock generally alsoreflects some element of conversion value. Because preferred stock isjunior to debt securities and other obligations of the issuer,deterioration in the credit quality of the issuer will cause greaterchanges in the value of a preferred stock than in a more senior debtsecurity with similar stated yield characteristics. Unlike interestpayments on debt securities, preferred stock dividends are payableonly if declared by the issuer’s board of directors. Preferred stock alsomay be subject to optional or mandatory redemption provisions.
Short Sales: The Master Portfolio may enter into short saletransactions in which the Master Portfolio sells a security it does nothold in anticipation of a decline in the market price of that security.When the Master Portfolio makes a short sale, it will borrow thesecurity sold short and deliver the security to the counterparty to whichit sold the security short. An amount equal to the proceeds received bythe Master Portfolio is reflected as an asset and an equivalent liability.The amount of the liability is subsequently marked-to-market to reflectthe market value of the short sale. The Master Portfolio is required torepay the counterparty any dividends received on the security soldshort, which is shown as dividend expense in the Statement ofOperations. The Master Portfolio may pay a fee on the assetsborrowed from the counterparty, which is shown as stock loan fees inthe Statement of Operations. The Master Portfolio maintains asegregated account of securities or deposits cash with the broker-dealer as collateral for the short sales. The Master Portfolio mayreceive interest on the cash collateral deposited with the broker-dealer.The Master Portfolio is exposed to market risk based on the amount, if
88 Appendix

N O T E S T O F I N A N C I A L S T A T E M E N T S : S&P 500 Stock Master Portfolio (continued)
any, that the market value of the security increases beyond the marketvalue at which the position was sold. Thus, a short sale of a securityinvolves the risk that instead of declining, the price of the security soldshort will rise. The short sale of securities involves the possibility of atheoretically unlimited loss since there is a theoretically unlimitedpotential for the market price of the security sold short to increase. Again, limited to the price at which the Master Portfolio sold the securityshort, or a loss, unlimited as to the dollar amount, will be recognizedupon the termination of a short sale if the market price is either lessthan or greater than the proceeds originally received. There is noassurance the Master Portfolio will be able to close out a short positionat a particular time or at an acceptable price.
Securities Lending: The Master Portfolio may lend securities toapproved borrowers, such as banks, brokers and other financialinstitutions. The borrower pledges cash, securities issued orguaranteed by the US government or irrevocable letters of creditissued by a bank as collateral. The initial collateral received by theMaster Portfolio should have a value of at least 102% of the currentvalue of the loaned securities for securities traded on US exchangesand a value of at least 105% for all other securities. The collateral ismaintained thereafter in an amount equal to at least 100% of thecurrent market value of the loaned securities. The market value of theloaned securities is determined at the close of business of the MasterPortfolio and any additional required collateral is delivered to theMaster Portfolio on the next business day. Securities lending income,as disclosed in the Statement of Operations, represents the incomeearned from the investment of the cash collateral, net of rebates paidto, or fees paid by, borrowers and less the fees paid to the securitieslending agent. During the term of the loan, the Master Portfolio earnsdividend or interest income on the securities loaned but does notreceive interest income on the securities received as collateral. Loansof securities are terminable at any time and the borrower, after notice,is required to return borrowed securities within the standard time periodfor settlement of securities transactions.
The market value of securities on loan and the value of the relatedcollateral are shown separately in the Statement of Assets andLiabilities as a component of investments at value, and collateral onsecurities loaned at value, respectively. The cash collateral invested bythe securities lending agent, BlackRock Institutional Trust Company,N.A. (“BTC”), is disclosed in the Schedule of Investments.
Securities lending transactions are entered into by the Master Portfoliounder Master Securities Lending Agreements (“MSLA”) which providethe right, in the event of default (including bankruptcy or insolvency) forthe non-defaulting party to liquidate the collateral and calculate a netexposure to the defaulting party or request additional collateral. In theevent that a borrower defaults, the Master Portfolio, as lender, wouldoffset the market value of the collateral received against the marketvalue of the securities loaned. The value of the collateral is typicallygreater than that of the market value of the securities loaned, leavingthe lender with a net amount payable to the defaulting party. However,bankruptcy or insolvency laws of a particular jurisdiction may imposerestrictions on or prohibitions against such a right of offset in the eventof a MSLA counterparty’s bankruptcy or insolvency. Under the MSLA,the borrower can resell or re-pledge the loaned securities, and theMaster Portfolio can reinvest cash collateral, or upon an event ofdefault, resell or re-pledge the collateral.
The following table is a summary of the Master Portfolio’s securitieslending agreements by counterparty which are subject to offset under aMSLA as of December 31, 2013:
Counterparty
SecuritiesLoaned at
Value
CashCollateralReceived1
NetAmount
Barclays Capital, Inc. . . . . . . . . . . . . . . . . . . . . $ 3,148,785 $ (3,148,785) —Citigroup Global Markets, Inc. . . . . . . . . . . . . . 265,005 (265,005) —Credit Suisse Securities (USA) LLC . . . . . . . . 5,052,347 (5,052,347) —Deutsche Bank Securities, Inc. . . . . . . . . . . . . 5,188,082 (5,188,082) —Goldman Sachs & Co. . . . . . . . . . . . . . . . . . . . 25,081,633 (25,081,633) —HSBC Bank PLC . . . . . . . . . . . . . . . . . . . . . . . 631,800 (631,800) —IBG LLC . . . . . . . . . . . . . . . . . . . . . . . . . . . . . . 198,003 (198,003) —JP Morgan Securities LLC . . . . . . . . . . . . . . . . 19,292,046 (19,292,046) —Merrill Lynch, Pierce, Fenner & Smith Inc. . . . 1,286,790 (1,286,790) —Morgan Stanley . . . . . . . . . . . . . . . . . . . . . . . . 1,359,368 (1,359,368) —National Financial Services LLC . . . . . . . . . . . 2,651,800 (2,651,800) —State Street Bank & Trust Co. . . . . . . . . . . . . . 762,620 (762,620) —UBS Securities LLC . . . . . . . . . . . . . . . . . . . . . 8,900,308 (8,900,308) —
Total . . . . . . . . . . . . . . . . . . . . . . . . . . . . . . . . $73,818,587 $(73,818,587) —
1 Collateral with a value of $75,424,060 has been received in connection with securitieslending agreements. Excess of collateral received from the individual counterparty is notshown for financial reporting purposes.
The risks of securities lending also include the risk that the borrowermay not provide additional collateral when required or may not returnthe securities when due. To mitigate this risk, the Master Portfoliobenefits from a borrower default indemnity provided by BlackRock, Inc.(“BlackRock”). BlackRock’s indemnity allows for full replacement of thesecurities lent. The Master Portfolio also could suffer a loss if the valueof an investment purchased with cash collateral falls below the marketvalue of loaned securities or if the value of an investment purchasedwith cash collateral falls below the value of the original cash collateralreceived. During the year ended December 31, 2013, any securities onloan were collateralized by cash.
4. DERIVATIVE FINANCIAL INSTRUMENTSThe Master Portfolio engages in various portfolio investment strategiesusing derivative contracts both to increase the returns of the MasterPortfolio and/or to economically hedge its exposure to certain riskssuch as equity risk. These contracts may be transacted on anexchange or over-the-counter (“OTC”).
Financial Futures Contracts: The Master Portfolio purchases and/orsells financial futures contracts and options on financial futurescontracts to gain exposure to, or economically hedge against, changesin the value of equity securities (equity risk). Financial futures contractsare agreements between the Master Portfolio and a counterparty tobuy or sell a specific quantity of an underlying instrument at a specifiedprice and at a specified date. Depending on the terms of the particularcontract, financial futures contracts are settled either through physicaldelivery of the underlying instrument on the settlement date or bypayment of a cash settlement amount on the settlement date. Uponentering into a financial futures contract, the Master Portfolio isrequired to deposit initial margin with the broker in the form of cash orsecurities in an amount that varies depending on a contract’s size andrisk profile. The initial margin deposit must then be maintained at anestablished level over the life of the contract. Securities deposited asinitial margin are designated on the Schedule of Investments and cashdeposited, if any, is recorded on the Statement of Assets and Liabilitiesas cash pledged for financial futures contracts. Pursuant to the
Appendix 89

N O T E S T O F I N A N C I A L S T A T E M E N T S : S&P 500 Stock Master Portfolio (continued)
contract, the Master Portfolio agrees to receive from or pay to thebroker an amount of cash equal to the daily fluctuation in value of thecontract. Such receipts or payments are known as variation margin.Variation margin is recorded by the Master Portfolio as unrealizedappreciation or depreciation or depreciation, and if applicable, as areceivable or payable for variation margin in the Statement of Assetsand Liabilities. When the contract is closed, the Master Portfoliorecords a realized gain or loss equal to the difference between thevalue of the contract at the time it was opened and the value at thetime it was closed. The use of financial futures contracts involves therisk of an imperfect correlation in the movements in the price offinancial futures contracts, interest rates and the underlying assets.
The following is a summary of the Master Portfolio’s derivative financialinstruments categorized by risk exposure:
Fair Values of Derivative Financial Instruments as of December 31, 2013
Derivative Liabilities
Statement of Assets andLiabilities Location Value
Equity contracts . . . . . . . . . . . . . . . . . . . . Net unrealized appreciation/depreciation1 $677,360
1 Includes cumulative appreciation/depreciation on financial futures contracts as reportedin the Schedule of Investments. Only current day’s variation margin is reported withinthe Statement of Assets and Liabilities.
The Effect of Derivative Financial Instruments in the Statement of OperationsYear Ended December 31, 2013
Net Realized Gain (Loss) From
Equity contracts:Financial futures contracts . . . . . . . . . . . . . . . . . . . . . . . . . . . . . . $14,908,930
Net Change in Unrealized Appreciation/Depreciation on
Equity contracts:Financial futures contracts . . . . . . . . . . . . . . . . . . . . . . . . . . . . . . $ 285,722
For the year ended December 31, 2013, the average quarterlybalances of outstanding derivative financial instruments were asfollows:
Financial futures contracts:Average number of contracts purchased . . . . . . . . . . . . . . . . . 590Average notional value of contracts purchased . . . . . . . . . . . . $48,322,384
Counterparty Credit Risk: A derivative contract may suffer a mark tomarket loss if the value of the contract decreases due to anunfavorable change in the market rates or values of the underlyinginstrument. Losses can also occur if the counterparty does not performunder the contract.
The Master Portfolio’s risk of loss from counterparty credit risk on OTCderivatives is generally limited to the aggregate unrealized gain nettedagainst any collateral held by such Master Portfolio. With exchangedtraded futures, there is less counterparty credit risk to the MasterPortfolio since the exchange or clearinghouse, as counterparty to suchinstruments, guarantees against a possible default. The clearinghousestands between the buyer and the seller of the contract; therefore,credit risk is limited to failure of the clearinghouse. While offset rights
may exist under applicable law, a Master Portfolio does not have acontractual right of offset against a clearing broker or clearinghouse inthe event of a default (including the bankruptcy or insolvency) of theclearing broker or clearinghouse. Additionally, credit risk exists inexchange traded futures with respect to initial and variation margin thatis held in a clearing broker’s customer accounts. While clearing brokersare required to segregate customer margin from their own assets, inthe event that a clearing broker becomes insolvent or goes intobankruptcy and at that time there is a shortfall in the aggregate amountof margin held by the clearing broker for all its clients, typically theshortfall would be allocated on a pro rata basis across all the clearingbroker’s customers, potentially resulting in losses to the MasterPortfolio.
5. INVESTMENT ADVISORY AGREEMENT AND OTHERTRANSACTIONS WITH AFFILIATESThe PNC Financial Services Group, Inc. is the largest stockholder andan affiliate, for 1940 Act purposes, of BlackRock.
MIP, on behalf of the Master Portfolio, entered into an InvestmentAdvisory Agreement (the “Investment Advisory Agreement”) with BFA,the Master Portfolio’s investment advisor, an indirect, wholly ownedsubsidiary of BlackRock, to provide investment advisory services. BFAis responsible for the management of the Master Portfolio’sinvestments and provides the necessary personnel, facilities,equipment and certain other services necessary to the operations ofthe Master Portfolio. For such services, the Master Portfolio pays BFAa monthly fee based on a percentage of the Master Portfolio’s averagedaily net assets at an annual rate of 0.05%.
MIP entered into an Administration Agreement with BlackRockAdvisors, LLC (“BAL”), which has agreed to provide generaladministration services (other than investment advice and relatedportfolio activities). BAL may delegate certain of its administrationduties to sub-administrators. BAL, in consideration thereof, has agreedto bear all of the Master Portfolio’s and MIP’s ordinary operatingexpenses excluding, generally, investment advisory fees, distributionfees, brokerage and other expenses related to the execution ofportfolio transactions, extraordinary expenses and certain otherexpenses which are borne by the Master Portfolio.
BAL is not entitled to compensation for providing administrationservices to the Master Portfolio, for so long as BAL is entitled tocompensation for providing administration services to correspondingfeeder funds that invest substantially all of their assets in the MasterPortfolio, or BAL (or an affiliate) receives investment advisory fees fromthe Master Portfolio.
The fees and expenses of MIP’s trustees who are not “interestedpersons” of MIP, as defined in the 1940 Act (“Independent Trustees”),counsel to the Independent Trustees and MIP’s independent registeredpublic accounting firm (together, the “independent expenses”) are paiddirectly by the Master Portfolio. BFA has contractually agreed to capthe expenses of the Master Portfolio at the rate at which the MasterPortfolio pays an advisory fee to BFA by providing an offsetting creditagainst the investment advisory fees paid by the Master Portfolio in anamount equal to the independent expenses. This contractual waiver iseffective through April 30, 2014. The amount of the waiver, if any, isshown as fees reimbursed in the Statement of Operations.
90 Appendix

N O T E S T O F I N A N C I A L S T A T E M E N T S : S&P 500 Stock Master Portfolio (continued)
MIP, on behalf of the Master Portfolio, received an exemptive orderfrom the Securities and Exchange Commission permitting it, amongother things, to pay an affiliated securities lending agent a fee basedon a share of the income derived from the securities lending activitiesand has retained BTC, an affiliate of BFA as the securities lendingagent. BTC may, on behalf of the Master Portfolio, invest cashcollateral received by the Master Portfolio for such loans, in a privateinvestment company managed by the BFA or in registered moneymarket funds advised by the Manager or its affiliates. The market valueof securities on loan and the value of the related collateral, ifapplicable, is shown in the Statement of Assets and Liabilities assecurities loaned at value and collateral on securities loaned at value,respectively. The cash collateral invested by BTC, if any, is disclosedin the Schedule of Investments. Securities lending income is equal tothe total of income earned from the reinvestment of cash collateral, netof rebates paid to, or fees paid by, borrowers of securities. The MasterPortfolio retains 65% of securities lending income and pays a fee toBTC equal to 35% of such income. The Master Portfolio benefits froma borrower default indemnity provided by BlackRock. As securitieslending agent, BTC bears all operational costs directly related tosecurities lending as well as the cost of borrower defaultindemnification. BTC does not receive any fees for managing the cashcollateral. The share of income earned by the Master Portfolio is shownas securities lending — affiliated — net in the Statement of Operations.For the year ended December 31, 2013, BTC received $139,417 insecurities lending agent fees related to securities lending activities forthe Master Portfolio.
During the year ended December 31, 2013, the Master Portfolioreceived a payment from an affiliate to compensate for foregonesecurities lending revenue, which is Other Income — affiliated in theStatement of Operations.
Certain officers and/or trustees of MIP are officers and/or directors ofBlackRock or its affiliates.
The Master Portfolio may purchase securities from, or sell securities to,an affiliated fund provided the affiliation is due solely to having acommon investment adviser, common officers, or common trustees.For the year ended December 31, 2013, the purchase and saletransactions from an affiliated fund in compliance with Rule 17a-7under the 1940 Act were $27,052,195 and $8,651,416, respectively.
6. PURCHASES AND SALESPurchases and sales of investments, excluding short-term securities,for the year ended December 31, 2013, were $91,415,528 and$205,021,342, respectively.
7. BANK BORROWINGSMIP, on behalf of the Master Portfolio, along with certain other fundsmanaged by the Manager and its affiliates (“Participating Funds”), is a
party to a 364-day, $800 million credit agreement with a group oflenders, under which the Master Portfolio may borrow to fundshareholder redemptions. The agreement expires in April 2014.Excluding commitments designated for a certain individual fund, otherParticipating Funds, including the Master Portfolio, can borrow up to anaggregate commitment amount of $500 million, subject to assetcoverage and other limitations as specified in the agreement. Thecredit agreement has the following terms: a fee of 0.065% per annumon unused commitment amounts and interest at a rate equal to thehigher of (a) the one-month LIBOR plus 0.80% per annum or (b) theFed Funds rate plus 0.80% per annum on amounts borrowed.Participating Funds paid administration and arrangement fees, which,along with commitment fees, were allocated among such funds basedupon portions of the aggregate commitment available to them andrelative net assets of Participating Funds. The Master Portfolio did notborrow under the credit agreement during the year endedDecember 31, 2013.
8. MARKET AND CREDIT RISKIn the normal course of business, the Master Portfolio invest insecurities and enters into transactions where risks exist due tofluctuations in the market (market risk) or failure of the issuer of asecurity to meet all its obligations (issuer credit risk). The value ofsecurities held by the Master Portfolio may decline in response tocertain events, including those directly involving the issuers whosesecurities are owned by the Master Portfolio; conditions affecting thegeneral economy; overall market changes; local, regional or globalpolitical, social or economic instability; and currency and interest rateand price fluctuations. Similar to issuer credit risk, the Master Portfoliomay be exposed to counterparty credit risk, or the risk that an entitywith which the Master Portfolio has unsettled or open transactions mayfail to or be unable to perform on its commitments. The Master Portfoliomanages counterparty credit risk by entering into transactions only withcounterparties that it believes have the financial resources to honortheir obligations and by monitoring the financial stability of thosecounterparties. Financial assets, which potentially expose the MasterPortfolio to market, issuer and counterparty credit risks, consistprincipally of financial instruments and receivables due fromcounterparties. The extent of the Master Portfolio’s exposure to market,issuer and counterparty credit risks with respect to these financialassets is generally approximated by their value recorded in theStatement of Assets and Liabilities, less any collateral held by theMaster Portfolio.
9. SUBSEQUENT EVENTSManagement has evaluated the impact of all subsequent events on theMaster Portfolio through the date the financial statements were issuedand has determined that there were no subsequent events requiringadjustment or additional disclosure in the financial statements.
Appendix 91
S & P 5 0 0 S T O C K M A S T E R P O R T F O L I O
Report of Independent Registered PublicAccounting Firm
To the Board of Trustees of Master Investment Portfolio and the Interestholders of S&P 500 Stock Master Portfolio:
In our opinion, the accompanying statement of assets and liabilities, including the schedule of investments, and therelated statements of operations and of changes in net assets and the financial highlights present fairly, in allmaterial respects, the financial position of the S&P 500 Stock Master Portfolio (the “Master Portfolio”), a series ofMaster Investment Portfolio, at December 31, 2013, the results of its operations for the year then ended, thechanges in its net assets for each of the two years in the period then ended and the financial highlights for each ofthe five years in the period then ended, in conformity with accounting principles generally accepted in the UnitedStates of America. These financial statements and financial highlights (hereafter referred to as “financialstatements”) are the responsibility of the Master Portfolio’s management. Our responsibility is to express an opinionon these financial statements based on our audits. We conducted our audits of these financial statements in accord-ance with the standards of the Public Company Accounting Oversight Board (United States). Those standardsrequire that we plan and perform the audit to obtain reasonable assurance about whether the financial statementsare free of material misstatement. An audit includes examining, on a test basis, evidence supporting the amountsand disclosures in the financial statements, assessing the accounting principles used and significant estimates madeby management, and evaluating the overall financial statement presentation. We believe that our audits, whichincluded confirmation of securities at December 31, 2013 by correspondence with the custodian, transfer agent andbroker, provide a reasonable basis for our opinion.
/s/ PricewaterhouseCoopers LLPPhiladelphia, PennsylvaniaFebruary 24, 2014
92 Appendix

S & P 5 0 0 S T O C K M A S T E R P O R T F O L I O
Officers and TrusteesI N D E P E N D E N T T R U S T E E S 1
NAME, ADDRESS ANDYEAR OF BIRTH
POSITION(S)HELD WITHTRUST/MIP
LENGTH OF TIMESERVED AS ATRUSTEE2
PRINCIPAL OCCUPATIONS(S)DURING PAST FIVE YEARS
NUMBER OFBLACKROCK—ADVISED REGISTEREDINVESTMENTCOMPANIES (“RICs”)CONSISTING OFINVESTMENTPORTFOLIOS(“PORTFOLIOS”)OVERSEEN
PUBLICDIRECTORSHIPS
Ronald W. Forbes55 East 52nd StreetNew York, NY 100551940
Co-Chairman ofthe Board andTrustee
Since 2009 Professor Emeritus of Finance, School ofBusiness, State University of New York at Albanysince 2000.
33 RICs consisting of107 Portfolios
None
Rodney D. Johnson
55 East 52nd StreetNew York, NY 10055
1941
Co-Chairman ofthe Board andTrustee
Since 2009 President, Fairmount Capital Advisors, Inc. from1987 to 2013; Member of the ArchdiocesanInvestment Committee of the Archdiocese ofPhiladelphia from 2004 to 2012; Director, TheCommittee of Seventy (civic) from 2006 to 2012;Director, Fox Chase Cancer Center from 2004 to2011.
33 RICs consisting of107 Portfolios
None
David O. Beim
55 East 52nd StreetNew York, NY 10055
1940
Trustee Since 2009 Professor of Professional Practice at theColumbia University Graduate School of Businesssince 1991; Trustee, Phillips Exeter Academyfrom 2002 to 2012; Chairman, Wave Hill, Inc.(public garden and cultural center) from 1990 to2006.
33 RICs consisting of107 Portfolios
None
Dr. Matina S. Horner55 East 52nd StreetNew York NY 100551939
Trustee Since 2009 Executive Vice President Teachers Insurance andAnnuity Association and College RetirementEquities Fund from 1989 to 2003.
33 RICs consisting of107 Portfolios
NSTAR (electricand gas utility)
Herbert l. London
55 East 52nd StreetNew York, NY 10055
1939
Trustee Since 2009 President, London Center for Policy Researchsince 2012; Professor Emeritus, New YorkUniversity since 2005; John M. Olin Professor ofHumanities, New York University from 1993 to2005 and Professor thereof from 1980 to 2005;President, Emeritus, Hudson Institute (policyresearch organization) from 2011 to 2012, since2011, President thereof from 1997 to 2011 andTrustee from 1980 to 2012; Chairman of theBoard of Trustees for Grantham University since2006; Director, InnoCentive, Inc. (global internetservices) since 2005; Director, Cerego, LLC(educational software) since 2005; Director,Cybersettle (online adjudication) since 2009;Director, AIMS Worldwide, Inc. (marketing from2007 to 2012)
33 RICs consisting of107 Portfolios
None
Ian A. Mackinnon55 East 52nd StreetNew York, NY 100551948
Trustee Since 2012 Director, Kennett Capital, Inc. (investments) since2006; Director, Free Library of Philadelphia from1998 to 2008
33 RICs consisting of107 Portfolios
None
Cynthia A. Montgomery55 East 52nd StreetNew York, NY 100551952
Trustee Since 2009 Professor, Harvard Business School since 1989;Director, McLean Hospital from 2005 to 2012;Director, Harvard Business School Publishingfrom 2005 to 2010.
33 RICs consisting of107 Portfolios
NewellRubbermaid, Inc.(manufacturing)
Appendix 93

S & P 5 0 0 S T O C K M A S T E R P O R T F O L I O
Officers and Trustees (continued)
I N D E P E N D E N T T R U S T E E S 1
NAME, ADDRESS ANDYEAR OF BIRTH
POSITION(S)HELD WITHTRUST/MIP
LENGTH OF TIMESERVED AS ATRUSTEE2
PRINCIPAL OCCUPATIONS(S)DURING PAST FIVE YEARS
NUMBER OFBLACKROCK—ADVISED REGISTEREDINVESTMENTCOMPANIES (“RICs”)CONSISTING OFINVESTMENTPORTFOLIOS(“PORTFOLIOS”)OVERSEEN
PUBLICDIRECTORSHIPS
Joseph P. Platt
55 East 52nd StreetNew York, NY 10055
1947
Trustee Since 2009 Director, Jones and Brown (Canadian insurancebroker) since 1998; General Partner, ThornPartners, LP (private investments) since 1998;Director, WQED Multi-Media (public broadcastingnot-for-profit) since 2001; Director, The WestPenn Allegheny Health System (a not-for-profithealth system) from 2008 to 2013; Partner,Amarna Corporation, LLC (private investmentcompany) from 2002 to 2008.
33 RICs consisting of107 Portfolios
Greenlight CapitalRe, Ltd.(reinsurancecompany)
Robert C. Robb, Jr.
55 East 52nd StreetNew York, NY 10055
1945
Trustee Since 2009 Partner, Lewis, Eckert, Robb and Company(management and financial consulting firm) since1981.
33 RICs consisting of107 Portfolios
None
Toby Rosenblatt
55 East 52nd StreetNew York, NY 10055
1938
Trustee Since 2009 President, Founders Investments Ltd. (privateinvestments) since 1999; Director, ForwardManagement, LLC since 2007; Director, CollegeAccess Foundation of California (philanthropicfoundation) since 2009; Director, A.P. Pharma,Inc. (speciality pharmaceuticals) from 1983 to2011; Director, The James Irvine Foundation(philanthropic foundation) from 1998 to 2008.
33 RICs consisting of107 Portfolios
None
Kenneth L. Urish
55 East 52nd StreetNew York, NY 10055
1951
Trustee Since 2009 Managing Partner, Urish Popeck & Co., LLC(certified public accountants and consultants)since 1976; Immediate past-Chairman of theProfessional Ethics Committee of thePennsylvania Institute of Certified PublicAccountants and Committee Member thereofsince 2007; Member of External Advisory Board,The Pennsylvania State University AccountingDepartment since 2001; Principal, UP StrategicWealth Investment Advisors, LLC since 2013;Trustee, The Holy Family Foundation from 2001to 2010; President and Trustee, PittsburghCatholic Publishing Associates from 2003 to2008; Director, Inter-Tel from 2006 to 2007.
33 RICs consisting of107 Portfolios
None
Frederick W. Winter
55 East 52nd StreetNew York, NY 10055
1945
Trustee Since 2009 Director, Alkon Corporation (pneumatics) since1992; Professor and Dean Emeritus of the JosephM. Katz School of Business, University ofPittsburgh from 2005 to 2013 and Dean thereoffrom 1997 to 2005; Director, Tippman Sports(recreation) from 2005 to 2013; Director,Indotronix International (IT services) from 2004to 2008.
33 RICs consisting of107 Portfolios
None
1 Trustees serve until their resignation, removal or death, or until December 31 of the year in which they turn 72. The Board has approved one-year extensions interms of Trustees who turn 72 prior to December 31, 2013.
2 Date shown is the earliest date a person has served for the MIP covered by this annual report. In connection with the acquisition of Barclays Global Investors byBlackRock, Inc. (“BlackRock”) in December 2009, the Trustees were elected to the MIP’s Board. As a result, although the chart shows certain Trustees as joiningthe MIP’s board in 2009, those Trustees first became a member of the boards of other funds advised by BlackRock Advisors, LLC or its affiliates as follows:David O. Beim, 1998; Ronald W. Forbes, 1977; Dr. Matina S. Horner, 2004; Rodney D. Johnson, 1995; Herbert I. London, 1987; Cynthia A. Montgomery, 1994;Joseph P. Platt, 1999; Robert C. Robb, Jr., 1998; Toby Rosenblatt, 2005; Kenneth L. Urish, 1999; and Frederick W. Winter, 1999.
94 Appendix

S & P 5 0 0 S T O C K M A S T E R P O R T F O L I O
Officers and Trustees (continued)
I N T E R E S T E D T R U S T E E S 3
NAME, ADDRESS ANDYEAR OF BIRTH
POSITION(S)HELD WITHTRUST/MIP
LENGTH OF TIMESERVED AS ATRUSTEE2
PRINCIPAL OCCUPATION(S)DURING PAST FIVE YEARS
NUMBER OFBLACKROCK—ADVISED REGISTEREDINVESTMENTCOMPANIES (“RICs”)CONSISTING OFINVESTMENTPORTFOLIOS(“PORTFOLIOS”)OVERSEEN
PUBLICDIRECTORSHIPS
Paul L. Audet
55 East 52nd StreetNew York, NY 10055
1953
Trustee Since 2011 Senior Managing Director of BlackRock,and Head of U.S. Mutual Funds since 2011;Chair of the U.S. Mutual Funds Committeereporting to the Global ExecutiveCommittee since 2011; Head ofBlackRock’s Real Estate business from2008 to 2011; Member of BlackRock’sGlobal Operating and Corporate RiskManagement Committees and of theBlackRock Alternative Investors ExecutiveCommittee and Investment Committee forthe Private Equity Fund of Funds businesssince 2008; Head of BlackRock’s GlobalCash Management business from 2005 to2010; Acting Chief Financial Officer ofBlackRock from 2007 to 2008; ChiefFinancial Officer of BlackRock from 1998 to2005.
144 RICs consisting of278 Portfolios
None
Henry Gabbay
55 East 52nd StreetNew York, NY 10055
1947
Trustee Since 2007 Consultant, BlackRock from 2007 to 2008;Managing Director, BlackRock from 1989to 2007; Chief Administrative Officer,BlackRock Advisors, LLC from 1998 to2007; President of BlackRock Funds andBlackRock Bond Allocation Target Shares(formerly BlackRock Bond Allocation TargetShares) from 2005 to 2007 and Treasurerof certain closed-end funds in theBlackRock fund complex from 1989 to2006.
144 RICs consisting of278 Portfolios
None
3 Mr. Audet is an “interested person,” as defined in the 1940 Act, of the MIP based on his position with BlackRock and its affiliates. Mr. Gabbay is an “interestedperson” of the MIP based on his former positions with BlackRock and its affiliates as well as his ownership of BlackRock and The PNC Financial Services Group,Inc. securities. Mr. Audet and Mr. Gabbay are also Directors of the BlackRock registered closed-end funds and Directors of other BlackRock registered open-endfunds. Trustees serve until their resignation, removal or death, or until December 31 of the year in which they turn 72.
Appendix 95

S & P 5 0 0 S T O C K M A S T E R P O R T F O L I O
Officers and Trustees (continued)
T R U S T / M I P O F F I C E R S 1
NAME, ADDRESS ANDYEAR OF BIRTH
POSITION(S)HELD WITH THETRUST/MIP
LENGTH OFTIME SERVED
PRINCIPAL OCCUPATION(S)DURING PAST FIVE YEARS
John M. Perlowski
55 East 52nd StreetNew York, NY 10055
1964
President andChief ExecutiveOfficer
Since 2010 Managing Director of BlackRock since 2009; Global Head of BlackRock Fund Services since2009; Managing Director and Chief Operating Officer of the Global Product Group atGoldman Sachs Asset Management, L.P. from 2003 to 2009; Treasurer of Goldman SachsMutual Funds from 2003 to 2009 and Senior Vice President thereof from 2007 to 2009;Director of Goldman Sachs Offshore Funds from 2002 to 2009; Director of Family ResourceNetwork (charitable foundation) since 2009.
Richard Hoerner, CFA
55 East 52nd StreetNew York, NY 10055
1958
Vice President Since 2009 Managing Director of BlackRock since 2000; Head of the Global Cash Group since 2013; Co-head of the Global Cash and Securities Lending Group from 2010 to 2013; Member of theCash Management Group Executive Committee since 2005.
Brendan Kyne
55 East 52nd StreetNew York, NY 10055
1977
Vice President Since 2009 Managing Director of BlackRock since 2010; Director of BlackRock, Inc. from 2008 to 2009;Head of Product Development and Management for BlackRock’s U.S. Retail Group since2009 and Co-head thereof from 2007 to 2009; Vice President of BlackRock from 2005 to2008.
Christopher Stavrakos, CFA
55 East 52nd StreetNew York, NY 10055
1959
Vice President Since 2009 Managing Director of BlackRock since 2006; Co-head of BlackRock’s Cash ManagementPortfolio Management Group since 2006; Senior Vice President, CIO, and Director of LiabilityManagement for the Securities Lending Group at Mellon Bank from 1999 to 2006.
Neal Andrews
55 East 52nd StreetNew York, NY 10055
1966
Chief FinancialOfficer
Since 2007 Managing Director of BlackRock since 2006; Senior Vice President and Line of BusinessHead of Fund Accounting and Administration at PNC Global Investment Servicing (U.S.) Inc.from 1992 to 2006.
Jay Fife
55 East 52nd StreetNew York, NY 10055
1970
Treasurer Since 2007 Managing Director of BlackRock since 2007; Director of BlackRock in 2006; AssistantTreasurer of the MLIM and Fund Asset Management, L.P. advised funds from 2005 to 2006;Director of MLIM Fund Services Group from 2001 to 2006.
Brian Kindelan
55 East 52nd StreetNew York, NY 10055
1959
ChiefComplianceOfficer andAnti-MoneyLaunderingOfficer
Since 2007 Chief Compliance Officer of the BlackRock-advised funds since 2007; Managing Director andSenior Counsel of BlackRock since 2005.
Benjamin Archibald
55 East 52nd StreetNew York, NY 10055
1975
Secretary Since 2012 Managing Director of BlackRock since 2014; Director of BlackRock from 2010 to 2013;Assistant Secretary of the BlackRock-advised funds from 2010 to 2012; General Counsel andChief Operating Officer of Uhuru Capital Management from 2009 to 2010; Executive Directorand Counsel of Goldman Sachs Asset Management from 2005 to 2009.
1 Officers of the MIP serve at the pleasure of the Board.
96 Appendix


Homestead Funds4301 Wilson Blvd.Arlington, VA 22203800-258-3030
homesteadfunds.com
This report is authorized for distribution toshareholders and others who have receiveda copy of the prospectus.
Distributor: RE Investment Corporation.