daily movements and local scale habitat … movements and local scale habitat characteristics of...
TRANSCRIPT

Daily movements and local scale
habitat characteristics of areas used
by wintering Whooping Cranes
HILLARY L. THOMPSON1,2, DR. PATRICK JODICE3, AND ANNE E. LACY2
1 DEPARTMENT OF FORESTRY AND ENVIRONMENTAL CONSERVATION, CLEMSON UNIVERSITY, CLEMSON SC
2 INTERNATIONAL CRANE FOUNDATION, BARABOO WI
3 U.S. GEOLOGICAL SURVEY, SOUTH CAROLINA COOPERATIVE FISH AND WILDLIFE RESEARCH UNIT, CLEMSON SC

History of Whooping Crane Populations
• Uncommon
wetland bird
• Migratory and
non-migratory
populations
• Population
decline due to
habitat loss,
hunting, and
collection
• Recovery efforts
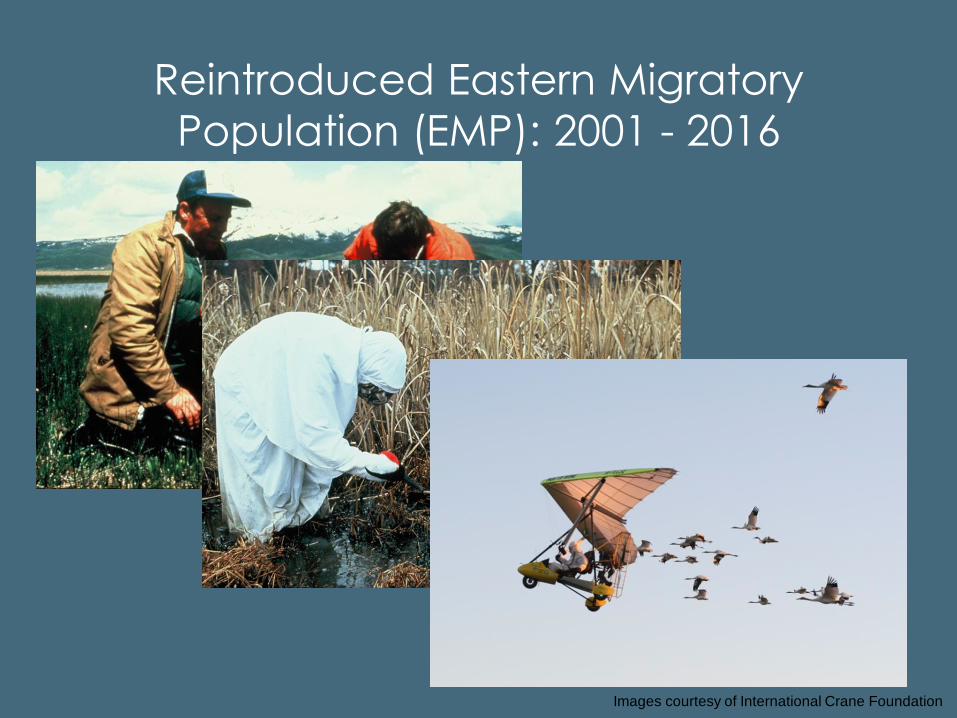
Reintroduced Eastern Migratory
Population (EMP): 2001 - 2016
Images courtesy of International Crane Foundation

Reintroduced Eastern Migratory
Population (EMP): 2001 - 2016
• Currently 102 individuals
• Successfully breeding but
not yet self-sustaining
population
• Nest abandonments
• Chick mortality
• Energetics?

Aransas-Wood Buffalo Population
Wintering Grounds
Image courtesy of International Crane Foundation
Image courtesy of USFWS – Aransas NWR
Coastal Texas Blue Crabs
Salt marsh habitat

EMP: Wintering Grounds
• Expanding winter
distribution
• Use of agricultural
habitats
• Non-territorial

Objectives
• Quantify daily movement
on the wintering grounds • Home range sizes
• Distances moved
• Timing of movements
• Identify local scale
habitat characteristics • Land cover types
• Water depth
• Vegetation height
• Distance to development
• Protected area status

Methods – Field data
• 2015 season
• 20 groups of cranes
• 6 states
• 29 Dec 2014 –
1 Feb 2015
• 2016 season
• 23 groups of cranes
• 8 states
• 2 Jan 2016 –
12 Feb 2016

Methods – Field data
• 2015 season
• 20 groups of cranes
• 6 states
• 29 Dec 2014 –
1 Feb 2015
• 2016 season
• 23 groups of cranes
• 8 states
• 2 Jan 2016 –
12 Feb 2016

Methods – Field data
• Radio telemetry and observations
• One full day per group
• Data point every 30 minutes
• Location, behavior, habitat data • General and specific habitat type
• Vegetation height
• Water depth
• Random points to compare to used locations
with logistic regression

Methods – Data Layers
• Habitat characteristics • National Land Cover Dataset
– Multi-resolution Land
Characteristics Consortium
• Protected land? • Protected Areas Database -
USGS
• Distance to roads • USA Major Roads - ESRI,
TomTom

Daily Movements
• Home Ranges
• 2015: 3.6 km2 KDE
• 2016: 4.1 km2 KDE
• Average distances moved
• 8.4 km in one day
• Maximum distance from roost
• 10.9 km
• Timing of movements

Daily Movements

Local scale habitat characteristics
• Observed Variables • Habitat types
• Water depth and
vegetation height
Water
0
0
0
1
7
101
61
222
Veg
0
1
31
59
29
94
127
147
2. Open Water 1. Cultivated Crops
3. Grassland/ Herbaceous
4. Wetland Emergent Herbaceous
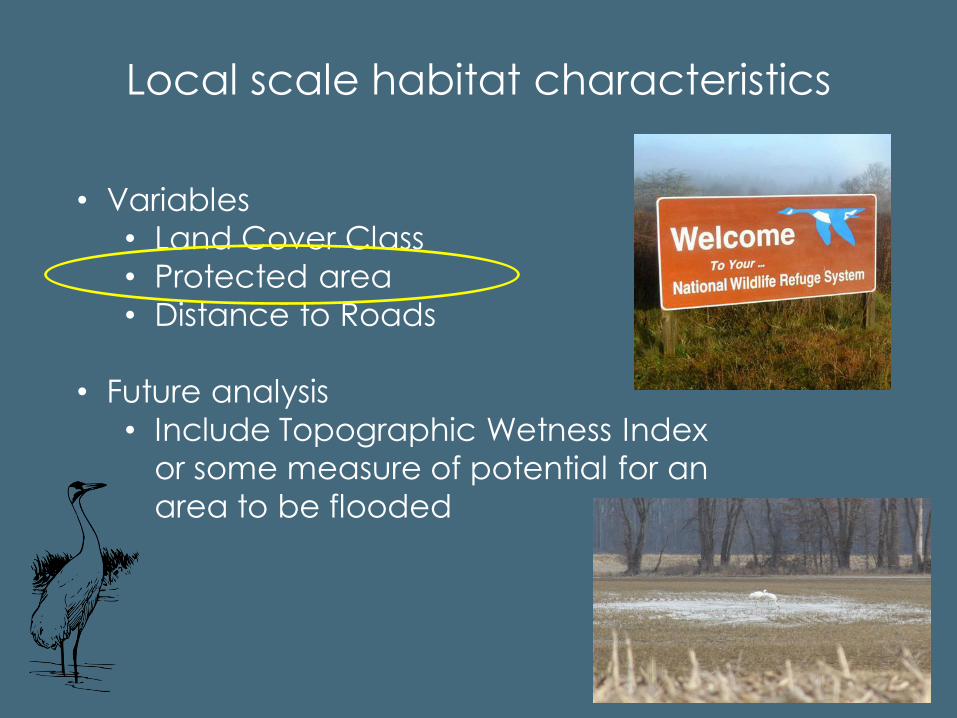
Local scale habitat characteristics
• Variables
• Land Cover Class
• Protected area
• Distance to Roads
• Future analysis
• Include Topographic Wetness Index
or some measure of potential for an
area to be flooded
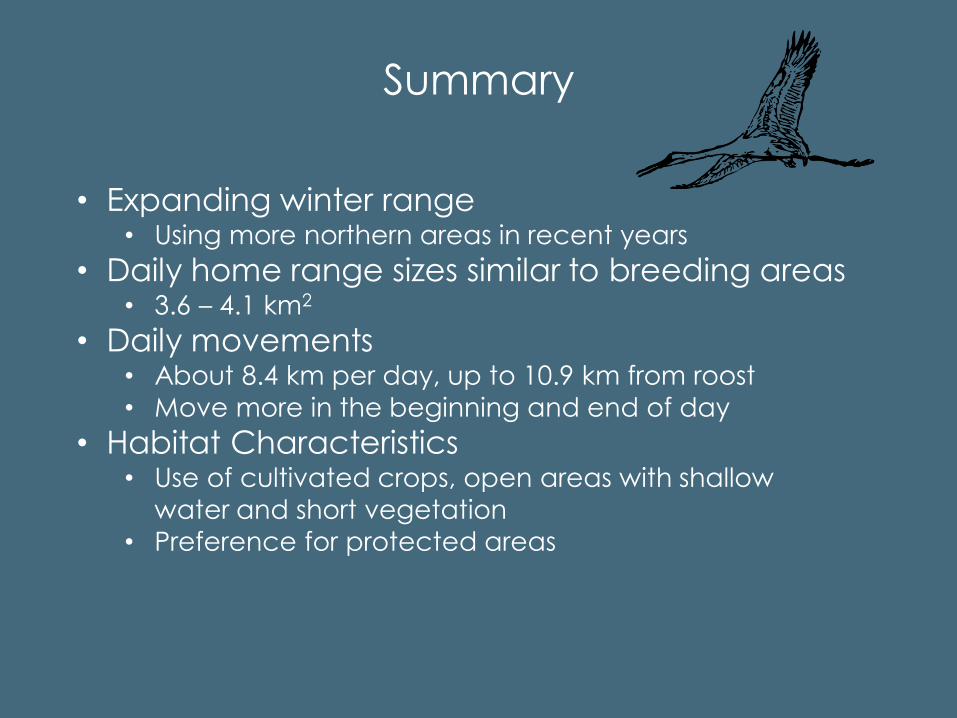
Summary
• Expanding winter range • Using more northern areas in recent years
• Daily home range sizes similar to breeding areas • 3.6 – 4.1 km2
• Daily movements • About 8.4 km per day, up to 10.9 km from roost
• Move more in the beginning and end of day
• Habitat Characteristics • Use of cultivated crops, open areas with shallow
water and short vegetation
• Preference for protected areas
Conclusion
• What does this mean for land managers and
reintroduction efforts?
• Understanding home range size and
movements gives us an idea of the size of
an area to protect or restore
• Local scale habitat characteristics inform
land managers, energetics research, and
future management decisions for the
population

Thank you! Questions?
@HillLThompson #WinterWhoopers
www.hillarylthompson.weebly.com