
Daily movements and local scale
habitat characteristics of areas used
by wintering Whooping Cranes
HILLARY L. THOMPSON1,2, DR. PATRICK JODICE3, AND ANNE E. LACY2
1 DEPARTMENT OF FORESTRY AND ENVIRONMENTAL CONSERVATION, CLEMSON UNIVERSITY, CLEMSON SC
2 INTERNATIONAL CRANE FOUNDATION, BARABOO WI
3 U.S. GEOLOGICAL SURVEY, SOUTH CAROLINA COOPERATIVE FISH AND WILDLIFE RESEARCH UNIT, CLEMSON SC

History of Whooping Crane Populations
• Uncommon
wetland bird
• Migratory and
non-migratory
populations
• Population
decline due to
habitat loss,
hunting, and
collection
• Recovery efforts
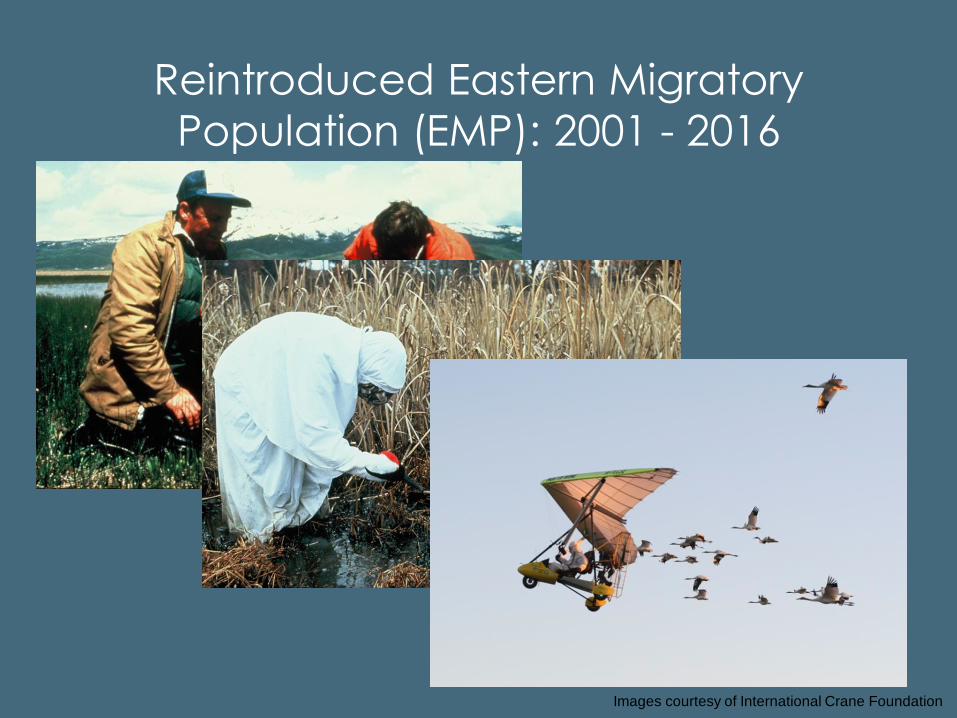
Reintroduced Eastern Migratory
Population (EMP): 2001 - 2016
Images courtesy of International Crane Foundation

Reintroduced Eastern Migratory
Population (EMP): 2001 - 2016
• Currently 102 individuals
• Successfully breeding but
not yet self-sustaining
population
• Nest abandonments
• Chick mortality
• Energetics?

Aransas-Wood Buffalo Population
Wintering Grounds
Image courtesy of International Crane Foundation
Image courtesy of USFWS – Aransas NWR
Coastal Texas Blue Crabs
Salt marsh habitat

EMP: Wintering Grounds
• Expanding winter
distribution
• Use of agricultural
habitats
• Non-territorial

Objectives
• Quantify daily movement
on the wintering grounds • Home range sizes
• Distances moved
• Timing of movements
• Identify local scale
habitat characteristics • Land cover types
• Water depth
• Vegetation height
• Distance to development
• Protected area status

Methods – Field data
• 2015 season
• 20 groups of cranes
• 6 states
• 29 Dec 2014 –
1 Feb 2015
• 2016 season
• 23 groups of cranes
• 8 states
• 2 Jan 2016 –
12 Feb 2016

Methods – Field data
• 2015 season
• 20 groups of cranes
• 6 states
• 29 Dec 2014 –
1 Feb 2015
• 2016 season
• 23 groups of cranes
• 8 states
• 2 Jan 2016 –
12 Feb 2016

Methods – Field data
• Radio telemetry and observations
• One full day per group
• Data point every 30 minutes
• Location, behavior, habitat data • General and specific habitat type
• Vegetation height
• Water depth
• Random points to compare to used locations
with logistic regression

Methods – Data Layers
• Habitat characteristics • National Land Cover Dataset
– Multi-resolution Land
Characteristics Consortium
• Protected land? • Protected Areas Database -
USGS
• Distance to roads • USA Major Roads - ESRI,
TomTom

Daily Movements
• Home Ranges
• 2015: 3.6 km2 KDE
• 2016: 4.1 km2 KDE
• Average distances moved
• 8.4 km in one day
• Maximum distance from roost
• 10.9 km
• Timing of movements

Daily Movements

Local scale habitat characteristics
• Observed Variables • Habitat types
• Water depth and
vegetation height
Water
0
0
0
1
7
101
61
222
Veg
0
1
31
59
29
94
127
147
2. Open Water 1. Cultivated Crops
3. Grassland/ Herbaceous
4. Wetland Emergent Herbaceous
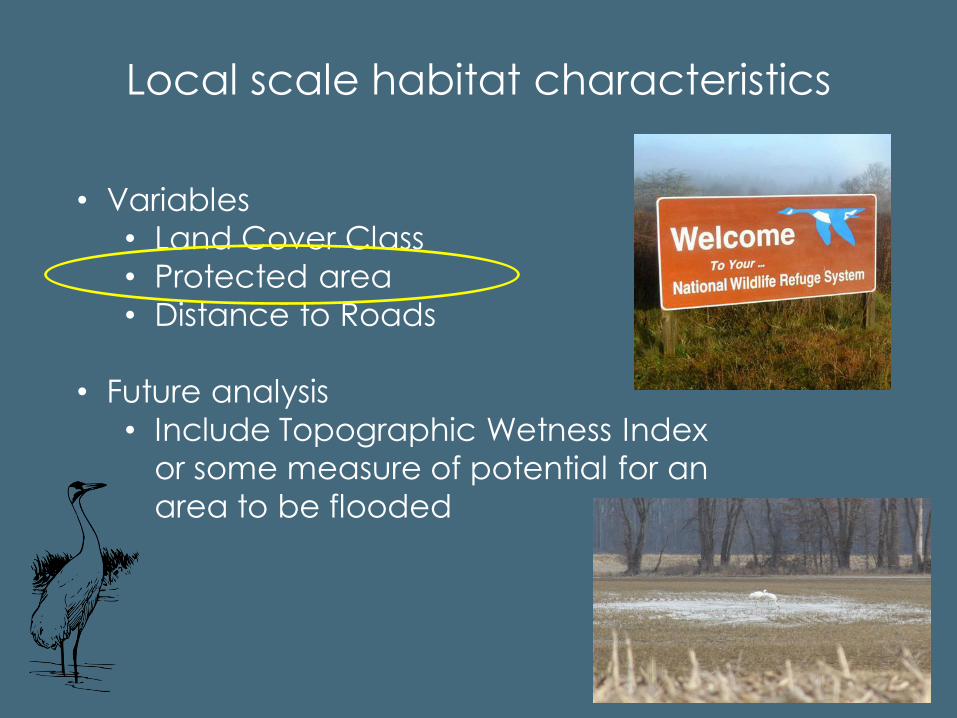
Local scale habitat characteristics
• Variables
• Land Cover Class
• Protected area
• Distance to Roads
• Future analysis
• Include Topographic Wetness Index
or some measure of potential for an
area to be flooded
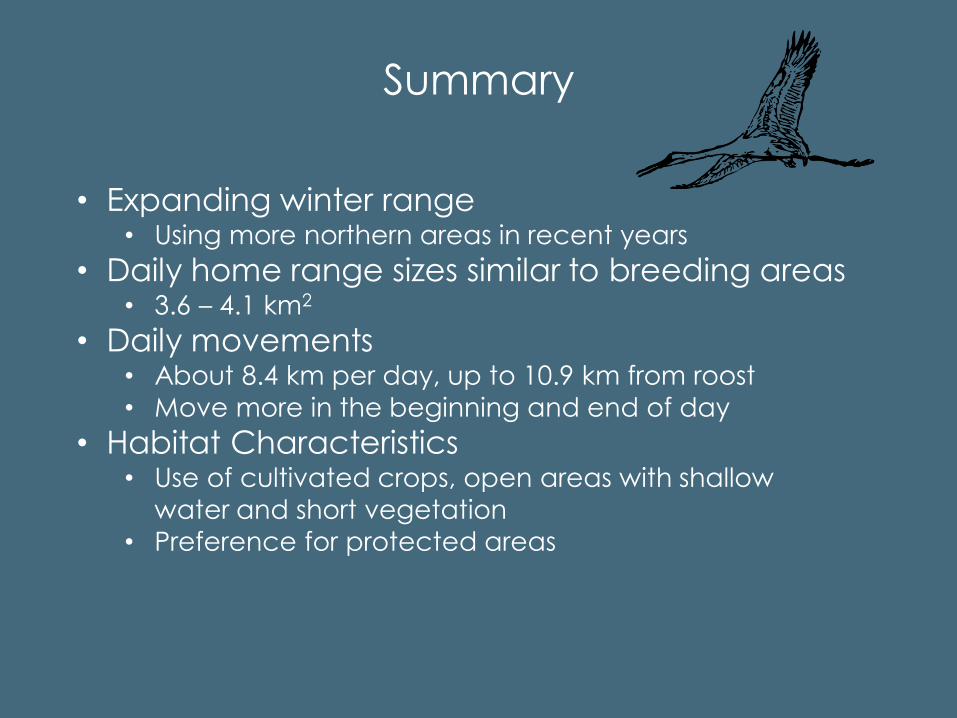
Summary
• Expanding winter range • Using more northern areas in recent years
• Daily home range sizes similar to breeding areas • 3.6 – 4.1 km2
• Daily movements • About 8.4 km per day, up to 10.9 km from roost
• Move more in the beginning and end of day
• Habitat Characteristics • Use of cultivated crops, open areas with shallow
water and short vegetation
• Preference for protected areas
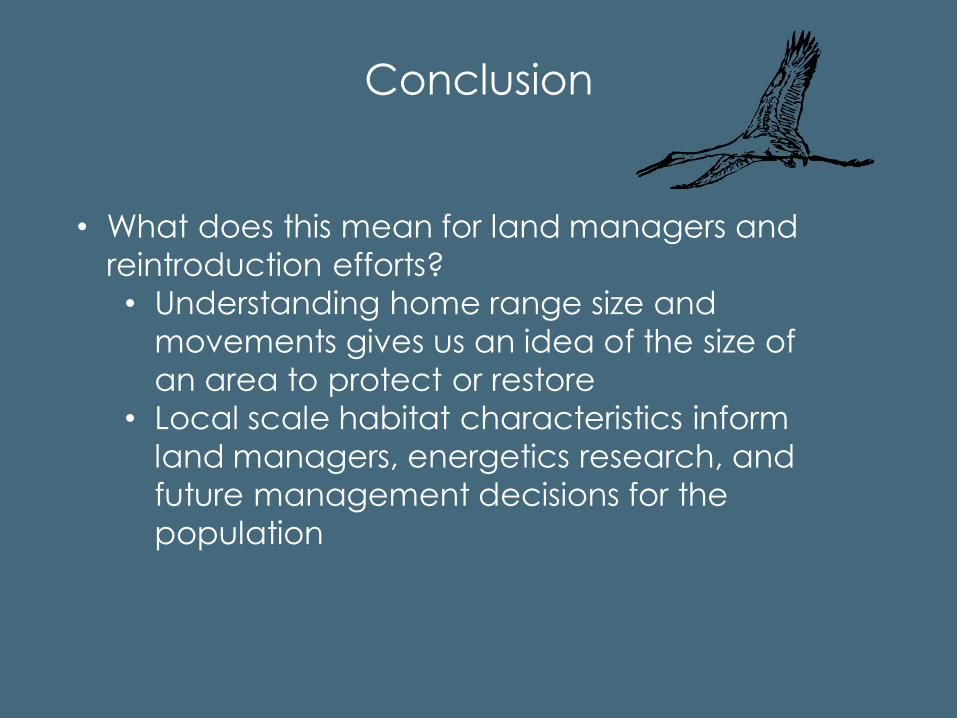
Conclusion
• What does this mean for land managers and
reintroduction efforts?
• Understanding home range size and
movements gives us an idea of the size of
an area to protect or restore
• Local scale habitat characteristics inform
land managers, energetics research, and
future management decisions for the
population

Thank you! Questions?
@HillLThompson #WinterWhoopers
www.hillarylthompson.weebly.com


