daily return relationships among asian stock markets
TRANSCRIPT
, Juurnal of Business Finance & Accounlin,?, 17(2), Spring 1990 0306-686X $2.50
DAILY RETURN RELATIONSHIPS AMONG ASIAN STOCK MARKETS
INSUP LEE, R. RICHARDSON PE7’TIT A N D MARK v. SWANKOSKI*
I N T R O D U C T I O N
Most studies of price changes on speculative markets offer results that are consistent with a process where the level of flow of information changes over time. The end result of this process is that returns, measured over a constant time interval, mix any number of approximately normal distributions.’ Moreover, computed means and variances of returns would differ depending on the intensity and nature of the information generating process occurring at the time of measurement. Little in the literature dealing with financial information, however, suggests that the flow of information, and the market’s response to that information, should be closely tied to the day of the week on which it arrives.
Nevertheless, recent studies of some of the world’s major stock, bond, and foreign exchange markets have discovered important ‘seasonal’ variations in the parameters of return distributions - especially mean returns (Board and Sutcliffe, 1988; Condoyanni, O’Hanlon and Ward, 1987; Cross, 1973; French, 1980; Gibbons and Hess, 1981; Keim and Stambaugh, 1984; Jaffe and Westerfield, 1985a and 1985b; and McFarland, Pettit, and Sung, 1982). These studies found that returns on Mondays and Fridays have been statistically different from each other, and sometimes different from the returns on other days of the week. Explanations of these tendencies have concentrated on settlement practices and dividend payment patterns in these markets, but the insights provided by these theories have been rather weak. In particular, day- of-the-week effects were rather uniform across the markets, in spite of wide variations in settlement practices and dividend payment patterns.
This study is devoted to determining if day-of-the-week patterns exist in a sample of the most important of the world’s ‘second tier’ stock markets - such as those in Hong Kong and Korea. Specifically, we look at univariate statistics that help characterize return distributions in a given market, as well as multivariate statistics that measure relationships existing between markets. Estimates of multivariate relationships, based on day-of-the-week data, are not common, but are important to describing the underlying return generating process in the world’s financial system.
The rationale for the investigation comes from two sources. First, there is
‘The authors a re respectively from the University of Delaware; the University of Houston; and E I . DuPont de Nemours & Co. (Paper received March 1989, revised J u l y 1989)
265
266 LEE, PET'I'I'I~ AND SWANKOSKI
accumulating empirical evidence that seasonal patterns are rather strong and persistent (e.g., McFarland, Pettit, and Sung, 1982, on major foreign exchange markets; and Jaffe and Westerfield, 1985a, Board and Sutcliffe, 1988, and Condoyanni, et al., 1987, on leading stock markets). Further confirmation of the existence of seasonal anomalies can come only from an investigation of new data, and not from additional analysis of markets that have already been studied.' In addition, the pattern of returns found in the markets referred to above do not always seem to be consistent with either the efficient markets hypothesis or with any well accepted theory of asset pricing - even if transactions costs are accounted for. This leads one to wonder whether some of the anomalies observed are functions of the trading processes adopted by these exchanges (e.g., written or verbal order entry, batch or continuous markets, single or multiple market makers), rather than being a result of the underlying supply of and demand for the securities themselves. Only through accumulating evidence from cross-sectional comparisons of exchanges with different trading mechanisms can one hope to attribute a cause to the effect.
Second, the growing interest in, and apparent need to diversify internationally requires that money managers understand the process by which returns are generated in different national stock exchanges. Two illustrations help underscore how concerns regarding 'foreign' stock markets may have affected investor behavior: first, foreign investors reduced funds committed to the Tokyo Stock Exchange each year from 1984 through 1988; second, one of the world's largest and most progressive pension funds decided in 1988 to increase their commitment to investrnents outside the United States from 10 percent of their portfolio to 15 percent of their portfolio - still well below the 60 percent non- US component of the world's equity markets.'3 Given the theoretical benefits of international diversification these tendencies must be due, in part, to fears that the trading process o r the information delivery process puts some investors at a disadvantage vis-a-vis local traders. These problems, if important, may prevent international money managers from forming index funds that can duplicate the market averages, much less enable them to form portfolios that provide security selection or market timing services to investors.
PRIOR RESEARCH
Among studies that have compared the seasonal characteristics of international equity markets, that of Jaffe and Westerfield (1985a) is the best known. They find strong daily patterns in the major markets they study, though these markets exhibit different patterns in at least one respect. Japanese and Australian markets seem to generate lower returns on Tuesdays, as opposed to the Monday effects found in Canadian and US markets. Moreover, they find no evidence of a connection between the daily seasonals in these countries. Thus , the daily returns in Asutralia and Japan seem to be independent of the seasonal
ASIAN DAILY RETURN RELATIONSHIPS 267
component in US markets. In essence, they are unable to trace the Tuesday effect in the Japanese and Australian markets to the returns generated on the just closed Monday New York market. The results suggest that there may be no single explanation for seasonality in these major markets.
Studies of the London Stock Exchange and smaller exchanges in Europe (France and Finland) show some evidence of seasonality as well (see Board and Sutcliffe, 1988; or Hawawini, 1988 for a summary). The consistency of the patterns of daily returns is imprecise, however. In general, it seems to be the case that Mondays and Tuesdays provide lower returns, with the latter three days of the week providing higher retnrns. More precise statements regarding day-of-the-week tendencies are difficult to make. Specifically, since settlement practices in London, Paris, and Sydney, at least, are vastly different than those in place in most of the world’s markets, it is not reasonable to conclude that settlement arrangements explain a significant portion of the differences in day-of-the-week returns.
Based on these existing results, the purpose of this paper is to provide additional evidence on this issue through an analysis of stock market returns on five Asian markets, plus the US market. Specifically, the empirical results presented here are for the markets in Korea, Taiwan, Singapore, Hong Kong, Japan, and the US. With the exception of the US, these markets are in countries that have experienced substantial real growth in the last two decades, and whose stock markets have generated high returns and increasing interest on the part of the world’s investors. Collectively, these ‘second-tier’ markets have an aggregate mid-1989 value of between $250 and $300 billion. Studies that show how these markets differ from or are similar to the larger markets in Japan, London, and the US should prove useful to those with a need to understand their characteristics.
DATA
The data set consists of daily closing prices over the nine years between January, 1980 and December, 1988 on the major market indicator for the exchanges listed in Table 1. There are some important differences in both market structure and index construction among these countires. Most indexes are value weighted - the Nikkei Dow being the important exception - and all but two include a large number of securities. Two of the markets use specialists for the primary market making function, and two of the markets preclude direct foreign investment .’
All of the market measures concentrate on the largest and most actively traded firms, with the exception of the equally weighted index of the New York and American stock exchanges - constructed by the Center for Research in Security Prices. The latter is included because it gives more weight to smaller firms,

Tab
le 1
Cha
ract
eris
tics
of
Paci
fic
RIM
Fin
anci
al M
arke
ts
Inde
x Ch
arac
teris
tics
Num
ber of
Wel
ghtin
f Co
untr
y In
dex
Nam
e Se
curit
ies
Fact
or
Hon
g K
ong
Han
gsen
g In
dex
33
Mkt
Cap
Japa
n N
ikke
i D
ow
225
Pric
e
Kor
ea
Com
posi
te S
tock
40
0 M
kt C
ap
Sing
apor
e St
raig
hts
Tim
es
30
Mkt
Cap
Tai
wan
T
aiw
an S
tock
12
0 M
kt C
ap
Uni
ted
Stan
dard
and
Poo
r’s
500
Mkt
Cap
Uni
ted
Equ
al W
eigh
ted
2100
E
qual
Pric
e In
dex
Inde
x
Exc
hang
e
Stat
es
Inde
x of
500
Stat
es
NY
SE
App
ropr
iate
. ba
sed
on D
ecem
ber
1987
val
ues
Bas
ed o
n V
olum
e of
tra
ding
Se
ttlem
ent
peri
od d
epen
ds o
n th
e na
ture
of
the
tran
sact
ion
1 2 3
Mar
ket
Char
acter
zstic
s
Trad
ing.
.
Mar
ket
Val. I
Tu
rnov
er
Fore
lgn
Pric
e S
de
- Co
mm
issi
on r 3
h4et
hod
(8 B
illio
ns)
Ratio
’,.’
Inue
sfors
Limits
men1
R
aja
n
Floo
r B
roke
rs
$55
0.85
Y
es
No
I D
ay
Neg
otia
ble
Irl
Spec
ialis
t $2
670
0.7’
2 Y
es
Yes
3
Day
s 0.
15-1
.2D
iC i
i
Floo
r $3
5 0.
80
Prec
lude
d Y
es
2 D
ays
0.7-
0.?%
p
Auc
tion
Ele
ctro
nic
$45
0.25
Y
es
No
3 D
ays’
0.
5-1.
05
Boa
rd
Floo
r B
roke
rs
$45
1.75
Pr
eclu
ded
Yes
I
Day
0.
15%
Auc
tion
A 5 2 s 9
m
Spec
ialis
t $2
770
0.70
Y
es
No
5 D
ays
Neg
otia
ble 5
Auc
tion
ASIAN DAILY K H ’ U KN KELA‘l‘IONSHII’S 269
and thus in some ways, is more comparable to the types of firms listed on the smaller Asian exchanges.
The three major market indexes based in Japan and the US not only provide a basis for comparison of the results presented here with prior studies, they also provide a standard from which it is possible to measure the cross-correlation and cross-serial correlation present in the structure of daily prices. In other words, these major market indexes allow us to determine the systematic tendency for short term price changes in second tier Asian markets to be associated with those in Japan and the US; an important issue for some international investors, of course.
Importantly, three of the six markets studied were open for all or a portion of the day on Saturday (Korean, Taiwanese, and Japanese markets). Prior studies of the Tokyo Exchange have not explored in detail how the analysis of Saturdays affects the calculation of Friday or Monday returns. We have the opportunity to determine the relevance of Saturday trading to expected returns and return variances in these three markets.
EMPIRICAI> KESUI.TS
Since our investigation attempts to generalize and integrate from existing research that has concentrated on the world’s most important stock markets, the first part of our empirical work uses methodologies that are similar to those used in prior equity market research. The principal variate used is the day-of- the-week return, defined as,
where R: is the day to day return computed from sequential closing prices for day of the week ‘ d ’ between daily calendar days t and t -1 for stock index z . Thus, the variate measures the daily return for each trading day over the study period, classified by the day of the week. Dividends and other cash distributions should be included in the calculation, of course, though none of the indices actually used include these cash flows in their dialy computations. The extent to which this omission might affect the magnitude of the day-of-the-week returns is notrd shortly.
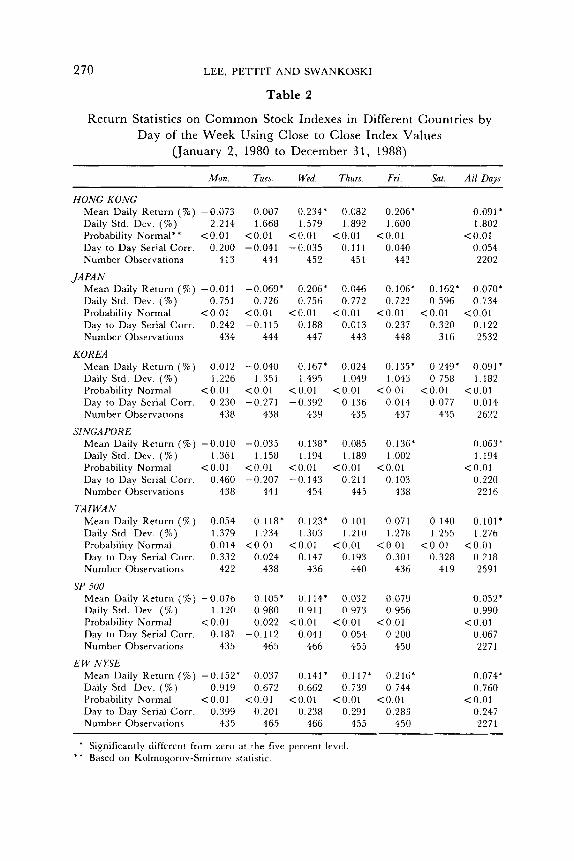
Table 2 provides parameter estimates for the mean and standard deviation of returns classified by each day of the week. Mean values that are significantly different from zero at the five percent level are indicated by an asterisk. Also included is the probability of rejecting the null hypothesis that the distribution is normal, based on a Kolmogorov-Smirnov test for normality. Finally, serial correlations are included based on sequential daily returns. Thus, the Monday serial correlation reflects the association between the returns on Friday or Saturday and the returns on the following Monday.
LEE, PETTIT AND SWANKOSKI
Table 2
Return Statistics on Common Stock Indexes in Different Countries by Day of the Week Using Close to Close Index Values
(January 2, 1980 to December 3 1 , 1988)
Mon. Tues. Wed. Thurs. Fri. Sat. All Days
HONG KONG Mean Daily Return (%) -0.073 Daily Std. Dev. (a) 2.214 Probability Normal** <0.01 Day to Day Serial Corr. 0.200 Number Observations 413
JAPAN Mean Daily Return ( % ) -0.011 Daily Std. Dev. (%) 0.751 Probability Normal <0.01 Day t o Day Serial Corr. 0.242 Number Observations 434
KOREA Mean Daily Return (%) 0.012 Daily Std. Dev. ( W ) 1.226 Probability Normal <0.01 Day to Day Serial Corr. 0.230 Number Observations 438
SINGA FOR E Mean Daily Return (%) -0.010 Daily Std. Dev. ( % ) 1.361 Probability Normal < 0.01 Day to Day Serial Corr. 0.460 Number Observations 438
TAIWAN Mean Daily Return (70) 0.054 Daily Std. Dev. (%) 1.379 Probability Normal 0.014 Day to Day Serial Corr. 0.332 Number Observations 422
SP so0 Mean Daily Return ( 7 0 ) -0.076
Probability Normal < 0.01 Day to Day Serial Corr. 0.187 Number Observations 435
Mean Daily Return (YO) -0.152' Daily Std. Dev. (%) 0.919 Probability Normal < 0.01 Ddy to Day Serial Corr. 0.399 Number Observations 435
Daily Std. Dev. (70) 1.120
E W N Y S E
0.007 0.234' 0.082 1.668 1.579 1.892
<0.01 <0.01 <0.01 -0.041 -0.035 0.111
444 452 451
-0.069' 0.206" 0.046 0.726 0.756 0.772
<0.01 <0.01 <0.01 -0.115 0.188 0.013
444 447 443
-0.040 0.167' 0.024
<0.01 <0.01 <0.01 -0.271 -0.392 0.136
438 439 435
1.351 1.495 1.049
-0.035 0.138' 0.085
<0.01 <0.01 <0.01 -0.207 -0.143 0.211
1.158 1.194 1.189
441 454 445
0.118' 0.123* 0.101 1.234 1.303 1.210
0.024 0.147 0.193 438 436 440
< 0 0 1 <0.01 <0.01
0.105' 0.114' 0.032 0.980 0.911 0.973 0.022 <0.01 <0.01
-0.112 0.041 0.054 465 466 455
0.037 0.141' 0.117' 0.672 0.662 0 739
0.201 0.2:38 0.291 465 466 455
<0.01 <0.01 <0.01
0.206' 0.091 * 1.600 1.802
0.040 0.054 442 2202
<0.01 <o.ni
0.106' 0.162' 0,070' 0.722 0 596 0.734
0.237 0.320 0.122 448 316 2532
<0.01 <0.01 <0.01
0.135' 0 249' 0,091' 1.043 0 758 1.182
0.014 0.077 0.014 437 435 2622
<0.01 <0.01 <0.01
0.136* 0.063' 1.002 1.194
0.103 0.220 438 2216
<0.01 <0.01
0.071 0.140 0.101' 1.278 1.255 1.276
0.301 0.328 0.218 436 419 2591
<0.01 <0.01 < 0 01
0.079 0.052' 0.956 0.990
0.200 0.067 450 2271
<0.01 <0.01
0.216' 0.074* 0 744 0.760
0.283 0.247 450 2271
<0.01 < 0 01
* Sienilicantly dilferent from zero at the five percent level * * Based on Kolmogorov-Smirnov statistic.
ASIAN DAILY R E T U R N RELATIONSHIPS 271
Patterns in Day-of-the- Week Effects
Consistent with other studies of major markets, day-of-the-week effects seem strong and persistent in most Asian markets. Returns are negative on Mondays in all markets but Korea and Taiwan, and in these markets the returns are less positive than on other days on which positive returns are generated. Nevertheless, the negative Monday returns in Hong Kong, Japan, and Singapore are of a lower magnitude than experienced in the US. The equally weighted US index is, by far, the most negative. Tuesday returns are negative in Japan, Korea, and Singapore, though the strength of the Tuesday effect is less in Korea and Singapore than that experienced in Japan.
Wednesday and Friday returns rank first and second in order of magnitude for the five weekdays, respectively, in all countries but Taiwan and the equally weighted US market - where the order is reversed. Saturday returns are much above the daily average in all countries that offer Saturday trading. In Korea, in fact, fully half of the returns generated over the nine year period studied are attributable to Saturday trading - with average annual returns of about 12 percent generated on Saturday alone.
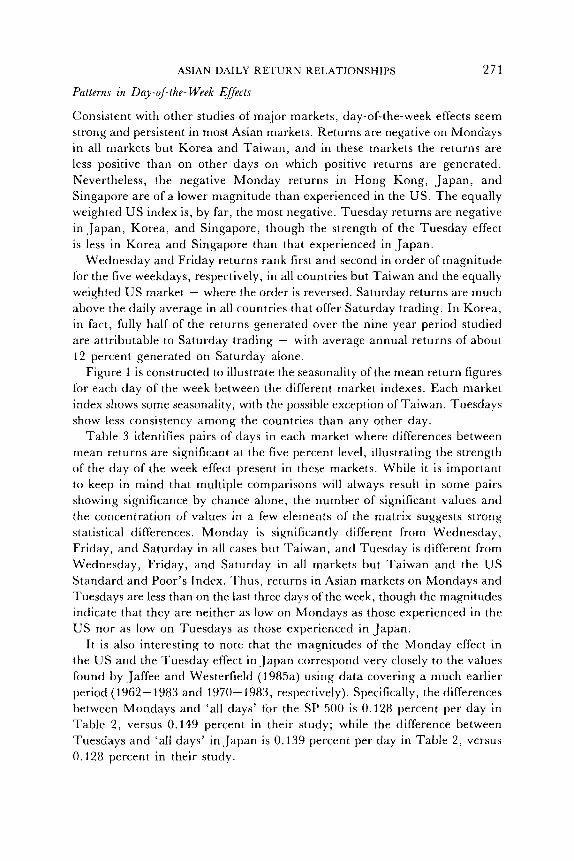
Figure 1 is constructed to illustrate the seasonality of the mean return figures for each day of the week between the different market indexes. Each market index shows some seasonality, with the possible exception of Taiwan. Tuesdays show less consistency among the countries than any other day.
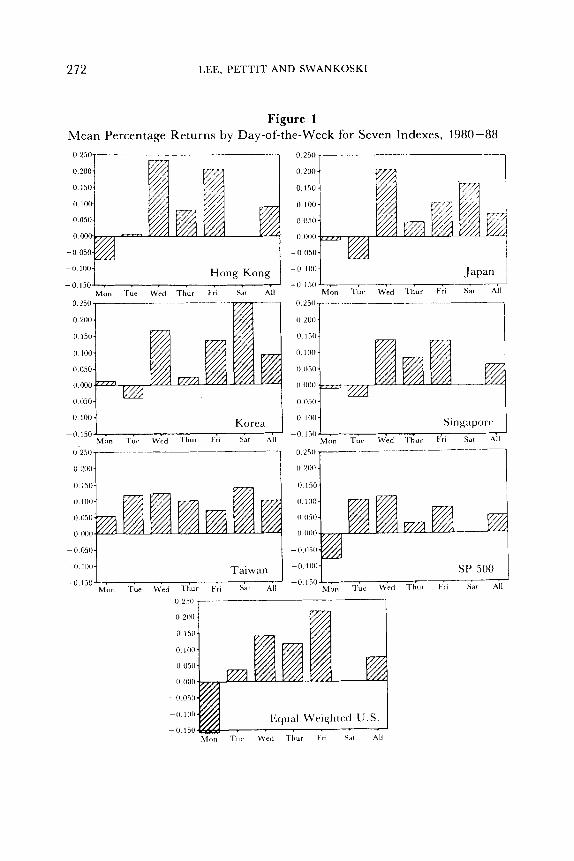
Table 3 identifies pairs of days in each market where differences between mean returns are significant at the five percent level, illustrating the strmgth of the day of the week effect present in these markets. While it is important to keep in mind that multiple comparisons will always result in some pairs showing significance by chance alone, the number of significant values and the concentration of values in a few elements of the matrix suggests strong statistical differences. Monday is significantly different from Wednesday, Friday, and Saturday in all cases but Taiwan, and Tuesday is different from Wednesday, Friday, and Saturday in all markets but Taiwan and the US Standard and Poor’s Index. Thus, returns in Asian markets on Mondays and Tuesdays are less than on the last three days of the week, though the magnitudes indicate that they are neither as low on Mondays as those experienced in the US nor as low on Tuesdays as those experienced in Japan.
It is also interesting to note that the magnitudes of the Monday effect in the US and the Tuesday effect in Japan correspond very closely to the values found by Jaffee and Westerfield (1985a) using data covering a much earlier period (1962-1983 and 1970-1983, respectively). Specifically, the differences between Mondays and ‘all days’ for the SP 500 is 0.128 percent per day in Table 2 , versus 0.149 percent in their study; while the difference between Tuesdays and ‘all days’ in Japan is 0.139 percent per day in Table 2 , versus 0.128 percent in their study.
272 IXE, PETTI?' AND SWANKOSKI
Figure 1 Mean Percentage Returns by Day-of-the-Week for Seven Indexes, 1980-88
Hong Kong - 0 100
-0 150 . Mon Tur Wed Thur Fri Sat All
I1 250
I1 200
0 1511
0 100
ii o n ll.000
- 0 05n
-0 1110 Korca Mb, T i ? Wrd T h u r Fri Sar All
-n 1511
--7 0 250 r 0 2nn
ASIAN DAILY R E T U R N RELATIONSHIPS
Table 3
273
Differences Between Day of Week Return
Country Indexes with Five Percent Significance Level Differences Between Mean Returns
Tues. Wed. 71hur.r. Fri. Sat. All
Monday Hong Kong Hong Kong Differen t Japan Japan Japan Japan From Korea Korea Korea
Singapore Singapore SP500 SP500 SP500 SP500 SP500 EW NYSE EW NYSE E W NYSE EW NYSE EW NYSE
Tuesday Different From
Hong Kong Hong Kong Japan Japan Japan Japan Japan Korea Korea Korea Korea Singapore Singapore EW NYSE EW NYSE EW NYSE
Wednesday Japan Japan Japan Different Korea Korea From
Thursday Japan Different Korea From EW NYSE
Friday Different From
Saturday Different From
Japan Korea
Dividends and other cash distributions do not explain a significant portion of the daily differences in returns. In the US market the inclusion of dividends would have increased the equally-weighted NYSE returns on Monday and Tuesday by 0.023 and 0.013 percent respectively. O n the other three days the increase would have averaged about 0.01 percent. O n Monday, this would have reduced the negative return calculated from -0.152 percent to -0.129 percent - still very significantly negative. Explicit calculations for other indexes (including the S&P 500) cannot be made since none of the measures are calculated on a daily basis with dividends included. However, reasonable bounds can be established using annual dividend yields paid on securities in these countries, assuming all dividends are paid on a single day of the week.
274 LEE, PETTI’I’ AND SWANKOSKI
The maximum addition to return for each country is as follows: Hong Kong 0.078 percent, Japan 0.009 percent, Korea 0.062 percent, Singapore 0.029 percent, and Taiwan 0.019 p e r ~ e n t . ~ If all securities in each country were presumed to go ex-dividend on Monday, the differential between Mondays and other days of the week would be reduced, but none of the significant differences between days of the week, identified in Table 3 , would be reduced to an ‘insignificant’ value. Simply, the concentration of dividend payments on one day of the week offers only a partial explanation for the tendencies apparent either in Tables 2 o r 3 . Finally, we have no information to suggest that ex-dividend dates in these countries are concentrated on Mondays or on any other day of the week.
The standard deviations of returns tend to be moderately greater on Mondays in all markets, and are substantially greater in Hong Kong on all days than in the other Asian markets. Nevertheless, there is no strong implication that information delivered to the market between Friday’s close and Monday’s close is more variable than that which occurs on other days of the week in any of these markets. The fact that Saturday’s standard deviations tend to be lower can be attributed, in part, to the lack of trading in some securities that is associated with the abbreviated number of hours of trading on that day. Somewhat surprisingly, the lowest daily return variances occurred in Japan and with the equally weighted US index.
The distribution of returns appears to be more non-normal for ‘all days’ than when the analysis is performed for each day of the week. Moreover, the non-normality of the distributions by day-of-the-week is reduced with the elimination of the 10 highest and lowest returns (results are not shown). Finally, there is no indication that daily returns were more non-normal in some of these markets than in others. All of these observations are consistent with a ‘mixture of normals’ explanation for the underlying return generating process for all of these markets, when the intensity of the flow of information is somewhat different from day to day, but not markedly and systematically different by day-of-the-week.6
Holiday returns were analyzed separately, in two different ways. First, all daily returns following holidays were eliminated, with all numbers in the tables recalculated. Second, a special analysis of returns on days after holidays was conducted, since in some of these countries holidays are bunched together, with the market being closed for a number of days in a row. While the aggregate numbers are not affected by the elimination of holiday returns, the post holiday returns themselves are significantly negative in Korea and Singapore, negative in Hong Kong and the US, and insignificantly positive in Japan and Taiwan. Of these post holiday returns, those on Mondays and Tuesdays generally were negative, lending some support to the Monday-Tuesday attribute in the data.
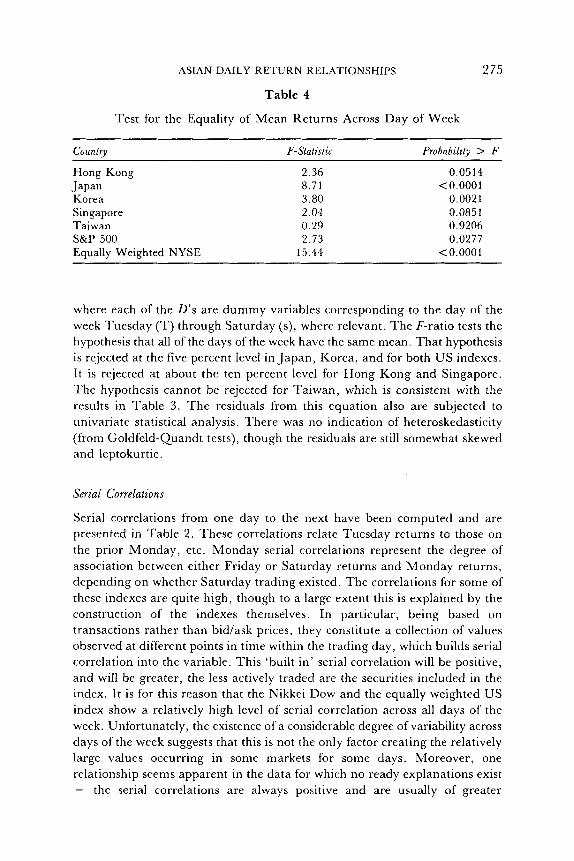
Finally, Table 4 presents F-statistics and the probability of no relationship for the following regression for each country index:
(2) R , , d = aocu‘lD:’ + a”DY i , . . i asD: i u$
ASIAN DAILY RETURN RELATIONSHIPS
Table 4
Test for the Equality of Mean Returns Across Day of Week
275
Country F-Statistic
Hong Kong 2.36 Japan 8.71 Korea 3.80 Singapore 2.04 Taiwan 0.29 S&P 500 2.73 Equally Weighted NYSE 15.44
Probability > F
0.0514 <0.0001
0.0021 0.0851 0.9206 0.0277
<0.0001
where each of the D’s are dummy variables corresponding to the day of the week Tuesday (T) through Saturday (s), where relevant. The F-ratio tests the hypothesis that all of the days of the week have the same mean. That hypothesis is rejected at the five percent level in Japan, Korea, and for both US indexes. It is rejected at about the ten percent level for Hong Kong and Singapore. The hypothesis cannot be rejected for Taiwan, which is consistent with the results in Table 3 . The residuals from this equation also are subjected to univariate statistical analysis. There was no indication of heteroskedasticity (from Goldfeld-Quandt tests), though the residuals are still somewhat skewed and leptokurtic.
Serial Correlations
Serial correlations from one day to the next have been computed and are presented in Table 2. These correlations relate Tuesday returns to those on the prior Monday, etc. Monday serial correlations represent the degree of association between either Friday or Saturday returns and Monday returns, depending on whether Saturday trading existed. The correlations for some of these indexes are quite high, though to a large extent this is explained by the construction of the indexes themselves. In particular, being based on transactions rather than bid/ask prices, they constitute a collection of values observed at different points in time within the trading day, which builds serial correlation into the variable. This ‘built in’ serial correlation will be positive, and will be greater, the less actively traded are the securities included in the index. It is for this reason that the Nikkei Dow and the equally weighted US index show a relatively high level of serial correlation across all days of the week. Unfortunately, the existence of a considerable degree of variability across days of the week suggests that this is not the only factor creating the relatively large values occurring in some markets for some days. Moreover, one relationship seems apparent in the data for which no ready explanations exist - the serial correlations are always positive and are usually of greater

2 76 LEE, PET?‘IT AND SWANKOSKI
magnitude on Monday in all markets. We have no good explanation for this tendency.
Intra-Monthly Returns
Recently, evidence was presented in Ariel (1987) for US markets suggesting that return regularities may exist within months. He found that returns during the first half of the month exceeded those in the last half of the month by approximately one percent for the period 1963 to 1981. Lakonishok and Smidt (1988) also looked at this issue and found the differences to be less than 0.25 percent for the Dow Jones Industrial Average over a ninety-year period. An analysis of the data in the present study shows no differences between daily returns generated during the weeks of the month. Specifically, differences betweeen returns generated in the first week relative to the rest of the month, and differences between returns generated in the first two weeks relative to the rest of the month, were not statistically significant for any of the indexes. Since the data covers 648 country months, the evidence is strongly supportive of the idea that intra-monthly rrgularities are not important.
Cross Correlations and Regressions
In an attempt to determine the degree of association between the various markets, important for the international diversification argument, returns in one country are correlated with the returns in another. No attempt has been made to account for relative changes in the value of the currency units in the comparison. To do so would require one to select a ‘home’ currency for analysis of the benefits from diversification. Two other arguments exist for making the comparisons solely on the basis of local market returns. First, and perhaps most important, given the nature of international consumption that characterizes all free world developed economies, good arguments can be made to the effect that a consumption based optimal portfolio choice model would mute, if not completely ignore, the variation in currency exchange rates. Second, prior studies have found that correlations after adjusting returns for exchange rates are similar to those without such an adjustment.8
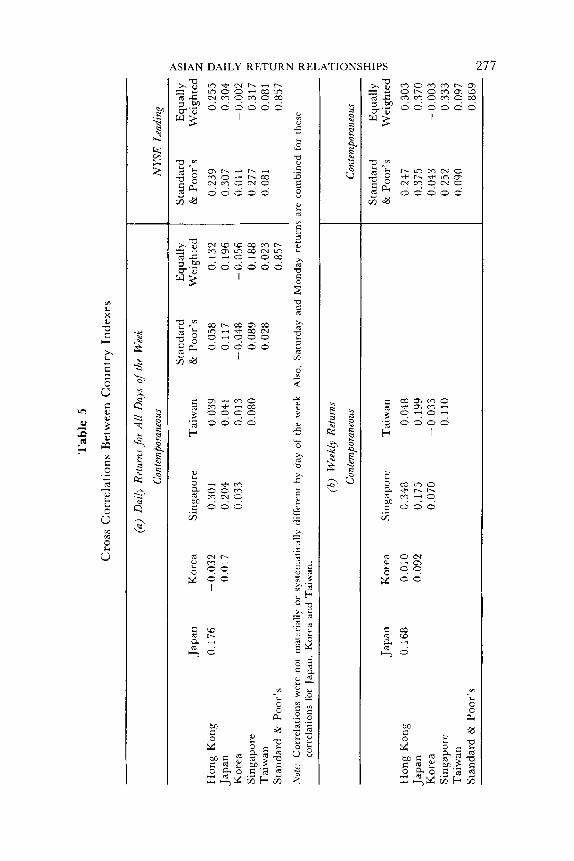
Table 5 part (a) presents correlation coefficients for all days of the week for all countries on a contemporaneous basis. Correlation coefficients with the two NYSE indexes leading the others (e.g., Tuesday in Tokyo with Monday in New York) also are presented. Results by day-of-the-week are not presented since they do not differ materially from the coefficients calculated for all days. Thus, in terms of correlations between markets, there is no strong day-of-the- week effect.
The contemporaneous daily correlations are surprisingly low. There is no apparent strong relationship among any of the four smaller Asian markets or between these markets and either of the major markets. In particular, there
(a)
Dai
ly R
etur
ns for
All
Day
s of
the
Wee
k Co
ntem
bora
neou
s N
YSE
Lea
dinp
Stan
dard
E
qual
ly
Hon
g K
ong
0.17
6 -0
.032
0.
301
0.03
9 0.
058
0.13
2 Ja
pan
0.01
7 0.
204
0.04
1 0.
117
0.19
6 K
orea
0.
033
0.01
3 -0
.048
-0
.056
Si
ngap
ore
0.08
0 0.
089
0.18
8 T
aiw
an
0.02
8 0.
023
Stan
dard
& P
oor’
s 0.
857
Japa
n K
orea
Si
ngap
ore
Tai
wan
&
Poo
r’s
Wei
ghce
d St
anda
rd
Equ
ally
&
Poo
r’s
Wei
ghte
d $
0.23
9 0.
255
0.30
7 0.
304
0.01
1 -0
.002
0.
277
0.31
7 E
0.08
1 0.
081 4
0.85
7 2 z
(h)
Wee
k17
Retu
rns
Cont
empo
rane
ous
Japi
iri
Kor
ea
Sing
apur
c T
aiw
an
IIon
g K
ong
0.16
8 0.
0!0
0.34
8 0,
048
Japa
n 0.
092
0.17
5 0.
199
Kor
ea
0.07
0 -
0,03
3 Si
n ga.
1~) rc
0.11
0 T
aiw
an
Stan
dard
t(r
Poor
’s
F 5 8 Co
ntem
pora
neou
s
Stan
dard
E
qual
ly
2 &
Poo
r’s
Wei
ghte
d
0.24
7 0.
303
0.37
5 0.
370
0.04
3 -0
.003
0.
252
0.33
3 0.
090
0.09
7 0.
869
-4
278 LEE, PETTIT AND SWANKOSKI
is no tendency for a closer association between those markets and Japan than there is between those markets and the US. The strongest of the relationships - between Singapore, Hong Kong and Japan at between 0.15 and 0.30 - are less than one would ordinarily find between individual US securities, and much less than one would find between an individual US security and the US market index (see Roll, 1988, who found mean daily correlations on the order of 0.45). Common, worldwide market movements, in other words, do not seem to be very strong in most of these markets.
Allowing the US indexes to lead by one day does cause the correlations to increase, and the level of correlation, as well as the increase in it, is greatest for the markets in Hong Kong, Japan, and Singapore. Thus , there is some tendency for the New York market to lead the markets in Japan, Hong Kong, and Singapore, though that effect is not strong.y
Moreover, whatever the extent of the relationship between Japan and the US, the relationships between the second tier markets themselves, and between them and the Japanese and US markets, is less. Importantly, there is virtually no correlation on a daily basis between Korea and any of the other indexes or between Taiwan and any of the other indexes. This result is interesting in view of the restriction on direct foreign investment in those markets, and is consistent with the restriction being sufficient to completely segment those markets from the rest of the world’s exchanges.
To determine if the low daily correlations occur, in part, as a result of the lack of precisely contemporaneous price availability for the securities included in the indexes, weekly correlations have also been computed. These numbers are presented in part (b) of Table 5 . These numbers are slightly larger (where the appropriate comparison is among the Asian markets themselves, and between Asian markets and the ‘NYSE LEADING’ column, since most of the ‘leading’ effect is eliminated with the use of weekly return numbers), though it is still the case that common weekly factors affecting the returns in these countries are completely dominated by factors unique to each of the markets.
Given the uniqueness of Saturday trading, and the very high returns generated on those days on all three exchanges that permit such trading, it would not be surprising to find Saturday return correlations that are greater than for other days of the week. The correlations, however, range from 0.01 to 0.13, and are little different from those found on other days of the week.
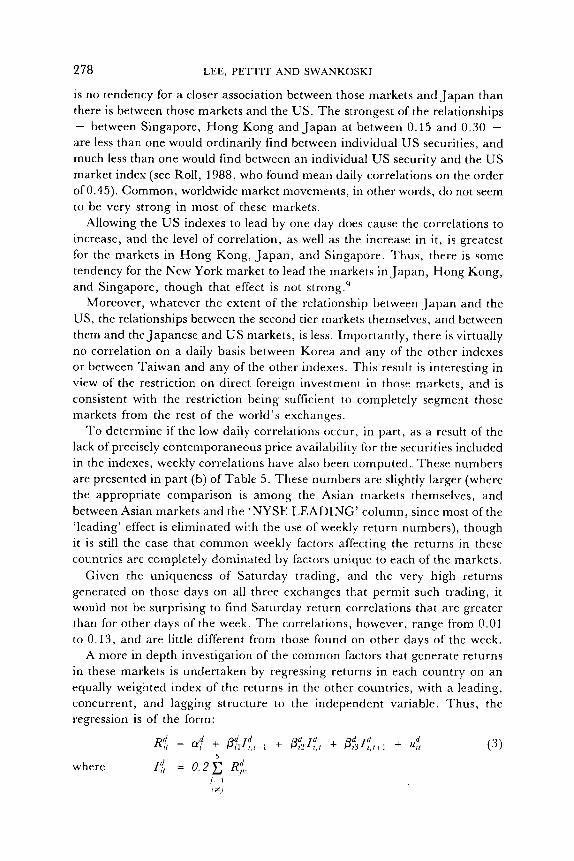
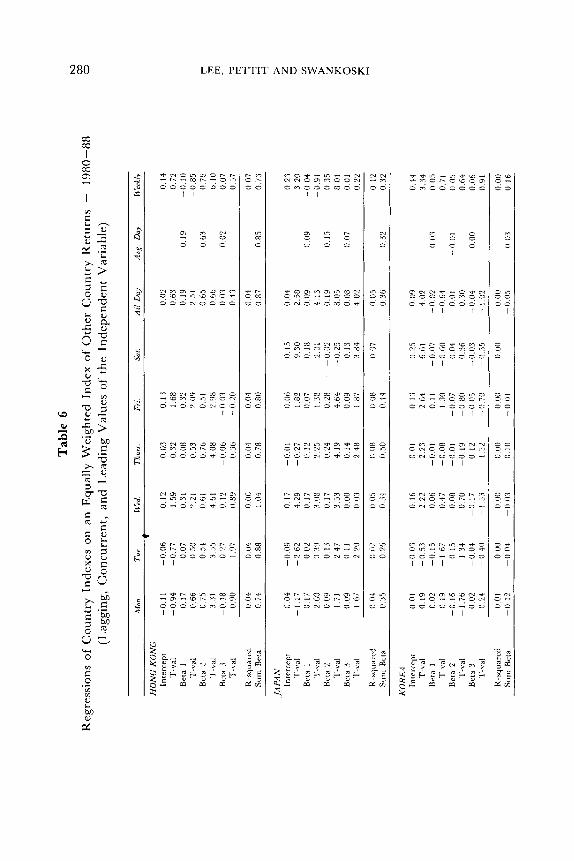
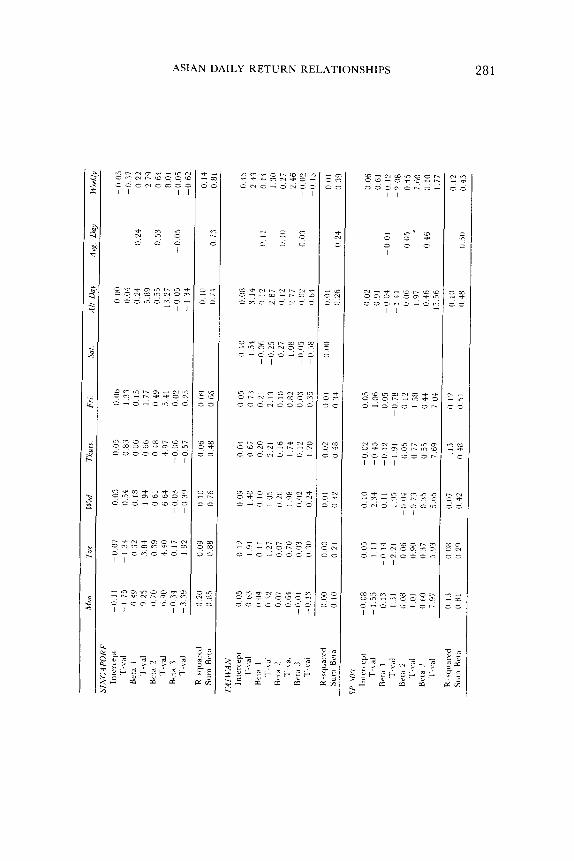
A more in depth investigation of the common factors that generate returns in these markets is undertaken by regressing returns in each country on an equally weighted index of the returns in the other countries, with a leading, concurrent, and lagging structure to the independent regression is of the form:
R: = + 0fiZfl-i + PP’,Zft + L G I f t + i
where I $ = 0 . 2 i R;. ,= 1
‘ # /
variable. Thus, the
+ 4 (3)

ASIAN DAILY R E l U R N RELATIONSHIPS 279
The Standard and Poor's Index was used for the US component of the calculation.
The regression coefficients and T-values for each country are presented in Table 6. The second to the last column of that table gives the average of the coefficients across all days of the week, and the sum of those three numbers would correspond most closely to an index beta coefficient measured with respect to Asian and US markets. While the regression coefficients indicate a significant degree of association on most days for Japan, Hong Kong, Singapore, and the US, the size of the coefficients is below what would he expected, and the goodness of fit is generally lower than would he the case for individual firms within the US market itself."
The results correspond rather closely with the cross-correlations found in Table 5. First, the coefficients for Taiwan and Korea are near zero, indicating the absence of any significant degree of association between these two markets and other markets in the US and Asia, and consistent with complete segmentation of these markets. This result must he considered odd in view of the extent of the economic association between the countries, and the fact that the economies of Korea and Taiwan are driven, in large part, by underlying demand in the US and Japan."
Second, there are no systematic differences among the coefficients by day- of-the-week in those countries that show significant beta coefficients: a result which certainly is not surprising. Third, the coefficients themselves, for Hong Kong, Japan, Singapore, and the Standard and Poor's 500 indicate an ordering of systematic risk vis-a-vis the index that is as follows: Hong Kong, Singapore, U.S., and Japan. This ranking is in accordance with the authors' preconceived notions of each indexes risk, within the context of an international capital asset pricing model. Nevertheless, because of the low R-square values, it would be difficult to draw firm conclusions on this issue.
Fourth, as in the case of the correlations presented in TablF5, the use of weekly returns increases by a small degree both the beta coefficients and the goodness of fit (the last column in Table 6). Consequently, the low level of the relationships experienced between these markets on a daily basis can be attributed mostly to the absence of important comon factors, and only slightly to the lack of synchronization between the time each market is open or to the lack of synchronization of trading prices in the securities that make up each index. Thus, it seems to he the case that factors unique to the local market govern the return generating process on a daily (and weekly) basis, with little in common affecting either these second tier markets or their relationships with the far larger markets in the US and Japan. Strong arguments for international diversification follow directly from this conclusion.
CONCLUSIONS
The evidence presented here suggests that important day-of-the-week effects found in some major equity and foreign exchange markets, also can he identified
E L ' O gn I) L8 0 LO 0 60'0
ASIAN DAILY RETURN RELATIONSHIPS 28 1
c - * m * - * m m 3 10 - m (D 9 1 r 3 3 3 - c 9 c c
I I
N - - r. I. 0 c" = c - o - c s s = - Q - N 3 I. - v
ID - N 0) 1 0 c c r.
3 c 0 N 3 I. c - 3 '9 - c * '0 ... P
I I
- 3' (D 3 - 6 3 3 5 I
1" 9 10 m N ?: d * c c o r . - l r * o 3 - 3 0 c - 3 I.
I I
N 0 ?I - 0 I. In c 3 * - Ln 3 r. In c 3 3 - s = 3 I.
I I I I
3 * - In * -, r-' ,r - -, - 0 c I. % L 0 N 3 - 3 2 Ir
I 1
"? - * - 3 r. n 3 - - N 5 0: - c, 3 - c Pi =. s s L"
1 1
282 I,F,E, PETTIT AND SWANKOSKI
in second tier Asian markets. While the results continue to show such effects for the US and Japanese equity markets, those in Hong Kong, Korea, and Singapore are significant, though on average of a lower order of magnitude. Thus, ,whatever the cause of day-of-the-week effects, their existence in markets that are well insulated from competition from foreign investors (Korea), or that have different market making systems, suggests the pervasive nature of the effect.
Finally, inconsistent with the existence of important ‘world’ market factors, the returns on these different exchanges seem to be generated by a process that implies a good deal of underlying independence between the various equity markets studied. The practical argument for investor diversification beyond country boundaries is very strong.
NOTES
1 See Westerfield (1977) for an explanation of the mixture of normal process as applied to security returns. The empirical distributions calculated over a given time interval would look like distributions drawn from the non-normal family of Praeto-Levy distributions: that is, would be peaked.
2 This point was made very clear in Lakonishok and Sinidt (1988) in their discussion uf ‘data snooping’ prior to their analysis of the seasonality of the 90 year history of the Dow Jones Industrial Average. They note: ‘As a defense against data snooping, the finance profession has developed a strong preference for empirical studies based on hypotheses derived from theory. This may provide temporary protection, but the degree of security provided is quire subtle when theories are refined and revised based on past studies and the revised theories are then tested on essentially the same data.’ (p. 405) W e use a data set that is new to this subject area, hut that has approximately the same number of degrees of freedom as that studied by Lakonishok and Smidt.
3 Information regarding foreign investment on the TSE is taken from the Exchange Fact Bonk, 1988. l h e pension fund is CREF, which manages $30 billion in equities. The debate over their foreign investment component is summarized in the Teachers Insurance and Annuity Association - College Retirement Equities Fund, Annual Report. 1988, page 12.
4 Foreign investors are limited to closed end mutual funds in both Korea and Taiwan, and what evidence exists (that both funds sell at a substantial premium over net asset value) suggests that outsiders are effectively prevented from direct investment in those markets.
5 Data on dividend yields is taken from Capital International Perspective, various issues. The calculations in the text simply divide average dividend yields by 52 weeks in the year.
6 Table 2 was also formed on the basis of the log of returns, with no material differences in the results. Thus, daily returns in these markets are not more closely distributed as a log-normal process than a normal process.
7 See, for example, the discussion in Errunza and Losq (1987), leading to the conclusion that ‘If we consider currency risk as a function of each country’s purchasing power risks only, then in a multi-currency world where purchasing power parity holds, exchange risk would vanish,’ p. 63. Since numerous studies have shown that PPP holds rather well, exchange risk is neutralized. See also Grauer, Litzenberger, and Stehle (1976).
8 For example, using data from Capital International Perspective for the years 1970 through 1985 the correlations of the US market with 13 other markets showed an average absolute difference of only 0.08 between currency adjusted and non-currency adjusted common stock returns. Also, Errunza and Lowa (1987) comment that volatilities of dollar and local currency returns, even in emerging markets, are ‘similar’, p. 62.
ASIAN DAILY RETURN RELATIONSHIPS 283
9 Moreover, it would be a mistake to argue that the US market causes the movement of these Asian markets. It is more likely to be the case that all markets are affected by common world- wide factors, with information on these factors being made available to the market before the market close in New York (perhaps from information made available during business hours in Europe and North America).
10 That is, the regression ofan individual US domiciled firm on the Standard and Poor’s index, using daily data, normally would give rise to an R-squared value that exceeded those presented i n Table 6.
11 It may help to explain why closed end mutual funds authorized for purchase by foreigners, such as the Korea Fund, sell at such a large premium over net asset value. Surh premiums would be hard to justify without strong segmentation of investment opportunities.
REFERENCES
Ariel, R . (1987), ‘A Monthly Effect in Stork Returns’, ,Journal ofFinancial Economics, 1 7 (1987), pp. 161-174.
Board, J .L .G. and C.M.S. Sutcliffe (1988), ‘The Weekrnd Effect in UK Stock Market Returns’, Journal of Business Finance C3 Accounlingr, 15 (Summer 1988), pp. 119-213.
Condoyanni, L . , J . O’Hanlon and C.W.R. Ward (1987), ‘Day of the Week Effects on Stock Returns: International Evidence’, Journal o/Businex Finance tYAAccountinJr, 14 (Summer 1987),
Cross, F. (1973), ‘The Behavior of Stock Prices on Fridays and Monday‘, Financial Analysts,Journal,
Errunza, V. and E. Losq (1987). ‘How Risky are Emerging Markets’,Journal OfPortfoCio Manapnenl
French, K. (1980), ‘Stock Returns and the Wrekend Effect’, Journal o/Financzal Economics, 8 (March
Gibbons, M . and P. Hess (1981), ‘Day of the Week Effects and Asset Returns’, Journal ofBusiness, 54 (October 1981), pp, 579-96.
Grauer, F. , R . Litzenberger and R . Stehle (1976), ‘Sharing Rules and Equilibrium in an International Capital Market Under Unrrrtainty’,Journal ofFinancial Economics. 3 (June 1976),
Hawawini, G. (1988), ‘Market Efficiency and Equity Pricing: International Evidence and Implications for Global Investing’, University of Pennsylvania Working Paper (March 1988).
Jaffe, J . and R. Westerfield (1985a), ‘The Weekend Effect in Common Stock Returns: The International Evidence’, Journal of Fznance, 40 (June 1985). pp. 433-54.
~ (1985b), ‘Patterns in Japanese Common Stock Returns: Day of the Week and Turn of the Year Effects’, Journal d Financial and Quuntitatiue Analysis, 20 (June 1985), pp. 261-72.
.Jegadeesh, N. (1988), ‘Evidence of Predictable Behavior of Security Returns’, University of California Working Paper No. 6-88 (November 1988).
Johnston, E., W. Kracaw and J . McConnell(1988), ‘Day-of-the-week Effects in Financial Futures: An Analysis of GNMA, T-Bond and T-Bill Contracts’, Purdue University Working Paper (September 1988).
Keim, D. and R . Stambaugh (1984), ‘A Further Investigation of the Weekend Effect in Stock Returns’, Journal of Finance, 39 (July 1984), pp. 819-34.
Lakonishok, J . and M. Levi (1982), ‘Weekend Effects on Stock Returns: A Note’, Journal dFinance, 37 (June 1982), pp. 883-89.
and S. Smidty (1988), ‘Are Seasonal Anomolies Real? A Ninety-Year Perspective’, 7 h e Review of Financial Studies, 1 (Winter 1988), pp. 403-25.
I.evi, M. (1978), ‘The Weekend Game: Clearing House vs. Federal Funds’, Canadian Journal of Economics, 11 (November), pp. 750-57.
MacFarland, J., R. Pettit and S. Sung (1982), ‘The Distribution of Foreign Exchange Price Changes: Trading Day Effects and Risk Measurement’, Journal ofFinance, 37 (June), pp. 693-715.
Roll, R . (1988), ‘R2.’ Journal ofFinance, 43 (July), pp. 541-66.
pp. 159-74.
29 (November-December 1973), pp. 67-69.
(Fall 1987), pp. 62-67.
1980), pp. 55-69.
pp. 133-56.

284 LEE, PETTIT AND SWANKOSKI
Spicer & Oppenheirn International (1988), Guide iu Securilzepi Murkefs Around fhtz World (New York, John Wiley & Sons 1988).
Theobald, M. and V. Price (1984), ‘Seasonality Estimation in the Thin Markets’, Journal qfFinunce, 39 u u n e 1984), pp. 377-92.
Westerfield, R . (1977), ‘The Distribution of Common Stork Price Changes: An Application o f Transaction Time and Subordinated Stochastic Models’, ,/ournu/ ofFinnnciu1 and QuuanlitaliuP Analysir, 12 (Decrmber 1977), pp. 743-65.