rhb asian total return fund interim report 2020€¦ · 3 manager’s report target fund...
TRANSCRIPT

RHB ASIAN TOTAL RETURN FUND
INTERIM REPORT 2020
For the financial period ended 30 June 2020
1
GENERAL INFORMATION ABOUT THE FUND
Name, Category and Type
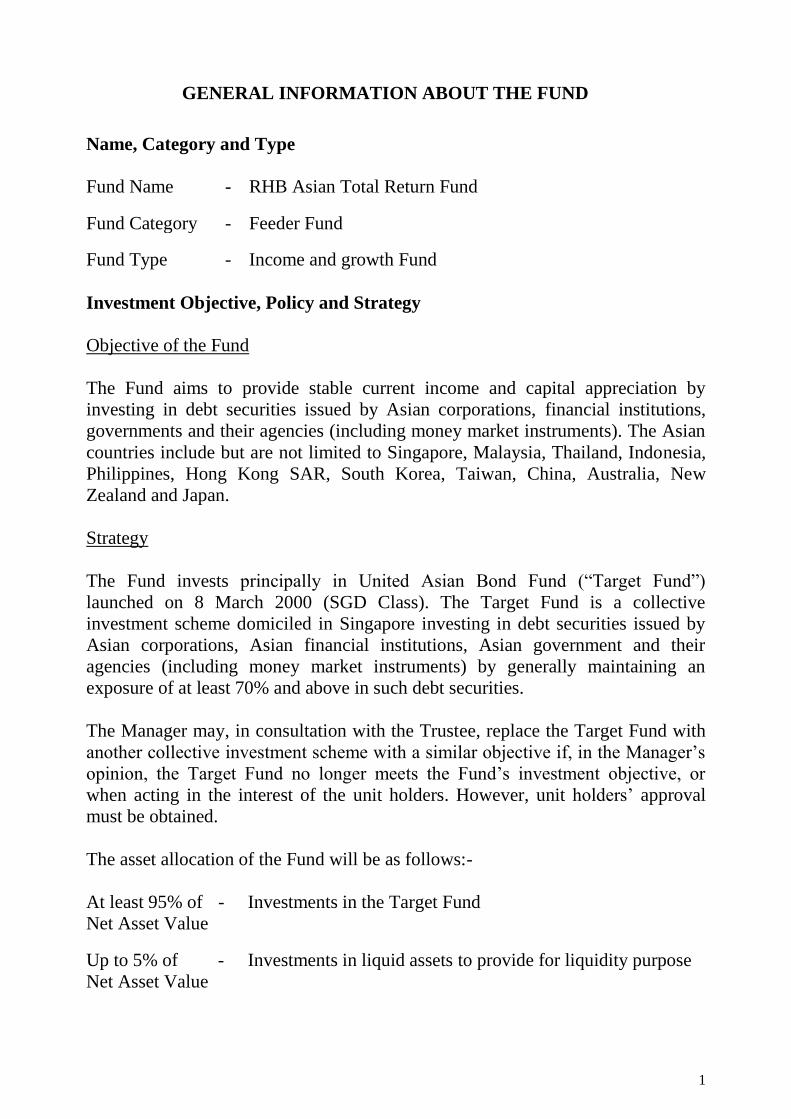
Fund Name - RHB Asian Total Return Fund
Fund Category - Feeder Fund Fund Type - Income and growth Fund
Investment Objective, Policy and Strategy
Objective of the Fund
The Fund aims to provide stable current income and capital appreciation by
investing in debt securities issued by Asian corporations, financial institutions,
governments and their agencies (including money market instruments). The Asian
countries include but are not limited to Singapore, Malaysia, Thailand, Indonesia,
Philippines, Hong Kong SAR, South Korea, Taiwan, China, Australia, New
Zealand and Japan.
Strategy
The Fund invests principally in United Asian Bond Fund (“Target Fund”)
launched on 8 March 2000 (SGD Class). The Target Fund is a collective
investment scheme domiciled in Singapore investing in debt securities issued by
Asian corporations, Asian financial institutions, Asian government and their
agencies (including money market instruments) by generally maintaining an
exposure of at least 70% and above in such debt securities.
The Manager may, in consultation with the Trustee, replace the Target Fund with
another collective investment scheme with a similar objective if, in the Manager’s
opinion, the Target Fund no longer meets the Fund’s investment objective, or
when acting in the interest of the unit holders. However, unit holders’ approval
must be obtained.
The asset allocation of the Fund will be as follows:-
At least 95% of
Net Asset Value
- Investments in the Target Fund
Up to 5% of
Net Asset Value
- Investments in liquid assets to provide for liquidity purpose

2
Performance Benchmark JP Morgan Asia Credit Index Total Return Composite (“JPMACI”) Permitted Investments The Fund may invest in local or foreign collective investment schemes (including
exchange traded funds), financial derivatives, liquid assets and any other
investment permitted by the Securities Commission Malaysia from time to time.
Distribution Policy
Annual distribution, subject to the availability of income at the end of the financial
period.

3
MANAGER’S REPORT
TARGET FUND PERFORMANCE
For the six months ended 30 June 2020, the target Fund registered a positive return
of 2.24% (in Singapore Dollar (“SGD”) terms), compared with a positive return of
6.10% (in SGD terms) in the benchmark JP Morgan Asia Credit Index (“JACI”)
Total Return Composite.
During the period under review, the target Fund’s underperformance versus its
benchmark was largely due to overweight positioning in non-investment grade as
the risk sentiment soured drastically. Despite invested in defensive non-investment
grade assets, the target fund manager were not spared by the indiscriminate sell-off
across all assets. Continuous redemption flows from the target fund had its
negative impact magnified as the credit market entered into a liquidity vacuum in
March, with bids only at distorted levels.
Specifically, trimming of the target fund overweight in non-investment grade
segment to fund the substantial redemptions had hurt the target fund drastically in
March. However, with the indiscriminate sell off faded and market refocused on
credit differentiation, the target fund was able to recoup some of the earlier losses.
The target fund enjoyed the three consecutive months of robust rallies by staying
invested in convicted defensive non-investment grade bonds. On credit sector
front, the target fund overweight in Real estate and Quasi sovereigns was offset by
the underweight in Sovereigns and technology, media, and telecom (“TMT”).
As at end June 2020, the target Fund held 61.10% in investment grade credit,
21.00% in non-investment grade credits, 13.03% in unit trust fund and 4.87% in
cash. Interest rate hedge was about 0% of NAV via United States Treasury
(“UST”) future contracts. The target Fund was mainly overweight in the
Consumer, Financials, Real Estate while mainly underweight in the Sovereign, Oil
& Gas and TMT sectors.
In terms of country allocation of the target fund, the allocation of the target fund
was 50.34% in China, 13.03% in Singapore, 12.54% in Indonesia, 10.24% in
Hong Kong, 2.61% in South Korea, 1.87% in Sri Lanka, 1.69% in Thailand,
1.20% in India, 1.61% in others and 4.87% in Cash.
FUND PERFORMANCE
During the period under review, the Fund has generated a return of 2.83%* as
compared with the benchmark gain of 7.13%*. The Fund is working to meet the
objective of provide stable current income and capital appreciation to its investors.
* Source: Lipper Investment Management (“Lipper IM”), 9 July 2020
4
ECONOMIC AND MARKET OUTLOOK
An unprecedented volatile first half in 2020 as clouded by tremendous stresses due
from a global pandemic. After a spectacular 2019 performance, markets continued
its climb higher during the first two months of 2020 before a cliff-like fall in
March. Asian credit market saw one of its worst performing month since the
2007/08 Global Financial Crisis. Fear was spreading like wild fire as the world
was fighting for its lives against this global coronavirus pandemic. Global
lockdowns and extreme expectations on economic impacts quickly gathered pace
and brought all investors involved in risk assets to its knees. To add woes, Saudi
Arabia’s decision to increase oil production following failure in talk with Russia
quickly sent oil prices to 30% lower and sent investors on flight to safety.
Fortunately, global central banks were seen swiftly stepping in with committed
and continuous easing measures to assist businesses, and unprecedented bond
purchases that helped investors to regain confidence in markets. For instance,
Unites States (“US”) Federal Reserve (“Fed”) announced emergency rate cuts of
50bps in early March and another 100bps later in less than two weeks later,
coupled with US Dollar (“USD”)700 billion worth of quantitative easing program
as pre-emptive measure to curb economic slowdown associated with this global
virus pandemic. Risk sentiment unexpectedly swung from a gloom and doom
scenario in March to one where only positivism was observed. Risk assets gained
positive momentum as we stepped into next few months. Adding to this optimism
were normal global production resumption, stabilization of COVID-19 cases
across the world, the confirmation of drug Remdesivir being able to aid in
COVID-19 treatment as well as lifting of lockdowns starting from May. Overall,
5-year US treasury yield fell massively by 140 basis points (“bps”) to 0.29% as at
end June 2020 from 1.69% as of end December 2019. For the same period, Asian
credit spreads widened substantially by 99 bps to 354bps from 255bps.
TARGET FUND STRATEGY & OUTLOOK
Moving ahead, the target fund manager are inclined to turn neutral on risk as a
market consolidation is likely after recent months of robust rallies. In the near
term, more focus will likely be placed on the potential negative headlines such as
more confirmation of this second wave of COVID-19 cases, more geopolitical
unrest between US and China, as well as the reduced attractiveness of bond
valuation alongside continuous new issuance supply. More negative headlines of
businesses in financial stresses or even business failures were also inevitable as the
global economy readjusts itself to adapt in the world of “new normal”. Having said
that, the expectation of a second half economic recovery will not change much as
we are again a step closer to a potential vaccine for this COVID-19. This robust
economic recovery in the second half of this year into next year remains the main
booster for investors to stay or get invested. Hence, any massive sell-off may be

5
seen as a window of opportunity for investors to gather quality high yielding bond
assets over the low underlying risk free US treasury yield.
Overall, the target fund manager broad strategy remains to advocate defensive
carry in 2020, need to stay calm and ride through this volatile period. Enormous
liquidity pumped into the global system, coupled with the anchored Asian demand
and manageable supply will be a favorable technical contributor towards the
returns for Asia Credit asset into 2020. All said, the target fund manager reiterate
the importance of credit differentiation and staying invested. The target fund
manager will continue to scrutinize issuers’ profile for adequacy, their abilities to
cope with the impacts during this challenging viral period and to evaluate the new
potential business strategies they devised as we move ahead into the “new normal”
world.
As at end June 2020, the average Asian credit spread stood at about 354bps which
was about 86bps wider than its three-year historical average of 268bps and about
88bps wider than its five-year historical average of 266bps. Overall, the target
fund manager continue to like the non-investment grade segment as this segment
offers a much higher carry but stay increasingly cautious on credit selection. The
target fund manager believe the need for yield remains while credit differentiation
is paramount. On the duration strategy, the target fund manager will be staying
broadly neutral to slightly short in overall duration. That said, the target fund
manager might engage in tactical duration positioning.

6
PERFORMANCE DATA
31.12.2019-
30.06.2020
%
Annual Total Returns
Financial Year Ended 31 December
2019
%
2018
%
2017
%
2016
%
2015
%
RHB Asian Total
Return Fund
- Capital Return 2.83 7.48 (1.29) (4.96) 7.42 23.86
- Income Return - - - - - -
- Total Return 2.83 7.48 (1.29) (4.96) 7.42 23.86
JPMACI 7.13 10.21 1.33 (4.57) 10.56 26.24
Average Annual Returns
1 Year
30.06.2019-
30.06.2020
%
3 Years
30.06.2017-
30.06.2020
%
5 Years
30.06.2015-
30.06.2020
%
10 Years
30.06.2010-
30.06.2020
%
RHB Asian Total
Return Fund 2.84 1.57 4.96 4.74
JPMACI 9.25 4.74 7.67 8.65

7
Performance of RHB Asian Total Return Fund
for the period from 30 June 2010 to 30 June 2020
Cumulative Return Over The Period (%)
Source: Lipper IM, 9 July 2020 The abovementioned performance figures are indicative returns based on daily Net
Asset Value of a unit (as per Lipper Database) since inception.
The calculation of the above returns is based on computation methods of Lipper.
Note : Past performance is not necessarily indicative of future performance and
unit prices and investment returns may go down, as well as up.
The abovementioned performance computations have been adjusted to
reflect distribution payments and unit splits wherever applicable.

8
As at
30.06.2020
As At 31 December
Fund Size 2019 2018 2017
Net Asset Value (RM million)
15.13 17.60 19.79 31.40 Units In Circulation (million) 21.82 26.10 31.55 49.41
Net Asset Value Per Unit (RM) 0.6933 0.6742 0.6273 0.6355
01.01.2020-
30.06.2020
Financial Year Ended
31 December
Historical Data 2019 2018 2017
Unit Prices
NAV - Highest (RM) 0.7149 0.6918 0.6344 0.6795
- Lowest (RM) 0.6419 0.6257 0.5952 0.6355
Distribution and Unit Split - - - -
Others
Management Expense Ratio
(MER) (%) # 0.19 0.40 0.45 0.46
Portfolio Turnover Ratio (PTR)
(times) ## 0.08 0.15 0.22 0.20
#
##
The MER for the financial period was lower compared with previous
financial period due to lower expenses incurred for the financial period under
review.
The PTR for the financial period was lower compared with previous financial
period due to lesser investments activities for the financial period under
review.
DISTRIBUTION
For the financial period under review, no distribution has been proposed by the
Fund.

9
PORTFOLIO STRUCTURE
The asset allocations of the Fund as at reporting date were as follows:
As at As at 31 December
30.06.2020 2019 2018 2017
% % % %
Sectors
Collective investment scheme 96.56 97.84 96.38 96.87
Liquid assets and other net current
assets 3.44 2.16 3.62 3.13
100.00 100.00 100.00 100.00
The asset allocation was reflective of the Fund’s investment strategy.
BREAKDOWN OF UNIT HOLDINGS BY SIZE
Account Holders No. Of Units Held*
Size of Holdings No. % (‘000) %
5,000 and below 2 11.11 7 0.03 5,001 to 10,000 - - - -
10,001 to 50,000 6 33.33 106 0.49
50,001 to 500,000 4 22.23 1,010 4.63
500,001 and above 6 33.33 20,695 94.85
Total 18 100.00 21,818 100.00
* Excluding Manager’s Stock
SOFT COMMISSION
The Fund Manager may only receive soft commission in the form of research and
advisory services that assist in the decision-making process relating to the Fund’s
investments.
During the financial period under review, the soft commission received from the
brokers had been retained by the Manager as the goods and services provided are
of demonstrable benefit to the unitholders.

10
RHB ASIAN TOTAL RETURN FUND
UNAUDITED STATEMENT OF FINANCIAL POSITION
AS AT 30 JUNE 2020
Note 30.06.2020 31.12.2019
RM RM
ASSETS
Investments 5 14,609,662 17,215,710
Deposits with licensed financial
institutions 6 420,473 392,182
Bank balances 6 49,498 32,378
Amount due from Manager
34,650 3,382
Other receivables
40,801 45,851
TOTAL ASSETS
15,155,084 17,689,503
LIABILITIES
Amount due to Manager
- 63,375
Accrued management fee
15,568 19,297
Amount due to Trustee
747 926
Other payables and accruals
9,084 10,450
TOTAL LIABILITIES
25,399 94,048
NET ASSET VALUE
15,129,685 17,595,455
EQUITY
Unitholders’ capital
1,958,833 4,862,002
Retained earnings
13,170,852 12,733,453
15,129,685 17,595,455
UNITS IN CIRCULATION (UNITS) 7 21,823,000 26,098,000
NET ASSET VALUE PER UNIT (RM)
0.6933 0.6742
The accompanying notes are an integral part of the financial statements.

11
RHB ASIAN TOTAL RETURN FUND
UNAUDITED STATEMENT OF INCOME AND EXPENSES
FOR THE FINANCIAL PERIOD ENDED 30 JUNE 2020
Note
01.01.2020 -
30.06.2020
01.01.2019 -
30.06.2019
RM RM
INCOME
Distribution of income from
investments
399,395 466,888
Interest income from deposits with
licensed financial institutions
4,295 9,120
Net gain on investments 5 66,208 938,930
Net foreign currency exchange
(loss)/gain
(1,012) 3,423
468,886 1,418,361
EXPENSES
Management fee 8 (16,962) (27,577)
Trustee’s fee 9 (4,835) (5,782)
Audit fee
(3,361) (3,325)
Tax agent’s fee
(5,022) (1,900)
Other expenses
(1,307) (1,472)
(31,487) (40,056)
Net income before taxation
437,399 1,378,305
Taxation 10 - -
Net income after taxation
437,399 1,378,305
Net income after taxation is made up
of the following:
Realised amount
388,192 457,670
Unrealised amount 49,207 920,635
437,399 1,378,305
The accompanying notes are an integral part of the financial statements.
12
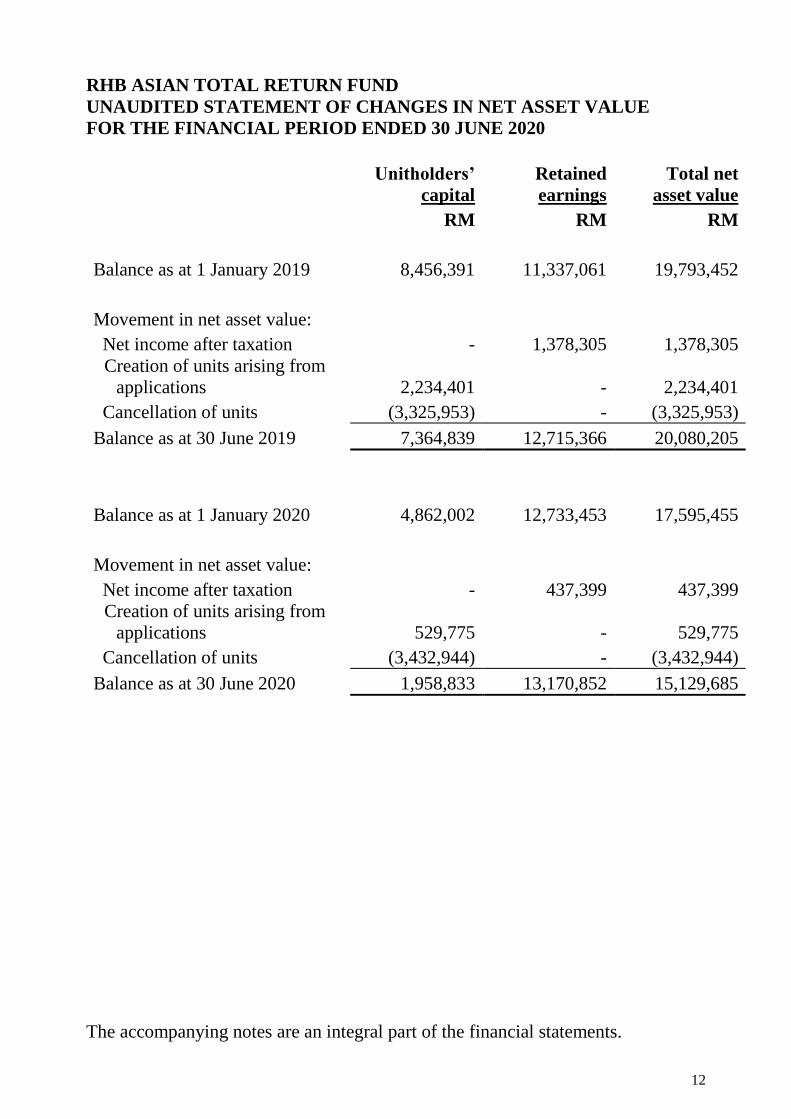
RHB ASIAN TOTAL RETURN FUND
UNAUDITED STATEMENT OF CHANGES IN NET ASSET VALUE
FOR THE FINANCIAL PERIOD ENDED 30 JUNE 2020
Unitholders’
capital
Retained
earnings
Total net
asset value
RM RM RM
Balance as at 1 January 2019 8,456,391 11,337,061 19,793,452
Movement in net asset value:
Net income after taxation - 1,378,305 1,378,305
Creation of units arising from
applications 2,234,401 - 2,234,401
Cancellation of units (3,325,953) - (3,325,953)
Balance as at 30 June 2019 7,364,839 12,715,366 20,080,205
Balance as at 1 January 2020 4,862,002 12,733,453 17,595,455
Movement in net asset value:
Net income after taxation - 437,399 437,399
Creation of units arising from
applications 529,775 - 529,775
Cancellation of units (3,432,944) - (3,432,944)
Balance as at 30 June 2020 1,958,833 13,170,852 15,129,685
The accompanying notes are an integral part of the financial statements.

13
RHB ASIAN TOTAL RETURN FUND
UNAUDITED STATEMENT OF CASH FLOWS
FOR THE FINANCIAL PERIOD ENDED 30 JUNE 2020
01.01.2020 -
30.06.2020
01.01.2019 -
30.06.2019
RM RM
CASH FLOWS FROM
OPERATING ACTIVITIES
Proceeds from sale of investment
2,667,726 2,062,180
Purchase of investment
- (1,405,280)
Income distribution received from
investments
398,417 466,888
Interest received from deposits with
licensed financial institutions
4,295 9,120
Management fee paid
(11,145) (20,427)
Trustee’s fee paid
(5,014) (5,795)
Payment for other fees and expenses
(11,056) (9,492)
Net cash generated from operating
activities
3,043,223 1,097,194
CASH FLOWS FROM
FINANCING ACTIVITIES
Cash proceeds from units created
498,507 2,210,358
Cash paid for units cancelled
(3,496,319) (3,293,863)
Net cash used in financing activities
(2,997,812) (1,083,505)
Net increase in cash and cash
equivalents
45,411 13,689
Cash and cash equivalents at the
beginning of the financial period
424,560 719,302
Cash and cash equivalents at the end
of the financial period
469,971 732,991
The accompanying notes are an integral part of the financial statements.

14
RHB ASIAN TOTAL RETURN FUND
NOTES TO THE UNAUDITED FINANCIAL STATEMENTS
FOR THE FINANCIAL PERIOD ENDED 30 JUNE 2020
1 THE FUND, THE MANAGER AND THEIR PRINCIPAL ACTIVITIES
The RHB Asian Total Return Fund (hereinafter referred to as “the Fund”) was
constituted pursuant to the execution of a Master deed (conventional funds) dated
12 June 2008 as amended via its supplemental master deed (conventional funds)
dated 25 August 2008, second supplemental master deed (conventional funds)
dated 12 December 2008, third supplemental master deed (conventional funds)
dated 19 June 2009, fifth supplemental master deed (conventional funds) dated 26
April 2010, sixth supplemental master deed (conventional funds) dated 28 June
2010, ninth supplemental master deed (conventional funds) dated 7 March 2012,
tenth supplemental master deed (conventional funds) dated 13 April 2012,
fifteenth supplemental master deed (conventional funds) dated 30 April 2013,
sixteenth supplemental master deed (conventional funds) dated 24 September
2013, seventeenth supplemental master deed (conventional funds) dated 2 March
2015, eighteenth supplemental master deed (conventional funds) dated 20 May
2015 and nineteenth supplemental master deed (conventional funds) dated 3
August 2015 (collectively referred to as “the Deeds”) between RHB Asset
Management Sdn Bhd (“the Manager”) and HSBC (Malaysia) Trustee Berhad
(“the Trustee”).
The Fund was launched on 26 February 2007 and will continue its operations until
terminated according to the conditions provided in the Deeds. The principal
activity of the Fund is to invest in ‘Permitted Investments’ as defined in the Deeds.
The Fund is a feeder fund that invests in the United Asian Bond Fund (“Target
Fund”), a collective investment scheme domiciled in Singapore that is managed by
UOB Asset Management Limited, Singapore.
When the investment in the Target Fund does not meet the objectives of the Fund,
or when acting in the interest of the unitholders, the Manager may choose to
replace it with other collective investment scheme with similar objectives, subject
to the approval from the unitholders.
All investments will be subject to the Securities Commission’s (“SC”) Malaysia
Guidelines on Unit Trust Funds, SC requirements, the Deeds, except where
exemptions or variations have been approved by the SC, internal policies and
procedures and objective of the Fund.
15
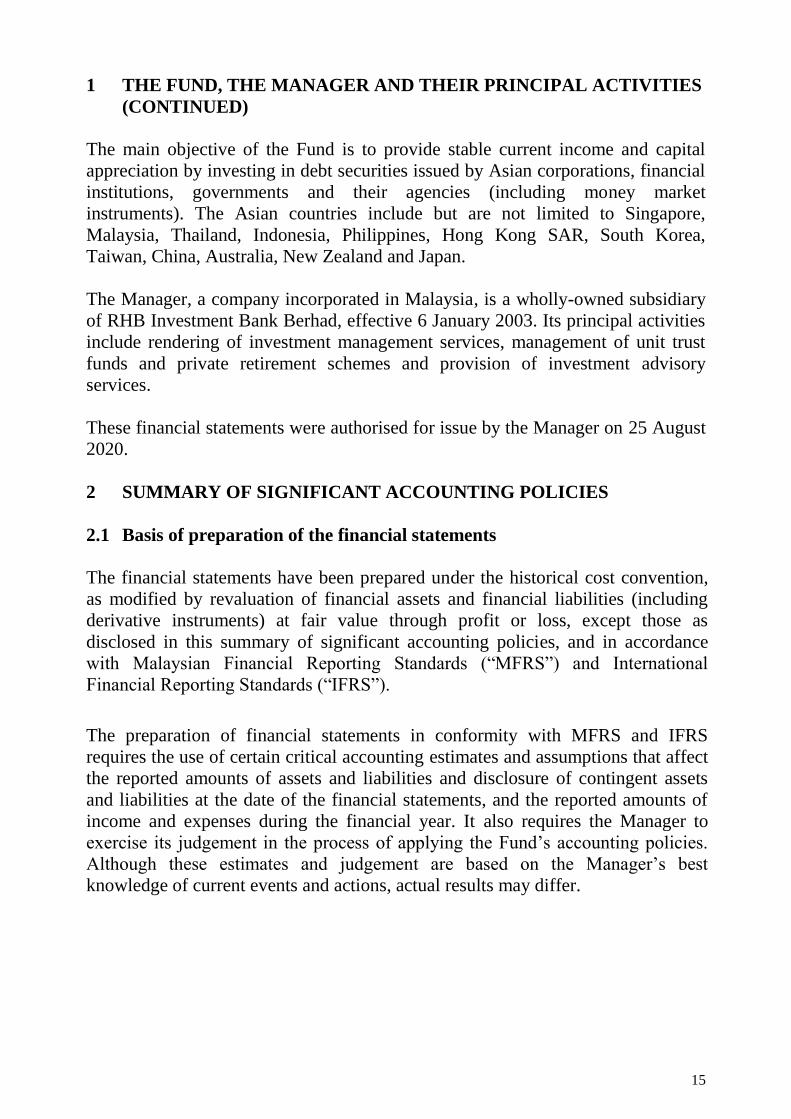
1 THE FUND, THE MANAGER AND THEIR PRINCIPAL ACTIVITIES
(CONTINUED)
The main objective of the Fund is to provide stable current income and capital
appreciation by investing in debt securities issued by Asian corporations, financial
institutions, governments and their agencies (including money market
instruments). The Asian countries include but are not limited to Singapore,
Malaysia, Thailand, Indonesia, Philippines, Hong Kong SAR, South Korea,
Taiwan, China, Australia, New Zealand and Japan.
The Manager, a company incorporated in Malaysia, is a wholly-owned subsidiary
of RHB Investment Bank Berhad, effective 6 January 2003. Its principal activities
include rendering of investment management services, management of unit trust
funds and private retirement schemes and provision of investment advisory
services.
These financial statements were authorised for issue by the Manager on 25 August
2020.
2 SUMMARY OF SIGNIFICANT ACCOUNTING POLICIES
2.1 Basis of preparation of the financial statements
The financial statements have been prepared under the historical cost convention,
as modified by revaluation of financial assets and financial liabilities (including
derivative instruments) at fair value through profit or loss, except those as
disclosed in this summary of significant accounting policies, and in accordance
with Malaysian Financial Reporting Standards (“MFRS”) and International
Financial Reporting Standards (“IFRS”).
The preparation of financial statements in conformity with MFRS and IFRS
requires the use of certain critical accounting estimates and assumptions that affect
the reported amounts of assets and liabilities and disclosure of contingent assets
and liabilities at the date of the financial statements, and the reported amounts of
income and expenses during the financial year. It also requires the Manager to
exercise its judgement in the process of applying the Fund’s accounting policies.
Although these estimates and judgement are based on the Manager’s best
knowledge of current events and actions, actual results may differ.

16
2 SUMMARY OF SIGNIFICANT ACCOUNTING POLICIES
(CONTINUED)
2.1 Basis of preparation of the financial statements (continued)
(a) The Fund has applied the following revised Framework and amendments
to published standards for the first time for the financial period beginning on
1 January 2020:
The Conceptual Framework for Financial Reporting (“Framework”)
(effective 1 January 2020)
The Framework was revised with the primary purpose to assist the
International Accounting Standards Board (“IASB”) to develop IFRS
that are based on consistent concepts and enable preparers to develop
consistent accounting policies where an issue is not addressed by an
IFRS.
Key changes include:
- increasing the prominence of stewardship in the objective of
financial reporting
- reinstating prudence as a component of neutrality
- defining a reporting entity, which may be a legal entity, or a portion
of an entity
- revising the definitions of an asset and a liability
- removing the probability threshold for recognition and adding
guidance on derecognition
- adding guidance on different measurement basis, and
- stating that profit or loss is the primary performance indicator and
that, in principle, income and expenses in other comprehensive
income should be recycled where this enhances the relevance or
faithful representation of the financial statements.
No changes will be made to any of the current accounting standards.
However, entities that rely on the Framework in determining their
accounting policies for transactions, events or conditions that are not
otherwise dealt with under the accounting standards will need to apply
the revised Framework from 1 January 2020.

17
2 SUMMARY OF SIGNIFICANT ACCOUNTING POLICIES
(CONTINUED)
2.1 Basis of preparation of the financial statements (continued)
(a) The Fund has applied the following revised Framework and amendments
to published standards for the first time for the financial period beginning on
1 January 2020: (continued)
Amendments to MFRS 101 and MFRS 108 ‘Definition of Material’
(effective 1 January 2020) clarify the definition of materiality and use a
consistent definition throughout MFRSs and the Conceptual
Framework for Financial Reporting.
The revised Framework and adoption of the amendments to published
standards are not expected to give rise to any material impact on the
financial statements of the Fund.
2.2 Financial assets
Classification
The Fund classifies its financial assets in the following measurement categories:
those to be measured subsequently at fair value through profit or loss
(“FVTPL”), and
those to be measured at amortised cost
The Fund classifies its investments based on both the Fund’s business model for
managing those financial assets and the contractual cash flow characteristics of the
financial assets. The portfolio of financial assets is managed and performance is
evaluated on a fair value basis. The Fund is primarily focused on fair value
information and uses that information to assess the assets’ performance and to
make decisions. The Fund has not taken the option to irrevocably designate any
equity securities as fair value through other comprehensive income. The
contractual cash flows of the Fund’s debt securities are solely principal and
interest, however, these securities are neither held for the purpose of collecting
contractual cash flows nor held both for collecting contractual cash flows and for
sale. The collection of contractual cash flows is only incidental to achieving the
Fund’s business model’s objective. Consequently, all investments are measured at
fair value through profit or loss.

18
2 SUMMARY OF SIGNIFICANT ACCOUNTING POLICIES
(CONTINUED)
2.2 Financial assets (continued)
Classification (continued)
The Fund classifies cash and cash equivalents, amount due from Manager and
other receivables at amortised cost as these financial assets are held to collect
contractual cash flows consisting of the amount outstanding.
Recognition and measurement
Regular purchases and sales of financial assets are recognised on the trade date -
the date on which the Fund commits to purchase or sell the asset. Financial assets
and financial liabilities at fair value through profit or loss are initially recognised at
fair value.
Financial assets are derecognised when the rights to receive cash flows from the
investments have expired or the Fund has transferred substantially all risks and
rewards of ownership.
Subsequent to initial recognition, all financial assets at fair value through profit or
loss are measured at fair value. Gains or losses arising from changes in the fair
value of the ‘financial assets at fair value through profit or loss’ category are
presented in statement of income and expenses in the period in which they arise.
Distribution income from financial assets at fair value through profit or loss is
recognised in the statement of income and expenses within distribution income
when the Fund’s right to receive payments is established.
Collective investment scheme is valued based on the last published net asset value
per unit or share of such collective investment scheme or, if unavailable, on the
average of the last published buying price and the last published selling price of
such unit or share (excluding any sales charge included in such selling price).
Deposits with licensed financial institutions are stated at cost plus accrued interest
calculated on the effective interest method over the period from the date of
placement to the date of the statement of financial position, which is a reasonable
estimate of fair value due to the short-term nature of the deposits.
Financial assets at amortised cost are subsequently carried at amortised cost using
the effective interest method.

19
2 SUMMARY OF SIGNIFICANT ACCOUNTING POLICIES
(CONTINUED)
2.2 Financial assets (continued)
Impairment of financial assets
The Fund measures credit risk and expected credit losses using probability of
default, exposure at default and loss given default. Management considers both
historical analysis and forward looking information in determining any expected
credit loss. Management considers the probability of default to be close to zero as
these instruments have a low risk of default and the counterparties have a strong
capacity to meet their contractual obligations in the near term. As a result, no loss
allowance has been recognised based on the 12-month expected credit losses as
any such impairment would be wholly insignificant to the Fund.
Significant increase in credit risk
A significant increase in credit risk is defined by management as any contractual
payment which is more than 30 days past due or a counterparty credit rating which
has fallen below BBB/Baa.
Definition of default and credit-impaired financial assets
Any contractual payment which is more than 90 days past due is considered credit
impaired.
Write-off
The Fund writes off financial assets, in whole or in part, when it has exhausted all
practical recovery efforts and has concluded there is no reasonable expectation of
recovery. The assessment of no reasonable expectation of recovery is based on the
unavailability of debtor’s sources of income or assets to generate sufficient future
cash flows to repay the amount. The Fund may write off financial assets that are
still subject to enforcement activity. Subsequent recoveries of amounts previously
written off will result in impairment gains. There are no write-offs/recoveries
during the financial period.

20
2 SUMMARY OF SIGNIFICANT ACCOUNTING POLICIES
(CONTINUED)
2.3 Financial liabilities
Financial liabilities are classified according to the substance of the contractual
arrangements entered into and the definitions of a financial liability.
Financial liabilities, within the scope of MFRS 9, are recognised in the statement
of financial position when, and only when, the Fund becomes a party to the
contractual provisions of the financial instrument.
The Fund’s financial liabilities which include amount due to Manager, accrued
management fee, amount due to Trustee and other payables and accruals are
recognised initially at fair value plus directly attributable transaction cost and
subsequently measured at amortised cost using the effective interest method.
A financial liability is derecognised when the obligation under the liability is
extinguished. Gains and losses are recognised in statement of income and expenses
when the liabilities are derecognised, and through the amortisation process.
2.4 Unitholders’ capital
The unitholders’ contributions to the Fund meet the criteria of the definition of
puttable instruments to be classified as equity instruments under MFRS 132
“Financial Instruments: Presentation”. These criteria include:
the units entitle the holder to a proportionate share of the Fund’s net asset
value;
the units are the most subordinated class and class features are identical;
there is no contractual obligations to deliver cash or another financial asset
other than the obligation on the Fund to repurchase; and
the total expected cash flows from the units over its life are based substantially
on the statement of income and expenses of the Fund.
The outstanding units are carried at the redemption amount that is payable at each
financial period if the unitholders exercise the right to put the units back to the
Fund.
Units are created and cancelled at prices based on the Fund’s net asset value per
unit at the time of creation or cancellation. The Fund’s net asset value per unit is
calculated by dividing the net assets attributable to unitholders with the total
number of outstanding units.
21
2 SUMMARY OF SIGNIFICANT ACCOUNTING POLICIES
(CONTINUED)
2.5 Income recognition
Distribution of income from collective investment scheme is recognised when the
Fund’s right to receive payment is established. Distribution of income is received
from financial assets measured at FVTPL.
Interest income from deposits with licensed financial institutions are recognised on
an accrual basis using the effective interest method.
Interest income is calculated by applying the effective interest rate to the gross
carrying amount of a financial asset except for financial assets that subsequently
become credit-impaired. For credit-impaired financial assets, the effective interest
rate is applied to the net carrying amount of the financial assets (after deduction of
the loss allowance).
Realised gain or loss on sale of collective investment scheme is arrived at after
accounting for cost of investments, determined on the weighted average cost
method.
Net income or loss is the total of income less expenses.
2.6 Taxation
Current tax expense is determined according to Malaysian tax laws and includes all
taxes based upon the taxable income earned during the financial period.
2.7 Cash and cash equivalents
For the purpose of the statement of cash flows, cash and cash equivalents comprise
bank balances and deposits with licensed financial institutions which are subject to
an insignificant risk of changes in value.
2.8 Presentation and functional currency
Items included in the financial statements of the Fund are measured using the
currency of the primary economic environment in which the Fund operates (the
“functional currency”). The financial statements are presented in Ringgit Malaysia
(“RM”), which is the Fund’s presentation and functional currency.

22
2 SUMMARY OF SIGNIFICANT ACCOUNTING POLICIES
(CONTINUED)
2.8 Presentation and functional currency (continued)
Due to mixed factors in determining the functional currency of the Fund, the
Manager has used its judgement to determine the functional currency that most
faithfully represents the economic effects of the underlying transactions, events
and conditions and have determined the functional currency to be in RM primarily
due to the following factors:
Part of the Fund’s cash is denominated in RM for the purpose of making
settlement of the creation and cancellation.
The Fund’s units are denominated in RM.
The Fund’s significant expenses are denominated in RM.
2.9 Foreign currency translation
Foreign currency transactions in the Fund are accounted for at exchange rates
prevailing at the transaction dates. Foreign currency monetary assets and liabilities
are translated at exchange rates prevailing at the reporting date. Exchange
differences arising from the settlement of foreign currency transactions and from
the translation of foreign currency monetary assets and liabilities are recognised in
statement of income and expenses.
3 FINANCIAL RISK MANAGEMENT OBJECTIVES AND POLICIES
The Fund is exposed to a variety of risks, which include market risk, price risk,
currency risk, interest rate risk, liquidity risk, credit risk and capital risk.
Financial risk management is carried out through internal control processes
adopted by the Manager and adherence to the investment restrictions as stipulated
in the SC Malaysia Guidelines on Unit Trust Funds.
Market risk
Market risk is a risk that arises when the prices of investments in the market place
are affected by circumstances such as general market or economic events. These
circumstances, which may be a local or global event, can affect a local market
where the Target Fund is invested in or global markets and subsequently, the value
of the Target Fund’s investments.

23
3 FINANCIAL RISK MANAGEMENT OBJECTIVES AND POLICIES
(CONTINUED)
Price risk
Price risk is the risk that the fair value of the investments of the Fund will fluctuate
because of changes in market prices (other than these arising from interest rate
risk).
The Fund is exposed to collective investments scheme price risk (other than those
arising from interest rate risk) for its investments of RM14,609,662 (31.12.2019:
RM17,215,710).
The sensitivity analysis is based on the assumption that the price of the
investments fluctuate by +/(-) 5% with all other variables held constant, the impact
on statement of income and expenses and net asset value is +/(-) RM730,483
(31.12.2019: RM860,786).
Currency risk
The Fund invests in the Target Fund which is denominated in Singapore Dollar
(“SGD”). Fluctuations in foreign exchange rate between SGD and Ringgit
Malaysia will affect the value of the Fund’s foreign investments when converted to
local currency and subsequently the value of unitholders’ investment. As such, the
performance of the Fund will also be affected by the movements in the exchange
rate between SGD and Ringgit Malaysia.
The sensitivity analysis is based on the assumption that the foreign exchange rate
fluctuates by +/(-) 5% with all other variable remain constant, the impact on
statement of income and expenses and net asset value is +/(-) RM732,523
(31.12.2019: RM863,078).
Investments Receivables Total
RM RM RM
30.06.2020
Singapore Dollar 14,609,662
40,801
14,650,463
Investments Receivables Total
RM RM RM
30.11.2019
Singapore Dollar 17,215,710
45,851
17,261,561

24
3 FINANCIAL RISK MANAGEMENT OBJECTIVES AND POLICIES
(CONTINUED)
Interest rate risk
Interest rate risk is the risk that the cost or the value of the financial instruments
will fluctuate due to changes in market interest rates. The Fund’s exposure to the
interest rate risk is mainly from short term placements with licensed financial
institutions. The Manager overcomes the exposure by way of maintaining deposits
on short term basis. Therefore, exposure to interest rate fluctuation is minimal.
Liquidity risk
Liquidity risk is the risk that the Fund will encounter difficulty in meeting its
financial obligations.
The Fund invests principally in the Target Fund. The liquidity risk that exists at the
Fund level is associated with the inability of the Target Fund to meet large
redemption requests in a timely manner. This is related to the risk of substantial
redemptions.
The table below summarises the Fund’s financial liabilities into relevant maturity
groupings based on the remaining period from the statement of financial position
date to the contractual maturity date. The amounts in the table are the contractual
undiscounted cash flows.
Less than
1 month
Between
1 month
to 1 year
RM
RM
30.06.2020
Accrued management fee 15,568 -
Amount due to Trustee 747 -
Other payables and accruals - 9,084
16,315 9,084
D
31.12.2019
Amount due to Manager 63,375
-
Accrued management fee 19,297
-
Amount due to Trustee 926
-
Other payables and accruals -
10,450
83,598
10,450

25
3 FINANCIAL RISK MANAGEMENT OBJECTIVES AND POLICIES
(CONTINUED)
Credit risk
Credit risk refers to the possibility that the issuer of a particular investment will not
be able to make timely or full payments of principal or income due on that
investment. The risk arising from placements of deposits in licensed financial
institutions is managed by ensuring that the Fund will only place deposits in
reputable licensed financial institutions. The settlement terms of the proceeds from
the creation of units receivable from the Manager are governed by the SC Malaysia
Guidelines on Unit Trust Funds.
The following table sets out the credit risk concentrations of the Fund:
Cash and
cash
equivalents
RM
Other
financial
assets*
RM
Total
RM
30.06.2020
Financial institutions:
AAA 469,971 - 469,971
Others - 75,451 75,451
469,971 75,451 545,422
30.06.2019
Financial institutions:
AAA 32,378 - 32,378
AA3 392,182 - 392,182
Others - 49,233 49,233
424,560 49,233 473,793
* Comprise amount due from Manager and other receivables.

26
3 FINANCIAL RISK MANAGEMENT OBJECTIVES AND POLICIES
(CONTINUED)
Capital risk
The capital of the Fund is represented by equity consisting of unitholders’ capital
of RM1,958,833 (31.12.2019: RM4,862,002) and retained earnings of
RM13,170,852 (31.12.2019: RM12,733,453). The amount of equity can change
significantly on a daily basis as the Fund is subject to daily subscriptions and
redemptions at the discretion of unitholders. The Fund’s objective when managing
capital is to safeguard the Fund’s ability to continue as a going concern in order to
provide returns for unitholders and benefits for other stakeholders and to maintain
a strong capital base to support the development of the investment activities of the
Fund.
4 FAIR VALUE ESTIMATION
Fair value is defined as the price that would be received to sell an asset or paid to
transfer a liability in an orderly transaction between market participants at the
measurement date (i.e. an exit price).
The fair value of financial assets and liabilities traded in an active market (such as
publicly traded derivatives and trading securities) are based on quoted market
prices at the close of trading on the financial period end date.
An active market is a market in which transactions for the assets or liabilities take
place with sufficient frequency and volume to provide pricing information on an
ongoing basis.
The fair value of financial assets and liabilities that are not traded in an active
market is determined by using valuation techniques. The Fund uses a variety of
methods and makes assumptions that are based on market conditions existing at
each financial period end date. Valuation techniques used for non-standardised
financial instruments such as options, currency swaps and other over-the-counter
derivatives, include the use of comparable recent transactions, reference to other
instruments that are substantially the same, discounted cash flow analysis, option
pricing models and other valuation techniques commonly used by market
participants making the maximum use of market inputs and relying as little as
possible on entity-specific inputs.

27
4 FAIR VALUE ESTIMATION (CONTINUED)
The fair values are based on the following methodologies and assumptions:
(i) For bank balances and deposits with licensed financial institutions with
maturities less than 1 year, the carrying value is a reasonable estimate of fair
value.
(ii) The carrying value of receivables and payables are assumed to approximate
their fair values due to their short term nature.
Fair value hierarchy
The Fund adopted MFRS 13 “Fair Value Measurement” in respect of disclosures
about the degree of reliability of fair value measurement. This requires the Fund to
classify fair value measurements using a fair value hierarchy that reflects the
significance of the inputs used in making the measurements. The fair value
hierarchy has the following levels:
Level 1: Quoted prices (unadjusted) in active market for identical assets or
liabilities
Level 2: Inputs other than quoted prices included within Level 1 that are
observable for the asset or liability, either directly (that is, as prices) or
indirectly (that is, derived from prices)
Level 3: Inputs for the asset and liability that are not based on observable
market data (that is, unobservable inputs)
The following table analyses within the fair value hierarchy the Fund’s financial
assets at fair value through profit or loss (by class) measured at fair value:
Level 1 Level 2 Level 3 Total
RM RM RM RM
30.06.2020
Investments:
- Collective investment scheme
- foreign 14,609,662 - - 14,609,662
31.12.2019
Investments:
- Collective investment scheme
- foreign 17,215,710 - - 17,215,710

28
4 FAIR VALUE ESTIMATION (CONTINUED)
Investments in collective investment scheme, i.e. unit trust fund whose values are
based on published prices in active markets is classified within Level 1. The Fund
does not adjust the quoted prices for these instruments. The Fund’s policies on
valuation of these financial assets are stated in Note 2.2.
5 INVESTMENTS
30.06.2020 31.12.2019
RM RM
Investments:
- Collective investment scheme - foreign 14,609,662 17,215,710
01.01.2020 -
30.06.2020
01.01.2019 -
30.06.2019
RM RM
Net gain on investments comprised:
- Net realised gain on sale of investments 17,000 18,295
- Net unrealised gain on changes in fair value 49,208 920,635
66,208 938,930
Investments as at 30 June 2020 are as follows:
Name of Counter Quantity Cost Fair Value
% of
Net Asset
Value
RM RM %
COLLECTIVE INVESTMENT
SCHEME - FOREIGN
SINGAPORE
United Asian Bond Fund 2,746,402 14,383,426 14,609,662 96.56

29
5 INVESTMENTS (CONTINUED)
Investments as at 31 December 2019 are as follows:
Name of Counter Quantity Cost Fair Value
% of
Net Asset
Value
RM RM %
COLLECTIVE INVESTMENT
SCHEME - FOREIGN
SINGAPORE
United Asian Bond Fund 3,253,402 17,038,682 17,215,710 97.84
6 CASH AND CASH EQUIVALENTS
Cash and cash equivalent comprise:
30.06.2020 31.12.2019
RM RM
Deposits with licensed financial institutions 420,473 392,182
Bank balances 49,498 32,378
469,971 424,560
7 UNITS IN CIRCULATION
30.06.2020 31.12.2019
Units Units
At the beginning of the financial period/year 26,098,000 31,551,000
Creation of units arising from applications during
the financial period/year 773,000 5,878,000
Cancellation of units during the financial
period/year (5,048,000) (11,331,000)
At the end of the financial period/year 21,823,000 26,098,000
30
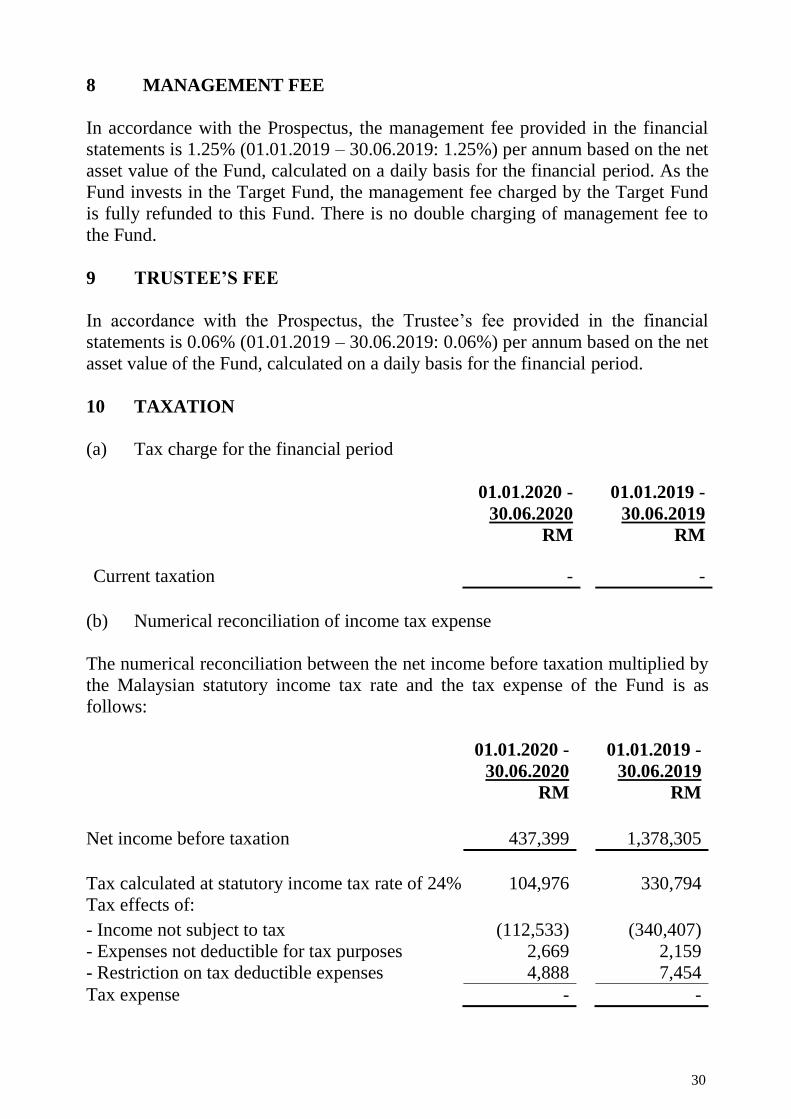
8 MANAGEMENT FEE
In accordance with the Prospectus, the management fee provided in the financial
statements is 1.25% (01.01.2019 – 30.06.2019: 1.25%) per annum based on the net
asset value of the Fund, calculated on a daily basis for the financial period. As the
Fund invests in the Target Fund, the management fee charged by the Target Fund
is fully refunded to this Fund. There is no double charging of management fee to
the Fund.
9 TRUSTEE’S FEE
In accordance with the Prospectus, the Trustee’s fee provided in the financial
statements is 0.06% (01.01.2019 – 30.06.2019: 0.06%) per annum based on the net
asset value of the Fund, calculated on a daily basis for the financial period.
10 TAXATION
(a) Tax charge for the financial period
01.01.2020 -
30.06.2020
01.01.2019 -
30.06.2019
RM
RM
Current taxation -
-
(b) Numerical reconciliation of income tax expense
The numerical reconciliation between the net income before taxation multiplied by
the Malaysian statutory income tax rate and the tax expense of the Fund is as
follows:
01.01.2020 -
30.06.2020
01.01.2019 -
30.06.2019
RM
RM
Net income before taxation 437,399
1,378,305
Tax calculated at statutory income tax rate of 24% 104,976
330,794
Tax effects of:
- Income not subject to tax (112,533)
(340,407)
- Expenses not deductible for tax purposes 2,669
2,159
- Restriction on tax deductible expenses 4,888
7,454
Tax expense -
-

31
11 MANAGEMENT EXPENSE RATIO (“MER”)
01.01.2020 -
30.06.2020
01.01.2019 -
30.06.2019
%
%
MER 0.19 0.21
The MER ratio is calculated based on total expenses of the Fund to the average net
asset value of the Fund calculated on a daily basis.
12 PORTFOLIO TURNOVER RATIO (“PTR”)
01.01.2020 -
30.06.2020
01.01.2019 -
30.06.2019
PTR (times) 0.08 0.09
The PTR ratio is calculated based on average of acquisition and disposals of the
Fund for the financial period to the average net asset value of the Fund calculated
on a daily basis.
13 UNITS HELD BY THE MANAGER AND PARTIES RELATED TO
THE MANAGER The number of units held by the Manager and related party are as follows:
30.06.2020
31.12.2019
Units
RM
Units
RM
The Manager 5,160 3,577
5,506
3,712
RHB Capital Nominees
(Tempatan) Sdn Bhd 2,213,174 1,534,394 2,502,465 1,687,162
The units are held beneficially by the Manager for booking purposes. The Manager
is of the opinion that all transactions with the related parties have been entered into
in the normal course of business at agreed terms between the related parties. The units held by RHB Capital Nominees (Tempatan) Sdn Bhd, a wholly owned
subsidiary of ultimate holding company of the Manager, are under nominees
structure. Other than the above, there were no units held by the Directors or parties related to
the Manager.
32
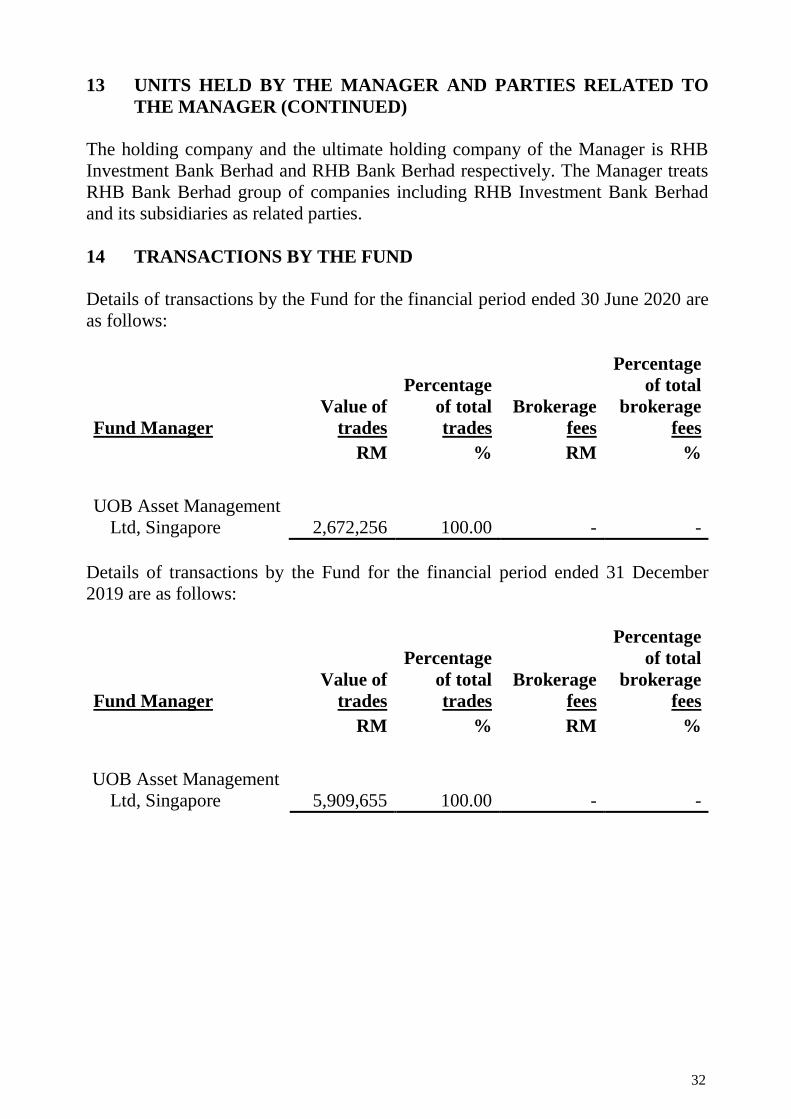
13 UNITS HELD BY THE MANAGER AND PARTIES RELATED TO
THE MANAGER (CONTINUED)
The holding company and the ultimate holding company of the Manager is RHB
Investment Bank Berhad and RHB Bank Berhad respectively. The Manager treats
RHB Bank Berhad group of companies including RHB Investment Bank Berhad
and its subsidiaries as related parties.
14 TRANSACTIONS BY THE FUND
Details of transactions by the Fund for the financial period ended 30 June 2020 are
as follows:
Fund Manager
Value of
trades
Percentage
of total
trades
Brokerage
fees
Percentage
of total
brokerage
fees
RM % RM %
UOB Asset Management
Ltd, Singapore 2,672,256 100.00 - -
Details of transactions by the Fund for the financial period ended 31 December
2019 are as follows:
Fund Manager
Value of
trades
Percentage
of total
trades
Brokerage
fees
Percentage
of total
brokerage
fees
RM % RM %
UOB Asset Management
Ltd, Singapore 5,909,655 100.00 - -
33
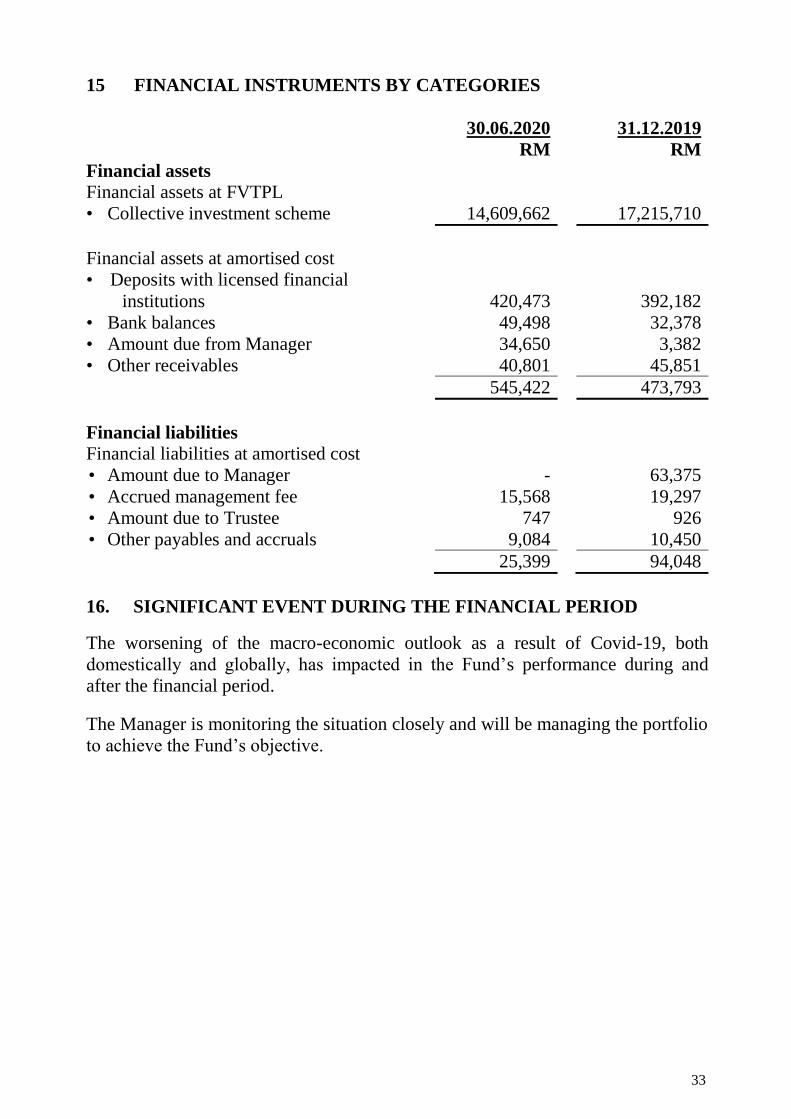
15 FINANCIAL INSTRUMENTS BY CATEGORIES
30.06.2020 31.12.2019
RM
RM
Financial assets
Financial assets at FVTPL
• Collective investment scheme 14,609,662 17,215,710
Financial assets at amortised cost
• Deposits with licensed financial
institutions 420,473 392,182
• Bank balances 49,498 32,378
• Amount due from Manager 34,650 3,382
• Other receivables 40,801 45,851
545,422 473,793
Financial liabilities
Financial liabilities at amortised cost
• Amount due to Manager - 63,375
• Accrued management fee 15,568 19,297
• Amount due to Trustee 747 926
• Other payables and accruals 9,084 10,450
25,399 94,048
16. SIGNIFICANT EVENT DURING THE FINANCIAL PERIOD
The worsening of the macro-economic outlook as a result of Covid-19, both
domestically and globally, has impacted in the Fund’s performance during and
after the financial period.
The Manager is monitoring the situation closely and will be managing the portfolio
to achieve the Fund’s objective.

34
STATEMENT BY MANAGER
We, Dato’ Darawati Hussain and Ong Yin Suen, two of the Directors of RHB
Asset Management Sdn Bhd, do hereby state that in the opinion of the Directors of
the Manager, the accompanying unaudited statement of financial position,
unaudited statement of income and expenses, unaudited statement of changes in
net asset value, unaudited statement of cash flows and the accompanying notes, are
drawn up in accordance with Malaysian Financial Reporting Standards and
International Financial Reporting Standards so as to give a true and fair view of the
financial position of the Fund as at 30 June 2020 and of its financial performance
and cash flows for the financial period then ended and comply with the provisions
of the Deeds.
On behalf of the Manager
Dato’ Darawati Hussain Ong Yin Suen
Director Director
25 August 2020

35
TRUSTEE’S REPORT TO THE UNITHOLDERS OF
RHB ASIAN TOTAL RETURN FUND
We have acted as Trustee of RHB Asian Total Return Fund (“the Fund”) for the financial period ended 30 June 2020. To the best of our knowledge, RHB Asset Management Sdn Bhd (“the Management Company”), has operated and managed the Fund in accordance with the following:
(a) limitations imposed on the investment powers of the Management Company
and the Trustee under the Deeds, the Securities Commission’s Guidelines on
Unit Trust Funds, the Capital Markets and Services Act 2007 and other
applicable laws;
(b) valuation/pricing is carried out in accordance with the Deeds and any
regulatory requirements; and
(c) creation and cancellation of units are carried out in accordance with the Deeds
and any regulatory requirements.
For HSBC (Malaysia) Trustee Berhad
Tan Bee Nie
Manager, Investment Compliance Monitoring
Kuala Lumpur
25 August 2020

36
CORPORATE INFORMATION
MANAGER
RHB Asset Management Sdn Bhd
REGISTERED OFFICE
Level 10, Tower One, RHB Centre, Jalan Tun Razak, 50400 Kuala Lumpur
PRINCIPAL AND BUSINESS OFFICE
Level 8, Tower Two & Three, RHB Centre, Jalan Tun Razak, 50400 Kuala Lumpur
Email address: [email protected]
Tel: 03-9205 8000
Fax: 03-9205 8100
Website: www.rhbgroup.com
BOARD OF DIRECTORS Mr Yap Chee Meng (Independent Non-Executive Chairman)
Mr Chin Yoong Kheong (Senior Independent Non-Executive Director)
Dr. Ngo Get Ping (Independent Non-Executive Director)
Ms Ong Yin Suen (Managing Director/ Chief Executive Officer)
YBhg Dato’ Darawati Hussain (Independent Non-Executive Director)
(Appointed with effect from 28 May 2020)
Puan Sharifatu Laila Syed Ali (Independent Non-Executive Director)
(Resigned with effect from 29 May 2020)
INVESTMENT COMMITTEE MEMBERS
Mr Yap Chee Meng (Independent Chairman)
YBhg Dato’ Darawati Hussain
Puan Sharifatu Laila Syed Ali
CHIEF EXECUTIVE OFFICER
Ms Ong Yin Suen
SECRETARY
Encik Azman Shah Md Yaman (LS No. 0006901)

37
BRANCH OFFICE
Kuala Lumpur Office B-9-6, Megan Avenue 1,
No. 189, Jalan Tun Razak,
50400 Kuala Lumpur
Tel: 03-2171 2755/ 03-2166 7011
Fax: 03-2770 0022
Sri Petaling Office Level 1 & 2, No 53 Jalan Radin Tengah
Bandar Baru Seri Petaling
57000 Kuala Lumpur
Tel: 03-9054 2470 Fax: 03-9054 0934
Batu Pahat Office 53, 53-A and 53-B Jalan Sultanah
83000 Batu Pahat, Johor
Tel: 07-438 0271/ 07-438 0988
Fax: 07-438 0277
Ipoh Office No.7A, Persiaran Greentown 9,
Pusat Perdagangan Greentown,
30450 Ipoh, Perak
Tel: 05-242 4311 Fax: 05-242 4312
Johor Bahru Office No 34 Jalan Kebun Teh 1
Pusat Perdagangan Kebun Teh
80250 Johor Bahru, Johor
Tel: 07-221 0129 Fax: 07-221 0291
2nd Floor, 21 & 23,
Jalan Molek 1/30, Taman Molek,
81100 Johor Bahru, Johor
Tel: 07-358 3587 Fax: 07-358 3581
Kuantan Office B 32-34, 2nd Floor, Lorong Tun Ismail 8
Sri Dagangan II
25000 Kuantan, Pahang
Tel: 09-517 3611 Fax: 09-517 3612
Kuching Office Lot 133, Section 20, Sublot 2 & 3,
1st Floor, Jalan Tun Ahmad Zaidi Adruce,
93200 Kuching, Sarawak
Tel: 082-550 838 Fax: 082-550 508

38
Kuching Office Yung Kong Abell, Units 1-10,
2nd Floor Lot 365,
Section 50 Jalan Abell,
93100 Kuching, Sarawak
Tel: 082-245 611 Fax: 082-230 326
Kota Bharu Office Ground Floor, No 3486-G,
Jalan Sultan Ibrahim,
15050 Kota Bharu, Kelantan
Tel: 09-740 6891 Fax: 09-740 6890
Kota Kinabalu Office Lot No. C-02-04, 2nd Floor
Block C, Warisan Square
Jalan Tun Fuad Stephens,
88000 Kota Kinabalu,
Sabah
Tel: 088-528 686/ 088-528 692
Fax: 088-528 685
Melaka Office 581B, Taman Melaka Raya
75000 Melaka
Tel: 06-284 4211/ 06-281 4110
Fax: 06-292 2212
Miri Office Lot 1268 & 1269, Second Floor
Centre Point Commercial Centre
Jalan Melayu
98000 Miri, Sarawak
Tel: 085-422 788 Fax: 085- 415 243
Penang Office 3rd Floor, 44 Lebuh Pantai,
10300 Georgetown, Penang
Tel: 04-264 5639 Fax: 04-264 5640
Prai Office First Floor, No. 1797-1-04,
Kompleks Auto World,
Jalan Perusahaan, Juru Interchange,
13600 Perai, Penang.
Tel: 04-506 2116/ 04-506 0216
Fax: 04-505 9996
39
TRUSTEE HSBC (Malaysia) Trustee Berhad
BANKER RHB Bank Berhad
AUDITORS PricewaterhouseCoopers PLT
TAX ADVISER PricewaterhouseCoopers Taxation Services Sdn Bhd
DISTRIBUTORS RHB Asset Management Sdn Bhd
RHB Bank Berhad
RHB Investment Bank Berhad
AmBank Berhad
Areca Capital Sdn Bhd
CIMB Investment Bank Berhad
Genexus Advisory Sdn Bhd
HSBC Bank (Malaysia) Berhad
iFast Capital Sdn Bhd
OCBC Bank (Malaysia) Berhad
Phillip Mutual Berhad
United Overseas Bank (Malaysia) Berhad
