robeco global total return bond fund
TRANSCRIPT

Unaudited Semi-Annual Report 1 January to 30 June 2021
Société d’Investissement à Capital Variable Incorporated under Luxembourg law RCS B 177 719
Robeco Global Total Return Bond Fund

Contents General information 3
Report of the Board of Directors 5 General 5 Report of investment manager 5 Investment results 6 Performance analysis 6 Sustainable investing 7
Other data 9
Financial statements 13 Statement of net assets 13 Statement of operations and changes in nets assets 14 Statistical Information 15
Notes to the financial statements as at 30 June 2021 16
Schedule of Investments 26
Robeco Global Total Return Bond Fund 2

General information Robeco Global Total Return Bond Fund
(hereafter the ‘Company’ or ‘Fund’) Undertaking for collective investment incorporated as a ‘Société d’Investissement à Capital Variable’ (SICAV) under Luxembourg law..
Register of Companies RCS Luxembourg B 177 719
Registered Office 6, route de Trèves L-2633 SenningerbergGrand Duchy of Luxembourg
Board of Directors Mr. J.H. van den Akker (Director/Chairman) Mr. H.J. Ris (Director) Mr. C.M.A. Hertz (Director, since 8 January 2021) Mr. M.O. Nijkamp (Director, since 27 May 2021) Mrs. S. van Dootingh (Director, until 1 May 2021) Mr. H.P. de Knijff (Director/Chairman, until 1 January 2021)
Mr. H.P. de Knijff was an employee of Robeco Nederland B.V. (Affiliated Entity) Mr. J.H. van den Akker, Mr. H.J. Ris and Mr. M.O. Nijkamp are employees of Robeco Nederland B.V. (Affiliated Entity) Mrs. S. van Dootingh and Mr. C.M.A. Hertz are independent directors.
Management Company Robeco Institutional Asset Management B.V. Weena 850 3014 DA Rotterdam The Netherlands (since 1 January 2021)
Robeco Luxembourg S.A. 5, rue Heienhaff L-1736 SenningerbergGrand Duchy of Luxembourg(until 1 January 2021)
Cabinet de révision agréé (Independent auditor) KPMG Luxembourg, Société coopérative 39, Avenue John F. Kennedy L-1855 LuxembourgGrand Duchy of Luxembourg
Depositary, Domiciliary and Paying Agent J.P. Morgan Bank Luxembourg S.A. 6, route de Trèves L-2633 SenningerbergGrand Duchy of Luxembourg
Administration Agent and Registrar J.P. Morgan Bank Luxembourg S.A. 6, route de Trèves L-2633 SenningerbergGrand Duchy of Luxembourg
Robeco Global Total Return Bond Fund 3

General information (continued) Investment Adviser Robeco Institutional Asset Management B.V. Weena 850 3014 DA Rotterdam The Netherlands
Subscriptions and publications No subscription can be accepted on the basis of financial reports such as this report. Subscriptions may only be accepted on the basis of the current prospectus, supplemented by the Company’s latest annual report, and in the event that the Company’s annual report has been published more than eight months previously, its latest semi-annual report. Financial reports, the prospectus and the Key Investor Information Document are available through the website www.robeco.com and may be obtained free of charge at the Company’s registered office.
Representative and paying agent in Switzerland ACOLIN Fund Services AG, Leutschenbachstrasse 50, CH-8050 Zürich, is the fund’s representative in Switzerland. Copies of the Key Investor Information Document and prospectus, articles of incorporation, (semi) annual reports and a list of all purchases and sales in the investment portfolio during the reporting period are available from the above address free of charge. UBS Switzerland A.G., Bahnhofstrasse 45, CH-8001 Zurich (Postal address Badenerstrasse 574, Postfach, CH-8098 Zürich) is the Company’s paying agent in Switzerland.
Information service in Germany Copies of the articles of incorporation, Key Investor Information Document and prospectus and the annual and semi-annual reports may be obtained free of charge from the offices of the information service in Germany: Robeco Deutschland, Taunusanlage 17, D-60325 Frankfurt am Main. The prices at which shares are issued and repurchased are published on www.robeco.de . A list of all purchases and sales in the Company’s investment portfolio during the reporting period is available at the paying agent/information service in Germany free of charge
Robeco Where reference is made to ‘Robeco’, it should be read Robeco Institutional Asset Management B.V. including the activities of the other entities which are in the scope of Robeco’s management.
Robeco Global Total Return Bond Fund 4

Report of the Board of Directors General
Website An information update on the subfund’s investment policies, returns and investment portfolio can be found on www.robeco.com/riam.
Market Impact Covid-19 Robeco considers the ongoing Covid-19 pandemic as a significant event which may impact the investment funds under management. The impact of the pandemic on people, companies and the economy at large has been significant. While the link between Covid-19 cases and hospitalisation has significantly weakened thanks to vaccinations, the outlook remains uncertain. Pending herd immunity as a result of a substantial vaccination rate, the global economy will, however, still be impacted by opening and closing of (business) operations. Furthermore, a slowdown in the trajectory towards herd immunity as a result of risks relating to vaccine logistics, vaccine side effects, reduced effectiveness, or public resistance to (mandatory) vaccination, may have a negative impact on markets.
Operational measures for business continuity by Robeco In response to the ongoing Covid-19 crisis, Robeco is constantly monitoring the latest developments and has taken all measures necessary to manage the situation and to ensure business continuity, while ensuring the health and safety of our clients, our employees and our suppliers. Our operational measures and capabilities are such that Robeco remains fully functional in managing client portfolios and serving clients. Our systems and platforms are designed to enable our staff, most of whom have worked from home throughout the crisis based on their local health and safety measures, to operate as normal. Our approach is one of vigilance and flexibility, allowing us to implement new or revised measures smoothly and as necessary.
New share classes
Share class Effective date M2H EUR 26/01/2021
Report of the investment manager
Important financial and economical events The first half of the year 2021 saw a firming global economic recovery from the Covid-19 pandemic induced recession. Key to this recovery has been the swift availability of effective vaccines, allowing for an easing of the policy trilemma between kickstarting the economy, solving the health crisis and preserving personal freedom. At the end of June around 25% of the global population had at least one dose of a Covid-19 vaccine. However, there is a strong dispersion in vaccination rates across the globe which also creates divergent economic recovery paths. In the developed economies vaccination rates are between 50%-60% at the time of writing whereas in emerging economies vaccination rates have lagged developed economies in the first half year. The recovery in the manufacturing sector began in 2020, reflected by the leading ISM manufacturing producer confidence indicators in the US reaching the highest level since December 1983. Given prevailing lockdown restrictions during the second and third wave of Covid-19 cases, services activity lagged manufacturing activity in developed economies but made a strong comeback from April onwards as lockdown intensities eased and social mobility increased.
With the IMF forecasting an expansion of the global economy by 6.0% in 2021 and 4.4% in 2022, the global economy is expected to remain firmly in expansion mode. However, output in the manufacturing and services sectors continues to be challenged by persisting supply shortages, though logistical bottlenecks and shipping fees have been moderating in the second quarter of 2021. In reflection of base rate effects and rising input costs, US headline consumer price index in May rose to the highest level observed since May 1991.
The powerful policy response to this crisis has clearly spurred the recovery in consumer demand. The interaction between central banks acting as fiscal financiers is creating positive multiplier effects, as a low interest rate environment alleviates the need to raise taxes while enabling fiscal expansion without endangering debt sustainability. However, further down the road, if inflation does show to be more persistent than currently expected by central banks, the alignment of interests between central banks and governments could be challenged.
Robeco Global Total Return Bond Fund 5

Report of the Board of Directors (continued) Investment results
Investment results
Notes
Investment result
reporting period in %
Benchmark return
reporting period in
%
Investment result 3
years average or
since inception
Benchmark return 3
years average or
since inception
Index
Share classes
CH EUR shares 1 -2.0 -1.9 2.9 2.5 Bloomberg Barclays Global-Aggregate Index(hedged into EUR)
DH EUR shares -2.2 -1.9 2.5 2.5 Bloomberg Barclays Global-Aggregate Index(hedged into EUR)
EH EUR shares 1 -2.2 -1.9 2.5 2.5 Bloomberg Barclays Global-Aggregate Index(hedged into EUR)
FH EUR shares -2.0 -1.9 2.9 2.5 Bloomberg Barclays Global-Aggregate Index(hedged into EUR)
IEH EUR shares 1 -2.0 -1.9 3.0 2.5 Bloomberg Barclays Global-Aggregate Index(hedged into EUR)
IH EUR shares -2.0 -1.9 2.9 2.5 Bloomberg Barclays Global-Aggregate Index(hedged into EUR)
M2H EUR shares 2 -2.1 -1.5 -2.1 -1.5 Bloomberg Barclays Global-Aggregate Index(hedged into EUR)
DH CHF shares -2.4 -2.1 2.2 2.1 Bloomberg Barclays Global-Aggregate Index(hedged into CHF)
IH CHF shares -2.1 -2.1 2.6 2.1 Bloomberg Barclays Global-Aggregate Index(hedged into CHF)
DH USD shares -1.8 -1.5 4.6 4.6 Bloomberg Barclays Global-Aggregate Index(hedged into USD)
IH USD shares -1.6 -1.5 5.0 4.6 Bloomberg Barclays Global-Aggregate Index(hedged into USD)
1 Assuming reinvestment of the distributed dividend. 2 Investment result reporting period over the period 26 January 2021 until 30 June 2021.
Performance analysis
Over the first six months the fund gross return was -1.8%, outperforming the index, the Bloomberg Barclays Global Aggregate, which returned -1.9% (euro hedged). Reduced duration, and issuer selection in global credits added to relative performance.
Government bonds The fund maintained a short duration position during the most of the reporting period. The fund entered the year with a modest underweight position in duration, but increased the underweight considerably during the months in February, March and April and while reducing the underweight slightly in May. The fund ended the first half year of 2021 being underweight duration in the United States, United Kingdom, Japan, Europe while being long duration in China.
Credits The fund’s investments in corporate credits yielded positive excess returns due to issuer selection. The overall stance on corporate credit is conservative given historical tight spreads given fundamentals and risk of central banks retreating from their stimulative policy mix given re-opening of the global economy. As per end-of-half year, the fund is underweight credit risk. The fund still has investment grade credit and high yield bond investments but hedged with High Yield and EMD index CDS products.
Emerging markets debt The fund retained its cautious stance on EM debt over the first six months given weak fundamentals and the outsized economic shock due to COVID-19. The fund maintained its underweight in EM corporate credits in combination with changing underweight FX positions in selected countries like South Africa, Brazil, and Indonesia. The overall EM positions added negatively to the relative performance.
Foreign exchange We remain bearish on ZAR on longer term economic fundamentals. Overall, FX subtracted marginally to the excess returns as the fund ran selective and changing underweights in EM FX like BRL, ZAR, and IDR versus long DM positions like CAD, USD and EUR. As per end-of-half year, the fund is short ZAR versus long USD and a long in MXN to balance the EM FX risk.
Robeco Global Total Return Bond Fund 6
Report of the Board of Directors (continued) Performance analysis (continued)
Asset allocation The fund manager views the broad credit market including Investment Grade, High Yield and EMD bond as expensive and vulnerable given the risk of global central banks tapering their monetary policy stance risking a bond tantrum. Given historical tight valuations, weak fundamentals for High Yield and EMD the fund has an underweight credit beta versus the index. As spreads tightened a bit in the first half of the year, asset allocation contributed negatively to the relative performance.
Sustainable investing
All Robeco’s investment activities comply with the Principles for Responsible Investing (PRI). Responsibility for implementing Sustainable investing lies with Robeco’s CIO Fixed Income and Sustainability, who has a seat on Robeco's Executive Committee.
Fulfilling our responsibilities in the field of stewardship forms an integral part of Robeco's approach to Sustainable investing. We publish our own stewardship policy on our website. This policy describes how we deal with possible conflicts of interest, how we monitor the companies in which we invest, how we conduct activities in the field of engagement and voting, and how we report on our stewardship activities.
Robeco has research available from leading sustainability experts, including own proprietary research from the sustainable investing research team. This dedicated Sustainable Investing research team works together very closely with the investment teams to provide them with in-depth sustainability information. The investment analysis focuses on the most material ESG factors (Environment, Social and Governance) and the connection with the financial performance of a company. We can then focus on the most relevant information in performing our investment-analysis and can reach enhanced investment decisions.
To help customers contribute to the objectives, Robeco worked on analyzing the contribution to Sustainable Development Goals (SDG) of companies and developing SDG investment solutions. Furthermore, Robeco contributes to the SDG by integrating ESG factors in its decision-making process for investments and encourages companies to act in support of these goals by means of a constructive dialogue.
Robeco’s climate change policy is focused on integrating climate issues in investments when financially material and engaging with companies. Furthermore Climate risks for our funds are being assessed and monitored by Robeco’s financial risk management department.
Robeco pursues an exclusion policy for companies that are involved in the production of or trade in controversial weapons such as cluster munition and anti-personnel mines, for tobacco companies and for companies that seriously and habitually violate either the United Nations Global Compact (UNGC) or OECD Guidelines for Multinational Enterprises. Robeco applies strict criteria for this last category and if a dialogue fails the company can be excluded. Robeco publishes its exclusion policy and the list of exclusions on its website.
Constructive and effective activities under active ownership encourage companies to improve their management of risks and opportunities in the field of ESG. This in turn establishes a better competitive position and improved profitability and moreover has a positive impact on the community. Active ownership involves voting and engagement. Robeco exercises its voting rights for the shares in its investment funds all over the world. The primary focus of this engagement is to address strategic ESG issues that might affect value creation in the long term.
Integrating ESG factors into the investment processes We are convinced that integrating ESG factors into the investment process leads to better informed investment decisions. The backbone of our Global Total Return Bond Fund investment process is consistent and in-depth fundamental research on both companies and countries. The ESG research focuses on the medium term and is tailored to support our investment process. This makes it a useful addition to the research process, but also an addition which requires a disciplined approach. If not structured well, the information is not very accessible and easily pushed aside in the day-to-day dynamics of managing a bond portfolio. Over the past years our structured process has proven its value in a better understanding of the companies and countries we invest in. We are convinced that this has led and will lead to better investment decisions.
Government Bonds: Sustainability has become a main building block of our sovereign country allocation framework, together with economic cycle and debt sustainability. The power of country sustainability analyses lies in its capability of identifying potential issues for countries in an early stage. Our Country Sustainability Ranking creates a systematic framework which is easily assessable and provides valuable input for our investment decisions.
Robeco Global Total Return Bond Fund 7

Report of the Board of Directors (continued) Sustainable investing (continued)
Integrating ESG factors into the investment processes (continued) Credits: One of the cornerstones of the investment philosophy for credits is that avoiding losers is more important than picking every winner. We believe that integrating sustainability factors into our credit analysis strengthens our ability to assess the downside risk of our credit investments. Our sustainability analysis is used to focus on the downside risks of credit investments. Guiding principle for the conclusion on sustainability is that there must be tangible evidence and also a material impact.
Luxembourg, 31 August 2021
The Board of Directors
Past performance is no indication of current or future performance. These performance data do not take account of the commissions and costs incurred on the issue and redemption of shares.
Robeco Global Total Return Bond Fund 8

Other data Savings directive information
Robeco Global Total Return Bond Fund is subject to the EU savings directive.
Stock-exchange listing
Robeco Global Total Return Bond Fund class DH shares are listed on Euronext Amsterdam, Euronext Fund Service and/or Luxembourg Stock Exchange. In addition, the fund has a stock exchange quotation in Berlin, Düsseldorf, Frankfurt, Hamburg, Munich, Vienna and Zürich.
Auditors
No external audit has been conducted.
Remuneration policy and remuneration paid
The fund itself does not employ any personnel and is managed by Robeco Institutional Asset Management B.V. (‘RIAM’). The remuneration for persons working for RIAM comes out of the management fee.
Remuneration policy RIAM’s remuneration policy, which applies to all staff working under its responsibility, complies with the applicable requirements laid down in the European framework documents of the UCITS Directive and the ESMA guidelines for a responsible remuneration policy under the UCITS Directive.
The remuneration policy of RIAM can be obtained free of charge at the offices of the Company.
This remuneration policy applies to all staff of RIAM, including individuals who may have a material impact on the risk profile of the fund. These persons are designated to be 'Identified Staff'.
Responsibility for and application of the policy RIAM’s Remuneration Policy is determined, applied and annually reviewed by and on behalf of RIAM with the approval of its shareholder, the (Board of) Robeco Holding B.V. For each review (the Board of) Robeco Holding B.V. shall obtain prior advice from the Supervisory Board of RIAM, which acts as its Supervisory Board. In the application and evaluation of the remuneration policy, RIAM occasionally makes use of the services of various external advisers.
Robeco Global Total Return Bond Fund 9

Other data (continued) Additional information Securities Financing Transaction
Securities Financing Transactions The fund engages in Securities Financing Transactions (as defined in Article 3 of Regulation (EU) 2015/2365, securities financing transactions (SFTs) include repurchase transactions, securities or commodities lending and securities or commodities borrowing, buy-sell back transactions or sell-buy back transactions and margin lending transactions) and/or Total Return Swaps. In accordance with Article 13 of the Regulation, the funds involvement in and exposures related to SFTs and Total Return Swaps for the reporting date are detailed below. Global Data Amount of securities on loan The total value of securities on loan as a proportion of the Sub-Fund total lendable assets as at the reporting date is detailed below. Total lendable assets represent the aggregate value of asset types forming part of the Sub-Funds’ securities lending programme.
Sub-Fund % of Total Lendable
Assets Robeco Global Total Return Bond Fund 29.12%
Amount of assets engaged in each type of SFTs and Total Return Swaps The following table represents the fair value of assets engaged in each type of SFTs (including Total Return Swaps) in the fund currency. Amount of assets % of AUM Robeco Global Total Return Bond Fund EUR Securities lending 144,293,531 22.13%
Concentration Data Ten largest collateral issuers The following table lists the ten largest issuers by value of non-cash collateral received by the Sub-Fund by way of title transfer collateral arrangement across securities lending transactions, reverse repurchase agreements and Over The Counter (OTC) derivatives transactions (including Total Return Swaps), as at the reporting date. Issuer Collateral Value Robeco Global Total Return Bond Fund EUR French Government 67,866,073 German Government 47,183,589 Belgian Government 6,688,175 Dutch Government 5,728,342 Austrian Government 4,902,464 UK Government 2,771,459 Finnish Government 2,112,441 US Government 895,880
Robeco Global Total Return Bond Fund 10

Other data (continued) Additional information Securities Financing Transaction (continued)
Top ten counterparties The following table provides details of the top ten counterparties (based on gross volume of outstanding transactions), in respect of SFTs and Total Return Swaps, as at the reporting date. Counterparty Outstanding Transactions Robeco Global Total Return Bond Fund EUR Securities lending BNP Paribas 83,915,755 J.P. Morgan 18,570,959 Citi 17,101,250 Nomura 11,233,867 Barclays 7,179,188 Merrill Lynch 2,617,257 Goldman Sachs 1,451,178 Deutsche Bank 1,168,165 Wells Fargo 813,757 Morgan Stanley 242,155
Country in which counterparties are established The following table provides details of the country of incorporation of counterparties across all SFTs and Total Return Swaps, as at the reporting date. Counterparty Country of Incorporation Barclays United Kingdom BNP Paribas France Citi United States of America Deutsche Bank Germany Goldman Sachs United States of America J.P. Morgan United States of America Merrill Lynch United States of America Morgan Stanley United States of America Nomura Japan Wells Fargo United States of America
Aggregate transaction data Type and quality of collateral The following table provides an analysis of the type and quality of non-cash collateral received by the Sub-Fund in respect of SFTs and OTC derivative transactions (including Total Return Swaps), as at the reporting date. Type of collateral received Robeco Global Total Return Bond Fund EUR Securities lending Bonds Investment Grade 138,148,423 138,148,423
Robeco Global Total Return Bond Fund 11

Other data (continued) Additional information Securities Financing Transaction (continued)
Maturity tenor of collateral
The following table provides an analysis of the maturity tenor of collateral received in relation to SFTs and OTC derivative transactions (including Total Return Swaps) as at the reporting date.
Maturity Less than 1
day 1 to 7 days 1 to 4 weeks 1 to 3
months 3 to 12
months More than
1 year Open
maturity Total Robeco Global Total Return Bond Fund EUR EUR EUR EUR EUR EUR EUR EUR Securities lending – 3,343 2,192,580 5,585,057 28,265,452 102,101,991 9,591,522 147,739,945
Currency of collateral
The following table provides an analysis of the currency profile of collateral received in relation to SFTs and OTC derivative transactions (including Total Return Swaps) as at the reporting date in the currency of the Sub-Funds.
Received in Currency Value in Sub-Fund currency Robeco Global Total Return Bond Fund EUR
Securities lending EUR 140,517,988 USD 7,221,957
147,739,945
Maturity tenor of securities lending transactions All securities on loan can be recalled at any point. The Fund's securities lending transactions have open maturity.
Settlement and clearing The Company’s securities lending transactions, including related collateral, are settled and cleared on a tri-party basis.
Re-use of collateral
Non cash collateral, received in a securities lending transaction may not be sold, re-invested or pledged. Cash collateral received from such transactions is re-used in a reverse repurchase transaction.
Safekeeping of collateral
Collateral received J.P. Morgan Bank Luxembourg S.A., as securities lending agent of the Fund, is responsible for the safekeeping of the collateral received in respect of securities lending transactions as at the reporting date. The Custodian J.P. Morgan Bank Luxembourg S.A. is ultimately liable for any loss of instruments held in custody or by a third party to whom custody had been delegated (the sub-custody).
Collateral granted No collateral is granted by the Company as part of their securities lending activities.
Return and cost The total income earned from securities lending transactions is split between the fund and the securities lending agent. Details of this split are disclosed in notes to the financial statements on page 22. Income earned during the year by the Fund from securities lending transactions is disclosed in the statement of operations and changes in net assets on page 14.
Robeco Global Total Return Bond Fund 12

The accompanying notes form an integral part of these financial statements.
Robeco Global Total Return Bond Fund Statement of Net Assets
As at 30 June 2021 ,
Robeco Global Total Return Bond Fund
EUR Assets Investments in securities at cost 644,918,377 Unrealised gain/(loss) 4,247,049 Investments in securities at market value 649,165,426 Cash at bank and at brokers 30,952,008 Receivables on subscriptions 113,670 Receivables on investments sold 6,083,391 Interest receivable 2,659,576 Tax reclaims receivable 59,199 Unrealised gain on financial futures contracts 1,829,074 Unrealised gain on forward currency exchange contracts 10,201,715 Swap contracts at fair value 950,711 Other assets 809 Total assets 702,015,579
Liabilities Due to brokers 479,259 Payables on redemptions 816,736 Payables on investments purchased 30,337,866 Interest payable 62,974 Management fees payable 278,453 Unrealised loss on financial futures contracts 1,492,108 Unrealised loss on forward currency exchange contracts 12,668,467 Swap contracts at fair value 3,604,556 Other liabilities 196,914 Total liabilities 49,937,333 Total net assets 652,078,246
Robeco Global Total Return Bond Fund 13
The accompanying notes form an integral part of these financial statements.
Robeco Global Total Return Bond Fund Statement of Operations and Changes in Net Assets
For the period ended 30 June 2021
Robeco Global Total Return Bond Fund
EUR
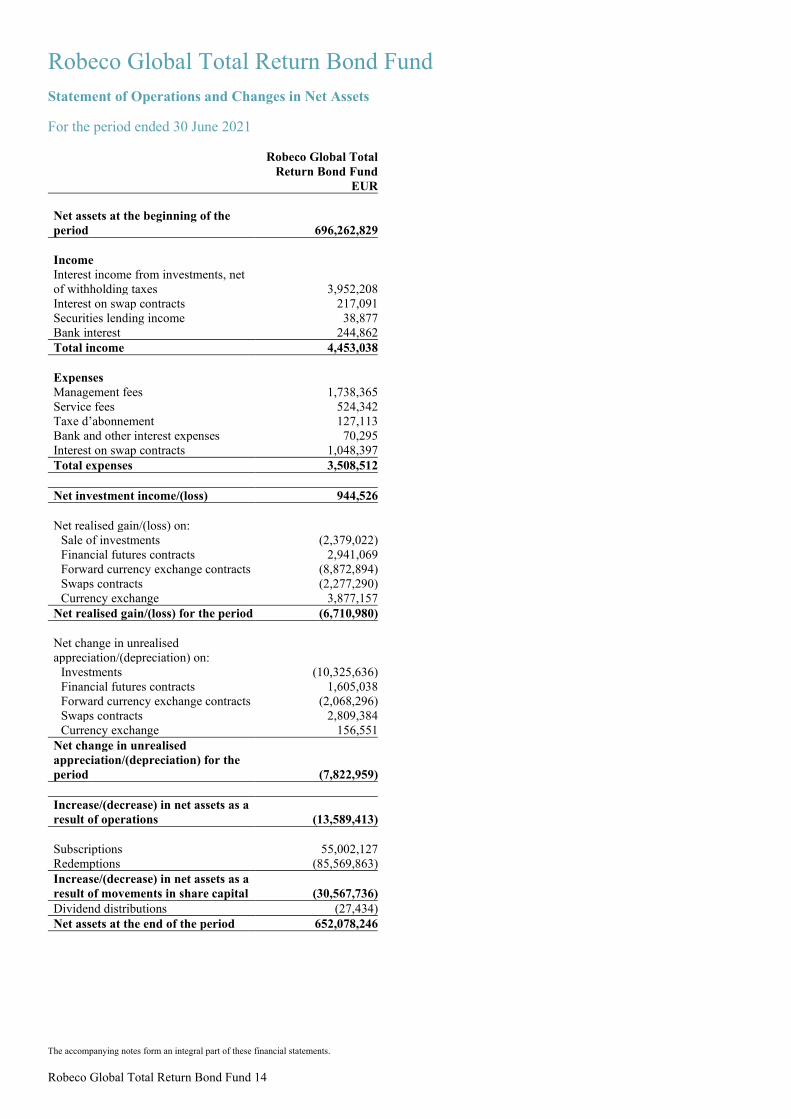
Net assets at the beginning of the period 696,262,829
Income Interest income from investments, net of withholding taxes 3,952,208 Interest on swap contracts 217,091 Securities lending income 38,877 Bank interest 244,862 Total income 4,453,038
Expenses Management fees 1,738,365 Service fees 524,342 Taxe d’abonnement 127,113 Bank and other interest expenses 70,295 Interest on swap contracts 1,048,397 Total expenses 3,508,512
Net investment income/(loss) 944,526
Net realised gain/(loss) on: Sale of investments (2,379,022) Financial futures contracts 2,941,069 Forward currency exchange contracts (8,872,894) Swaps contracts (2,277,290) Currency exchange 3,877,157
Net realised gain/(loss) for the period (6,710,980)
Net change in unrealised appreciation/(depreciation) on:
Investments (10,325,636) Financial futures contracts 1,605,038 Forward currency exchange contracts (2,068,296) Swaps contracts 2,809,384 Currency exchange 156,551
Net change in unrealised appreciation/(depreciation) for the period (7,822,959)
Increase/(decrease) in net assets as a result of operations (13,589,413)
Subscriptions 55,002,127 Redemptions (85,569,863) Increase/(decrease) in net assets as a result of movements in share capital (30,567,736) Dividend distributions (27,434) Net assets at the end of the period 652,078,246
Robeco Global Total Return Bond Fund 14

The accompanying notes form an integral part of these financial statements.
Robeco Global Total Return Bond Fund Statistical Information (in share class currency):
Shares outstanding as at
30 June 2021
NAV per share as at
30 June 2021
NAV per share as at
31 December 2020
NAV per share as at
31 December 2019 Robeco Global Total Return Bond Fund CH EUR 20,771 92.92 95.02 89.23 DH CHF1 11,270 105.46 107.87 101.38 DH EUR 5,034,365 60.67 61.97 58.11 DH USD2 55,213 119.13 121.19 112.21 EH EUR 18,565 98.21 100.79 95.03 FH EUR 2,724,374 116.19 118.46 110.70 IEH EUR 11,983 105.84 108.84 102.59 IH CHF1 67,285 110.10 112.35 105.14 IH EUR 79,466 116.90 119.18 111.28 IH USD2 20,592 130.94 132.89 122.66 M2H EUR 1,000 97.95 – –
Total net assets in EUR 652,078,246 696,262,829 709,785,709
– – –
1This class of shares is denominated in Swiss Francs (CHF). The reference currency of the sub-fund is the Euro (EUR). 2This class of shares is denominated in US Dollars (USD). The reference currency of the sub-fund is the Euro (EUR).
Robeco Global Total Return Bond Fund 15

Notes to the financial statements as at 30 June 2021 1. General
Robeco Global Total Return Bond Fund (‘the Company’) was initially incorporated under the laws of the Netherlands Antilles by notarial deed executed on 26 April 1974 under the form of a public limited liability company. Its registered office was transferred to Luxembourg and it was converted into a société anonyme (S.A.), organised as a ‘société d'investissement à capital variable’ (SICAV) on 4 June 2013. Its Articles of Incorporation were published in the ‘Mémorial, Recueil des Sociétés et Associations’, of the Grand Duchy of Luxembourg (the ’Mémorial’) on 12 June 2013. Robeco Global Total Return Bond Fund is a ‘Société d’Investissement à Capital Variable’ (Investment Company with variable capital) pursuant to the law of 10 August 1915, as amended, on commercial companies and to part I of the law of 17 December 2010 on undertakings for collective investment of the Grand Duchy of Luxembourg.
The Board of Directors has the authority to issue different classes of shares in the Company. Details on the characteristics of such share classes offered by the Company will be determined by the Board of Directors. The Board of Directors of the Company may decide upon the issue of class A, AH, D, D2, DH, D2H, M, M2, MH, M2H, F, FH, I, IH, IMH, Z and ZH shares (accumulating classes) and Class A1, A1H, B, BH, Bx, BxH, C, CH, D3, D3H, E, EH, G, GH, IBxH, IExH, IE, IEH, M3, M3H, MBxH, ZB and ZBH shares (distributing classes). The reference currency of the classes of shares may be the Euro (EUR), the US Dollar (USD), the British Pound (GBP), the Swiss Franc (CHF), the Japanese Yen (JPY), the Canadian Dollar (CAD), the Mexican Peso (MXN), the Hong Kong Dollar (HKD), the Singapore Dollar (SGD), the Swedish Crown (SEK), the Norwegian Crown (NOK), the Chinese Renminbi (RMB), the Danish crown (DKK), the Brazilian Real (BRL), South African Rand (ZAR) or the Australian dollar (AUD).
Dividend policy The general policy regarding the appropriation of net income and capital gains is as follows: Class DH, FH, IH and ZH shares Income is reinvested and added to the relevant class and contributes to a further increase in value of the total net assets. Class CH shares After the end of the reporting period, the Company can recommend what distribution shall be made from the net investment income and net capital gains attributable to the Class CH shares. The Annual General Meeting of Shareholders will determine the dividend payment. Class EH, GH and IEH shares The shareholders are entitled to an annual distribution of the net proceeds, which compounds to all revenues of the share class minus fees and costs of the share class. The Board of Directors of the Company may decide to distribute interim dividends, in accordance with Luxembourg law. General remarks As provided by the 2010 law, the Company may decide to distribute dividends with no other limit than the obligation that any such dividend distribution does not reduce the net asset value of the Company below the legal minimum amount. Similarly, the Company may distribute interim dividends and may decide to pay dividends in shares. If dividends are distributed, payments of cash dividends to registered shareholders will be made in the currency of the relevant share class to such shareholders at the addresses they have given to the Registrar Agent. Dividend announcements (including names of paying agents) and all other financial notices concerning Robeco Global Total Return Bond Fund shall be published on www.robeco.com/riam and published in those newspapers as the Board of Directors shall determine from time to time. Dividends not collected within five years will lapse and accrue for the benefit of the Company in accordance with Luxembourg law. Open-ended Fund Robeco Global Total Return Bond Fund is an open-ended investment Company, meaning that, barring exceptional circumstances, Robeco Global Total Return Bond Fund issues and purchases its shares on a daily basis at prices at net asset value per share. The Company reserves the right to refuse any subscription request at any time. Swing pricing Shares are issued and redeemed on the basis of the net asset value per share. However, the actual costs of purchasing or selling assets and investments for a sub-fund may deviate from the latest available prices, as appropriate, in calculating the net asset value per share. This deviation can be caused by duties and charges and spread from buying and selling prices of the underlying investments (‘spreads’). These costs have an adverse effect on the value of a sub-fund and its underlying share classes and are known as dilution. To mitigate the effects of dilution, the Directors may, at their discretion, make a dilution adjustment to the net asset value per share. The Directors will retain the discretion in relation to the circumstances under which to make such a dilution adjustment. At the end of the reporting period, no swing adjustments were made.
Robeco Global Total Return Bond Fund 16

Notes to the financial statements as at 30 June 2021 (continued) 1. General (continued)
Swing pricing (continued)The dilution adjustment will involve adding to, when the Sub-fund is in a net subscription position, and deducting from, when the Sub-fund is in a net redemption position, the Net Asset Value per Share such figure as the Company considers representing an appropriate figure to meet the Cash Flow Costs. The resultant amount will be the Price rounded to such number of decimal places as the Company deems appropriate. The dilution adjustments may vary depending on the order type (net subscription or net redemption), on the underlying asset classes for any Sub-fund or on the market conditions. The dilution adjustments as well as the dealing levels from which they become applicable may be amended from time to time depending on market conditions or any other situation where the Company is of the opinion that the interests of the Shareholders require such amendment(s).
Additional details on the anti-dilution/swing pricing adjustments and actual swing factors can be found on www.robeco.com/riam.
For the avoidance of doubt, Shareholders placed in the same situation will be treated in an identical manner.
Where a dilution adjustment is made, it will increase the Price where the Sub-fund is in a net subscription position and decrease the Price where the Sub-fund is in a net redemption position. The Price of each Class in the Sub-fund will be calculated separately but any dilution adjustment will in percentage terms affect the Price of each Class in an identical manner. The dilution adjustment is made on the capital activity at the level of the Sub-fund and does not address the specific circumstances of each individual investor transaction.
Pooling and co-management For the purpose of efficient management and to reduce administrative costs and if the investment policies of the sub-fund allow such, the Board of Directors may decide to co-manage some or all of the assets of certain sub-fund with assets of other Luxembourg UCIs of the Robeco Group (co-managed units). In this case, the assets from different co-managed units will be jointly managed using the technique of pooling. Assets that are co-managed will be referred to using the term ‘pool’. Such pools will only be used for the purposes of internal management. They will not constitute distinct legal entities and will not be directly accessible to investors. Each co-managed unit will have its own assets allocated to it. During the reporting period no pooling or co-management took place.
Affiliated parties Robeco is affiliated with ORIX Corporation Europe N.V. ORIX Corporation Europe N.V. is part of ORIX Corporation. The management structure of ORIX Corporation Europe N.V. is such that ORIX Corporation does not have any say in or influence on the Company’s business policy. ORIX Corporation Europe N.V. pursues an independent investment policy on behalf of its affiliated investment companies, taking into account the interest of the investors involved. Besides services of other market parties, the Company may also utilize the services of one or more of these affiliated entities including transactions relating to securities, treasury, derivatives, securities lending, and subscriptions and redemptions of its own shares, as well as management activities. Transactions are executed at market rates.
As per 1 January 2021, the affiliated entities Robeco Luxembourg S.A. and Robeco Institutional Asset Management B.V. merged. Subsequently, Robeco Luxembourg S.A. ceased to exist. The Board of Directors of the Company have appointed Robeco Luxembourg S.A. (until 1 January 2021) and Robeco Institutional Asset Management B.V. (since 1 January 2021) as the Management Company to be responsible on a day-to-day basis for providing administration, marketing and investment management services in respect of the fund. The Management Company has delegated the administration functions and registrar agent functions to J.P. Morgan Bank Luxembourg S.A. The different sub-funds and share-classes will incur an annual management fee which reflects all expenses related to the management of the Company which is payable to the Management Company. The Directors of the Company are also Director of Robeco Capital Growth Funds, Robeco QI Global Dynamic Duration, Robeco All Strategies Funds and Robeco (LU) Funds III.
Financial instruments Risks Transactions in financial instruments may lead the sub-fund to be subject to the risks described below or to the sub-fund transferring these risks to another party.
General investment risk The value of the investments may fluctuate. Past performance is no guarantee of future results. The net asset value of the sub-fund is affected by developments in the financial markets and may both rise and fall. Shareholders run the risk that their investments may end up being worth less than the amount invested or even worth nothing. Bonds or other debt securities involve credit risk to the issuer which may be evidenced by the issuer's credit rating. Securities which are subordinated and/or have a lower credit rating are generally considered to have a higher credit risk and a greater possibility of default than more highly rated securities. In the event that any issuer of bonds or other debt securities experiences financial or economic difficulties, this may affect the value of the relevant securities and any amounts paid on such securities. This may in turn affect the NAV per share. General investment risk can be broken down into market risk, concentration risk and currency risk:
Robeco Global Total Return Bond Fund 17

Notes to the financial statements as at 30 June 2021 (continued) 1. General (continued)
Financial instruments (continued) Risks (continued) Market risk The net asset value of the sub-fund is sensitive to market movements. In addition, investors should be aware of the possibility that the value of investments may vary as a result of changes in political, economic or market circumstances. No assurance can, therefore, be given that the sub-fund’s investment objective will be achieved. It cannot be guaranteed either that the value of a share in a sub-fund will not fall below its value at the time of acquisition. Concentration risk Based on its investment policy, the sub-fund may invest in financial instruments from issuing institutions that (mainly) operate within the same sector or region, or in the same market. If this is the case, the concentration of the investment portfolio of the sub-fund may cause events that have an effect on these issuing institutions to have a greater effect on the sub-fund’s assets than would occur with a less concentrated investment portfolio. Currency risk All or part of the Company’s investments may be invested in currencies other than the euro. As a result, fluctuations in exchange rates may have both a negative and a positive effect on the investment result of the Company. The Company limits the general investment risk by investing in bonds and other marketable debt securities and instruments (which may include certificates of deposit, money-market instruments and commercial papers) of issuers from any member state of the OECD or supranational issuers guaranteed by one or more member states of the OECD and with a minimum rating of ’A’ in the Standard & Poor’s or other recognized credit rating agencies lists. Counterparty risk A counterparty of a sub-fund may fail to fulfil its obligations towards that sub-fund. In case of hedging transactions in classes of shares, the relevant sub-fund carries the counterparty risk. This risk is limited as much as possible by only entering into transactions with counterparties which it believes to be creditworthy, and may reduce the exposure incurred in connection with such transactions through the receipt of letters of credit or collateral from certain counterparties in accordance with the Luxembourg laws and regulations. Risk of lending financial instruments In the case of financial instrument lending transactions, the Company and its respective sub-funds concerned run the risk that the borrower cannot comply with its obligation to return the financial instruments on the agreed date or furnish the requested collateral. The lending policy of the Company is designed to control these risks as much as possible. All counterparties used in the securities lending process are pre-approved by Robeco. The approval process takes into account the entities credit rating (if available) and whether the counterparty is subject to prudential regulation. Any relevant incidents involving the entity are also taken into account. The fund accepts collateral by selected issuers in the form of: – bonds issued (or guaranteed) by governments of OECD member states; – local government bonds with tax raising authority; – corporate bonds that are FED or ECB eligible collateral; – bonds of supranational institutions and undertakings with an EU, regional or world-wide scope; – stocks listed on the main indexes of stock markets as disclosed in the prospectus; – cash. As of balance-sheet date, the fund had received collateral ensuing from securities-lending transactions. More information can be found on page 22. Liquidity risk The actual buying and selling prices of financial instruments in which the sub-fund invest partly depend upon the liquidity of the financial instruments in question. It is possible that a position taken on behalf of a sub-fund cannot be quickly liquidated in a good time at a reasonable price due to a lack of liquidity in the market in terms of supply and demand. The sub-fund minimize this risk by mainly investing in financial instruments that are tradable on a daily basis. Euro currency risk All or part of the assets of a sub-fund may be invested in securities denominated in Euro. In the event of any adjustments, including a full break-up, an exit of individual countries or other circumstances that may result in the emergence or reintroduction of national currencies, the sub-fund runs the risks that the value of its investments is reduced and/or the liquidity of its investments is (temporarily) reduced, regardless of the measures the Company may seek to reduce this risk.
Robeco Global Total Return Bond Fund 18
Notes to the financial statements as at 30 June 2021 (continued) 1. General (continued)
Financial instruments (continued) Risks (continued) Operational risk The operational risk is the non inherent risk remaining after determining the risks as detailed above (general investment risk, counterparty risk, liquidity risk, Euro currency risk or risk of lending financial instruments). It mainly includes risks resulting from breakdowns in internal procedures, people and systems.
Insight into actual risks The report of the Board of Directors, the Statement of net assets, the Notes to the financial statements and the Schedule of Investments, which include currency classification of the investments, give an insight into the actual risks at the end of the reporting period.
Risk management Managing risk is a part of the investment process as a whole and with the help of advanced systems, the risks outlined above are limited, measured and monitored on the basis of fixed risk measures.
Policy regarding the use of derivatives Investing implies that positions are taken. As it is possible to use various instruments, including derivative instruments, to construct an identical position, the selection of derivatives is subordinate to the positioning of an investment portfolio. In our published information, attention is given primarily to the overall position, and secondarily to the nature and volume of the financial instruments employed.
Derivative instruments The unrealized results of derivative instruments are reported in the Statement of net assets. Commitments to derivatives are not included in the Statement of net assets. They are, however, explained in the Schedule of Investments. The unrealized results presented in the Statement of net assets are disclosed by contract in the Schedule of Investments.
The derivative instruments listed in the Notes are transacted through third party brokers. Those brokers hold/paid collateral as described on page 21. The Company is exposed to counterparty risk in respect of all amounts including collateral due to it from such brokers.
2. Summary of significant accounting principles
GeneralUnless stated otherwise, the items shown in the financial statements are included at their nominal value and expressed in the reference currency of the sub-fund. This semi-annual report covers the reporting period from 1 January 2021 until 30 June 2021.
Preparation and presentation of financial statements The financial statements are prepared on the basis of the last NAV calculated during the reporting period (30 June 2021) and presented in accordance with Luxembourg generally accepted accounting principles for investment funds.
Foreign currencies Transactions in currencies other than the reference currency of the relevant sub-fund are converted into the reference currency at the exchange rates prevailing at the time of the transaction. The market value of the investments, assets and liabilities expressed in currencies other than the reference currency of the sub-fund are converted into the sub-fund’s reference currency at the exchange rates prevailing at the end of the reporting period. Any positive or negative exchange differences arising are accounted for in the Statement of operations and changes in net assets. The table on page 25 shows the exchange rates as at 30 June 2021.
Valuation of investments Transferable securities, money market instruments and financial derivative instruments listed on an official stock exchange listing These instruments are valued at their last available market price; in the event that there should be several such markets, on the basis of the last available price of the main market for the relevant security or asset. Should the last available market price for a given transferable security, money market instrument or financial derivative instrument not truly reflects its fair market value, then that transferable security, money market instrument or financial derivative instrument is valued on the basis of the probable sales price which the Board of Directors deems prudent to assume. Fixed income securities not traded on such markets are generally valued at the last available price or yield equivalents obtained from one or more dealers or pricing services approved by the Board of Directors or any other price deemed appropriate by the Board of Directors.
Robeco Global Total Return Bond Fund 19

Notes to the financial statements as at 30 June 2021 (continued) 2. Summary of significant accounting principles (continued)
Valuation of investments (continued) Transferable securities and/or money market instruments dealt in on another regulated market These instruments are valued on the basis of their last available market price. Should the last available market price for a given transferable security and/or money market instrument not truly reflects its fair market value, then that transferable security and/or money market instrument is valued by the Board of Directors on the basis of the probable sales price which the Board of Directors deems prudent to assume. Transferable securities and/or money market instruments not listed or dealt in on any stock exchange or on any regulated market In the event that any assets are not listed or dealt in on any stock exchange or on any regulated market, or if, with respect to assets listed or dealt in on any stock exchange, or on any regulated market as aforesaid, where the above valuation methods are inappropriate or misleading, the Board of Directors may adopt any other appropriate valuation principles for the assets of the Company. Sub-fund primarily invested in markets which are closed for business at the time of valuation of the sub-fund are normally valued using the prices at the previous close of business. Market volatility may result in the latest available prices not accurately reflecting the fair value of the sub-funds’ investments. This situation could be exploited by investors who are aware of the direction of market movements, and who might deal to exploit the difference between the next published Net Asset Value and the fair value of the sub-funds’ investments. By these investors paying less than the fair value for shares on issue, or receiving more than the fair value for shares on redemption, other shareholders may suffer a dilution in the value of their investment. To prevent this, the Company may, during periods of market volatility, adjust the Net Asset Value per Share prior to publication to reflect more accurately the fair value of the sub-funds’ investments. Adjustment will be made provided that such change exceeds the threshold as determined by the Board of Directors for the relevant sub fund. If an adjustment is made, it will be applied consistently to all classes of shares in the same sub fund. At the end of the reporting period, no such adjustments were made. Investment transactions and investment income Securities are initially recorded at cost, and where applicable on the basis of exchange rates prevailing on the date they are purchased. Results on sales of securities are determined on the basis of the average cost method (for futures first in first out method). Investment transactions are accounted for on the trade date. Dividends are accounted for on the ex-dividend date. Interest income is recorded on an accrual basis. Discounts/Premiums on zero coupon bonds are accreted as adjustments to interest income. Interest and capital gains on securities may be subject to withholding or capital gains taxes in certain countries. 3. Open forward exchange transactions
Open forward exchange transactions are valued with market practice valuation models using forwards rates based on exchange and interest rates applicable at 30 June 2021. The unrealized results of these transactions have been recorded gross in the Statement of net assets under the heading ‘Unrealised gain/loss on forward currency exchange contracts’ and changes in unrealized results are recorded in the Statement of operations and changes in net assets under the heading ‘Net change in unrealised appreciation/(depreciation) on forward currency exchange contracts’. The contracts outstanding as at 30 June 2021 are disclosed in the Schedule of Investments. Information on the collateral received or paid on these positions is stated in the table on page 21. The paid collateral is restricted cash and is included in the Statement of net assets under the Assets ‘Cash at bank and at brokers’. The received collateral is included in the Statement of net assets under the liabilities ‘Due to brokers’. 4. Interest rate swaps
Interest rate swaps are valued with market practice valuation models using exchange and interest rates applicable at 30 June 2021. The unrealized gains/losses on interest rate swaps are recorded gross in the Statement of net assets under the heading ‘Swap contracts at fair value’ and changes in unrealized results are recorded in the Statement of operations and changes in net assets under the heading ‘Net change in unrealised appreciation/(depreciation) on Swaps contracts'. The contracts outstanding as at 30 June 2021 are disclosed in the Schedule of Investments. Information on the collateral on these positions is stated in the table on page 21. The paid collateral is restricted cash and is included in the Statement of net assets under the Assets ‘Cash at bank and at brokers'. The received collateral is included in the Statement of net assets under the liabilities ‘Due to brokers’.
Robeco Global Total Return Bond Fund 20

Notes to the financial statements as at 30 June 2021 (continued) 5. Credit default swaps
Credit default swaps are valued at fair value under procedures approved by the Board of Directors. The valuation is based on recognised market models with observable market inputs used to perform the valuation. The unrealized gains/losses on credit default swaps are recorded gross in the Statement of net assets under the heading ‘Swap contracts at fair value’ and changes in unrealized results are recorded in the Statement of operations and changes in net assets under the heading ‘Net change in unrealised appreciation/(depreciation) on Swaps contracts'. The contracts outstanding as at 30 June 2021 are disclosed in the Schedule of Investments. Information on the collateral on these positions is stated in the table on page 21. The paid collateral is restricted cash and is included in the Statement of net assets under the Assets ‘Cash at bank and at brokers’. The received collateral is included in the Statement of net assets under the liabilities ‘Due to brokers’.
6. Financial futures contracts
Regulated futures contracts are valued at their exchange quoted settlement price. Initial margin deposits are made upon entering into futures contracts. Variation margin payments are made or received, depending on the daily fluctuation in market value of the contract and are recorded by the fund as unrealized appreciation or depreciation. When the contract is closed, the Company records a realized gain or loss equal to difference between the value of the contract at the time it was opened and the value at the time it was closed. All margin deposits are included in the Statement of net assets under the heading ‘Cash at bank and at brokers’.
Changes in unrealized results and realized results during the period are both recorded in the Statement of operations and changes in net assets. The contracts outstanding as at 30 June 2021 are disclosed in the Schedule of Investments.
7. Collateral
Robeco Global Total Return Bond Fund received or paid collateral to cover the unrealized results on derivative instruments. Collaterals are calculated and settled on a daily basis per counterparty. The collateral is primarily cash held at the broker in the name of the sub-fund. The paid collateral is restricted cash and is included in the Statement of net assets under the Assets ‘Cash at bank and at brokers’. The received collateral is included in the Statement of net assets under the liabilities ‘Due to brokers’. No cash collateral has been reinvested. The amounts per sub-fund and counterparty are shown in the table below.
Sub-fund name Currency Counterparty Type of
collateral Collateral received Collateral pledged Robeco Global Total Return Bond Fund EUR Barclays Cash 287,160 997,593 Robeco Global Total Return Bond Fund EUR Citi Cash 192,099 5,982,893 Robeco Global Total Return Bond Fund EUR Rabobank Nederland Cash – 1,820,000
In addition to the ‘Cash at bank and at brokers/ Due to brokers’ reflected in the Statement of Net Assets, the Fund received or paid collaterals which is not reflected in the Net Asset Value of the Fund neither in the Statement of Net Assets. The amount and counterparty are shown in the table below
Sub-fund name Currency Counterparty Type of
collateral Collateral received Collateral pledged Robeco Global Total Return Bond Fund EUR J.P. Morgan Cash 480,000 – Robeco Global Total Return Bond Fund EUR HSBC Cash 430,000 –
8. Schedule of Investments
The Schedule of Investments of the sub-fund is included at the end of this report.
Robeco Global Total Return Bond Fund 21

Notes to the financial statements as at 30 June 2021 (continued) 9. Securities lending
J.P. Morgan Bank Luxembourg S.A. is lending agent for all Robeco Global Total Return Bond Fund securities lending transactions. J.P. Morgan is authorized to retain a fee in an amount equal to (A) 25% for any loans which generate a return of 0.5% or less and (B) 10% for any loans which generate a return greater than 0.5% of the sum of (i) earnings derived from Authorised Investments (as adjusted for any Rebate paid or received by J.P. Morgan) (ii) any fee, paid or payable by Borrower with respect to loans (including any loan fee but excluding any compensation payable by borrower under the MSLA in connection with a loan (net, however, of any other amount payable by Lender in connection with such loan). Gains and losses on Cash Collateral investments shall not be taken into account in calculating earnings for the purpose of J.P. Morgan’s fees. The following table shows the position of the collateralized securities lending transactions with first-class financial institutions as described in the prospectus at the end of the reporting period as well as the income from securities lending over the reporting period for the Company and the income for J.P. Morgan Bank Luxembourg S.A. Income on securities lending transactions is recorded under the heading 'Securities lending income' in the Statement of operations and changes in net assets. Collateral received in the frame of the lending activity, primarily securities, is held in the name of the fund on an escrow account with external agents. In exceptional cases, the collateral is received in cash, which is not subject to reinvestment. More information on collateral received can be found on page 10 and further.
Fund Fund
currency Counterparty
Market value of securities on loan in Fund currency
Cash collateral in Fund currency
Non cash collateral in Fund
currency Total collateral in
Fund currency Robeco Global Total Return Bond Fund EUR Barclays 7,179,188 1,740,176 5,639,771 7,379,947 Robeco Global Total Return Bond Fund EUR Deutsche Bank 1,168,165 – 1,192,812 1,192,812 Robeco Global Total Return Bond Fund EUR J.P. Morgan 18,570,959 2,487,859 16,645,125 19,132,983 Robeco Global Total Return Bond Fund EUR Goldman Sachs 1,451,178 1,169,205 328,626 1,497,831 Robeco Global Total Return Bond Fund EUR Morgan Stanley 242,155 247,545 – 247,545 Robeco Global Total Return Bond Fund EUR Citi 17,101,250 – 17,448,804 17,448,804 Robeco Global Total Return Bond Fund EUR Merrill Lynch 2,617,257 – 2,669,602 2,669,602 Robeco Global Total Return Bond Fund EUR BNP Paribas 83,915,755 3,116,156 82,518,719 85,634,875 Robeco Global Total Return Bond Fund EUR Nomura 11,233,867 – 11,704,964 11,704,964 Robeco Global Total Return Bond Fund EUR Wells Fargo 813,757 830,582 – 830,582
Fund Fund
currency
Lending income (gross) in Fund
currency Lending agent fee in Fund currency
Lending income (net) in Fund
currency Robeco Global Total Return Bond Fund EUR 51,795 12,918 38,877
10. Taxes
The classes of shares of the sub-fund are liable in Luxembourg to an annual duty (‘taxe d’abonnement’/’subscription tax’) at the rate of 0.05% of their net assets calculated and payable at the end of each quarter. This rate is 0.01% per annum for institutional classes of shares such as class IH and IEH shares. To the extent that the assets of the sub-fund are invested in investment funds which are established in Luxembourg, no such tax is payable, provided that the relevant investment funds have been subject to this tax. The sub-fund will receive income from their investments after deduction of applicable withholding taxes in the country of origin. There is no Luxembourg income, withholding, capital gains, estate or inheritance taxes payable by the sub-fund.
11. Management company
The Board of Directors of the Company have appointed Robeco Luxembourg S.A. (until 1 January 2021) and Robeco Institutional Asset Management B.V. (since 1 January 2021) as the Management Company to be responsible on a day-to-day basis for providing administration, marketing and investment management services in respect of the fund.
Robeco Global Total Return Bond Fund 22

Management fee
(%) Service fee
(%) Robeco Global Total Return Bond Fund
CH EUR 0.35 0.16 DH CHF 0.70 0.16 DH EUR 0.70 0.16 DH USD 0.70 0.16 EH EUR 0.70 0.16 FH EUR 0.35 0.16 IEH EUR 0.35 0.12 IH CHF 0.35 0.12 IH EUR 0.35 0.12 IH USD 0.35 0.12 M2H EUR 2.50 0.16
If the net asset value per share class exceeds EUR 1 billion the service fee will be reduced by 0.02% for the portion above 1 billion. If the net asset per share class value exceeds EUR 5 billion, the service fee will be reduced by a further 0.02% for the portion above EUR 5 billion.
13. Investments in third party funds
If the sub-fund invests in UCITS/UCI’s that are not part of the Robeco Group, all costs at the level of these UCITS/UCI’s (including the non recoverable management fees, service fees, performance fees and/or transactions costs) shall be borne by sub-fund ultimately and therefore by the shareholders. The management fee and service fee paid in the Robeco funds is restituted to sub-fund and recorded in the Statement of operations and changes in net assets. During 2021 there is no restitution of fees as the sub-fund only invested in the Z shares of Robeco funds which don’t charge management or service fees.
14. Depositary fees
The Depositary bank is remunerated in accordance with the agreement between J.P. Morgan Bank Luxembourg S.A. (acting as the depositary) and the Company.
Robeco Global Total Return Bond Fund 23
Notes to the financial statements as at 30 June 2021 (continued) 11. Management company (continued)
Robeco Luxembourg S.A. was incorporated as a ‘Société anonyme’ under the laws of the Grand Duchy of Luxembourg on 7 July 2005 and its Articles of Association were published in the Mémorial on 26 July 2005. The Robeco Luxembourg S.A. is approved as Management Company regulated by chapter 15 of the Luxembourg law of 17 December 2010 relating to undertakings for collective investment.
Robeco Institutional Asset Management (“RIAM”) is incorporated under the laws of The Netherlands on 21 May 1974 and at that time called Rotrusco B.V. On 25 February 1997, the name was changed into RIAM. RIAM holds an AIFMD license as referred to in Section 2:65 Wft. In addition, RIAM is licensed as a manager of UCITS (2:69b Wft, the Dutch Financial Supervision Act). RIAM is moreover authorized to manage individual assets and give advice with respect to financial instruments. RIAM is subject to supervision by the Dutch Authority for the Financial Markets (Stichting Autoriteit Financiële Markten, “AFM”).
The Management Company has delegated the administration functions and registrar agent functions to J.P. Morgan Bank Luxembourg S.A.
RIAM is part of ORIX Corporation Europe N.V. and also acts as the Management Company for Robeco Capital Growth Funds, Robeco QI Global Dynamic Duration, Robeco All Strategies Funds and Robeco (LU ) Funds III .
12. Management and service fees
The classes of shares incur an annual management fee payable to the Management Company, which reflects all expenses related to the management of the Company. Furthermore the Company or the different classes of shares incur an annual service fee payable to the Management Company reflecting all remaining expenses such as the fees of the Administration Agent, the Registrar Agent, auditors and legal advisers, the costs of custody (including custody fees and bank charges), the costs of depositary services, the costs of preparing, printing and distributing all prospectuses, memoranda, reports and other necessary documents concerning the Company, any fees and expenses involved in the registration of the Company with any governmental agency and stock exchange, the costs of publishing prices and operational expenses, and the cost of holding shareholders’ meetings. The annual charges, both management fee and service fee, are expressed as a percentage of the net asset value. The charges paid monthly, are based on net asset value of the relevant period and are reflected in the share price. The following table shows the maximum percentages for the different outstanding classes of shares. Robeco Global Total Return Bond Fund is not subject to a performance fee.

Notes to the financial statements as at 30 June 2021 (continued) 15. Other Operating expenses
The sub-fund and its classes of shares pay directly banking fees relating to the assets of the sub-fund or expenses incurred thereof, such as proxy voting. The costs of establishing the Company have been paid entirely. If additional sub-funds are created in the future, these sub-funds will bear, in principle, their own formation expenses.
16. Transaction costs
The sub-fund and their classes of shares pay directly commissions, brokerage fees and taxes resulting from financial transactions. Transaction costs are included in the purchase/sale price of the securities.
Sub-Fund Sub-Fund Currency Total transaction costs
Robeco Global Total Return Bond Fund EUR 47,447
17. Total Expense Ratio (TER)
The Total Expense Ratio (‘TER’) expresses the operational costs (e.g. management fee, service fee, taxe d’abonnement, depositary fee and bank charges) charged to the sub-funds as a percentage of the average assets entrusted, calculated on a daily basis, during the reporting period. The TER as shown below do not include transaction costs. The other costs concern mainly bank charges, depositary fees and taxe d’abonnement. The other costs fund shares concern the nonrefundable cost of the underlying funds and concern mainly bank charges, depositary fees and taxe d’abonnement. Total Expense Ratio are annualized for periods less than one year.
Fund Management
fee Service fee Other costs Total Robeco Global Total Return Bond Fund CH EUR 0.35 0.16 0.03 0.54 DH CHF 0.70 0.16 0.04 0.90 DH EUR 0.70 0.16 0.05 0.91 DH USD 0.70 0.16 0.05 0.91 EH EUR 0.70 0.16 0.05 0.91 FH EUR 0.35 0.16 0.04 0.55 IEH EUR 0.35 0.12 – 0.47 IH CHF 0.35 0.12 – 0.47 IH EUR 0.35 0.12 0.01 0.48 IH USD 0.35 0.12 0.01 0.48 M2H EUR 1.50 0.16 0.04 1.70
18. Portfolio Turnover Ratio (PTR)
This is the turnover ratio of the investments, against the average assets entrusted and this is a measure of the incurred transaction costs resulting from the investment portfolio policies pursued and the ensuing investment transactions. In the calculation method that is used the amount of turnover is determined by the sum of purchases and sales of investments, excluding derivative and liquidity instruments, less the sum of issuance and repurchase of own shares, divided by the daily average of the net assets. The portfolio turnover ratio is determined by expressing the amount of turnover as a percentage of the average assets entrusted. Following table shows the portfolio turnover ratios of the sub-fund.
Fund Name Portfolio turnover ratio
(%) Robeco Global Total Return Bond Fund 152.60
19. Subsequent events
There are no subsequent events to be reported.
20. Changes in the investment portfolio
The statement of changes in the investment portfolio during the period from 1 January 2021 to 30 June 2021 inclusive may be obtained free of charge at the offices of the Company, the Depositary, or any Nominee.
Robeco Global Total Return Bond Fund 24

Notes to the financial statements as at 30 June 2021 (continued) 21. Retrocessions and trailer fees
Trailer fees for the marketing of the sub-funds (Commission d’Encours) are paid to distributors and assets managers from the management fee. No retrocession has been granted during the reporting period.
22. Commissions paid to affiliated parties
No transactions were effected with affiliated parties during the reporting period other than management activities.
23. Exchange rates
Currency Rate EUR = 1 AUD 1.5796 CAD 1.4685 CNY 7.6626 DKK 7.4363 GBP 0.8584 IDR 17,195.5500 JPY 131.6230 NZD 1.6972 PLN 4.5147 SEK 10.1420 USD 1.1859
Luxembourg, 31 August 2021
The Board of Directors Mr. J.H. van den Akker Mr. H.J. Ris Mr. C.M.A. Hertz Mr. M.O. Nijkamp
Robeco Global Total Return Bond Fund 25

Schedule of InvestmentsRobeco Global Total Return Bond Fund As at 30 June 2021
Investments Currency Quantity/
Nominal Value
Market Value EUR
% of Net Assets
Transferable securities and money market instruments admitted to an official exchange listing
Bonds
Australia APT Pipelines Ltd., Reg. S 3.5% 22/03/2030 GBP 310,000 402,392 0 .06 Australia Government Bond, Reg. S 2.75% 21/06/2035 AUD 1,547,000 1,095,472 0 .17
1,497,864 0 .23
Austria Erste Group Bank AG, Reg. S, FRN 1% 10/06/2030 EUR 1,100,000 1,109,682 0 .17 Raiffeisen Bank International AG, Reg. S 6% 16/10/2023 EUR 100,000 113,782 0 .02 Raiffeisen Bank International AG, Reg. S, FRN 1.5% 12/03/2030 EUR 400,000 408,597 0 .06 Raiffeisen Bank International AG, Reg. S, FRN 1.375% 17/06/2033 EUR 200,000 199,682 0 .03
1,831,743 0 .28
Belgium Anheuser-Busch InBev SA/NV, Reg. S 3.7% 02/04/2040 EUR 551,000 748,281 0 .11 Belgium Government Bond, Reg. S, 144A 0.4% 22/06/2040 EUR 1,000,000 962,774 0 .15
1,711,055 0 .26
Canada Canada Government Bond 5% 01/06/2037 CAD 4,000,000 4,016,592 0 .62 Canada Government Bond 2.75% 01/12/2048 CAD 2,906,000 2,374,784 0 .36
6,391,376 0 .98
China China Government Bond 3.29% 23/05/2029 CNY 154,500,000 20,422,495 3 .13 China Government Bond 2.68% 21/05/2030 CNY 232,670,000 29,187,909 4 .48
49,610,404 7 .61
Denmark Danske Bank A/S, Reg. S, FRN 2.5% 21/06/2029 EUR 824,000 868,304 0 .14 Danske Bank A/S, Reg. S, FRN 1.5% 02/09/2030 EUR 204,000 208,919 0 .03 Denmark Government Bond, Reg. S, 144A 0.5% 15/11/2029 DKK 9,823,000 1,387,849 0 .21
2,465,072 0 .38
Finland Sampo OYJ, Reg. S, FRN 3.375% 23/05/2049 EUR 300,000 341,297 0 .05
341,297 0 .05
France Agence Francaise de Developpement EPIC, Reg. S 0% 25/03/2025 EUR 2,600,000 2,633,856 0 .40 Agence Francaise de Developpement EPIC, Reg. S 0.5% 31/05/2035 EUR 6,000,000 6,004,449 0 .92 Banque Federative du Credit Mutuel SA, Reg. S 1.75% 19/12/2024 GBP 300,000 360,448 0 .06 Banque Federative du Credit Mutuel SA, Reg. S 1.25% 03/06/2030 EUR 400,000 419,158 0 .06
Robeco Global Total Return Bond Fund 26

Schedule of Investments (continued)
Robeco Global Total Return Bond Fund As at 30 June 2021
Investments Currency Quantity/
Nominal Value
Market Value EUR
% of Net Assets
Transferable securities and money market instruments admitted to an official exchange listing (continued)
Bonds (continued)
France (continued) Caisse Centrale du Credit Immobilier de France SA, Reg. S 0% 17/01/2024 EUR 1,400,000 1,413,580 0 .22
CNP Assurances, Reg. S 0.375% 08/03/2028 EUR 300,000 293,714 0 .05
Electricite de France SA, Reg. S, FRN 3.375% Perpetual EUR 200,000 208,984 0 .03
Electricite de France SA, Reg. S, FRN 6% Perpetual GBP 500,000 650,739 0 .10
France Government Bond OAT, Reg. S, 144A 1.25% 25/05/2036 EUR 4,668,000 5,230,256 0 .80
France Government Bond OAT, Reg. S, 144A 0.5% 25/05/2040 EUR 3,972,000 3,892,937 0 .60
France Government Bond OAT, Reg. S, 144A 0.5% 25/06/2044 EUR 5,730,000 5,475,225 0 .84
SNCF Reseau, Reg. S 2.25% 20/12/2047 EUR 3,600,000 4,511,385 0 .69
WPP Finance SA, Reg. S 3.75% 19/05/2032 GBP 410,000 546,009 0 .08
31,640,740 4 .85
Germany Bayer AG, Reg. S 1% 12/01/2036 EUR 100,000 94,058 0 .01
Bundesobligation, Reg. S 0% 08/10/2021 EUR 33,741,000 33,803,076 5 .18
Bundesobligation, Reg. S 0% 14/04/2023 EUR 32,551,000 32,956,947 5 .05
Bundesobligation, Reg. S 0% 11/04/2025 EUR 4,700,000 4,816,894 0 .74
Bundesrepublik Deutschland, Reg. S 3.25% 04/07/2021 EUR 11,237,000 11,237,000 1 .72
Bundesrepublik Deutschland, Reg. S 0% 10/09/2021 EUR 21,655,000 21,680,983 3 .33
Bundesrepublik Deutschland, Reg. S 1.5% 15/02/2023 EUR 22,844,000 23,662,431 3 .63
Bundesrepublik Deutschland, Reg. S 0% 15/02/2030 EUR 1,366,000 1,406,440 0 .22
Bundesrepublik Deutschland, Reg. S 0% 15/08/2030 EUR 4,354,000 4,497,639 0 .69
Bundesrepublik Deutschland, Reg. S 0% 15/08/2030 EUR 37,200,000 38,222,993 5 .86
Bundesrepublik Deutschland, Reg. S 0% 15/02/2031 EUR 13,870,000 14,210,386 2 .18
Bundesrepublik Deutschland, Reg. S 4.75% 04/07/2034 EUR 2,550,000 4,199,831 0 .64
Bundesrepublik Deutschland, Reg. S 0% 15/05/2035 EUR 6,000,000 6,009,765 0 .92
Bundesrepublik Deutschland, Reg. S 4.75% 04/07/2040 EUR 3,756,000 7,113,864 1 .09
Bundesrepublik Deutschland, Reg. S 2.5% 04/07/2044 EUR 3,288,000 5,044,197 0 .77
Bundesrepublik Deutschland, Reg. S 1.25% 15/08/2048 EUR 947,000 1,194,848 0 .18
Bundesrepublik Deutschland, Reg. S 0% 15/08/2050 EUR 7,215,000 6,701,542 1 .03
Bundesschatzanweisungen, Reg. S 0% 15/12/2022 EUR 10,067,000 10,167,469 1 .56
Daimler AG, Reg. S 2% 22/08/2026 EUR 274,000 301,227 0 .05
Deutsche Bank AG, Reg. S 2.625% 16/12/2024 GBP 400,000 486,464 0 .08
Deutsche Bank AG, Reg. S 1.625% 20/01/2027 EUR 600,000 630,677 0 .10
NRW Bank 0% 15/10/2029 EUR 4,000,000 4,006,770 0 .62
State of Hesse, Reg. S 1.3% 10/10/2033 EUR 4,400,000 4,959,987 0 .76
State of North Rhine-Westphalia Germany, Reg. S 0% 12/10/2035 EUR 3,500,000 3,316,494 0 .51
Vonovia SE, Reg. S 0.625% 14/12/2029 EUR 200,000 200,440 0 .03
ZF Finance GmbH, Reg. S 3.75% 21/09/2028 EUR 200,000 219,000 0 .03
241,141,422 36 .98
Robeco Global Total Return Bond Fund 27

Schedule of Investments (continued)
Robeco Global Total Return Bond Fund As at 30 June 2021
Investments Currency Quantity/
Nominal Value
Market Value EUR
% of Net Assets
Transferable securities and money market instruments admitted to an official exchange listing (continued)
Bonds (continued)
Hong Kong Weichai International Hong Kong Energy Group Co. Ltd., Reg. S, FRN 3.75% Perpetual USD 740,000 634,256 0 .10
634,256 0 .10
Ireland AIB Group plc, Reg. S, FRN 2.875% 30/05/2031 EUR 270,000 288,745 0 .04
Bank of Ireland Group plc, Reg. S, FRN 2.375% 14/10/2029 EUR 800,000 834,366 0 .13
CCEP Finance Ireland DAC, Reg. S 0.875% 06/05/2033 EUR 330,000 329,625 0 .05
Eaton Capital Unlimited Co., Reg. S 0.128% 08/03/2026 EUR 450,000 450,268 0 .07
1,903,004 0 .29
Italy Aeroporti di Roma SpA 5.441% 20/02/2023 GBP 530,000 658,173 0 .10
FCA Bank SpA, Reg. S 1% 15/11/2021 EUR 755,000 758,966 0 .12
Italy Buoni Poliennali Del Tesoro, Reg. S, 144A 1.5% 30/04/2045 EUR 3,675,000 3,571,462 0 .55
Italy Buoni Poliennali Del Tesoro, Reg. S, 144A 2.8% 01/03/2067 EUR 1,000,000 1,183,452 0 .18
Italy Buoni Poliennali Del Tesoro, Reg. S, 144A 2.15% 01/03/2072 EUR 980,000 959,487 0 .15
Italy Buoni Poliennali Del Tesoro, Reg. S 0% 01/04/2026 EUR 6,700,000 6,671,186 1 .02
13,802,726 2 .12
Japan Japan Government Thirty Year Bond 0.6% 20/06/2050 JPY 341,000,000 2,539,806 0 .39
Japan Government Twenty Year Bond 1.5% 20/03/2034 JPY 612,000,000 5,427,495 0 .84
Japan Government Twenty Year Bond 0.7% 20/03/2037 JPY 1,293,000,000 10,442,514 1 .60
Japan Government Twenty Year Bond 0.3% 20/09/2039 JPY 647,000,000 4,838,802 0 .74
23,248,617 3 .57
Luxembourg European Financial Stability Facility, Reg. S 0% 15/10/2025 EUR 6,500,000 6,610,869 1 .01
European Financial Stability Facility, Reg. S 0.05% 17/10/2029 EUR 6,500,000 6,562,367 1 .01
Lincoln Financing SARL, Reg. S 3.625% 01/04/2024 EUR 430,000 435,023 0 .07
State of the Grand-Duchy of Luxembourg, Reg. S 0% 14/09/2032 EUR 1,727,000 1,710,422 0 .26
Traton Finance Luxembourg SA, Reg. S 0.125% 24/03/2025 EUR 300,000 300,688 0 .05
15,619,369 2 .40
Mexico Grupo Televisa SAB 5% 13/05/2045 USD 310,000 312,428 0 .05
Mexico Government Bond 2.125% 25/10/2051 EUR 2,261,000 1,904,892 0 .29
2,217,320 0 .34
Netherlands ABN AMRO Bank NV, Reg. S 1.25% 28/05/2025 EUR 500,000 522,497 0 .08
Robeco Global Total Return Bond Fund 28
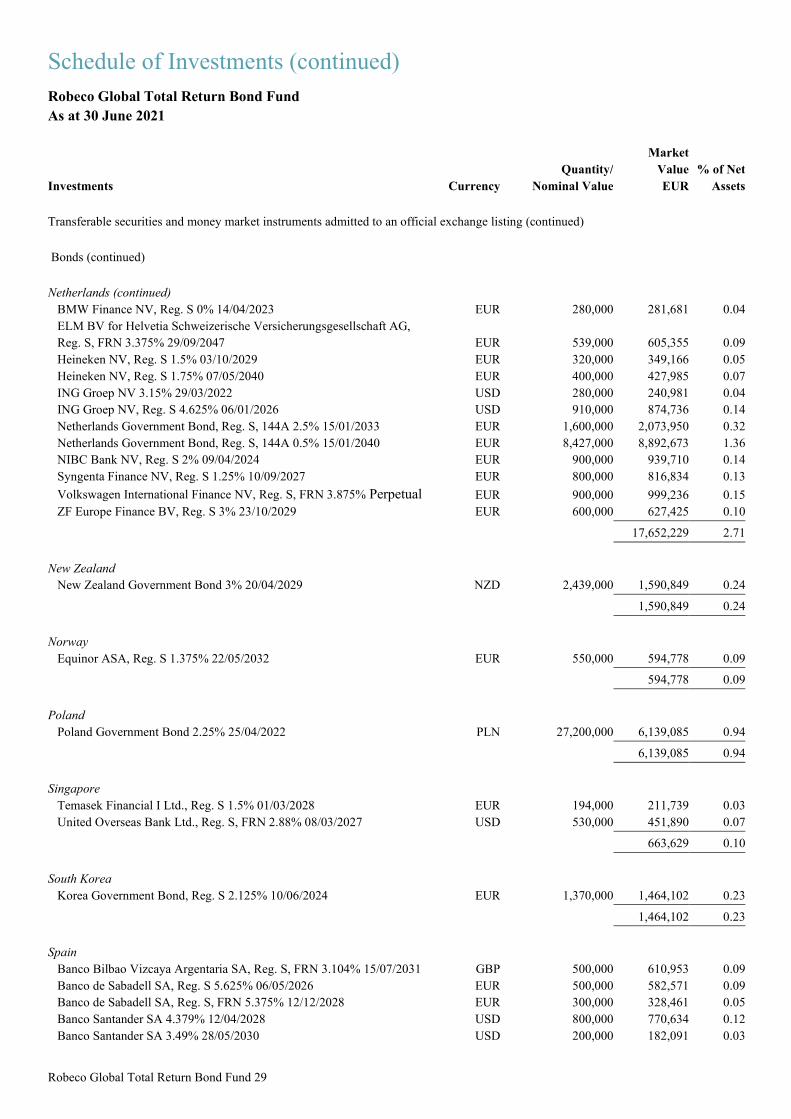
Schedule of Investments (continued)
Robeco Global Total Return Bond Fund As at 30 June 2021
Investments Currency Quantity/
Nominal Value
Market Value EUR
% of Net Assets
Transferable securities and money market instruments admitted to an official exchange listing (continued)
Bonds (continued)
Netherlands (continued) BMW Finance NV, Reg. S 0% 14/04/2023 EUR 280,000 281,681 0 .04
ELM BV for Helvetia Schweizerische Versicherungsgesellschaft AG, Reg. S, FRN 3.375% 29/09/2047 EUR 539,000 605,355 0 .09
Heineken NV, Reg. S 1.5% 03/10/2029 EUR 320,000 349,166 0 .05
Heineken NV, Reg. S 1.75% 07/05/2040 EUR 400,000 427,985 0 .07
ING Groep NV 3.15% 29/03/2022 USD 280,000 240,981 0 .04
ING Groep NV, Reg. S 4.625% 06/01/2026 USD 910,000 874,736 0 .14
Netherlands Government Bond, Reg. S, 144A 2.5% 15/01/2033 EUR 1,600,000 2,073,950 0 .32
Netherlands Government Bond, Reg. S, 144A 0.5% 15/01/2040 EUR 8,427,000 8,892,673 1 .36
NIBC Bank NV, Reg. S 2% 09/04/2024 EUR 900,000 939,710 0 .14
Syngenta Finance NV, Reg. S 1.25% 10/09/2027 EUR 800,000 816,834 0 .13
Volkswagen International Finance NV, Reg. S, FRN 3.875% Perpetual EUR 900,000 999,236 0 .15
ZF Europe Finance BV, Reg. S 3% 23/10/2029 EUR 600,000 627,425 0 .10
17,652,229 2 .71
New Zealand New Zealand Government Bond 3% 20/04/2029 NZD 2,439,000 1,590,849 0 .24
1,590,849 0 .24
Norway Equinor ASA, Reg. S 1.375% 22/05/2032 EUR 550,000 594,778 0 .09
594,778 0 .09
Poland Poland Government Bond 2.25% 25/04/2022 PLN 27,200,000 6,139,085 0 .94
6,139,085 0 .94
Singapore Temasek Financial I Ltd., Reg. S 1.5% 01/03/2028 EUR 194,000 211,739 0 .03
United Overseas Bank Ltd., Reg. S, FRN 2.88% 08/03/2027 USD 530,000 451,890 0 .07
663,629 0 .10
South Korea Korea Government Bond, Reg. S 2.125% 10/06/2024 EUR 1,370,000 1,464,102 0 .23
1,464,102 0 .23
Spain Banco Bilbao Vizcaya Argentaria SA, Reg. S, FRN 3.104% 15/07/2031 GBP 500,000 610,953 0 .09
Banco de Sabadell SA, Reg. S 5.625% 06/05/2026 EUR 500,000 582,571 0 .09
Banco de Sabadell SA, Reg. S, FRN 5.375% 12/12/2028 EUR 300,000 328,461 0 .05
Banco Santander SA 4.379% 12/04/2028 USD 800,000 770,634 0 .12
Banco Santander SA 3.49% 28/05/2030 USD 200,000 182,091 0 .03
Robeco Global Total Return Bond Fund 29

Schedule of Investments (continued)
Robeco Global Total Return Bond Fund As at 30 June 2021
Investments Currency Quantity/
Nominal Value
Market Value EUR
% of Net Assets
Transferable securities and money market instruments admitted to an official exchange listing (continued)
Bonds (continued)
Spain (continued) CaixaBank SA, Reg. S 1.125% 17/05/2024 EUR 300,000 310,186 0 .05
CaixaBank SA, Reg. S 1.375% 19/06/2026 EUR 300,000 313,528 0 .05
CaixaBank SA, Reg. S, FRN 0.75% 10/07/2026 EUR 200,000 204,310 0 .03
CaixaBank SA, Reg. S, FRN 3.375% 15/03/2027 EUR 200,000 204,465 0 .03
Cellnex Telecom SA, Reg. S 1.75% 23/10/2030 EUR 600,000 597,393 0 .09
Spain Government Bond, Reg. S, 144A 1.95% 30/07/2030 EUR 4,485,000 5,146,536 0 .79
Spain Government Bond, Reg. S, 144A 1.25% 31/10/2030 EUR 3,800,000 4,116,015 0 .63
Spain Government Bond, Reg. S, 144A 5.15% 31/10/2044 EUR 800,000 1,446,244 0 .22
14,813,387 2 .27
Supranational European Investment Bank, Reg. S 0% 28/03/2028 EUR 6,500,000 6,592,815 1 .01
European Investment Bank, Reg. S 0.01% 15/05/2041 EUR 2,591,000 2,367,320 0 .36
European Stability Mechanism, Reg. S 0.5% 05/03/2029 EUR 6,000,000 6,287,363 0 .97
European Union, Reg. S 0% 06/07/2026 EUR 1,648,000 1,680,586 0 .26
European Union, Reg. S 0% 04/07/2031 EUR 4,590,000 4,582,150 0 .70
European Union, Reg. S 0.7% 06/07/2051 EUR 987,000 1,000,337 0 .15
International Bank for Reconstruction & Development 7.45% 20/08/2021 IDR 100,000,000,000 5,811,778 0 .89
International Bank for Reconstruction & Development 0% 15/01/2027 EUR 6,410,000 6,505,657 1 .00
34,828,006 5 .34
Sweden Swedbank AB, 144A 0.85% 18/03/2024 USD 710,000 600,774 0 .09
Sweden Government Bond 3.5% 01/06/2022 SEK 18,450,000 1,883,134 0 .29
2,483,908 0 .38
Switzerland Credit Suisse Group AG, Reg. S 0.625% 18/01/2033 EUR 2,700,000 2,539,701 0 .39
Credit Suisse Group AG, Reg. S, FRN 1.25% 17/07/2025 EUR 800,000 821,438 0 .13
Credit Suisse Group AG, Reg. S, FRN 3.25% 02/04/2026 EUR 319,000 351,677 0 .05
3,712,816 0 .57
United Arab Emirates DP World plc, Reg. S 2.375% 25/09/2026 EUR 480,000 512,250 0 .08
Emirates Telecommunications Group Co. PJSC, Reg. S 2.75% 18/06/2026 EUR 480,000 542,190 0 .08
1,054,440 0 .16
United Kingdom Barclays plc, Reg. S, FRN 3.375% 02/04/2025 EUR 1,230,000 1,340,118 0 .21
Barclays plc, Reg. S, FRN 2% 07/02/2028 EUR 840,000 861,237 0 .13
Robeco Global Total Return Bond Fund 30
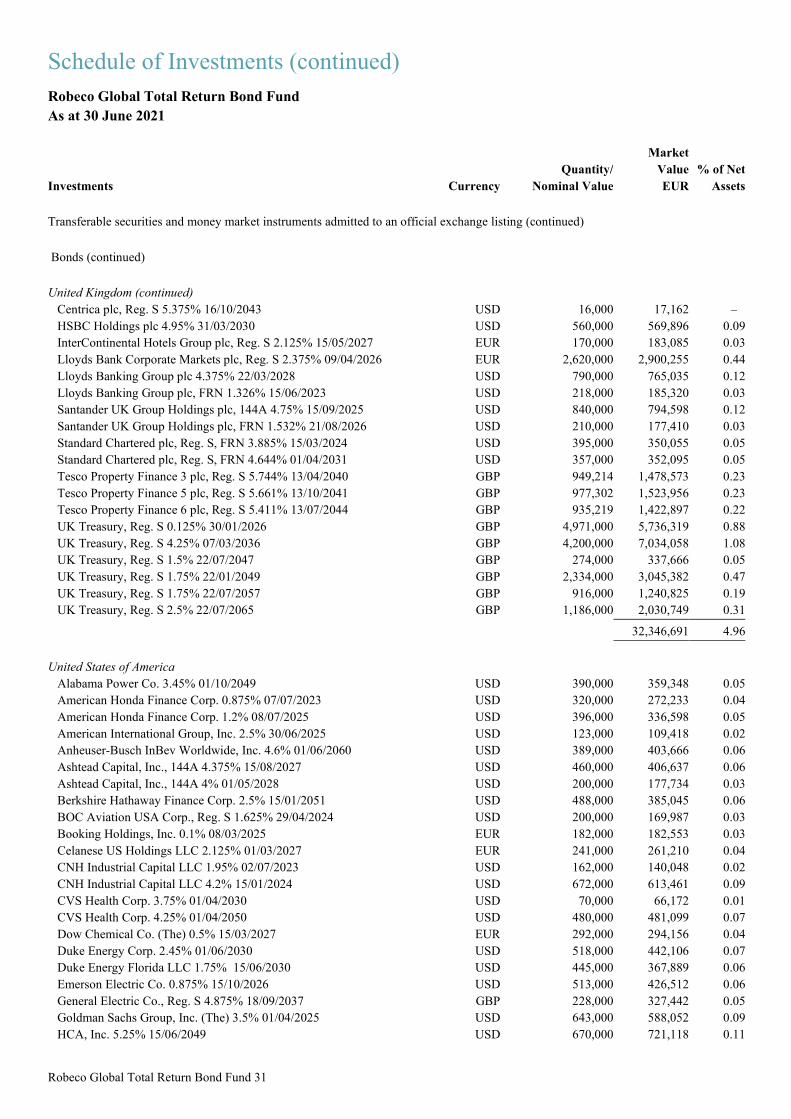
Schedule of Investments (continued)
Robeco Global Total Return Bond Fund As at 30 June 2021
Investments Currency Quantity/
Nominal Value
Market Value EUR
% of Net Assets
Transferable securities and money market instruments admitted to an official exchange listing (continued)
Bonds (continued)
United Kingdom (continued) Centrica plc, Reg. S 5.375% 16/10/2043 USD 16,000 17,162 –
HSBC Holdings plc 4.95% 31/03/2030 USD 560,000 569,896 0 .09
InterContinental Hotels Group plc, Reg. S 2.125% 15/05/2027 EUR 170,000 183,085 0 .03
Lloyds Bank Corporate Markets plc, Reg. S 2.375% 09/04/2026 EUR 2,620,000 2,900,255 0 .44
Lloyds Banking Group plc 4.375% 22/03/2028 USD 790,000 765,035 0 .12
Lloyds Banking Group plc, FRN 1.326% 15/06/2023 USD 218,000 185,320 0 .03
Santander UK Group Holdings plc, 144A 4.75% 15/09/2025 USD 840,000 794,598 0 .12
Santander UK Group Holdings plc, FRN 1.532% 21/08/2026 USD 210,000 177,410 0 .03
Standard Chartered plc, Reg. S, FRN 3.885% 15/03/2024 USD 395,000 350,055 0 .05
Standard Chartered plc, Reg. S, FRN 4.644% 01/04/2031 USD 357,000 352,095 0 .05
Tesco Property Finance 3 plc, Reg. S 5.744% 13/04/2040 GBP 949,214 1,478,573 0 .23
Tesco Property Finance 5 plc, Reg. S 5.661% 13/10/2041 GBP 977,302 1,523,956 0 .23
Tesco Property Finance 6 plc, Reg. S 5.411% 13/07/2044 GBP 935,219 1,422,897 0 .22
UK Treasury, Reg. S 0.125% 30/01/2026 GBP 4,971,000 5,736,319 0 .88
UK Treasury, Reg. S 4.25% 07/03/2036 GBP 4,200,000 7,034,058 1 .08
UK Treasury, Reg. S 1.5% 22/07/2047 GBP 274,000 337,666 0 .05
UK Treasury, Reg. S 1.75% 22/01/2049 GBP 2,334,000 3,045,382 0 .47
UK Treasury, Reg. S 1.75% 22/07/2057 GBP 916,000 1,240,825 0 .19
UK Treasury, Reg. S 2.5% 22/07/2065 GBP 1,186,000 2,030,749 0 .31
32,346,691 4 .96
United States of America Alabama Power Co. 3.45% 01/10/2049 USD 390,000 359,348 0 .05
American Honda Finance Corp. 0.875% 07/07/2023 USD 320,000 272,233 0 .04
American Honda Finance Corp. 1.2% 08/07/2025 USD 396,000 336,598 0 .05
American International Group, Inc. 2.5% 30/06/2025 USD 123,000 109,418 0 .02
Anheuser-Busch InBev Worldwide, Inc. 4.6% 01/06/2060 USD 389,000 403,666 0 .06
Ashtead Capital, Inc., 144A 4.375% 15/08/2027 USD 460,000 406,637 0 .06
Ashtead Capital, Inc., 144A 4% 01/05/2028 USD 200,000 177,734 0 .03
Berkshire Hathaway Finance Corp. 2.5% 15/01/2051 USD 488,000 385,045 0 .06
BOC Aviation USA Corp., Reg. S 1.625% 29/04/2024 USD 200,000 169,987 0 .03
Booking Holdings, Inc. 0.1% 08/03/2025 EUR 182,000 182,553 0 .03
Celanese US Holdings LLC 2.125% 01/03/2027 EUR 241,000 261,210 0 .04
CNH Industrial Capital LLC 1.95% 02/07/2023 USD 162,000 140,048 0 .02
CNH Industrial Capital LLC 4.2% 15/01/2024 USD 672,000 613,461 0 .09
CVS Health Corp. 3.75% 01/04/2030 USD 70,000 66,172 0 .01
CVS Health Corp. 4.25% 01/04/2050 USD 480,000 481,099 0 .07
Dow Chemical Co. (The) 0.5% 15/03/2027 EUR 292,000 294,156 0 .04
Duke Energy Corp. 2.45% 01/06/2030 USD 518,000 442,106 0 .07
Duke Energy Florida LLC 1.75% 15/06/2030 USD 445,000 367,889 0 .06
Emerson Electric Co. 0.875% 15/10/2026 USD 513,000 426,512 0 .06
General Electric Co., Reg. S 4.875% 18/09/2037 GBP 228,000 327,442 0 .05
Goldman Sachs Group, Inc. (The) 3.5% 01/04/2025 USD 643,000 588,052 0 .09
HCA, Inc. 5.25% 15/06/2049 USD 670,000 721,118 0 .11
Robeco Global Total Return Bond Fund 31

Schedule of Investments (continued)
Robeco Global Total Return Bond Fund As at 30 June 2021
Investments Currency Quantity/
Nominal Value
Market Value EUR
% of Net Assets
Transferable securities and money market instruments admitted to an official exchange listing (continued)
Bonds (continued)
United States of America (continued) Home Depot, Inc. (The) 0.9% 15/03/2028 USD 294,000 241,656 0 .04
Huntsman International LLC 4.25% 01/04/2025 EUR 470,000 529,673 0 .08
Komatsu Finance America, Inc., Reg. S 2.437% 11/09/2022 USD 905,000 779,620 0 .12
Kroger Co. (The) 1.7% 15/01/2031 USD 453,000 366,320 0 .06
Linde, Inc. 1.1% 10/08/2030 USD 669,000 530,362 0 .08
Mastercard, Inc. 1.9% 15/03/2031 USD 371,000 316,048 0 .05
Merck & Co., Inc. 0.75% 24/02/2026 USD 420,000 351,449 0 .05
Morgan Stanley 2.625% 09/03/2027 GBP 485,000 605,750 0 .09
MPT Operating Partnership LP, REIT 2.5% 24/03/2026 GBP 258,000 306,361 0 .05
MPT Operating Partnership LP, REIT 3.692% 05/06/2028 GBP 2,000,000 2,483,348 0 .38
NextEra Energy Capital Holdings, Inc. 2.25% 01/06/2030 USD 1,300,000 1,106,397 0 .17
Occidental Petroleum Corp. 5.875% 01/09/2025 USD 400,000 375,575 0 .06
Occidental Petroleum Corp. 4.4% 15/04/2046 USD 222,000 180,728 0 .03
Occidental Petroleum Corp. 4.2% 15/03/2048 USD 60,000 47,542 0 .01
Oracle Corp. 2.875% 25/03/2031 USD 710,000 623,418 0 .10
Oracle Corp. 3.85% 01/04/2060 USD 270,000 241,066 0 .04
PPG Industries, Inc. 1.2% 15/03/2026 USD 233,000 196,066 0 .03
RELX Capital, Inc. 4% 18/03/2029 USD 690,000 660,878 0 .10
RELX Capital, Inc. 3% 22/05/2030 USD 86,000 77,489 0 .01
Thermo Fisher Scientific, Inc. 4.497% 25/03/2030 USD 490,000 492,014 0 .07
T-Mobile USA, Inc. 3.6% 15/11/2060 USD 470,000 404,643 0 .06
Toyota Motor Credit Corp., Reg. S 0.25% 16/07/2026 EUR 959,000 971,393 0 .15
Verizon Communications, Inc. 4.812% 15/03/2039 USD 54,000 57,738 0 .01
Verizon Communications, Inc. 2.65% 20/11/2040 USD 280,000 227,802 0 .03
Walt Disney Co. (The) 2.65% 13/01/2031 USD 214,000 189,516 0 .03
Wells Fargo & Co., Reg. S 0.625% 14/08/2030 EUR 532,000 526,141 0 .08
Welltower, Inc., REIT 2.8% 01/06/2031 USD 376,000 327,622 0 .05
Westlake Chemical Corp. 1.625% 17/07/2029 EUR 412,000 430,941 0 .07
Williams Cos., Inc. (The) 3.75% 15/06/2027 USD 880,000 823,899 0 .13
ZF North America Capital, Inc., Reg. S 2.75% 27/04/2023 EUR 200,000 208,591 0 .03
Zimmer Biomet Holdings, Inc. 1.164% 15/11/2027 EUR 500,000 520,926 0 .08
Zimmer Biomet Holdings, Inc. 3.55% 20/03/2030 USD 464,000 428,442 0 .07
23,161,898 3 .55
Virgin Islands, British JMH Co. Ltd., Reg. S 2.5% 09/04/2031 USD 328,000 280,390 0 .04
JMH Co. Ltd., Reg. S 2.875% 09/04/2036 USD 200,000 170,664 0 .03
TSMC Global Ltd., Reg. S 1% 28/09/2027 USD 397,000 322,756 0 .05
TSMC Global Ltd., Reg. S 2.25% 23/04/2031 USD 960,000 814,177 0 .12
1,587,987 0 .24
Total Bonds 536,150,070 82 .22
Robeco Global Total Return Bond Fund 32

Schedule of Investments (continued)
Robeco Global Total Return Bond Fund As at 30 June 2021
Investments Currency Quantity/
Nominal Value
Market Value EUR
% of Net Assets
Transferable securities and money market instruments admitted to an official exchange listing (continued)
Total Transferable securities and money market instruments admitted to an official exchange listing 536,150,070 82 .22
Transferable securities and money market instruments dealt in on another regulated market
Bonds
Australia FMG Resources August 2006 Pty. Ltd., Reg. S 4.5% 15/09/2027 USD 880,000 806,577 0 .13
FMG Resources August 2006 Pty. Ltd., Reg. S 4.375% 01/04/2031 USD 460,000 414,207 0 .06
Woodside Finance Ltd., Reg. S 4.5% 04/03/2029 USD 750,000 709,406 0 .11
1,930,190 0 .30
Austria Suzano Austria GmbH 3.125% 15/01/2032 USD 476,000 397,530 0 .06
397,530 0 .06
France BNP Paribas SA, Reg. S, FRN 1.323% 13/01/2027 USD 431,000 358,932 0 .05
BPCE SA, Reg. S 2.375% 14/01/2025 USD 270,000 237,039 0 .04
Cars Alliance Auto Leases France V FCT, Reg. S, FRN 'A' 0.138% 21/10/2036 EUR 1,200,000 1,211,269 0 .19
1,807,240 0 .28
Ireland AIB Group plc, Reg. S 4.75% 12/10/2023 USD 800,000 732,307 0 .11
732,307 0 .11
Luxembourg Bavarian Sky SA, Reg. S, FRN 'A' 0% 20/07/2029 EUR 400,000 404,363 0 .06
Compartment VCL 32, Reg. S, FRN, Series 32 'A' 0.152% 21/01/2027 EUR 441,555 444,675 0 .07
Red & Black Auto Lease Germany SA-Compartment 3, Reg. S, FRN 'A' 0.148% 15/09/2031 EUR 600,000 604,447 0 .09
Silver Arrow SA Compartment 13, Reg. S, FRN 'A' 0.148% 15/03/2028 EUR 390,588 393,901 0 .06
1,847,386 0 .28
Netherlands Enel Finance International NV, Reg. S 2.65% 10/09/2024 USD 870,000 770,741 0 .12
Globaldrive Auto Receivables BV, Reg. S, FRN 'A' 0.145% 20/02/2029 EUR 190,802 193,127 0 .03
Green STORM BV, Reg. S, FRN 'A' 0.205% 22/02/2068 EUR 200,000 205,896 0 .03
Mondelez International Holdings Netherlands BV, Reg. S 2% 28/10/2021 USD 750,000 635,124 0 .10
Robeco Global Total Return Bond Fund 33

Schedule of Investments (continued)
Robeco Global Total Return Bond Fund As at 30 June 2021
Investments Currency Quantity/
Nominal Value
Market Value EUR
% of Net Assets
Transferable securities and money market instruments dealt in on another regulated market (continued)
Bonds (continued)
Netherlands (continued) Mondelez International Holdings Netherlands BV, Reg. S 2.25% 19/09/2024 USD 873,000 768,794 0 .12
Saecure BV, Reg. S, FRN 'A' 0.167% 28/04/2093 EUR 133,000 136,390 0 .02
Siemens Financieringsmaatschappij NV, 144A 1.2% 11/03/2026 USD 341,000 287,616 0 .04
Syngenta Finance NV, Reg. S 5.676% 24/04/2048 USD 452,000 461,360 0 .07
3,459,048 0 .53
Norway Aker BP ASA, Reg. S 3.75% 15/01/2030 USD 816,000 741,162 0 .11
741,162 0 .11
Panama Carnival Corp., 144A 9.875% 01/08/2027 USD 600,000 590,695 0 .09
590,695 0 .09
Singapore Temasek Financial I Ltd., 144A 5.375% 23/11/2039 USD 250,000 296,716 0 .05
296,716 0 .05
Sweden Svenska Handelsbanken AB, Reg. S 0.625% 30/06/2023 USD 473,000 400,661 0 .06
Swedbank AB, 144A 1.3% 02/06/2023 USD 288,000 246,415 0 .04
647,076 0 .10
United States of America Apple, Inc. 1.2% 08/02/2028 USD 590,000 490,103 0 .08
AT&T, Inc., 144A 3.5% 15/09/2053 USD 210,000 177,598 0 .03
AT&T, Inc., 144A 3.8% 01/12/2057 USD 210,000 185,049 0 .03
AT&T, Inc. 3.5% 01/02/2061 USD 260,000 214,906 0 .03
Bank of America Corp., FRN 1.658% 11/03/2027 USD 470,000 399,667 0 .06
Booking Holdings, Inc. 4.625% 13/04/2030 USD 347,000 350,032 0 .05
Bristol-Myers Squibb Co. 4.125% 15/06/2039 USD 320,000 326,235 0 .05
Charter Communications Operating LLC 2.8% 01/04/2031 USD 250,000 215,658 0 .03
Charter Communications Operating LLC 4.8% 01/03/2050 USD 180,000 174,871 0 .03
Charter Communications Operating LLC 3.7% 01/04/2051 USD 770,000 646,153 0 .10
Citigroup, Inc., FRN 4.412% 31/03/2031 USD 1,020,000 1,005,550 0 .15
Comcast Corp. 3.3% 01/02/2027 USD 10,000 9,258 –
Comcast Corp. 1.5% 15/02/2031 USD 1,064,000 850,112 0 .13
Daimler Finance North America LLC, 144A 3.45% 06/01/2027 USD 225,000 208,195 0 .03
Daimler Finance North America LLC, 144A 4.3% 22/02/2029 USD 271,000 264,968 0 .04
Fresenius Medical Care US Finance III, Inc., 144A 2.375% 16/02/2031 USD 269,000 221,598 0 .03
Graphic Packaging International LLC, 144A 1.512% 15/04/2026 USD 113,000 94,794 0 .02
Robeco Global Total Return Bond Fund 34

Schedule of Investments (continued)
Robeco Global Total Return Bond Fund As at 30 June 2021
Investments Currency Quantity/
Nominal Value
Market Value EUR
% of Net Assets
Transferable securities and money market instruments dealt in on another regulated market (continued)
Bonds (continued)
United States of America (continued) Intel Corp. 4.75% 25/03/2050 USD 660,000 738,941 0 .11
JPMorgan Chase & Co., FRN 2.956% 13/05/2031 USD 829,000 734,692 0 .11
Metropolitan Life Global Funding I, 144A 1.55% 07/01/2031 USD 469,000 377,051 0 .06
New York Life Global Funding, 144A 0.95% 24/06/2025 USD 840,000 708,542 0 .11
NGPL PipeCo LLC, 144A 3.25% 15/07/2031 USD 105,000 91,293 0 .01
NVIDIA Corp. 2.85% 01/04/2030 USD 880,000 803,418 0 .12
Occidental Petroleum Corp. 4.5% 15/07/2044 USD 270,000 220,243 0 .03
Organon & Co., 144A 4.125% 30/04/2028 USD 200,000 172,068 0 .03
Sprint Corp. 7.125% 15/06/2024 USD 230,000 224,151 0 .04
US Treasury Bill 0% 09/09/2021 USD 7,924,000 6,681,253 1 .03
US Treasury Bill 0% 04/11/2021 USD 15,849,000 13,362,401 2 .05
US Treasury Bill 0% 02/12/2021 USD 15,848,000 13,360,920 2 .05
Wells Fargo & Co., FRN 1.654% 02/06/2024 USD 300,000 258,419 0 .04
Wells Fargo & Co., FRN 5.013% 04/04/2051 USD 171,000 197,535 0 .03
43,765,674 6 .71
Total Bonds 56,215,024 8 .62
Total Transferable securities and money market instruments dealt in on another regulated market 56,215,024 8 .62
Units of authorised UCITS or other collective investment undertakings
Collective Investment Schemes - UCITS
Luxembourg Robeco European High Yield Bonds - ZH EUR † EUR 98,324 16,515,220 2 .53
Robeco Investment Grade Corporate Bonds - ZH EUR † EUR 290,800 40,285,112 6 .18
56,800,332 8 .71
Total Collective Investment Schemes - UCITS 56,800,332 8 .71
Total Units of authorised UCITS or other collective investment undertakings 56,800,332 8 .71
Total Investments 649,165,426 99 .55
Cash 30,472,749 4.67 Other assets/(liabilities) (27,559,929) (4.22) Total net assets 652,078,246 100.00
†Related Party Fund.
Robeco Global Total Return Bond Fund 35

Schedule of Investments (continued)
Robeco Global Total Return Bond Fund As at 30 June 2021
Financial Futures Contracts
Security Description Number of Contracts Currency
Global Exposure
EUR
Unrealised Gain/(Loss)
EUR % of Net
Assets US 2 Year Note, 30/09/2021 (621) USD (115,371,375) 104,650 0 .02
US 10 Year Note, 21/09/2021 253 USD 28,267,560 109,771 0 .02
US 10 Year Ultra Bond, 21/09/2021 27 USD 3,351,450 53,185 0 .01
Canada 10 Year Bond, 21/09/2021 46 CAD 4,558,339 53,252 0 .01
Japan 10 Year Bond, 13/09/2021 16 JPY 18,439,325 10,940 –
Japan 10 Year Bond Mini, 10/09/2021 4 JPY 461,196 426 –
Long Gilt, 28/09/2021 45 GBP 6,715,042 35,168 –
US Long Bond, 21/09/2021 208 USD 28,194,620 746,857 0 .11
US Ultra Bond, 21/09/2021 140 USD 22,747,491 714,825 0 .11
Total Unrealised Gain on Financial Futures Contracts 1,829,074 0 .28
US 5 Year Note, 30/09/2021 1,072 USD 111,574,859 (336,700) (0 .05)
Australia 10 Year Bond, 15/09/2021 82 AUD 7,329,291 (590) –
Euro-Bobl, 08/09/2021 (908) EUR (121,808,200) (118,150) (0 .02)
Euro-BTP, 08/09/2021 (51) EUR (7,721,910) (58,650) (0 .01)
Euro-Bund, 08/09/2021 (157) EUR (27,099,770) (51,950) (0 .01)
Euro-Buxl 30 Year Bond, 08/09/2021 (190) EUR (38,615,600) (585,153) (0 .09)
Euro-OAT, 08/09/2021 (513) EUR (81,587,520) (293,180) (0 .04)
Euro-Schatz, 08/09/2021 568 EUR 63,695,520 (4,920) –
Korea 10 Year Bond, 17/09/2021 54 KRW 5,086,228 (2,336) –
Korea 3 Year Bond, 17/09/2021 89 KRW 7,328,586 (40,479) (0 .01)
Total Unrealised Loss on Financial Futures Contracts (1,492,108) (0 .23)
Net Unrealised Gain on Financial Futures Contracts 336,966 0 .05
Robeco Global Total Return Bond Fund 36

Schedule of Investments (continued)
Robeco Global Total Return Bond Fund As at 30 June 2021
Forward Currency Exchange Contracts
Currency Purchased
Amount Purchased
Currency Sold Amount Sold
Maturity Date Counterparty
Unrealised Gain/(Loss)
EUR % of Net
Assets AUD 5,630 EUR 3,563 15/07/2021 Citibank 1 –
CAD 17,530,158 EUR 11,865,164 15/07/2021 HSBC 68,903 0 .01
CAD 3,000 EUR 2,032 15/07/2021 J.P. Morgan 10 –
CAD 20,100 USD 16,231 15/07/2021 BNP Paribas 1 –
CHF 43,641 USD 47,223 15/07/2021 J.P. Morgan 5 –
CNY 279,990 USD 43,228 15/07/2021 HSBC 78 –
COP 1,303,935,550 USD 347,611 15/07/2021 BNP Paribas 1,152 –
CZK 166,980 CHF 7,159 15/07/2021 HSBC 13 –
CZK 7,715,630 EUR 302,359 15/07/2021 Barclays 30 –
EUR 10,078,189 AUD 15,887,580 15/07/2021 Citibank 22,460 –
EUR 3,380,247 CHF 3,683,040 15/07/2021 Barclays 20,119 –
EUR 3,880 CHF 4,245 15/07/2021 BNP Paribas 7 –
EUR 49,260 CHF 53,819 15/07/2021 J.P. Morgan 159 –
EUR 727,903 CZK 18,545,290 15/07/2021 HSBC 1,082 –
EUR 1,439,723 DKK 10,706,450 15/07/2021 HSBC – –
EUR 5,872,358 GBP 5,040,210 15/07/2021 Citibank 2,426 –
EUR 663,095 GBP 568,930 15/07/2021 HSBC 507 –
EUR 1,851,300 JPY 243,624,760 15/07/2021 BNP Paribas 690 –
EUR 2,508,348 NOK 25,352,846 15/07/2021 Citibank 24,485 0 .01
EUR 2,909,005 SEK 29,407,310 15/07/2021 HSBC 9,874 –
EUR 2,588,830 USD 3,070,513 15/07/2021 Barclays 359 –
EUR 3,208,945 ZAR 53,768,466 15/07/2021 Barclays 39,720 0 .01
GBP 6,648,383 EUR 7,734,596 15/07/2021 Barclays 8,247 –
GBP 5,000 EUR 5,816 15/07/2021 J.P. Morgan 7 –
ILS 3,676,560 EUR 934,976 15/07/2021 HSBC 16,285 –
JPY 2,119,000 EUR 15,899 15/07/2021 Barclays 197 –
JPY 40,881,220,127 EUR 306,149,659 15/07/2021 Citibank 4,390,260 0 .67
JPY 3,537,640 USD 31,875 15/07/2021 HSBC 2 –
KRW 3,390,570 USD 3,000 15/07/2021 BNP Paribas – –
MXN 133,532,166 EUR 5,479,656 15/07/2021 Barclays 164,903 0 .03
MXN 687,970 EUR 29,074 15/07/2021 J.P. Morgan 8 –
NOK 26,100,000 EUR 2,544,691 15/07/2021 HSBC 12,372 –
RUB 95,577,650 EUR 1,095,255 15/07/2021 Barclays 5,722 –
RUB 99,628,410 EUR 1,134,319 15/07/2021 HSBC 13,320 –
SGD 2,149,420 EUR 1,334,840 15/07/2021 HSBC 13,119 –
USD 59,497,377 CNY 380,911,870 15/07/2021 HSBC 474,340 0 .07
USD 849,744 COP 3,067,319,170 15/07/2021 J.P. Morgan 24,299 0 .01
USD 80,000 EUR 67,097 15/07/2021 Barclays 344 –
USD 900,000 EUR 755,114 15/07/2021 BNP Paribas 3,595 –
USD 116,252 EUR 98,000 15/07/2021 Citibank 2 –
USD 1,769,973 EUR 1,479,581 15/07/2021 J.P. Morgan 12,523 –
USD 245,811,302 EUR 202,626,956 15/07/2021 Rabobank 4,594,310 0 .71
USD 7,044,301 IDR 100,212,934,662 15/07/2021 Barclays 133,761 0 .02
USD 23,737 IDR 337,804,880 15/07/2021 UNPUBLISHED 444 –
USD 66,535 JPY 7,333,000 15/07/2021 J.P. Morgan 387 –
USD 9,151,771 KRW 10,178,782,980 15/07/2021 Barclays 121,476 0 .02
USD 2,309,303 MYR 9,495,390 15/07/2021 Barclays 19,711 –
Total Unrealised Gain on Forward Currency Exchange Contracts - Assets 10,201,715 1 .56
Robeco Global Total Return Bond Fund 37

Schedule of Investments (continued)
Robeco Global Total Return Bond Fund As at 30 June 2021
Forward Currency Exchange Contracts (continued)
Currency Purchased
Amount Purchased
Currency Sold Amount Sold
Maturity Date Counterparty
Unrealised Gain/(Loss)
EUR % of Net
Assets AUD 13,423,247 EUR 8,514,955 15/07/2021 Citibank (18,976) –
CAD 3,320 CHF 2,478 15/07/2021 Citibank (1) –
CAD 900,260 EUR 613,084 15/07/2021 Rabobank (211) –
CHF 11,380,425 EUR 10,444,809 15/07/2021 Barclays (62,167) (0 .01)
CHF 740,000 EUR 675,885 15/07/2021 HSBC (765) –
CHF 59,694 EUR 54,475 15/07/2021 J.P. Morgan (14) –
CHF 23,205 GBP 18,180 15/07/2021 Barclays (2) –
CHF 5,613 USD 6,110 15/07/2021 Societe Generale (30) –
CLP 384,244,785 USD 531,784 15/07/2021 HSBC (3,581) –
CNY 71,000 USD 11,074 15/07/2021 HSBC (75) –
COP 3,164,170,870 USD 876,574 15/07/2021 J.P. Morgan (25,067) (0 .01)
CZK 19,073,550 EUR 748,637 15/07/2021 HSBC (1,113) –
DKK 129,480 EUR 17,412 15/07/2021 BNP Paribas – –
DKK 395,070 EUR 53,126 15/07/2021 HSBC – –
EUR 18,631,358 CAD 27,527,000 15/07/2021 HSBC (108,293) (0 .02)
EUR 3,390 CHF 3,716 15/07/2021 HSBC – –
EUR 34,268,305 GBP 29,455,815 15/07/2021 Barclays (36,540) (0 .01)
EUR 907,854 ILS 3,569,910 15/07/2021 HSBC (15,812) –
EUR 9,886 JPY 1,305,000 15/07/2021 BNP Paribas (27) –
EUR 328,948,523 JPY 43,925,631,150 15/07/2021 Citibank (4,717,202) (0 .73)
EUR 402,987 JPY 53,371,000 15/07/2021 J.P. Morgan (2,427) –
EUR 1,742,064 MXN 42,451,870 15/07/2021 Barclays (52,425) (0 .01)
EUR 781,590 MXN 18,494,860 15/07/2021 J.P. Morgan (209) –
EUR 1,567,747 NZD 2,662,146 15/07/2021 BNP Paribas (386) –
EUR 6,230,659 PLN 28,229,651 15/07/2021 HSBC (20,887) –
EUR 1,088,199 RUB 95,577,650 15/07/2021 HSBC (12,779) –
EUR 1,295,299 SGD 2,085,750 15/07/2021 HSBC (12,731) –
EUR 326,231 USD 388,126 15/07/2021 Barclays (963) –
EUR 910,051 USD 1,103,574 15/07/2021 HSBC (20,272) –
EUR 2,563,994 USD 3,059,093 15/07/2021 J.P. Morgan (14,851) –
EUR 325,351,121 USD 394,690,785 15/07/2021 Rabobank (7,376,964) (1 .13)
GBP 600,000 EUR 699,898 15/07/2021 BNP Paribas (1,125) –
GBP 506,970 EUR 590,873 15/07/2021 HSBC (446) –
GBP 13,000 EUR 15,171 15/07/2021 J.P. Morgan (31) –
JPY 164,569,370 EUR 1,250,661 15/07/2021 BNP Paribas (567) –
KRW 10,059,079,350 USD 9,044,145 15/07/2021 Barclays (120,048) (0 .02)
MXN 261,680 USD 13,127 15/07/2021 J.P. Morgan (4) –
MYR 9,982,610 USD 2,427,796 15/07/2021 Barclays (20,723) –
SEK 6,415,195 EUR 634,599 15/07/2021 HSBC (2,154) –
USD 7,485 AUD 10,000 15/07/2021 Societe Generale (19) –
USD 52,811 BRL 269,950 15/07/2021 Citibank (770) –
USD 14,455 CAD 18,000 15/07/2021 J.P. Morgan (68) –
USD 65,005 CNY 420,650 15/07/2021 HSBC (66) –
USD 570,535 EUR 481,003 15/07/2021 Barclays (37) –
USD 35,458 EUR 29,900 15/07/2021 Rabobank (9) –
USD 24,854 GBP 18,000 15/07/2021 Citibank (11) –
USD 618,896 KRW 699,419,740 15/07/2021 BNP Paribas (44) –
USD 1,301,885 RUB 95,577,650 15/07/2021 Citibank (3,475) –
USD 3,837,935 ZAR 55,130,670 15/07/2021 Barclays (14,100) –
Robeco Global Total Return Bond Fund 38

Schedule of Investments (continued)
Robeco Global Total Return Bond Fund As at 30 June 2021
Forward Currency Exchange Contracts (continued)
Currency Purchased
Amount Purchased
Currency Sold Amount Sold
Maturity Date Counterparty
Unrealised Gain/(Loss)
EUR % of Net
Assets Total Unrealised Loss on Forward Currency Exchange Contracts - Liabilities (12,668,467) (1 .94)
Net Unrealised Loss on Forward Currency Exchange Contracts - Liabilities (2,466,752) (0 .38)
Robeco Global Total Return Bond Fund As at 30 June 2021
Interest Rate Swap Contracts
Nominal Amount Currency Counterparty Security Description
Maturity Date
Market Value EUR
% of Net Assets
2,200,000 GBP Barclays Pay fixed 0.216% Receive floating
LIBOR 6 month 06/01/2026 51,494 0 .01
11,650,000 EUR Barclays Pay floating EURIBOR 6 month
Receive fixed 0.285% 14/03/2022 66,104 0 .01
10,168,000 GBP Citigroup Pay floating LIBOR 6 month Receive
fixed 0.779% 03/12/2022 88,585 0 .01
15,200,000 GBP Citigroup Pay fixed 0.275% Receive floating
LIBOR 6 month 25/11/2025 294,129 0 .05
Total Market Value on Interest Rate Swap Contracts - Assets 500,312 0 .08
737,000 GBP Barclays Pay floating LIBOR 6 month Receive
fixed 0.628% 06/01/2041 (75,377) (0 .01)
1,078,000 CAD Barclays Pay floating BA 3 month Receive fixed
1.711% 06/01/2041 (58,958) (0 .01)
13,000,000 GBP Citigroup Pay fixed 0.523% Receive floating
SONIA 1 day 22/06/2026 (42,108) (0 .01)
38,000,000 GBP Citigroup Pay fixed 0.22% Receive floating
SONIA 1 day 21/06/2023 (26,714) –
Total Market Value on Interest Rate Swap Contracts - Liabilities (203,157) (0 .03)
Net Market Value on Interest Rate Swap Contracts - Assets 297,155 0 .05
Robeco Global Total Return Bond Fund 39

Schedule of Investments (continued)
Robeco Global Total Return Bond Fund As at 30 June 2021
Credit Default Swap Contracts
Nominal Amount Currency Counterparty Reference Entity Buy/Sell
Interest (Paid)/
Received Rate
Maturity Date
Market Value EUR
% of Net Assets
20,400,000 USD J.P. Morgan CDX.NA.EM.35-V1 Buy (1.00)% 20/06/2026 450,399 0 .07
Total Market Value on Credit Default Swap Contracts - Assets 450,399 0 .07
28,470,000 USD Citigroup CDX.NA.HY.36-V1 Buy (5.00)% 20/06/2026 (2,451,885) (0 .38)
42,500,000 USD Citigroup CDX.NA.IG.36-V1 Buy (1.00)% 20/06/2026 (909,636) (0 .14)
1,800,000 USD Citigroup Weyerhaeuser Co. 7.13% 15/07/2023 Buy (1.00)% 20/12/2024 (39,878) –
Total Market Value on Credit Default Swap Contracts - Liabilities (3,401,399) (0 .52)
Net Market Value on Credit Default Swap Contracts - Liabilities (2,951,000) (0 .45)
Robeco Global Total Return Bond Fund 40