daimler q2 and half-year 2017 results · q2 and half-year 2017 results / july 26, 2017 / page 21...
TRANSCRIPT

July 26, 2017
Q2 and Half-Year 2017 Results
Q2 and Half-Year 2017 Results / July 26, 2017 /

Daimler AG
Contents
Q2 and Half-Year 2017 Results / July 26, 2017 / Page 2
Results for Q2 2017
Outlook for 2017
Development at the divisions

Daimler AG
Highlights of Q2 2017
Q2 and Half-Year 2017 Results / July 26, 2017 / Page 3
Launch of the new S-Class sedan and start of production of the
E-Class Cabriolet
World premiere of the Concept A Sedan at Auto Shanghai
The Mercedes-Benz Untertürkheim plant will be further developed
into a high-tech location for electric components
Acquisition of 15% of LSH Auto International Limited to foster the
long-lasting cooperation with the Mercedes-Benz dealer group
Laying the foundation stone for the second battery plant in
Kamenz
Unit sales– in thousands of units –
Q2 2016 Q2 2017
761823
+8%
Net profit– in billions of euros –
Q2 2016 Q2 2017
2.5 2.5
+2%
Revenue– in billions of euros –
Q2 2016 Q2 2017
38.641.2
+7%
EBIT– in billions of euros –
Q2 2016 Q2 2017
3.33.7
+15%
Expansion of the ride-hailing business by investments in Clever
Taxi (Romania) and Careem (Dubai)
Presentation of the all-new heavy-duty truck FUSO Super Great

Daimler AG
Strong free cash flow in line with good business development
Q2 and Half-Year 2017 Results / July 26, 2017 / Page 4
Free cash flow industrial business
H1 2017: €3.0 billion
Net industrial
liquidity
12/31/2016
Earnings and
other cash flow
impact
Working capital
impact
Other(mainly FX effects)
Net industrial
liquidity
6/30/2017
+1.0
18.4-0.819.7
+1.9
- in billions of euros -
+0.1
Sale of real
estate in Japan
and M&A effects
-3.5
Dividend payment
Daimler AG

Daimler AG
Strong financial and balance sheet figures support our
financial strength and A-rating
Q2 and Half-Year 2017 Results / July 26, 2017 / Page 5
Daimler Group Dec. 31, 2016 June 30, 2017
Equity ratio 22.9% 24.6%
Gross liquidity 21.7 21.8
Funded status of pension obligations -7.8 -8.1
Funding ratio 75% 74%
Industrial business
Equity ratio 44.7% 47.9%
Net liquidity 19.7 18.4
Free cash flow (January-June) 2.1 3.0
in billions of euros

Daimler AG
Financial flexibility over a 12-month period
Q2 and Half-Year 2017 Results / July 26, 2017 / Page 6
The financial flexibility provides support to mitigate risk and volatility
through a balanced mix of funding instruments and clear principles
Daimler follows a financial management to safeguard our A-rating
and thus our attractive refinancing conditions
Available or short-term accessible liquidity is higher than the total
maturities over the next 12 months
A high financial flexibility is a key support to our A-Rating
The current liquidity position reflects the volatile market
environment, the currently required high investments for our future
business model and the required financial flexibility for our businessAvailable oraccessible
liquidity
42.2
39.5
Maturitiesover next
12 months
Other
Bank loans
Bonds
Accountdeposits
Commercialpaper
- in billions of euros -
Creditfacility
LiquidityFinancialServices
Liquidityindustrialbusiness
ABSpotential

Daimler AG
Higher units sales in all divisions
Q2 and Half-Year 2017 Results / July 26, 2017 / Page 7
Q2 2016 Q2 2017 % change
Daimler Group 761.3 822.5 +8
of which
Mercedes-Benz Cars 546.5 595.2 +9
Daimler Trucks 108.3 116.4 +8
Mercedes-Benz Vans 99.6 103.4 +4
Daimler Buses 7.0 7.5 +8
in thousands of units
Daimler AG
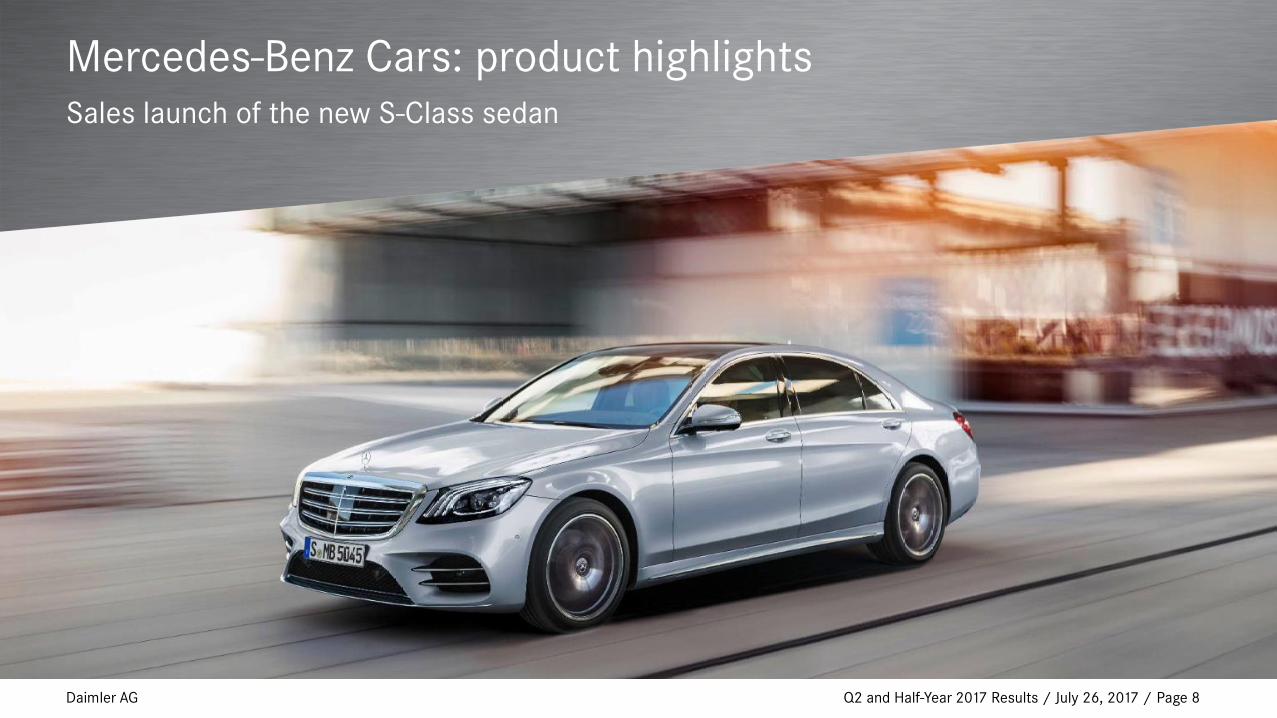
Mercedes-Benz Cars: product highlightsSales launch of the new S-Class sedan
Q2 and Half-Year 2017 Results / July 26, 2017 / Page 8

Daimler AG
Mercedes-Benz Cars: product highlightsSeries production of the new E-Class Cabriolet has started at the plant in Bremen
Q2 and Half-Year 2017 Results / July 26, 2017 / Page 9

Daimler AG
Mercedes-Benz Cars: product highlightsThe Concept A Sedan celebrated its world premiere at Auto Shanghai
Q2 and Half-Year 2017 Results / July 26, 2017 / Page 10

Daimler AG
Daimler Trucks: product highlightsPresentation of the all-new heavy-duty truck FUSO Super Great
Q2 and Half-Year 2017 Results / July 26, 2017 / Page 11

Daimler AG
Daimler Trucks: product highlightsFleetboard – the leading supplier of digital services for connected trucks
Q2 and Half-Year 2017 Results / July 26, 2017 / Page 12

Daimler AG
Mercedes-Benz Vans: product highlightsMercedes-Benz Vito and Sprinter: “CEP* Vans of the Year 2017”
Q2 and Half-Year 2017 Results / July 26, 2017 / Page 13
* courier, express and postal sectors

Daimler AG
Daimler Buses: product highlights
Q2 and Half-Year 2017 Results / July 26, 2017 / Page 14
World premiere of the new touring coach Mercedes-Benz Tourismo RHD

Daimler AG
Daimler Financial Services: highlights Mobility ServicesOngoing business expansion
Q2 and Half-Year 2017 Results / July 26, 2017 / Page 15
Members in millions
Cities
Combined
change*
+118%
+15%
2.6
26
8.2
>65
YTD 06/17
Transactions in millions
+156% 12.5 26.0
* car2go and mytaxi (incl. Taxibeat) combined, 06/17 (YTD) vs. 06/16 (YTD)

Daimler AG
Revenue by division
Q2 and Half-Year 2017 Results / July 26, 2017 / Page 16
Q2 2016 Q2 2017 % change
Daimler Group 38.6 41.2 +7
of which
Mercedes-Benz Cars 22.1 23.6 +7
Daimler Trucks 8.7 9.0 +4
Mercedes-Benz Vans 3.4 3.3 -3
Daimler Buses 1.1 1.2 +3
Daimler Financial Services 5.0 5.9 +18
Contract volume of Daimler Financial Services* 132.6 134.2 +1
in billions of euros
* figures as of December 31, 2016 and June 30, 2017

Daimler AG
Revenue by region
Q2 and Half-Year 2017 Results / July 26, 2017 / Page 17
Q2 2016 Q2 2017 % change
Daimler Group 38.6 41.2 +7
of which
Europe 16.4 17.2 +4
of which Germany 6.2 6.0 -2
NAFTA 11.5 11.8 +3
of which United States 10.0 10.2 +2
Asia 8.4 9.6 +14
of which China* 3.9 4.7 +18
Other markets 2.3 2.6 +13
in billions of euros
* excluding revenue of not fully consolidated companies

Daimler AG
EBIT by division
Q2 and Half-Year 2017 Results / July 26, 2017 / Page 18
Q2 2016 Q2 2017
- EBIT in millions of euros; RoS/RoE in % - EBIT RoS/RoE* EBIT RoS/RoE*
Daimler Group 3,258 8.3 3,746 9.2
of which
Mercedes-Benz Cars 1,410 6.4 2,404 10.2
Daimler Trucks 621 7.2 543 6.0
Mercedes-Benz Vans 401 11.7 358 10.8
Daimler Buses 88 7.8 64 5.5
Daimler Financial Services 479 19.3 522 18.8
Reconciliation 259 – -145 –
* Return on sales for automotive business, return on equity for Daimler Financial Services; Daimler Group excluding Daimler Financial Services

Daimler AG
Group EBIT in Q2 2017
Q2 and Half-Year 2017 Results / July 26, 2017 / Page 19
- in millions of euros -
-465 3,746
-2183,258
+135+278
• Cars +368• Trucks -14• Vans -57• Buses -19
• Cars +83• Trucks +23• Vans +22• Buses +7
• Cars -256• Trucks -127• Vans -68• Buses -14
+715
Actual
Q2 2016
Volume/
Structure/
Net pricing
Foreign
exchange
rates
Other cost
changes
Actual
Q2 2017
ReconciliationFinancial
Services
+43
Disclosed
items
Q2 2016
of which:
• Cars:Remeasurementof inventories +284
Patent dispute +64
• Cars and Vans:Takata airbags +499
• Reconciliation:Pension plan assets -605
Legal proceedings +400

Daimler AG
Contents
Q2 and Half-Year 2017 Results / July 26, 2017 / Page 20
Results for Q2 2017
Outlook for 2017
Development at the divisions

Daimler AG
Mercedes-Benz Cars and Vans: continued product offensive
Q2 and Half-Year 2017 Results / July 26, 2017 / Page 21
E-Class Coupé
E-Class All Terrain E-Class CabrioletS-Class facelift
AMG GT Roadster X-Class smart forfourelectric drive
smart cabrioelectric drive
GLA facelift smart fortwoelectric drive
20182017
Jan. Feb. March May June July August Sept. Oct. Nov. Dec.April

Daimler AG
Assumptions for automotive markets in 2017
Q2 and Half-Year 2017 Results / July 26, 2017 / Page 22
* including light-duty trucks
Car markets
Global
Europe
Medium- and
heavy-duty truck
markets
NAFTA region
EU30
Japan*
Brazil
EU30
Bus marketsEU30
Brazil
+1 to 2%
slight decrease, with Class 8 weaker than Class 6-8
USA
Van markets
Indonesia*
China slight growth
USA
around the prior-year level
around the prior-year level
slight decrease
around the prior-year level
slight growth
significant growth from low level
slight growth
slight decrease
significant growth
slight growth

Daimler AG
2017 sales outlook
Q2 and Half-Year 2017 Results / July 26, 2017 / Page 23
Significantly higher unit sales
Further growth particularly in China and Europe
Strong momentum especially from new E-Class models and SUV portfolio
Slightly higher unit sales
Unit sales around the prior-year level in Europe and Japan; slight growth in North America
Sales in Brazil around the low level of prior year; sales increase in Indonesia and India
Significantly higher unit sales
Significant growth in core market EU30
Continued momentum from “Mercedes-Benz Vans goes global” strategy
Significantly higher unit sales
Maintain market leadership in core markets
Moderate growth in EU30 region, significant sales increase in Brazil
Mercedes-Benz Cars
Daimler Trucks
Mercedes-Benz Vans
Daimler Buses

Daimler AG
2017 outlook for EBIT
Q2 and Half-Year 2017 Results / July 26, 2017 / Page 24
Significantly above the prior-year level
Around the prior-year level
Slightly above the prior-year level
Around the prior-year level
Slightly above the prior-year level
We expect Group EBIT for FY 2017 to increase significantly
based on the following expectations for divisional EBIT:
Mercedes-Benz Cars
Daimler Trucks
Mercedes-Benz Vans
Daimler Buses
Daimler Financial Services

Daimler AG
Contents
Q2 and Half-Year 2017 Results / July 26, 2017 / Page 25
Results for Q2 2017
Outlook for 2017
Development at the divisions

Daimler AG Q2 and Half-Year 2017 Results / July 26, 2017 / Page 26
Mercedes-Benz Cars: continued business growth based on
strong product portfolio
Unit sales – in thousands of units –
Q2 2016 Q2 2017
Revenue– in billions of euros –
EBIT– in millions of euros –
547595
Q2 2016 Q2 2017
22.123.6
Q2 2016 Q2 2017
1,410
2,404
+9% +7% +70%

Daimler AG
Mercedes-Benz Cars: EBIT
Q2 and Half-Year 2017 Results / July 26, 2017 / Page 27
- in millions of euros -
* Return on sales
EBIT
Q2 2016
EBIT
Q2 2017
1,410
2,404
+ 994
6.4%*
10.2%*Higher unit sales
Foreign exchange rates
Negative one-time effects in Q2 2016, mainly
driven by Takata airbags and remeasurement
of inventories
Higher expenses for new technologies and
future products

Daimler AG Q2 and Half-Year 2017 Results / July 26, 2017 / Page 28
Mercedes-Benz Cars: sales increase by 9% reflecting our
strong product line-up- in thousands of units -
Q2 2016
547
595
Q2 2017
112
122
100
18
6
113
128
58
23
6
smart
E-Class
C-Class
A-/B-Class
S-Class
Sports Cars37
40
SUVs180
201

Daimler AG Q2 and Half-Year 2017 Results / July 26, 2017 / Page 29
Mercedes-Benz Cars: globally balanced sales structure
- in thousands of units -
Q2 2016
547
595
Q2 2017
150
78
85
185
117
87
84
172
Rest of world
Germany
United States
China
Europeexcl. Germany
87
97

Daimler AG Q2 and Half-Year 2017 Results / July 26, 2017 / Page 30
Mercedes-Benz Cars in China: huge sales growth with higher
share of locally produced vehicles- in thousands of units -
208239
293
400
305
locally produced
imported
2017
YTD 06
201420132012 2015
108
100
123
116
147
146
150
250
94
211
488
2016
171
317

Daimler AG Q2 and Half-Year 2017 Results / July 26, 2017 / Page 31
Daimler Trucks: unit sales and revenue above, EBIT below
prior year
Unit sales – in thousands of units –
Q2 2016 Q2 2017
Revenue– in billions of euros –
EBIT– in millions of euros –
108116
Q2 2016 Q2 2017
8.7 9.0
Q2 2016 Q2 2017
621543
+8% +4% -13%

Daimler AG
Daimler Trucks: EBIT
Q2 and Half-Year 2017 Results / July 26, 2017 / Page 32
- in millions of euros -
* Return on sales
EBIT
Q2 2016
EBIT
Q2 2017
621543
- 78
7.2%*
6.0%*
Efficiency enhancements
Customer service measures at
Mercedes-Benz Trucks

Daimler AG Q2 and Half-Year 2017 Results / July 26, 2017 / Page 33
Daimler Trucks: sales increase by 8% mainly driven by
Indonesia and Middle East- in thousands of units -
* European Union, Switzerland and Norway
Q2 2016
108116
Q2 2017
20
42
7
36
20
41
7
30
Rest of world
Latin America
NAFTA region
EU30*
Asia
10
11

Daimler AG Q2 and Half-Year 2017 Results / July 26, 2017 / Page 34
Daimler Trucks: incoming orders increase, primarily driven by
NAFTA region and Indonesia
* European Union, Switzerland and Norway
- in thousands of units -
Q2 2016
94
114
Q2 2017
20
36
7
39
20
25
7
32
Rest of world
Latin America
NAFTA region
EU30*
Asia10
12

Daimler AG Q2 and Half-Year 2017 Results / July 26, 2017 / Page 35
Mercedes-Benz Vans: strong development based on very
successful products
Unit sales – in thousands of units –
Q2 2016 Q2 2017
Revenue– in billions of euros –
EBIT– in millions of euros –
99.6 103.4
Q2 2016 Q2 2017
3.4 3.3
Q2 2016 Q2 2017
401358
+4% -11%-3%

Daimler AG
Mercedes-Benz Vans: EBIT
Q2 and Half-Year 2017 Results / July 26, 2017 / Page 36
- in millions of euros -
* Return on sales
EBIT
Q2 2016
EBIT
Q2 2017
401358
- 43
11.7%*
10.8%*
Lower warranty costs
Higher expenses for new technologies and
future products
End of contract manufacturing

Daimler AG Q2 and Half-Year 2017 Results / July 26, 2017 / Page 37
Mercedes-Benz Vans: sales increase by 4% due to market
success of attractive product portfolio- in thousands of units -
Q2 2016
99.6103.4
Q2 2017
7.1
15.7
29.3
51.2
6.9
13.9
24.7
54.1
Vito
V-Class
Citan
Sprinter

Daimler AG Q2 and Half-Year 2017 Results / July 26, 2017 / Page 38
Daimler Buses: positive development driven by strong
European business and higher unit sales in America
Unit sales – in thousands of units –
Q2 2016 Q2 2017
Revenue– in billions of euros –
EBIT– in millions of euros –
7.07.5
Q2 2016 Q2 2017
1.1 1.2
Q2 2016 Q2 2017
88
64
+8% +3% -27%

Daimler AG
Daimler Buses: EBIT
Q2 and Half-Year 2017 Results / July 26, 2017 / Page 39
- in millions of euros -
* Return on sales
EBIT
Q2 2016
EBIT
Q2 2017
88
64
- 24
7.8%*
5.5%*Efficiency enhancements
Lower unit sales in Turkey
Cost inflation in Latin America

Daimler AG Q2 and Half-Year 2017 Results / July 26, 2017 / Page 40
Daimler Buses: sales increase by 8% mainly due to higher
demand in emerging markets- in thousands of units -
Q2 2016
7.0
7.5
Q2 2017
2.2
1.0
2.1
1.3
2.2
0.6
1.8
1.2
Rest of world
Brazil
Mexico
EU30*
Latin America(excl. Brazil and Mexico)
1.2
0.9
* European Union, Switzerland and Norway

Daimler AG Q2 and Half-Year 2017 Results / July 26, 2017 / Page 41
Daimler Financial Services: further business growth
New business – in billions of euros –
Q2 2016 Q2 2017
Contract volume– in billions of euros –
EBIT– in millions of euros –
15.4
17.9
12/31/2016 6/30/2017
132.6 134.2
Q2 2016 Q2 2017
479522
+16% +1% +9%

Daimler AG
Daimler Financial Services: EBIT
Q2 and Half-Year 2017 Results / July 26, 2017 / Page 42
- in millions of euros -
* Return on equity
EBIT
Q2 2016
EBIT
Q2 2017
479522
+ 43
19.3%*18.8%*
Higher contract volume
Cost of risk
Higher interest-rate level

Daimler AG Q2 and Half-Year 2017 Results / July 26, 2017 / Page 43
Daimler Financial Services: further increase in contract
volume to 134.2 billion euros (+1%)- in billions of euros -
12/31/2016
132.6 134.2
6/30/2017
23.0
33.1
51.3
26.7
21.8
31.6
54.2
24.9
Americas
Europe (excl. Germany)
Germany
Africa & Asia-Pacific

Daimler AG Q2 and Half-Year 2017 Results / July 26, 2017 / Page 44
Daimler Financial Services: net credit losses* at low level
due to disciplined risk approach
* as a percentage of portfolio, subject to credit risk
0.69% 0.68%
0.50%
0.61%
0.36%
0.51%
0.89%0.83%
0.43%
0.34% 0.37%0.31%
0.24%0.31%
0.24%
2003 2004 2005 2006 2007 2008 2009 2010 2011 2012 2013 2014 2017
YTD
2015 2016

Daimler AG
Disclaimer
Q2 and Half-Year 2017 Results / July 26, 2017 / Page 45
This document contains forward-looking statements that reflect our current views about future events. The words “anticipate,” “assume,” “believe,”
“estimate,” “expect,” “intend,” “may,” ”can,” “could,” “plan,” “project,” “should” and similar expressions are used to identify forward-looking statements.
These statements are subject to many risks and uncertainties, including an adverse development of global economic conditions, in particular a decline of
demand in our most important markets; a deterioration of our refinancing possibilities on the credit and financial markets; events of force majeure
including natural disasters, acts of terrorism, political unrest, armed conflicts, industrial accidents and their effects on our sales, purchasing, production
or financial services activities; changes in currency exchange rates; a shift in consumer preferences towards smaller, lower-margin vehicles; a possible
lack of acceptance of our products or services which limits our ability to achieve prices and adequately utilize our production capacities; price increases
for fuel or raw materials; disruption of production due to shortages of materials, labor strikes or supplier insolvencies; a decline in resale prices of used
vehicles; the effective implementation of cost-reduction and efficiency-optimization measures; the business outlook for companies in which we hold a
significant equity interest; the successful implementation of strategic cooperations and joint ventures; changes in laws, regulations and government
policies, particularly those relating to vehicle emissions, fuel economy and safety; the resolution of pending government investigations or of
investigations requested by governments and the conclusion of pending or threatened future legal proceedings; and other risks and uncertainties, some
of which we describe under the heading “Risk and Opportunity Report” in the current Annual Report. If any of these risks and uncertainties materializes
or if the assumptions underlying any of our forward-looking statements prove to be incorrect, the actual results may be materially different from those
we express or imply by such statements. We do not intend or assume any obligation to update these forward-looking statements since they are based
solely on the circumstances at the date of publication.