dairy development programs in andhra pradesh, india: · pdf filedairy development programs in...
TRANSCRIPT

A Living fromLivestock
Pro-PoorLivestockPolicyInitiative
Dairy Development Programs inAndhra Pradesh, India: Impacts and
Risks for Small-scale Dairy Farms
PPLPI Working Paper No. 38
Otto Garcia, Amit Saha, Khalid Mahmood,Asaah Ndambi and Torsten Hemme
International Farm Comparison
Network (IFCN)

i
TABLE OF CONTENTS
Preface.................................................................................................................. ii 1. Executive Summary................................................................................................ 1
Introduction......................................................................................................... 1 Methodology ........................................................................................................ 1 Trends of Milk production in India and Andhra Pradesh ..................................................... 2 Results: Comparison of ‘Typical Dairy Farms’ in Andhra Pradesh.......................................... 2 Results: Assessment of Dairy Development Programs in Mahboobnagar .................................. 3 Conclusion........................................................................................................... 8
2. Introduction......................................................................................................... 9 2.1 Overview....................................................................................................... 9 2.2 Objectives ..................................................................................................... 9 2.3 Methodology................................................................................................... 9 2.4 Structure of the Paper......................................................................................10
3. Milk Production and Farm Comparison in Andhra Pradesh .................................................11 3.1 India - Dairy in the National Context.....................................................................11 3.2 Andhra Pradesh - Dairy in the Regional Context .......................................................13 3.3 Description of ‘Typical’ Dairy Farms in Andhra Pradesh ..............................................15 3.4 Farm Comparison: Household Approach .................................................................17 3.5 Farm Comparison: Whole Farm Approach ...............................................................19 3.6 Farm Comparison: Dairy Enterprise Approach ..........................................................21 3.7 Summary ......................................................................................................25
4. Evaluation of Dairy Development Programs in Andhra Pradesh ...........................................26 4.1 Introduction ..................................................................................................26 4.2 Methodology..................................................................................................26 4.3 Farm-level Risk Analysis of Dairy Development Programs ............................................27 4.4 Feeding Programs ...........................................................................................28 4.5 Milk Marketing Programs ...................................................................................33 4.6 Husbandry Programs ........................................................................................36 4.7 Breeding Programs ..........................................................................................41 4.8 Animal Health Programs....................................................................................45 4.9 Summary: Ranking Program Impacts on Household Incomes .........................................49 4.10 Summary: Ranking Program Impacts on Return to Labour ...........................................51 4.11 Summary: Ranking Program Impacts on Dairy Competitiveness.....................................53
5. Dairy Development Ladder for Mahboobnagar ...............................................................55 5.1 Introduction ..................................................................................................55 5.2 Overview of the Dairy Development Ladder ............................................................55 5.3 Economic Outcomes.........................................................................................57 5.4 Conclusion ....................................................................................................57
6. Conclusions ........................................................................................................59
Annexes A1 Methodological Background....................................................................................61 A2 IFCN Method: Costs of Production Calculations.............................................................63
Cost Calculation...................................................................................................63 A3 Description of IFCN Result Variables .........................................................................66
Cost of Milk Production (only) ..................................................................................66 A4 Milk Production in ANDHRA PRADESH.........................................................................68 A5 Dairy Production Systems in Andhra PRADESH ..............................................................69 A 6 Major Stakeholders and Supply Chain in the Andhra......................................................70 A7 Risk Variables and Assumptions ...............................................................................71
Selection of stochastic variables ...............................................................................71 Standardized Man Equivalent ...................................................................................71
References ............................................................................................................72

For more information visit the PPLPI website at: http://www.fao.org/ag/pplpi.html or contact: Joachim Otte - Programme Coordinator of the Pro-Poor Livestock Policy Facility Email: [email protected] Tel: +39 06 57053634 Fax: +39 06 57055749 Food and Agriculture Organization - Animal Production and Health Division Viale delle Terme di Caracalla 00100 Rome, Italy
ii
PREFACE
This is the 38th of a series of Working Papers prepared for the Pro-Poor Livestock Policy Initiative (PPLPI). The purpose of these papers is to explore issues related to livestock development in the context of poverty alleviation.
Livestock is vital to the economies of many developing countries. Animals are a source of food, more specifically protein for human diets, income, employment and possibly foreign exchange. For low income producers, livestock can serve as a store of wealth, draught power, fuel and organic fertiliser for crop production and a means of transport. Consumption of livestock and livestock products in developing countries, though starting from a low base, is growing rapidly.
The study applies a method of economic analysis developed by the International Farm Comparison Network (IFCN), which is based on the concept of ‘typical farms’, to assess the potentials of dairy development in the Indian state of Andhra Pradesh. The state was divided into two zones with distinct levels of milk production densities: a high and a low density milk production areas. Three broad farm types were selected to represent typical farms from each of these regions: landless farming systems with 1 local cow or buffalo, small farmers with 2 to 3 buffaloes and commercial farms with 11 to 14 cows or buffaloes. Farms with 2 to 3 dairy animals and 1 to 2 ha land represent the most common farm type found in the state. Each farm is described in detail with assets, production costs, profits and other economic information presented both graphically and in the text. Dairy development interventions and their potential impacts on household income, return to labour and costs of milk production are explored.
Although this study is seen as a research method development exercise, we hope it will provide useful information to its readers and any feedback on method improvements and results is much welcome by the authors, PPLPI and the Livestock Information, Sector Analysis and Policy Branch (AGAL) of the Food and Agriculture Organization (FAO).
Disclaimer The designations employed and the presentation of material in this publication do not imply the expression of any opinion whatsoever on the part of the Food and Agriculture Organization of the United Nations concerning the legal status of any country, territory, city or area or its authorities or concerning the delimitations of its frontiers or boundaries. The opinions expressed are solely those of the author(s) and do not constitute in any way the official position of the FAO.
Furthermore, neither the authors nor any other legal entities related to the IFCN activities accept any liability whatsoever for any direct or consequential loss howsoever arising from any of the IFCN material or its content or otherwise arising in connection herewith.
Authors Otto Garcia, PhD: Dairy economist, Dairy Development Initiative and the IFCN Dairy Research Centre, Germany. Email: [email protected] Amit Saha, PhD: Dairy economist, Post doctoral fellow at FAL-Federal Agricultural Research Centre, Germany (Until October 2005) (He is currently at NDDB, India). Khalid Mahmood, MBA: Dairy economist, IFCN Dairy Research Centre, Germany

Preface
For more information visit the PPLPI website at: http://www.fao.org/ag/pplpi.html or contact: Joachim Otte - Programme Coordinator of the Pro-Poor Livestock Policy Facility Email: [email protected] Tel: +39 06 57053634 Fax: +39 06 57055749 Food and Agriculture Organization - Animal Production and Health Division Viale delle Terme di Caracalla 00100 Rome, Italy iii
Asaah Ndambi, MSc: Dairy economist, IFCN Dairy research Centre, Germany Torsten Hemme, PhD: Head IFCN Dairy Research Centre, Germany.
Keywords Costs of production, India, Impact analysis, Andhra Pradesh, Policy, Poverty reduction, Small-scale dairy, Typical farms, Risk analysis, Dairy development.
Date of publication: 25 September 2006

1
1. EXECUTIVE SUMMARY
Introduction
Andhra Pradesh is one of the agriculturally most advanced states in India but still has high levels of rural poverty. Mixed crop-livestock farming is the predominant farming system practiced by over 80 percent of rural households in the state. Of the total livestock population, bovines accounted for about 41 percent in 2003 (GoAP, 2004). In the rural economy, milk is one of the most important products of cattle and buffalo enterprises, contributing over 51.5 percent of the value of all livestock output and 1 billion US-$ of value added at constant 1993-94 prices in 2002-03 (GoAP, 2002-03). Other products include manure, fuel, draught power, meat, bones, skins and hides. With landless, marginal and small operational holdings (< 2 hectare land) accounting for nearly 80 percent of the 12.6 million farming households (GoAP, 2004), increasing milk production from these farm types could be an efficient way to improve rural livelihoods.
The main purposes of this study were to: (1) Gain insights into the household /dairy farming economics in Andhra Pradesh, (2) Assess the impact of the main dairy development activities on household income
and on the economic competitiveness of typical dairy farms in the state, (3) Evaluate the impacts of the main development activities on the risk profiles of the
farms, and (4) Assess the impact of combined dairy development programs on the economic and
risk profiles of typical farms in the state.
In order to achieve the above, a methodology to quantify the farm-level impacts of different local dairy development programs, policies, interventions and ideas as seen by local dairy stakeholders (policy makers, farmers, milk processors, NGOs, etc.) was developed. The results are intended to inform the political process to initiate discussion for finding the most efficient dairy development activities.
Methodology
The methodology applied for the economic analysis was developed by the International Farm Comparison Network (IFCN) and utilizes the concept of typical farms. Farm types are determined by regional dairy experts taking into consideration (a) location of the farm, (b) farm size in terms of herd size and (c) the production systems that make important contributions to milk production in the region among other key criteria. Two regions, the highly dense milk production region of Guntur and the less dense of Mahboobnagar districts were selected. From each of the districts, a first category of farms (small farmers) was chosen to represent the size that is closest to the statistical average (2 and 3 buffaloes) for both districts, respectively. As customary in IFCN, larger and smaller farm types were selected to evaluate the potential for economies of scale effects and other predominant production systems in the regions. Therefore, the selected farms include landless, grazing and stall-feeding production systems consisting of local and/or crossbred cows and buffaloes. Management levels on the typical farms are average to slightly above average compared to other farms of the same type. Data is collected using a standard questionnaire.
The calculations are based on the computer simulation model, TIPI-CAL (Technology Impact and Policy Impact Calculations) version 4.0. This version has been developed in the years 2005-2006 to better represent the complexity of small scale dairy farming and to capture the various risks faced by dairy farmers.

1. Executive Summary
2
This is the first ‘dairy development policy evaluation study’ done within the IFCN Dairy Research Network. Although great efforts were made both to include all major dairy development programs and to model their economic, social and biological complexities, the authors invite readers’ comments on the plausibility of the development pathways and their results and welcome suggestions for improvements of the research methodology utilized (Please contact Otto Garcia at: [email protected]).
Trends of Milk production in India and Andhra Pradesh
India produced about 92 million tons of milk in 2004, accounting for 15 percent of total world milk production. Average milk yield in India, at 800 kg per dairy animal per year have been increasing steadily between 1996 and 2003 at an average annual rate of 3.8 percent.
Andhra Pradesh (AP) accounts for 8.4 percent of the national dairy animal population and produces 7.6 percent of the country’s milk. Andhra Pradesh’s milk production comes mostly from farms of less than 2 hectares with 1 to 4 dairy animals. The milk yields in Andhra Pradesh are slightly higher than the Indian average and are increasing at a faster rate. Farm gate milk prices, however, are slightly lower than the average for India.
Results: Comparison of ‘Typical Dairy Farms’ in Andhra Pradesh
Based on dairy development and agro-climatic features, the state of Andhra Pradesh can be classified into two zones, progressive and lagging. Following the IFCN methodology, in the progressive Guntur district three farm types GR-1, GR-2 and GR-11 were identified as ‘typical’. In the lagging Mahboobnagar district another three farm types, MN-1, MN-3, and MN-14 were chosen. These farm types provide a picture of income levels, possible economies of scale and the effect of commercialization.
Household comparison Household incomes range from 1,000 to 4,000 US-$ per year. The landless farms in both regions and the medium-sized farm in Mahboobnagar are unable to achieve a daily household income above the 1 US-$ per person mark. In contrast, the small farm in the progressive zone surpasses (GR-2) exceeds the 1 US-$/capita/day income level, which is mainly due to higher off-farm income.
Comparison of the dairy enterprise - Costs of milk production Farmers in both regions receive total returns from 18 to 27 US-$ per 100 kg ECM milk produced (includes cash and non-cash quantifiable benefits). They, however incur total costs of 16 to 38 US-$, when family labour, imputed at local wage rate, is included. This means that only the largest farms in both regions make an entrepreneurial profit. On the other hand, if family labour is excluded from the calculation, all farms make a dairy income of 5 to 10 US-$ per 100 kg ECM. This income from dairy production is relatively higher in the less dense milk production region, which explains the trend of a faster growing buffalo population in MN-3 like households in Mahboobnagar as compared to Guntur. These returns to dairy production (from cash and non-cash benefits) and the lack of better alternative uses of their production factors are the main reasons for these small farms to keep operating.

1. Executive Summary
3
Results: Assessment of Dairy Development Programs in Mahboobnagar
Mahboobnagar represents a fairly typical dairy situation, in which larger farms (like MN-14) are very competitive milk producers while the vast majority of smaller farms (like MN-3) are economically unattractive and would be expected to significantly decrease in number as soon as these households have better alternatives. This critical situation of small-scale farms persists in spite of numerous dairy development activities long in existence in the region. Therefore, this study assesses the farm-level impact of over 40 potential dairy development programs, activities and farmers’ ideas in Mahboobnagar for farm type MN-3. Finally, several of these programs and ideas are combined to assess the feasibility of bringing MN-3’s dairy competitiveness level up to that of the larger farms in the region. The results of the program assessments are summarized in the following four pages.
Impacts on Household Income Current situation: The MN-3 household currently achieves a total income of 0.80 US-$ per capita per day. The dairy activities contribute 0.13 US-$ or 16 percent to the daily per capita household income. With this per capita income, this household can afford considerably low living standards, which has no yet set benchmark under Indian conditions.
Dairy development program impacts: The analysed dairy development programs have the potential to increase the per capita household income by up to 27 percent above its current situation.
Four programs would result in a significant income improvement for the household. These are those in which a) the farm produces fodder rather than milk for sale (this scenario assumes a fodder market and more off-farm work), b) the household ‘sells’ as much family labour as possible on the labour market (a maximum of 2,700 man-hours per year is assumed for this family), c) the three local buffaloes are replaced with two well-managed grade buffaloes, and d) herd size is increased to five grade buffaloes.
Potential improvement for MN-3: Although all of the above programs individually have large impacts on the dairy activities, none of them is able to lift the family to the 1 US-$/person/day line. This is explained by the low share of dairy income (only 16 percent) in the total household income.
Impacts on Dairy Competitiveness on the Local Labour Market Current situation The family makes returns of 0.047 US-$ per hour of (man equivalent) labour invested in the dairy as compared to 0.11 US-$ per hour received for off-farm work. However, the family’s off-farm employment is limited to 2,700 hours per year and is seasonally bound. The family will therefore maintain its dairy activities unless more attractive employment opportunities arise.
Dairy development program impacts: The programs analysed increase the return to dairy labour by up to 145 percent above the current situation. Seven programs increase the return to labour in the dairy above 0.10 US-$ per hour bringing it close to the local wage rate.
The most promising programs are those where a) the farmer gains access to more fodder from public land, b) he joins the drought-relief cattle camp, and c) he expands his herd to five grade buffaloes which are well-managed. On the other hand, returns to labour decrease when the farmer purchases costly livestock (life) insurance, when he joins a cooperative and receives a lower milk price and when he utilizes distant (public) veterinary services.

1. Executive Summary
4
Potential improvement for MN-3: Although about every fourth of the programs assessed decrease the dairy return to labour, another fourth of them increase the latter to a level very close to off farm wages for unskilled labour. In other words, the woman and children attending the dairy could earn a ‘wage’ similar to that of the husband working off-farm.
Impacts on Competitiveness of Milk Production Current situation: The full economic costs of milk production are 24 US-$ per 100 kg ECM milk while the milk price received is only 16.5 US-$.
Dairy development program Impacts: Nearly all programs decrease the costs of producing milk, some by as much as 33 percent.
The programs impacting most positively and also negatively on the dairy farm competitiveness in milk production are the same as those impacting on the dairy return to labour (mentioned previously).
Potential improvement for of MN-3: The programs F-Bank, C-Camp, 5-Grade can bring MN-3’s production costs down to 16 US-$ per 100 kg milk, which creates a competitive milk producer both locally and globally.

1. Executive Summary
5
Dairy Development Program Impact Evaluation – Farm MN-3
Programs Feeding Breeding & + Loans
Household income
Dairy competitiveness on the local labour market
Competitiveness of milk production
Marketing Animal Husbandry Animal Health
Household per capita income
0.00
0.20
0.40
0.60
0.80
1.00
1.20
MN
-3C
-Cam
pU
reaS
traw
Gro
undn
utAl
lStra
wG
-Fod
der
GF-
Cut
ter
Fban
kVc
omm
ons
Fallo
wLa
ndC
attle
Feed
Com
plet
Feed
C-m
embr
QtrC
oop
C-p
lant
C-C
oolin
gFa
tom
atic
Coo
pUni
onFo
dder
Sale
sLa
bour
Sale
sW
SHG
Coo
p-12
Wat
erin
gC
alfR
earin
gPr
enat
alSt
all F
eedi
ngBu
ildin
gYi
eld
DIM
Yiel
d+D
IM
Her
d-R
educ
t1-
Gra
d+Lo
an1-
Gra
d2-
Gra
d+Lo
an2-
Gra
d3-
Gra
d+Lo
an3-
Gra
d5-
Gra
d
Vacc
ines
Vet-C
linic
Vet-2
-Far
mH
ealth
-INS
INS-
Solo
INS-
Coo
pIN
S-W
SHG
US$
/ C
apita
/ Day
Per capita income/ dayBaseline1 US$/ Capita/ Day Line
Return to labour input in the dairy enterprise
0.00
0.02
0.04
0.06
0.08
0.10
0.12
MN
-3C
-Cam
pU
reaS
traw
Gro
undn
utAl
lStra
wG
-Fod
der
GF-
Cut
ter
Fban
kVc
omm
ons
Fallo
wLa
ndC
attle
Feed
Com
plet
Feed
C-m
embr
QtrC
oop
C-p
lant
C-C
oolin
gFa
tom
atic
Coo
pUni
onFo
dder
Sale
sLa
bour
Sale
sW
SHG
Coo
p-12
Wat
erin
gC
alfR
earin
gPr
enat
alSt
all F
eedi
ngBu
ildin
gYi
eld
DIM
Yiel
d+D
IM
Her
d-R
educ
t1-
Gra
d+Lo
an1-
Gra
d2-
Gra
d+Lo
an2-
Gra
d3-
Gra
d+Lo
an3-
Gra
d5-
Gra
d
Vacc
ines
Vet-C
linic
Vet-2
-Far
mH
ealth
-INS
INS-
Solo
INS-
Coo
pIN
S-W
SHG
US$/
hou
r
Return to Labour Baseline Regional wage rate
Costs of milk production (only)
0
5
10
15
20
25
30
MN
-3C
-Cam
pU
reaS
traw
Gro
undn
utAl
lStra
wG
-Fod
der
GF-
Cut
ter
Fban
kVc
omm
ons
Fallo
wLa
ndC
attle
Feed
Com
plet
Feed
C-m
embr
QtrC
oop
C-p
lant
C-C
oolin
gFa
tom
atic
Coo
pUni
onFo
dder
Sale
sLa
bour
Sale
sW
SHG
Coo
p-12
Wat
erin
gC
alfR
earin
gPr
enat
alSt
all F
eedi
ngBu
ildin
gYi
eld
DIM
Yiel
d+D
IM
Her
d-R
educ
t1-
Gra
d+Lo
an1-
Gra
d2-
Gra
d+Lo
an2-
Gra
d3-
Gra
d+Lo
an3-
Gra
d5-
Gra
d
Vacc
ines
Vet-C
linic
Vet-2
-Far
mH
ealth
-INS
INS-
Solo
INS-
Coo
pIN
S-W
SHG
US$
/ 100
Kg
ECM
Costs from P&L account - non-milk returns Opportunity costs Baseline costs level Milk price

1. Executive Summary
6
This assessment of dairy development programs paid particular attention to the risks associated with each of the programs by introducing stochastic elements into the program assessment. The following input variables were made stochastic by introducing probability distributions rather than mean values into the simulations: Milk price, milk yield per cow, livestock prices, mortality rates, prices for purchased feed, crop yield and prices, and wage rate of hired labour. The assessment therefore also provides estimates of probabilities of the programs leading to specified results.
Risk Profile for Impacts on Household Income Current situation: Household MN-3 runs a 0.53 risk of achieving a daily per capita income below 0.80 US-$. The chance of achieving an income of 1 US-$ or higher are very slim at 0.01.
Dairy development program impacts: Some of the assessed dairy programs have the potential to more than double the probability of the household to achieve a per capita income of at least 0.80 US-$ and they increase MN-3’s chances to make an income above 1 US-$/capita/day from 0.01 up to 0.30.
Ranking of the programs: The most promising programs are those in which the farmer improves the dairy genetics and steps up the husbandry practices/management. Purchasing costly livestock life insurance for local buffaloes decreases the chances of reaching the current per capita income.
Risk Profile for Impacts on Dairy Competitiveness on the Local Labour Market Current situation: The family currently has 0.45 risk of its dairy labour return to fall below 0.047 US-$/man-equivalent hour while the chance of achieving a dairy return to labour equal to the local wage rate is nil.
Dairy development program impacts: Some of the dairy programs analysed reduce the risk of MN-3 to make a return to labour below the current situation from 0.45 to 0.10. However, four programs increase the risks to MN-3’s returns to labour while three other programs virtually do not change the probability of achieving the current returns. Interestingly, five dairy programs increase the probability that MN-3 return to labour surpasses the regional wage level to close to 0.30.
Ranking of the programs: The feeding programs have the highest impact on the risk of falling below the current return to labour, while purchasing livestock insurance for local buffaloes, stall feeding of local buffaloes and receiving a lower milk price, in this case from the cooperative, clearly increase the risk of not achieving MN-3’s current return to labour.
Risk Profile for Impacts on Competitiveness of Milk Production Current situation: The chance that MN-3 brings it cost of milk production down to the milk price level are nil. This means that, when all the used family resources are imputed, this farm type cannot cover its full economic costs.
Dairy development program impacts: All but three of the assessed programs increase the probability of MN-3’s cost of milk production to be closer to the milk price received. However, the chance to fully cover costs and make an entrepreneurial profit only reaches 0.12 in the best program (5-Grade).
Ranking of the programs: The programs impacting most positively the dairy farm’s competitiveness of milk production are first the feeding programs followed by the breeding and herd-expansion programs. Buying livestock life insurance for the local

1. Executive Summary
7
animals, either as a individual or as a cooperative member, do not result in any improvement of the probability of achieving more competitive milk production costs.
Risk Profiles for Impacts of Dairy Development Programs – Farm MN-3
Programs Feeding Breeding & + Loans
Household income
Dairy competitiveness on the local labour market
Competitiveness of milk production
Animal HealthAnimal HusbandryMarketing
Probability of household income to be:
0%
10%
20%
30%
40%
50%
60%
70%
80%
90%
100%
MN
-3C
-Cam
pU
reaS
traw
Gro
undn
utAl
lStra
wG
-Fod
der
GF-
Cut
ter
Fban
kVc
omm
ons
Fallo
wLa
ndC
attle
Feed
Com
plet
Feed
C-m
embr
QtrC
oop
C-p
lant
C-C
oolin
gFa
tom
atic
Coo
pUni
onFo
dder
Sale
sLa
bour
Sale
sW
SHG
Coo
p-12
Wat
erin
gC
alfR
earin
gPr
enat
alSt
all F
eedi
ngBu
ildin
gYi
eld
DIM
Yiel
d+D
IM
Her
d-R
educ
t1-
Gra
d+Lo
an1-
Gra
d2-
Gra
d+Lo
an2-
Gra
d3-
Gra
d+Lo
an3-
Gra
d5-
Gra
d
Vacc
ines
Vet-C
linic
Vet-2
-Far
mH
ealth
-INS
INS-
Solo
INS-
Coo
pIN
S-W
SHG
Below Baseline Between Baseline & 1 US$ line Above 1 US$/ Cap/ Day line
Probability of return to dairy labour to be:
0%
10%
20%
30%
40%
50%
60%
70%
80%
90%
100%
MN
-3C
-Cam
pU
reaS
traw
Gro
undn
utAl
lStra
wG
-Fod
der
GF-
Cut
ter
Fban
kVc
omm
ons
Fallo
wLa
ndC
attle
Feed
Com
plet
Feed
C-m
embr
QtrC
oop
C-p
lant
C-C
oolin
gFa
tom
atic
Coo
pUni
onFo
dder
Sale
sLa
bour
Sale
sW
SHG
Coo
p-12
Wat
erin
gC
alfR
earin
gPr
enat
alSt
all F
eedi
ngBu
ildin
gYi
eld
DIM
Yiel
d+D
IM
Her
d-R
educ
t1-
Gra
d+Lo
an1-
Gra
d2-
Gra
d+Lo
an2-
Gra
d3-
Gra
d+Lo
an3-
Gra
d5-
Gra
d
Vacc
ines
Vet-C
linic
Vet-2
-Far
mH
ealth
-INS
INS-
Solo
INS-
Coo
pIN
S-W
SHG
Below baseline Between baseline and regional wage Above regional wage level
Probability of cost of milk production to be:
0%
10%
20%
30%
40%
50%
60%
70%
80%
90%
100%
MN
-3C
-Cam
pU
reaS
traw
Gro
undn
utAl
lStra
wG
-Fod
der
GF-
Cut
ter
Fban
kVc
omm
ons
Fallo
wLa
ndC
attle
Feed
Com
plet
Feed
C-m
embr
QtrC
oop
C-p
lant
C-C
oolin
gFa
tom
atic
Coo
pUni
onFo
dder
Sale
sLa
bour
Sale
sW
SHG
Coo
p-12
Wat
erin
gC
alfR
earin
gPr
enat
alSt
all F
eedi
ngBu
ildin
gYi
eld
DIM
Yiel
d+D
IM
Her
d-R
educ
t1-
Gra
d+Lo
an1-
Gra
d2-
Gra
d+Lo
an2-
Gra
d3-
Gra
d+Lo
an3-
Gra
d5-
Gra
d
Vacc
ines
Vet-C
linic
Vet-2
-Far
mH
ealth
-INS
INS-
Solo
INS-
Coo
pIN
S-W
SHG
Above milk price +/- 10% around milk price Below milk price
1. Executive Summary
8
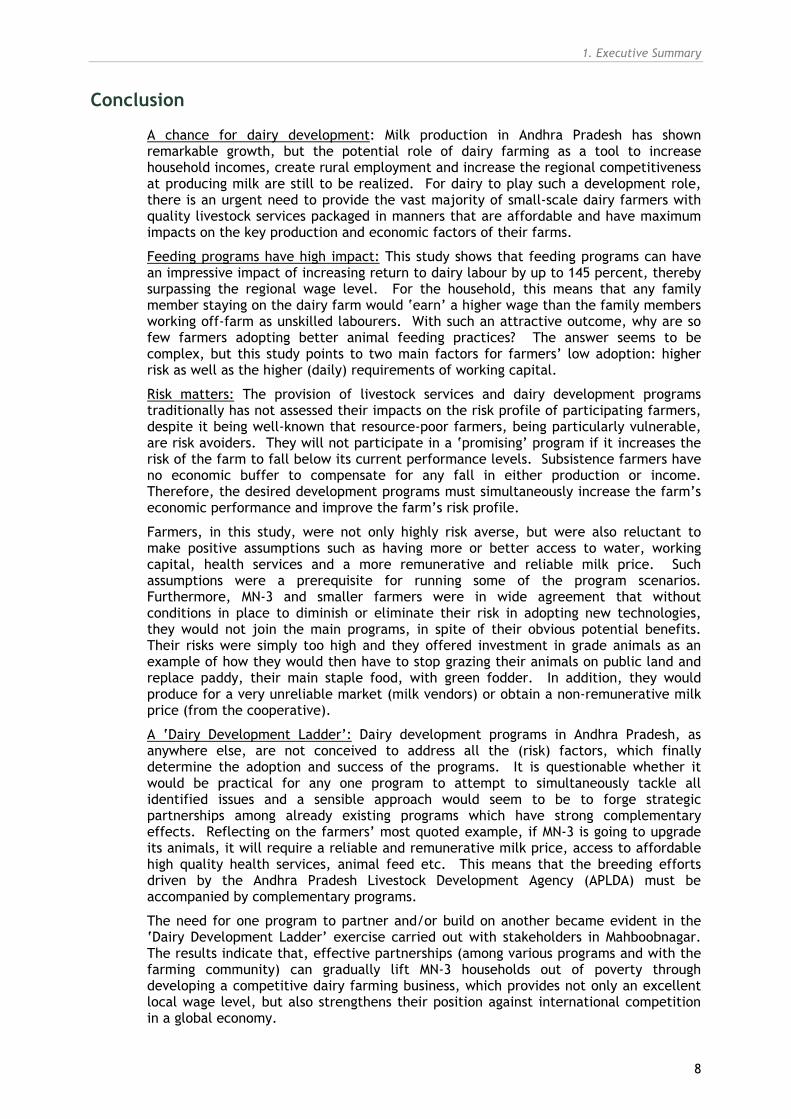
Conclusion
A chance for dairy development: Milk production in Andhra Pradesh has shown remarkable growth, but the potential role of dairy farming as a tool to increase household incomes, create rural employment and increase the regional competitiveness at producing milk are still to be realized. For dairy to play such a development role, there is an urgent need to provide the vast majority of small-scale dairy farmers with quality livestock services packaged in manners that are affordable and have maximum impacts on the key production and economic factors of their farms.
Feeding programs have high impact: This study shows that feeding programs can have an impressive impact of increasing return to dairy labour by up to 145 percent, thereby surpassing the regional wage level. For the household, this means that any family member staying on the dairy farm would ‘earn’ a higher wage than the family members working off-farm as unskilled labourers. With such an attractive outcome, why are so few farmers adopting better animal feeding practices? The answer seems to be complex, but this study points to two main factors for farmers’ low adoption: higher risk as well as the higher (daily) requirements of working capital.
Risk matters: The provision of livestock services and dairy development programs traditionally has not assessed their impacts on the risk profile of participating farmers, despite it being well-known that resource-poor farmers, being particularly vulnerable, are risk avoiders. They will not participate in a ‘promising’ program if it increases the risk of the farm to fall below its current performance levels. Subsistence farmers have no economic buffer to compensate for any fall in either production or income. Therefore, the desired development programs must simultaneously increase the farm’s economic performance and improve the farm’s risk profile.
Farmers, in this study, were not only highly risk averse, but were also reluctant to make positive assumptions such as having more or better access to water, working capital, health services and a more remunerative and reliable milk price. Such assumptions were a prerequisite for running some of the program scenarios. Furthermore, MN-3 and smaller farmers were in wide agreement that without conditions in place to diminish or eliminate their risk in adopting new technologies, they would not join the main programs, in spite of their obvious potential benefits. Their risks were simply too high and they offered investment in grade animals as an example of how they would then have to stop grazing their animals on public land and replace paddy, their main staple food, with green fodder. In addition, they would produce for a very unreliable market (milk vendors) or obtain a non-remunerative milk price (from the cooperative).
A ‘Dairy Development Ladder’: Dairy development programs in Andhra Pradesh, as anywhere else, are not conceived to address all the (risk) factors, which finally determine the adoption and success of the programs. It is questionable whether it would be practical for any one program to attempt to simultaneously tackle all identified issues and a sensible approach would seem to be to forge strategic partnerships among already existing programs which have strong complementary effects. Reflecting on the farmers’ most quoted example, if MN-3 is going to upgrade its animals, it will require a reliable and remunerative milk price, access to affordable high quality health services, animal feed etc. This means that the breeding efforts driven by the Andhra Pradesh Livestock Development Agency (APLDA) must be accompanied by complementary programs.
The need for one program to partner and/or build on another became evident in the ‘Dairy Development Ladder’ exercise carried out with stakeholders in Mahboobnagar. The results indicate that, effective partnerships (among various programs and with the farming community) can gradually lift MN-3 households out of poverty through developing a competitive dairy farming business, which provides not only an excellent local wage level, but also strengthens their position against international competition in a global economy.

9
2. INTRODUCTION
2.1 Overview
From the beginning of the 20th century the Indian livestock industry has attracted widespread attention and benefited from multiple organized development programs. The pace of dairy development for example rapidly accelerated after 1970, fuelled by Operation Flood. Subsequently, dairy development was seen as a nationwide anti-poverty instrument with huge potential to ensure greater equity and food and social security in rural India. The performance of the Indian dairy sector in the last three decades has been impressive. Milk production witnessed a significant growth of about 4.5 percent per year, making India, with a production of 74.7 million tons in 1998-99, the largest milk producer in the world.
However, most Indian dairy farmers today not only still live in poverty, but also face new forces stemming from an increasingly liberalized Indian dairy sector. Trade liberalization as spearheaded by the World Trade Organization (WTO) has fuelled major trade policy reforms by the Government of India since the early 1990s. These recent developments expose Indian farmers to an increasingly open economy environment in which access to cost-effective and high quality dairy development programs becomes critical if dairy farming is to significantly contribute to poverty reduction while retaining international competitiveness.
2.2 Objectives
As, under this emerging environment, the Indian dairy sector moves towards less governmental interventions and regulations, there is a paramount need to clearly identify dairy development programs that have high impacts on both rural poverty alleviation and international competitiveness. In this context, this study aims to address the following specific questions:
1- What is the current economic situation of typical dairy farming households in Andhra Pradesh? How high and stable are their incomes? How much do these households benefit from dairying and how internationally competitive is milk production of these typical farms?
2- What are the expected farm-level impacts of the main dairy development programs in the district of Mahboobnagar?
3- What dairy development paths do local dairy farmers regard as feasible for typical farms in Mahboobnagar, Andhra Pradesh and what dairy development programs should be put in place to cater for the needs of these farmers?
2.3 Methodology
This study applies the IFCN methodology in the following chronological order:
1- IFCN engaged in a partnership with a state institution, namely Andhra Pradesh Livestock Development Agency (APLDA), which has both a vast dairy farming expertise and a state-wide coverage.
2- The districts to be studied were jointly selected by IFCN and APLDA. Then, in each district; dairy-expert panels were formed to include not only local dairy

4. Evaluation of Dairy Development Programs
10
stakeholders, but also officers from APLDA, BAIF and other Non Governmental Organizations heavily involved in the industry.
3- IFCN guided each panel during the identification and building up the typical dairy farms. It also facilitated the validation and adjustments of results until the group could agree on the plausibility of the farm analyses.
4- In the particular case of Mahboobnagar, the panel and later on other individually-consulted dairy stakeholders provided key farm data, and validated results for all of the dairy development programs and ideas evaluated in this study.
5- Also in Mahboobnagar, the panel completed a risk profile for the typical dairy farm. This allowed for an assessment of the probability that the farm reaches specific goals as a result of utilizing a particular service / program or a combination of several programs.
6- By discussing the impacts of the various dairy development programs on this one selected farm, the Mahboobnagar panel agreed on a likely farm-level dairy development path for that farm type in their district. They identified and combined the programs that would be required to develop the dairy farming sector in the district. The dairy farming economics of each step in such a development path are presented in this study.
This is the first ‘dairy development policy evaluation study’ done within the IFCN Dairy Research Network. Although great efforts were made both to include all major dairy development programs as well as to model their economic, social and biological complexities, the authors invite readers’ comments on the plausibility of the pathways and envisaged results and suggestions for improvements on research methodology (Please contact Otto Garcia at: [email protected] for any suggestion/comment).
2.4 Structure of the Paper
This paper is arranged in the following sequence:
1- Executive Summary: Gives an overview of the main findings of the study.
2- Introduction: Provides details about the project, the methodology used, and the contents of this report.
3- Milk Production in India and Andhra Pradesh: First, this section provides condensed pictures of the national and state milk production sectors and their characteristics, and second economic results for selected typical farms are presented at the household, whole farm, and dairy enterprise levels.
4- Dairy Development Activities in Andhra Pradesh: Presents the results from the farm-level impact analysis of potential dairy development programs.
5- Dairy Development Ladder for Mahboobnagar: Describes stakeholders’ perceptions of the farm level economic impact of each major development step and details of the dairy programs that will be required.

11
3. MILK PRODUCTION AND FARM COMPARISON IN ANDHRA PRADESH
3.1 India - Dairy in the National Context
National milk production Milk production in India has been growing steadily by 4.5 percent per annum since 1996 and in 2003/2004 milk production reached 88.1 million tons (GOI, 2004). India maintained its position as the largest milk producing country in the world consecutively for the last 3 years. However the milk is produced by about 117 million cows and buffaloes, of which 72.8 million are in milk, the average yield of the animals in milk thus being very low at around 1,300 litres per year.
Dairy farm structures There are about 56 million farm households who keep dairy animals (NSS, 2000). The average number of animals per household falls between 2 and 3 adult female cows (and/or buffaloes). Average milk production per farm comes to around 1,600 litres per year. Although the number of these small farms is growing by around 2 percent per year, the number of animals per household is at best stable or decreasing.
Milk prices The average milk price in India (22 US-$/100 kg 4 percent ECM) in 2003 is close to the world milk price level (Saha, 2004). Milk prices have been rising steadily at a rate of over 5 percent per annum but in 2002 this growth dropped to 1.1 percent.
Beef prices With the lack of proper beef markets due to widespread prohibition of the slaughter of cattle prices have been stagnating at 27 US-$/100 kg live weight (Saha, 2004).
Land prices Land prices are exceptionally high at around 17,532 US-$/ha of good arable land (Saha, 2004) as a result of practically non-functional land markets. Attachment of social and emotional value of land by its owners along with risk aversion further increases the market price of land. The role of land lease markets requires in-depth investigation.
Feed prices Prices of feed based on soybean meal and corn have shown an increasing trend above the world market prices reaching 151 US-$/ton (INR 6,980). At this price, the milk to feed price ratio reaches a level of 1.5, which is marginally favourable. However, it needs to be kept in mind that farmers in India normally use a home-prepared ration mostly based on local feed residues such as wheat meal, rice bran, cottonseed and mustard seed cakes, which makes the ration cheaper than the use of soybean meal and corn.

3. Milk Production and Farm Comparison in Andhra Pradesh
12

3. Milk Production and Farm Comparison in Andhra Pradesh
13
3.2 Andhra Pradesh - Dairy in the Regional Context
Milk production and marketing Andhra Pradesh is the fifth largest state in India with 8.4 percent of the country’s total area (GoAP, 2004a). With 6.96 million tons of milk produced in 2003/04 (or 7.9 percent of India’s milk production) it is the fourth largest milk producing state in the country only after Uttar Pradesh, Punjab, and Rajasthan. Its milk production grew by 6.6 percent (4.5 percent nationally) during 1996-2003. This growth was fuelled mainly by an increase in the buffalo population and to a lesser extent by breed improvement (50 and 18 percent local and upgraded buffaloes). Local vendors handle 72.4 percent of the total milk produced while private dairy companies and cooperatives, the main players in the formal markets, handle 14 and 5 percent respectively.
Bovine population Andhra Pradesh has 7.4 percent of the bovine population (adult female dairy animals – cows and buffaloes) of India (GoAP, 2004b). As per 2003 livestock census, the state is endowed with 8.6 million ‘breedable’ bovine livestock. Of this stock, 68 percent are buffaloes while the remaining 32 percent are cattle (GoAP, 2004b). At the national level, the state has the second largest buffalo population after Uttar Pradesh. Cattle provide the major part of animal draught power while buffaloes are almost entirely kept for milk production.
Milk yields The average milk yield per bovine is 2.22 kg per day which is slightly higher than the national average of 2.06 kg per day. The yields of a local cow, crossbred cow, local buffalo and grade buffalo were 1.05, 4.59, 1.81 and 4.26 kg per day respectively in 2003. Average yields in Haryana and Punjab, however, were respectively 4.25 and 4.33 kg per dairy animal per day in 2003.
Farm structures Milk is produced by 5.04 million dairy farm households of which 85 percent hold 1 to 2 dairy animals (cows or buffaloes) (ISPA, 1994). The average milk production per farm per year was about 1,400 litres in 2003 and has been increasing steadily by 7 percent per year. The number of smallholder farms is decreasing marginally by 0.4 percent per year while the average herd size remains more or less unchanged.
Natural conditions (temperature and rainfall) Andhra Pradesh, on average, experiences moderate to high temperatures throughout the year with only slight variation between seasons. Average annual rainfall in Andhra Pradesh is 940 mm, falling mostly between June and September. The winter months of October to December have some rainfall while January to May are dry.
Agriculture and land use About 23 percent of the area of the state are covered with forests. The area under permanent pastures and green fodder crops is less than 5 percent. Of the area under crops, 68.3 percent were under food crops during 2002-03. The important crops for the

3. Milk Production and Farm Comparison in Andhra Pradesh
14
selected districts are rice, maize, castor and jowar. The price and yield variations of these crops show rice and maize to have declining productivity and stagnating prices, while castor and jowar show sustained productivity but only castor shows rising prices GoAP (2004d).

3. Milk Production and Farm Comparison in Andhra Pradesh
15
3.3 Description of ‘Typical’ Dairy Farms in Andhra Pradesh
Typical dairy farms in Mahboobnagar district (rainfed region)
1-Cow farm (MN-1): Farm in the Talkondapalli mandal
Activities: This farm represents the household of an agricultural labourer with no land and one non-descript local cow. The household consumes about 50 percent of its milk production and sells the rest to the local milkman. While off-farm employment contributes 80 percent of the family income, dairy provides only 4 percent.
3-Buffalo farm (MN-3): Farm in the Apayepali village
Activities: This farm keeps three local buffaloes on 3 ha of land, of which 1.4 are rainfed land. From the irrigated 1.6 ha, 0.4 ha are used to grow paddy (one crop a year), while the rest is used to grow crops like jowar, maize, castor, and chickpeas depending on the rainfall pattern. Animals are mostly grazed on public land and own fallow land. Over 70 percent of the milk produced is sold to the milk vendor and/or the local cooperative.
14-Cow farm (MN-14): A commercial farm in the Talakondapalli mandal
Activities: This farm owns 3 ha of irrigated land and 5.8 ha rainfed. It has 13 crossbred cows (6 local X Jersey and 7 local X Holstein) and 1 Deoni grade cow. Milk is sold to the cooperative milk society, which pays higher prices than local vendors for cow milk (but not for buffalo milk). The farm grows its own fodder throughout the year.
Typical dairy farms in Guntur district (irrigated region)
1-Buffalo farm (GR-1): Farm located in the Buddham village
Activities: The household head is an agricultural labourer, who owns no land and a grade buffalo. Dairying only contributes 8 percent to the household income while off-farm income contributes 85 percent. Milk is sold directly to the end consumer, restaurants or to the local dairy co-operative.
2-Buffalo farm (GR-2): Farm in the Buddham village
Activities: The farmer owns 0.8 ha of irrigated land and 2 grade buffaloes. Off-farm labour is the owner’s main occupation. Milk production, cash crops (such as paddy, sunhemp and filipesera) and off-farm activities contribute 8, 13 and 79 percent of the household income respectively.
11-Buffalo farm (GR-11): A commercial farm in the Buddham village
Activities: The farmer own 8 ha of irrigated arable land. This farmer also owns 4 pure and 6 grade Murrah buffaloes and 1 Ongole cow. Partial grazing and feed supplementation using concentrates, other crop residues and dry fodder are practiced. The crops grown are paddy, jowar, filipisera and sunhemp.
Explanation of codes: SAU: Standard Animal Unit = a female adult buffalo unit

3. Milk Production and Farm Comparison in Andhra Pradesh
16
Typical F
Units MN-1° MN-3 MN-14 GR-1°
GR-2 GR-11
Number of No. 4 4 5 4 5 5Family cash living US-
$/360 641 165
4360 631 165
4Family consumption from farm US-
$/86 270 394 150 314 485
Household A t
1000 US-$
2.6 28.7 115.9
2.8 12.5 114.8Family labour
tili tiManhours / 293
64501
4183
4288
7053
4765Family
iUS-$/
1092
1186
4492
1115
2505
4346
Types of t i
Descriptio Laboure Laboure N/A Laboure Laboure N/ATotal off farm
t ti lManhours / 238
32700
2542
2383
3823
3696Family labour
tili tiManhours / 119
21771
0 1875
3277
0Off farm+wage i
US-$/
1002
505 0 1006
2096
0
Farm land ( d)
Ha 0.0 3.0 8.8 0.0 0.8 8.0
Types of t i
DescriptioSheep + Poultr
Crops+Goat+ Poultr
Crops+Goat+ Poultr Sheep +
P lt
Crops+Goat+ Poultr
Crops+Goat+ Poultr
Assets l
1000 US-$
0 26 98 0 9 98Land
l1000 US-$
0 25 87 0 9 88Family labour tili ti
Manhours / 816 2228
3555
1283
2980
4264Hired labour
tili tiManhours / 219 487 720
0292 0 480
0Farm i
US-$/
89 677 4443
108 404 4305
Herd t
Units Adult female
itNo. 1 3 14 1 2 11
Type of i l
Descriptio 0 0 Crossbred C
0 0 Murrah B ff l(10) + Local C (1)
Lactation yield (Non-ECM)
Kg/ h d
570 540 2379
1050
1365
1967Daily lactation yield
(NECM) Kg/ h d
1.90 2.00 7.93 3.75 4.79 6.83Fat content (Non-ECM)
% 4 6 4 6 6 6Area under fodder Ha 0.00 1.07 1.72 0.00 0.36 0.62
Daily feeding ration (DM)
Kg/ lact. i l
3.99 4.77 17.06
8.01 11.52
14.47Concentrat Kg/ lact.
i l0.81 0.68 4.03 1.98 2.73 3.41
Mineral Kg/ SAU
0.00 0.00 0.03 0.00 0.00 0.03
Dry f dd
Kg/ SAU
0.70 2.33 4.05 3.47 2.64 3.98
Green f dd
Kg/ SAU
2.48 1.77 8.95 2.56 6.15 7.04Bought-in Feed (as i )Concentrat Ton/ 0.18 0.36 11.0
00.46 1.28 9.40
Mineral Ton/ 0.00 0.00 0.10 0.00 0.00 0.10Dry f dd
Ton/ 0.50 0.00 0.00 3.00 0.00 0.00Green f dd
Ton/ 1.83 4.00 10.00
7.00 4.69 25.00Herd
d tiInsemination th d
Descriptio Natural
Natural
AI AI AI AIBreeding
tUS$ /hd/
0.77 0.59 5.31 1.32 1.76 1.08Calving i t l
Month 18 20 15 16 16 16Lactation l th
Days 300 270 300 280 285 288Age at first
l iMonth 36 50 30 44 44 42
Health tMedicine US$ /hd/ 1.76 0.74 10.3
24.41 5.51 7.72
Cow t lit
% 5 5 4 3 3 3Heifer
t lit% 5 4 3 3 3 3
Calf t lit
% 25 40 20 20 15 15
OFF-FARM ACTIVITIES
NON-DAIRY FARM ACTIVITIES
HOUSEHOLD
DAIRY FARM ACTIVITIES
3. Milk Production and Farm Comparison in Andhra Pradesh
17
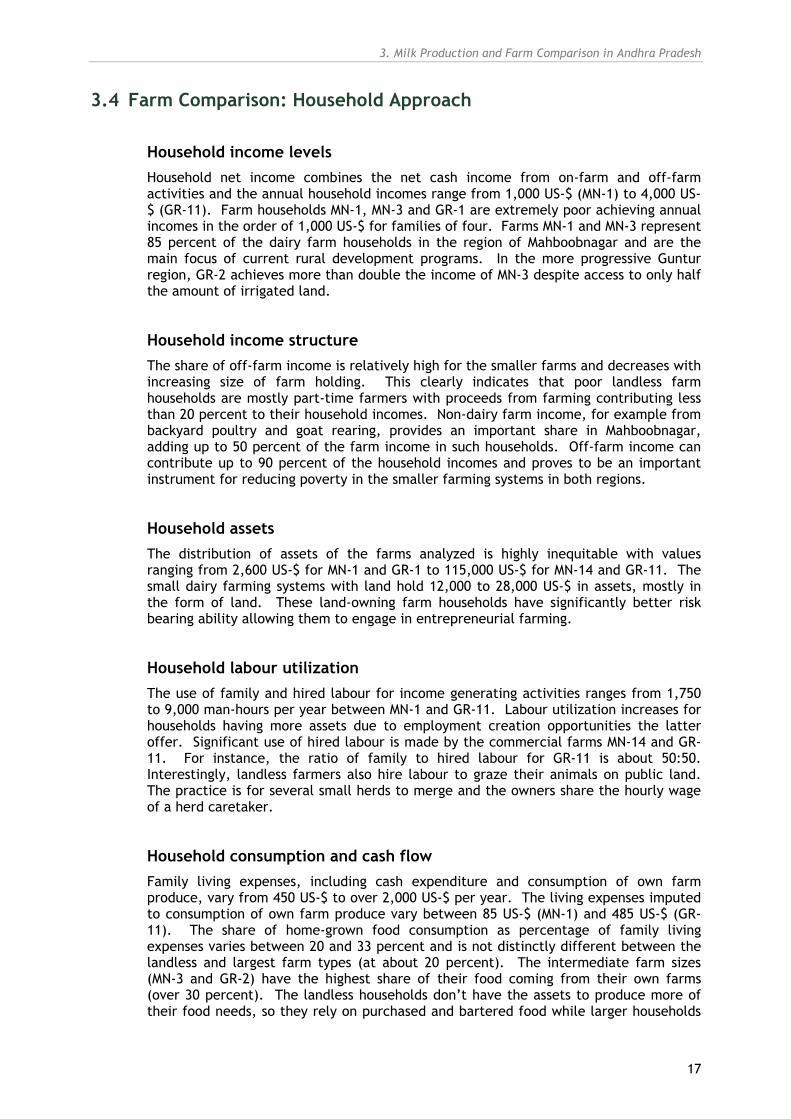
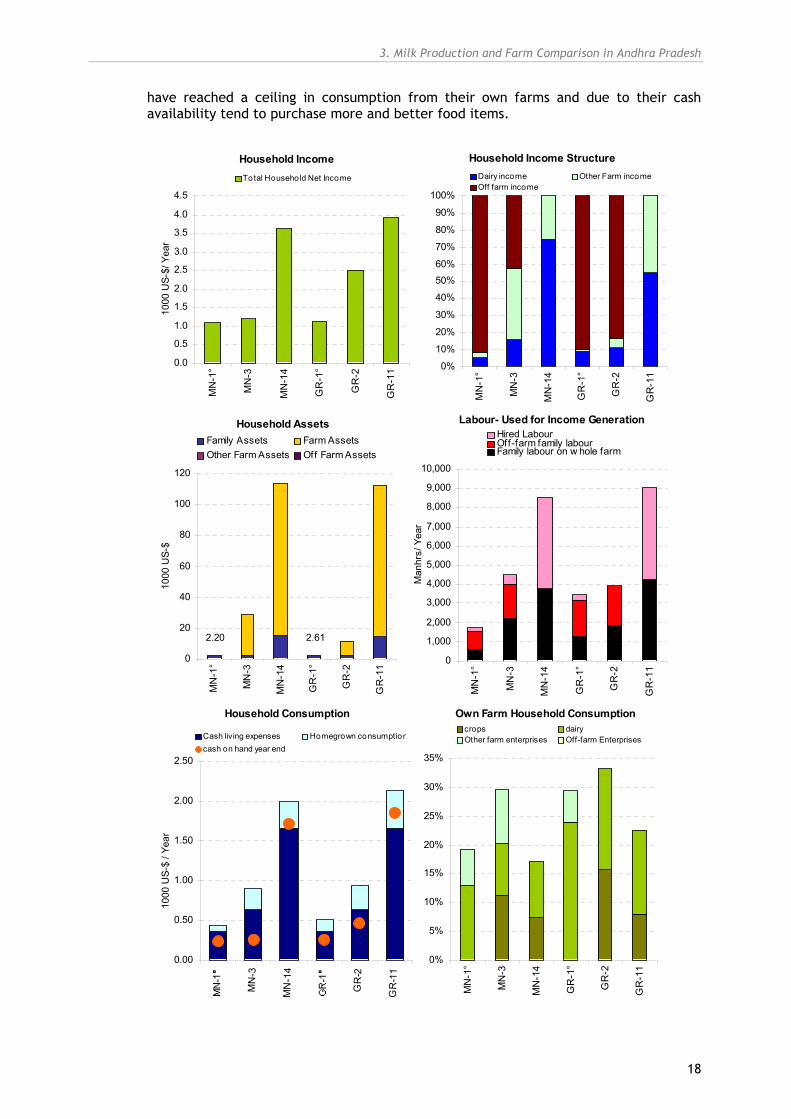
3.4 Farm Comparison: Household Approach
Household income levels Household net income combines the net cash income from on-farm and off-farm activities and the annual household incomes range from 1,000 US-$ (MN-1) to 4,000 US-$ (GR-11). Farm households MN-1, MN-3 and GR-1 are extremely poor achieving annual incomes in the order of 1,000 US-$ for families of four. Farms MN-1 and MN-3 represent 85 percent of the dairy farm households in the region of Mahboobnagar and are the main focus of current rural development programs. In the more progressive Guntur region, GR-2 achieves more than double the income of MN-3 despite access to only half the amount of irrigated land.
Household income structure The share of off-farm income is relatively high for the smaller farms and decreases with increasing size of farm holding. This clearly indicates that poor landless farm households are mostly part-time farmers with proceeds from farming contributing less than 20 percent to their household incomes. Non-dairy farm income, for example from backyard poultry and goat rearing, provides an important share in Mahboobnagar, adding up to 50 percent of the farm income in such households. Off-farm income can contribute up to 90 percent of the household incomes and proves to be an important instrument for reducing poverty in the smaller farming systems in both regions.
Household assets The distribution of assets of the farms analyzed is highly inequitable with values ranging from 2,600 US-$ for MN-1 and GR-1 to 115,000 US-$ for MN-14 and GR-11. The small dairy farming systems with land hold 12,000 to 28,000 US-$ in assets, mostly in the form of land. These land-owning farm households have significantly better risk bearing ability allowing them to engage in entrepreneurial farming.
Household labour utilization The use of family and hired labour for income generating activities ranges from 1,750 to 9,000 man-hours per year between MN-1 and GR-11. Labour utilization increases for households having more assets due to employment creation opportunities the latter offer. Significant use of hired labour is made by the commercial farms MN-14 and GR-11. For instance, the ratio of family to hired labour for GR-11 is about 50:50. Interestingly, landless farmers also hire labour to graze their animals on public land. The practice is for several small herds to merge and the owners share the hourly wage of a herd caretaker.
Household consumption and cash flow Family living expenses, including cash expenditure and consumption of own farm produce, vary from 450 US-$ to over 2,000 US-$ per year. The living expenses imputed to consumption of own farm produce vary between 85 US-$ (MN-1) and 485 US-$ (GR-11). The share of home-grown food consumption as percentage of family living expenses varies between 20 and 33 percent and is not distinctly different between the landless and largest farm types (at about 20 percent). The intermediate farm sizes (MN-3 and GR-2) have the highest share of their food coming from their own farms (over 30 percent). The landless households don’t have the assets to produce more of their food needs, so they rely on purchased and bartered food while larger households
3. Milk Production and Farm Comparison in Andhra Pradesh
18
have reached a ceiling in consumption from their own farms and due to their cash availability tend to purchase more and better food items.
Household Income
0.0
0.5
1.0
1.5
2.0
2.5
3.0
3.5
4.0
4.5M
N-1
°
MN
-3
MN
-14
GR
-1°
GR
-2
GR
-11
1000
US-
$/ Y
ear
To tal Household Net Income
Household Income Structure
0%
10%
20%
30%
40%
50%60%
70%
80%
90%
100%
MN
-1°
MN
-3
MN
-14
GR
-1°
GR
-2
GR
-11
Dairy income Other Farm incomeOff farm income
Labour- Used for Income Generation
0
1,000
2,000
3,000
4,000
5,000
6,000
7,000
8,000
9,000
10,000M
N-1
°
MN
-3
MN
-14
GR
-1°
GR
-2
GR
-11
Man
hrs/
Yea
r
Hired LabourOff-farm family labourFamily labour on w hole farm
Household Assets
2.612.20
0
20
40
60
80
100
120
MN
-1°
MN
-3
MN
-14
GR
-1°
GR
-2
GR
-11
1000
US-
$
Family Assets Farm AssetsOther Farm Assets Off Farm Assets
Own Farm Household Consumption
0%
5%
10%
15%
20%
25%
30%
35%
MN
-1°
MN
-3
MN
-14
GR
-1°
GR
-2
GR
-11
crops dairyOther farm enterprises Off-farm Enterprises
Household Consumption
0.00
0.50
1.00
1.50
2.00
2.50
MN
-3
MN
-14
GR
-2
GR
-11
1000
US-
$ / Y
ear
Cash living expenses Homegrown consumptioncash on hand year end

3. Milk Production and Farm Comparison in Andhra Pradesh
19
3.5 Farm Comparison: Whole Farm Approach
Farm returns Farm returns range from 200 to 9,000 US-$ per year. Small farms with land generate farm returns of 900 to 1,300 US-$ per year. All farms are able to cover the total farm expenses and generate a net positive farm income ranging from 90 to about 4,000 US-$ per year. The small farms with land (GR-2 and MN-3) are able to make a net farm income of 400 and 675 US-$ per year respectively. The large variations in farm income are linked to scale, productivity, technology and labour utilization.
The return share of dairying is relatively higher in the more productive zone than in the less productive zone. Other farm activities, mostly goat and poultry raising, were found to be important in the landless farms in both regions and also in the small farm with land in the less progressive region of Mahboobnagar (MN-3). The role of crops is important in generating returns on MN-3, GR-2 and GR-11.
Farm output marketed and cash flow The proportion of dairy output sold varies from 40 to 96 percent. Larger farms meet their milk needs and have more reliable markets for their milk, especially due to their stronger bargaining power. Smaller farms, however, do not only consume much of their production because the family needs it, but also due to insecure markets and non-remunerative milk prices. Consumption of food crops, mostly rice and jowar, accounts for 3 to 25 percent of crop returns, depending on the farming system. The annual net farm cash flow ranges from 10 to 4,000 US-$ in GR-1 and MN-14 respectively, which shows how vulnerable the small and landless farmers are to liquidity risks.
Farm assets and structures With increase in assets, the proportion of farm output sold increases in both regions. Farm assets range from 200 to 98,000 US-$. For the landless farms, MN-1 and GR-1, animals account for 40 to 70 percent of the farm assets, while for the other farms, land is, by far, the single most valuable asset, constituting 90 to 97 percent of the farm asset value.
Explanations of variables; year and sources of data:
Farm returns: All cash receipts minus the balance of inventory (for example livestock). Returns to dairy: Milk, cull cows, heifers, calves, sale and use of manure, draught power, etc. Proportion of farm output sold: Sale of crops such as rice, wheat, etc. divided by value of total farm production Other farm output sold: Sale of poultry meat/ eggs, and goat, after home consumption is met. Farm cash flow: Total cash farm returns / year – Total cash farm expenses / year Farm assets: All assets related to the farm (land, cattle, machinery, buildings, etc.) IFCN data collection based on expert estimations and statistics, year 2004.

3. Milk Production and Farm Comparison in Andhra Pradesh
20
Farm Returns and Income
01,0002,0003,0004,0005,0006,0007,0008,0009,000
10,000M
N-1
°
MN
-3
MN
-14
GR
-1°
GR
-2
GR
-11
US
-$ /
year
Net Farm Income Farm returms
Total Farm Expenses
Farm Return Structure
0%
20%
40%
60%
80%
100%
MN
-1°
MN
-3
MN
-14
GR
-1°
GR
-2
GR
-11
Other farm activitiesCash cropsDairy
Structure of Farm Assets
0%
20%
40%
60%
80%
100%
MN
-1°
MN
-3
MN
-14
GR
-1°
GR
-2
GR
-11
Machinery & Building
Livestock
Land
Total Farm Assets
0.350.20
0
20
40
60
80
100
MN
-1°
MN
-3
MN
-14
GR
-1°
GR
-2
GR
-11
1000
US
-$ /
Year
Proportion of Farm Output Sold
0%
20%
40%
60%
80%
100%
MN
-1°
MN
-3
MN
-14
GR
-1°
GR
-2
GR
-11
Dairy Crops Other farm
Farm Cash Flow
0
1,000
2,000
3,000
4,000
5,000
6,000
7,000
8,000
9,000
10,000
MN
-1°
MN
-3
MN
-14
GR
-1°
GR
-2
GR
-11
US-
$ / y
ear
Farm cash returns Farm cash expensesNet farm cash flow

3. Milk Production and Farm Comparison in Andhra Pradesh
21
3.6 Farm Comparison: Dairy Enterprise Approach
Returns to the dairy enterprises (cash and non-cash) The total returns per 100 kg ECM range from 18 to 27 US-$. These returns combine the sales of milk, livestock, draught power and manure. In addition, households consume milk and utilize manure for fuel and / or fertilizer. These non-cash returns to the dairy enterprises range from 58 to 260 US-$ per year. Interestingly, there is a clear difference between the two regions in the total value of milk consumed, which is due to differences in both milk price and quantity of milk consumed.
Costs and profits of the dairy enterprises When the household’s own resources used on the dairy enterprises are included, total milk production cost ranges from 16 to 38 US-$ per 100 kg ECM. After deducting total production costs from milk returns, only the two largest farms cover the full costs and make entrepreneurial profits ranging from 1.0 to 2.5 US-$ per 100 kg ECM.
On the other hand, when the household’s own resources used in the dairy enterprises are excluded from the cost calculation, all six dairy enterprises generate a positive income ranging from about 5 to 10 US-$ per 100 kg ECM. These positive incomes and the lack of attractive economic alternatives to dairy farming are the main reasons for these farms to keep operating.
Cost of milk production The cost of milk production only in these farms varies from 16 to 30 US-$ per 100 kg of ECM. The highest production cost of 30 US-$ (MN-1) is mainly attributable to high opportunity costs of labour (with family labour being valued at the existing market wage rate) combined with low milk yields and high animal mortality rates. However, the lack of sufficient alternative employment questions the validity of using existing local wages for valuation of family labour. The high cash cost (darker blue bar) in the landless system (GR-1) is mainly due to the need of purchasing feed and fodder, which are expensive (while in the MN region grazing on public land is more prevalent).
Returns to labour Returns to labour are inversely correlated to the cost of milk production. While the two largest farms achieve much higher returns to labour than the local agricultural wage rate, labour on the smaller farms earns around half of the local wage rate. Interestingly, there seems to be no significant difference between regions and between the landless and intermediate sized farms in the study.
Significant economy-of-scale effects can only be observed on the larger farms. This seems to indicate that for smaller farms to capitalize on such effects they should consider, among other factors, increasing productivity (through more productive animals, practices and technologies) and increasing herd size up to somewhere between 4 and 10 lactating dairy animals.
Explanation of variables:
Return structure and cost structure: See Annex A3 Costs of milk production: See Annex A2 Farm Profit Margin: Farm income from dairy enterprise / Gross dairy returns * 100 IFCN data collection based on expert estimations and statistics, year 2004.

3. Milk Production and Farm Comparison in Andhra Pradesh
22
Total Dairy Returns
0
5
10
15
20
25
30
35
40
MN
-1°
MN
-3
MN
-14
GR
-1°
GR
-2
GR
-11
US-
$ / 1
00 K
g EC
MM ilk Livestock Other
Cost Items Structure
0
5
10
15
20
25
30
35
40
MN
-1°
MN
-3
MN
-14
GR
-1°
GR
-2
GR
-11
US-
$ /1
00
Kg E
CM
Capital CostsLabour CostsCost o f o ther M eans of ProductionPurchased FeedLand Costs
Cost of Milk Production
0
5
10
15
20
25
30
35
MN
-1°
MN
-3
MN
-14
GR
-1°
GR
-2
GR
-11
US-
$ / 1
00 K
g EC
M
Opportunity costs Costs from P&L account - non-milk returns M ilk price
Return to Labour
0.00
0.05
0.10
0.15
0.20
0.25
MN
-1°
MN
-3
MN
-14
GR
-1°
GR
-2
GR
-11
US-
$ /
hour
Return to Labour Local Wage Level
Returns and Profits
-15
-10
-5
0
5
10
15
MN
-1°
MN
-3
MN
-14
GR
-1°
GR
-2
GR
-11
US-
$ / 1
00 K
g EC
MFarm Income Entrepreneur's Pro fit
Non Cash Returns of Dairy Enterprise
0
50
100
150
200
250
300
MN
-3
MN
-14
GR
-2
GR
-11
US-
$/ Y
ear
Dung for fuel/ fertilizerM ilk kept for family/ calves

3. Milk Production and Farm Comparison in Andhra Pradesh
23
Labour productivity Labour input varies from about 450 up to 1,000 man-hours per lactating dairy animal per year. The profitability of the two large farms is clearly driven by higher labour productivity and resulting lower wage cost per 100 kg ECM. The 4 to 5 times higher labour productivity of large versus small-scale systems makes large-scale commercial dairy farming economically viable and financially attractive. Interestingly, labour input per dairy animal is generally higher in the region of Guntur than in Mahboobnagar.
Capital productivity Capital input per dairy animal is similar for the two largest farms. The smaller farms, however, have much higher capital invested per animal in the irrigated region from 35 to 40 US-$ per dairy animal against only 14 to 18 US-$ in the rainfed region. However, capital productivity is very similar between both regions, namely between 2,000 and 2,500 kg ECM milk produced per 1,000 US-$ invested. Also, capital productivity seems to be little affected by changes in farm size (note that GR-2 has the highest capital productivity of all six farms).
Land productivity Land input per dairy animal varies from 0.05 to 0.35 hectares, which includes land used to produce by-products fed to dairy animals. The land needed per animal declines as herd size increases. Farmers in the rainfed region require twice as much land per animal as their counterparts in the irrigated area. Land use per dairy animal is higher in the smaller farms than in the larger farms, which is due to the intensity of land use for fodder cultivation. The small farms generally feed crop residues after removing the grains, like rice, Jowar, needing to use more land to meet their feed demands (0.18 to 0.35 ha/head). The large farms, instead, use 0.05 to 0.06 ha of land per dairy animal to grow a constant supply of green fodder (such as Lucerne, Sorghum, Napier grass and maize grain) throughout the year, which results in higher land productivity.
Explanation of variables:
IFCN method: See Annex A2 and A3 Labour productivity: Total quantity of milk produced in farm in kg ECM in the year/ Total man- hours of labour utilized in dairy enterprise in the year Capital productivity: Total milk produced in kg ECM in the year/ Total present market value of capital assets used in dairy enterprise in 1,000 US-$ Land productivity: Total milk produced in kg ECM in the year / Total land used in dairy enterprise in hectares IFCN data collection based on expert estimations and statistics, year 2004.

3. Milk Production and Farm Comparison in Andhra Pradesh
24
Labour Input
0
200
400
600
800
1,000
1,200
MN
-1°
MN
-3
MN
-14
GR
-1°
GR
-2
GR
-11
Man
hour
s/ d
airy
ani
mal
/ yea
rLabour Productivity
0.0
0.5
1.0
1.5
2.0
2.5
3.0
3.5
4.0
4.5
5.0
MN
-1°
MN
-3
MN
-14
GR
-1°
GR
-2
GR
-11
Kg
EC
M/ h
r
Land Productivity
0
5,000
10,000
15,000
20,000
25,000
30,000
35,000
40,000
MN
-1°
MN
-3
MN
-14
GR
-1°
GR
-2
GR
-11
Kg
EC
M/ h
aCapital Productivity
0
500
1000
1500
2000
2500
3000
3500
MN
-1°
MN
-3
MN
-14
GR
-1°
GR
-2
GR
-11
Kg
EC
M/ 1
000
US
-$Capital Input
0
10
20
30
40
50
60
70
80
MN
-1°
MN
-3
MN
-14
GR
-1°
GR
-2
GR
-11
US-
$/ d
airy
ani
mal
/ yea
r
Land Input
0.00
0.05
0.10
0.15
0.20
0.25
0.30
0.35
0.40
MN
-1°
MN
-3
MN
-14
GR
-1°
GR
-2
GR
-11
Ha
/ dai
ry a
nim
al

3. Milk Production and Farm Comparison in Andhra Pradesh
25
3.7 Summary
Milk production in Andhra Pradesh Milk production in Andhra Pradesh has been growing steadily at an average annual growth rate of 6.6 percent between 1996 and 2003. However, milk yields, at 2.22 litres per animal per day, are only slightly above the national average.
The landless farm households in both regions studied and the small farm type in the less progressive region of Mahboobnagar are the poorest. Without adequate assets to allow investments, these poor households are also highly vulnerable to risk. Large farms are able to produce milk at half the cost of a landless farm in the Mahboobnagar region (MN-1). Cost competitiveness is to a large extent determined by labour costs per 100 kg ECM, the productivity of the cows and feed costs. Intensive use of land for green fodder production throughout the year increases the land productivity of the large farming systems.
Areas of intervention Though milk yields have been growing at an average annual rate of 4.7 percent over the period of 1996 to 2001, there is a need to accelerate this growth through more focused development interventions. Based on observed yield variations in the regions of Guntur and Mahboobnagar, it appears that there is significant potential to improve the average yield of buffalo in smallholder dairy production systems simply by improving breeding, feeding and herd management. This improvement would have a major impact on employment, milk production and nutritional status of the people in Andhra Pradesh.
At the farm level, initiatives that provide incentives to farmers to keep more productive animals without compromising their ability to work off-farm will be a necessary precondition to enhance dairy development in the region. This will entail analysis of farm types and strategies that are labour-saving, require little investment and are of low risk. A mechanism to provide loans for the purchase of animals without the requirement of assets as collateral security is necessary for the small production systems.
No significant differences in cost of milk production were found between the two regions. However, milk prices in the progressive regions are higher. This implies that dairy competitiveness in Andhra Pradesh has less to do with regional and location specificity but rather with markets and overall development. There is therefore scope to improve farm competitiveness by improving market access to the producers in Mahboobnagar.
When family labour is calculated at the local wage rate, smallholder dairy farming systems are locally not competitive with the larger commercial systems. This may require interventions to particularly address the smallholders’ low asset bases, their poor access to markets and information, and their high vulnerability to shocks.

26
4. EVALUATION OF DAIRY DEVELOPMENT PROGRAMS IN ANDHRA PRADESH
4.1 Introduction
The low productivity of dairy animals in India generally, and in Andhra Pradesh in particular, is known to be mainly due lack of proper nutrition, and poor health. Therefore, numerous programs have been implemented in the region to increase milk production by providing better nutrition and health services to animals, with the ultimate aim to improve the socio-economic condition of small-scale dairy farmers.
Several organizations, from the local and state government, non-governmental organizations to local grassroots groups, are engaged in the supply of farm inputs (insemination, vaccines, medicine, subsidized calf feed, mineral mixtures, fodder seeds, etc.) and provision of technical services to cattle owners. For milk production, the Andhra Pradesh Livestock Development Agency (APLDA) targets the buffalo population and the share of grade buffaloes exhibits a significant growth trend indicating a shift from traditional subsistence dairy farming to a semi- or fully commercial dairy enterprise aiming at greater economic returns.
This emphasis on dairy development programs is to a large extent driven by the combination of increasing urbanization leading to higher demand for dairy products coupled with a decrease in land for both cropping and grazing. As a result, small-scale dairy farmers in the State seek dairy development programs that assist them in raising profitability and incomes. Thus, there is a need to evaluate the farm-level impacts of the main dairy development programs against these objectives and rank them accordingly.
4.2 Methodology
The region of Mahboobnagar was selected for this assessment. Using a panel of local dairy experts and farmers, over forty dairy development programs and farmers’ proposals for dairy development were classified intro five intervention categories: (a) feeding, (b) marketing, (c) husbandry, (d) breeding and (e) health. The most recent version of the model TIPI-CAL (Version 4.0), which supports risk analysis by incorporating the stochastic simulation software SIMETAR, was used to analyse the impact of changes in farm performance resulting form the information provided by the panel for each of the proposed interventions. The panel was presented with the results for comments and adjustments were made where required.
The results of the farm-level impacts are presented for three parameters: (1) overall household income, (2) the returns to labour in dairy vis-a-vis the local labour market, and (3) farm competitiveness of milk production.
In addition to these quantified impacts, it is known that farmer perceive many of the dairy development programs as increasing the risk of their enterprise. To inform dairy development administrators, a risk assessment is presented for each dairy development program. Section 4.3 explains how the risk is assessed.
Sections 4.4 to 4.8 present the farm-level impacts and the risk profiles of the dairy development programs selected for assessment in Mahboobnagar district of Andhra Pradesh state. As mentioned above, the dairy development programs are grouped into five categories and each category will initially be presented separately. Finally, summary graphs 4.9 to 4.10 portray all programs side by side, grouped by category to
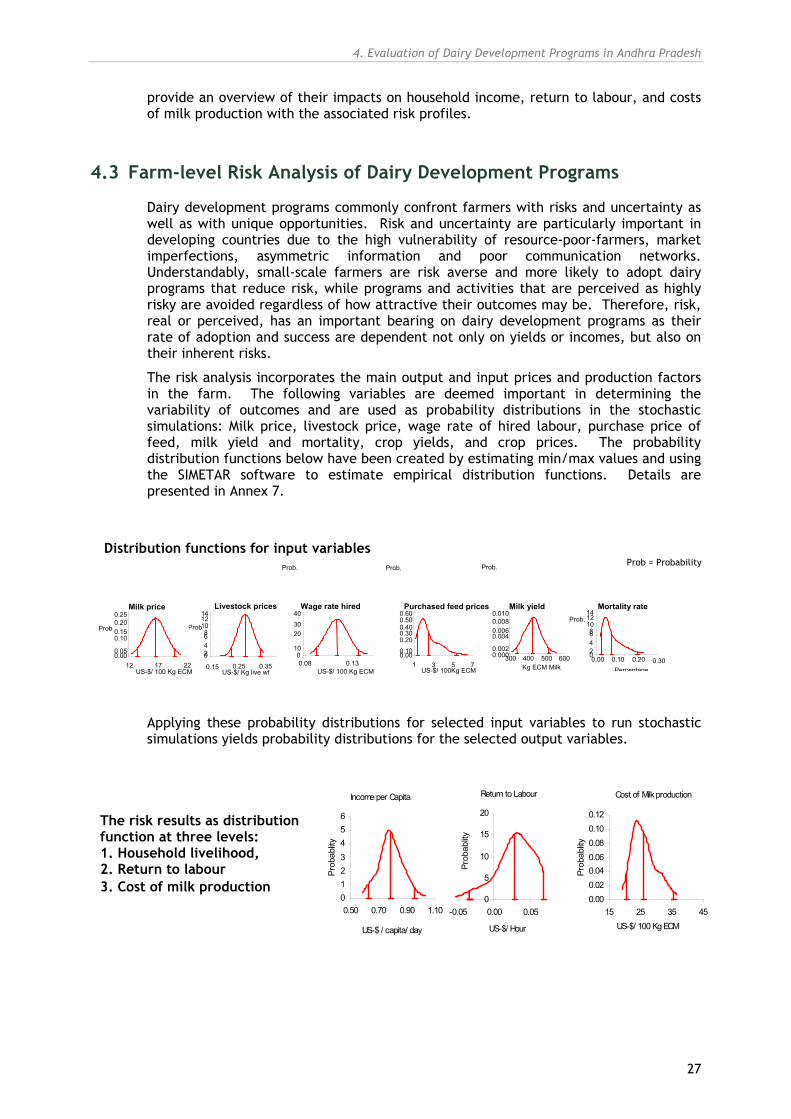
4. Evaluation of Dairy Development Programs in Andhra Pradesh
27
provide an overview of their impacts on household income, return to labour, and costs of milk production with the associated risk profiles.
4.3 Farm-level Risk Analysis of Dairy Development Programs
Dairy development programs commonly confront farmers with risks and uncertainty as well as with unique opportunities. Risk and uncertainty are particularly important in developing countries due to the high vulnerability of resource-poor-farmers, market imperfections, asymmetric information and poor communication networks. Understandably, small-scale farmers are risk averse and more likely to adopt dairy programs that reduce risk, while programs and activities that are perceived as highly risky are avoided regardless of how attractive their outcomes may be. Therefore, risk, real or perceived, has an important bearing on dairy development programs as their rate of adoption and success are dependent not only on yields or incomes, but also on their inherent risks.
The risk analysis incorporates the main output and input prices and production factors in the farm. The following variables are deemed important in determining the variability of outcomes and are used as probability distributions in the stochastic simulations: Milk price, livestock price, wage rate of hired labour, purchase price of feed, milk yield and mortality, crop yields, and crop prices. The probability distribution functions below have been created by estimating min/max values and using the SIMETAR software to estimate empirical distribution functions. Details are presented in Annex 7.
Applying these probability distributions for selected input variables to run stochastic simulations yields probability distributions for the selected output variables.
The risk results as distribution function at three levels: 1. Household livelihood, 2. Return to labour 3. Cost of milk production
Income per Capita
0123456
0.50 0.70 0.90 1.10
US-$ / capita/ day
Prob
ablity
Cost of Milk production
0.000.020.040.060.080.100.12
15 25 35 45US-$/ 100 Kg ECM
Prob
ablity
Return to Labour
0
5
10
15
20
-0.05 0.00 0.05
US-$/ Hour
Prob
ablity
Milk yield
0.0000.002
0.0040.0060.0080.010
300 400 500 600 Kg ECM Milk
Prob.
Livestock prices
0 2 4 6 8 10 12 14
0.15 0.25 0.35 US-$/ Kg live wt
PProb Wage rate hired
0 10 20 30 40
0.08 0.13US-$/ 100 Kg ECM
Prob.
Purchased feed prices
0.000.10
0.200.300.400.500.60
1 3 5 7US-$/ 100Kg ECM
Prob.
Mortality rate
0 2 4 6 8 10 12 14
0.00 0.10 0.20 0.30Percentage
Prob. Milk price
0.00 0.05 0.10 0.15 0.20 0.25
12 17 22 US-$/ 100 Kg ECM
Prob
Distribution functions for input variables Prob = Probability

4. Evaluation of Dairy Development Programs in Andhra Pradesh
28
In order to facilitate the reading and interpretation of the risk associated with the different dairy development programmes, the risk analysis results are presented as a stop light chart as shown below where green signifies as positive outcome, i.e. achieving or surpassing the goal set, red signifies a negative outcome, i.e. falling below a set threshold, while yellow signifies an outcome falling between the previous two.
4.4 Feeding Programs
4.4.1 Description of the Programs Baseline: The farmer has three local buffaloes, with a milk yield of 540 kg per year. The animals graze on public land, using hired labour, for about four hours a day. The animals are fed crop residues and lactating animals receive 0.4 kg of a homemade concentrate mix. The farm has surplus of paddy and jowar straw and family labour. The farmer does not cultivate fodder as only 0.4 of the 3 ha of owned farmland is irrigated.
C-Camp (cattle camp): As a drought relief measure, the farmer receives 5 kg of paddy straw per female-buffalo for 60 days. The family puts in 120 man-hours (from unutilised labour) to care for the animals, which must stay within the camp premises, but hired labour for grazing is reduced by 240 man-hours. Other management and production parameters remain unchanged.
Urea Straw: The farmer utilises urea and requires 35 additional man-hours to mix, store and feed urea-treated straw to lactating animals. Due to an improved nutritional balance, animals have a higher dry matter intake and milk yield increases to 608 kg/year.
Groundnut: The farmer feeds more by-pass protein to better utilize the paddy straw and low quality grasses available. Groundnuts are locally produced and widely fed to ruminants, and milk yield increases to 621 kg/year.
All Straw: Since the farm produces a surplus of straw, the farmer buys both concentrates and green fodder to utilize all straw produced on the farm. The farmer declines to reduce land dedicated to rice to plant fodder for the animals.
G-Fodder: The farmer replaces some land of rice with Napier to produce an extra 2.5 tons of green fodder needed to utilize all the straw from the farm. About 100 man-hours of family labour are re-allocated to cultivate, cut-and-carry, and feed the home-grown fodder. Concentrated by-products such as rice polish and groundnut cake is bought in.
The risk results as stoplight chart.
Green: Good Yellow: Moderate Red: Bad
Prob. of a higher Household Income
0%
20%
40%
60%
80%
100%
Example farm
Above World Bank Poverty line
Between Baseline & Poverty line
Below Baseline
Prob. of Cost of Milk Production
0%
20%
40%
60%
80%
100%
Example farm
Below milk price
Closer to milk price +/-10 %Above milk price
Prob. of return to dairy labour to be;
0%
20%
40%
60%
80%
100%
Example farm
Above regional wage level
Between baseline and regional wage
Below baseline

4. Evaluation of Dairy Development Programs in Andhra Pradesh
29
GF-Cutter (green fodder cutter): Once the farmer grows fodder, he buys a chaff cutter to chop the fodder. This decreases fodder spoilage, increases dry matter intake of the lactating animals and therefore increases milk yields. The cost of the cutter is deducted over a period of two years.
F-Bank (fodder bank): A group of 10 farmers associate to grow Napier in irrigated public land. The farmer puts in 80 man-hours to plant, care for, and cut-and-carry daily green fodder. Irrigation and fertilizer are available and affordable. The farmer obtains 2.5 tons of green grass for a total cost of 475 Rupees cash.
V-Commons (village community): The farmer, as part of a village project, contributes 50 hours to manage common grazing land and pays a grazing fee of 100 Rs. per adult buffalo. His animals now obtain the required additional 2.5 tons of green fodder with the same amount of hired labour.
Fallow Land: The fodder output from the owned fallow land (1.4 ha) is doubled through more drought-resistant fodder cultivars and more access to irrigation from a public well. Variable costs increase to 1,000 Rs./ha for subsidized irrigation, fertilizer and seeds of an appropriate grass variety and family labour requirements increase by 50 man-hours.
Cattle Feed: The farmer replaces his own groundnut and rice polish feed mix (costing 2,889 Rs./ton) with the cooperative commercial feed mix (costing 5,500 Rs./ton). Milk yield increases and so do various reproductive parameters. However, milk price goes down from 10 to 9.36 Rs/ltr as milk has to be sold to the cooperative.
Complete Feed: The farmer replaces his own groundnut and rice polish feed mix (costing 2,889 Rs/ton) with the cooperative complete feed (costing 4,500 Rs/ton). This feed contains roughages, which makes it less expensive than the cooperative cattle feed. However, again milk price goes down from 10 to 9.36 Rs/ kg as milk has to be sold to the cooperative.

4. Evaluation of Dairy Development Programs in Andhra Pradesh
30
Technical parameters associated with the feeding programs
1 2 3 4 5 6 7 8 9 10 11 12
Herd management Units MN-3 C-Camp UreaStraw Groundnut AllStraw G-Fodder GF-Cutter Fbank Vcommons FallowLand CattleFeed CompletFeed
Adult female units No. 3 3 3 3 3 3 3 3 3 3 3 3
Type of animal Description 0 0 0 0 0 0 0 0 0 0 0 0
Lactation yield (Non-ECM) Kg/ head 540 540 608 621 810 810 810 810 770 743 648 648
Daily lactation yield (Non-ECM) Kg/ head 2.0 2.0 2.3 2.3 3.0 3.0 3.0 3.0 2.9 2.8 2.4 2.4
Fat content (Non-ECM) % 6 6 6 6 6 6 6 6 6 6 6 6
Area under fodder crops Ha 1.07 1.07 1.07 1.07 1.07 1.14 1.14 1.07 1.07 1.11 1.07 1.07
ConcentrateKg/ lact. animal 0.68 0.90 1.01 1.12 1.41 1.55 1.55 1.49 1.37 1.35 1.05 1.19
Minerals Kg/ SAU 0 0 0 0 0 0 0 0 0 0 0 0
Dry fodder Kg/ SAU 2.33 2.27 2.27 2.27 2.88 2.77 2.75 2.83 2.83 2.78 2.27 2.27
Green fodder Kg/ SAU 1.77 1.13 1.72 1.72 2.31 2.20 2.26 2.36 2.28 2.31 1.72 1.72
Concentrate Ton/ yr 0.36 0.48 0.57 0.64 0.80 0.88 0.88 0.85 0.78 0.77 0.59 0.67
Minerals Ton/ yr 0 0 0 0 0 0 0 0 0 0 0 0
Dry fodder Ton/ yr 0 0 0 0 0 0 0 0 0 0 0 0
Green fodder Ton/ yr 4.0 3.0 4.0 4.0 6.5 4.0 4.0 6.5 6.2 4.0 4.0 4.0
Insemination method Description Natural Natural Natural Natural Natural Natural Natural Natural Natural Natural Natural Natural
Breeding costs US$ /hd/yr. 0.59 0.59 0.59 0.59 0.59 0.59 0.59 0.59 0.59 0.59 0.59 0.59
Calving interval Months 20 20 19 19 19 19 19 19 19 19 18 18
Lactation length Days 270 270 270 270 270 270 270 270 270 270 270 270
Age at first calving Months 50 50 50 50 49 48 48 48 48 50 50 50
Medicine expenses
US$ /hd/ yr. 0.74 0.74 0.74 0.74 0.74 0.74 0.74 0.74 0.74 0.74 0.74 0.74
Cow mortality % 5 5 5 4 4 4 4 4 4 4 4 4
Heifer mortality % 4 4 4 4 4 4 3 3 3 3 4 4
Calf mortality % 40 40 40 40 40 35 35 35 35 35 40 40
MN-3: typical farm (Baseline farm) Vcommons: improved village communal grazing land
C-Camp: Cattle Camp (drought relief effort) FallowLand: improved grazing on own farmland
UreaStraw: adding Urea to paddy straw CattleFeed: balanced feed mix (concentrates+vit.+minerals)
Groundnut: protein rich by-product (also used as a source of by-pass protein) CompletFeed: a total mixed ration (roughages+concentrates)
AllStraw: providing other feedstuffs to use all of the homegrown paddy straw ECM = Energy Corrected Milk
G-Fodder: growing fodder on the own farmland SAU: Standard Animal Unit (1 adult female unit)
GF-Cutter: manual fodder chopper means >5% above baseline
Fbank: fodder bank in public land means <5% below baseline
Bought-in Feed (as is)
Daily feeding ration (DM)
Herd reproduction
Health parameters
FEEDING PROGRAMS
Abbreviations:

4. Evaluation of Dairy Development Programs in Andhra Pradesh
31
4.4.2 Impacts of the Programs
Household income
The household currently obtains a total income of 0.80 US-$/capita per day with a probability of 0.47 to achieve an income above this level (and a 0.53 risk to fall below this level).
The feeding programs increase the daily per capita income up to 0.86 US-$ (a 5 percent increase). They also increase the probability of surpassing the 0.80 income level from 0.47 to 0.68 for C-Camp. In other words, the risk of falling below the current income level decreases from 0.55 to 0.32 for the C-Camp program.
Despite these positive results (higher income and lower risk), the impacts are minor. These low impact levels are basically due to the low contribution of the dairy income (16 percent) to total household income.
Dairy competitiveness on the local labour market
The dairy enterprise returns nearly 0.047 US-$/man-hour utilized, with a probability of 0.55 to provide higher returns.
The feeding programs increase the return to dairy labour up to a maximum of 0.114 US-$/man-hour for F-Bank, which is a 45 percent increase relative to with the baseline. The programs also increase the probability of achieving the baseline return to labour to up to 0.90 (as compared with the 0.65 for the baseline).
Interestingly, programs C-Camp and those involving access to sufficient green fodder allow the farm to make a return to labour above 0.10 US-$/hour, which is the regional wage for agricultural labourers. All-Straw shows that the farmer could pay for green fodder at market price in order to utilize all his straw and make a return to labour equal to the regional wage. On the other hand, increasing green fodder output from the farm’s fallow land is predicted to have the lowest impact due to high variable production costs, especially for irrigation.
Competitiveness of milk production
The dairy enterprise has total costs of 24 US-$ to produce 100 kg ECM milk while its milk price is only 16.5 US-$ for the same amount. The chances of bringing total production costs below the milk price level are slim.
The feeding programs reduce the costs of milk production to a minimum of 16 US-$/100kg for F-Bank (a decrease of 33 percent). They also increase the probability of the dairy breaking even (costs = returns) to up to 0.68 percent (from 0 for the baseline) for the F-Bank scenario.
Again, those activities providing access to enough quality green fodder (from on and off-farm) have the highest positive impact on production costs. The impacts of the best feeding strategies could be enhanced by combination with breeding, herd management and health improvement programs (which remain unchanged in these feeding scenarios).
Explanation of variables:
Household income: Income from farming and off farm activities. It includes cash and non cash transactions Per capita calculation: Household Income divided by number people (adult equivalents) in the household Return to labour: For dairy enterprise: Entrepreneur‘s profit plus labour costs divided by total labour input. Cost of milk production: Costs of the dairy enterprise – non milk returns like livestock, manure, etc.

4. Evaluation of Dairy Development Programs in Andhra Pradesh
32
Dairy competitiveness on the local labour market
Competitiveness of milk production
Household income
Household per capita income
0.00
0.20
0.40
0.60
0.80
1.00
1.20M
N-3
C-C
amp
Ure
aStra
w
Gro
undn
ut
AllS
traw
G-F
odde
r
GF-
Cut
ter
Fban
k
Vco
mm
ons
Fallo
wLa
nd
Cat
tleFe
ed
Com
plet
Feed
US
$ / C
apita
/ Da y
BaselinePer capita income/ day1 US$/ Capita/ Day Line
Return to labour
0.00
0.02
0.04
0.06
0.08
0.10
0.12
MN
-3
C-C
amp
Ure
aStra
w
Gro
undn
ut
AllS
traw
G-F
odde
r
GF-
Cut
ter
Fban
k
Vco
mm
ons
Fallo
wLa
nd
Cat
tleFe
ed
Com
plet
Feed
US
$/ h
our
BaselineReturn to LabourRegional wage rate
Costs of milk production
0
5
10
15
20
25
MN
-3
C-C
amp
Ure
aStra
w
Gro
undn
ut
AllS
traw
G-F
odde
r
GF-
Cut
ter
Fban
k
Vco
mm
ons
Fallo
wLa
nd
Cat
tleFe
ed
Com
plet
Feed
US
$/ 1
00 K
g E
CM
Baseline Opportunity costs Costs from P&L account - non-milk returns Milk price
Probability of cost of milk production to be:
0%
10%
20%
30%
40%
50%
60%
70%
80%
90%
100%
MN
-3
C-C
amp
Ure
aStra
w
Gro
undn
ut
AllS
traw
G-F
odde
r
GF-
Cut
ter
Fban
k
Vco
mm
ons
Fallo
wLa
nd
Cat
tleFe
ed
Com
plet
Feed
Below milk price
+/- 10% around milk price
Above milk price
Probability of return to dairy labour to be:
0%
10%
20%
30%
40%
50%
60%
70%
80%
90%
100%M
N-3
C-C
amp
Ure
aStra
w
Gro
undn
ut
AllS
traw
G-F
odde
r
GF-
Cut
ter
Fban
k
Vco
mm
ons
Fallo
wLa
nd
Cat
tleFe
ed
Com
plet
Feed
Above regional wage levelBetween baseline and regional wageBelow baseline
Probability for household income to be:
0%10%20%30%40%50%60%70%80%90%
100%
MN
-3
C-C
amp
Ure
aStra
w
Gro
undn
ut
AllS
traw
G-F
odde
r
GF-
Cut
ter
Fban
k
Vco
mm
ons
Fallo
wLa
nd
Cat
tleFe
ed
Com
plet
Feed
Above 1 US$/ Cap/ Day lineBetween Baseline & 1 US$ lineBelow Baseline

4. Evaluation of Dairy Development Programs in Andhra Pradesh
33
4.5 Milk Marketing Programs
4.5.1 Description of the Programs C-Member (cooperative member): As a member of the cooperative, the farmer sells all his milk to the cooperative, which pays a 6.5 percent lower price than local vendors. Therefore, the milk price is reduced accordingly in the calculations. Farmers keep selling to the cooperative because it provides them with the only assured milk market, and more regular and timely payment throughout the year (unlike the alternative of local milk vendors).
Qtr-Coop (quarter cooperative): The farmer sells 25 percent of his marketable milk to the cooperative in order to maintain his membership and utilize the services of the society when needed. The rest of the milk is sold to local vendors who offer higher prices especially during the lean season.
C-Plant (cooling plant): The milk cooperative purchases cooling equipment and adds value to the local milk. Currently, most of the local milk is shipped as raw material to be processed in the capital city of Hyderabad. Due to this local processing, the cooperative pays the farmer an 8 percent higher milk price. The farmer sells all his milk to the cooperative.
C-Cooling: The milk cooperative installs cooling units and the farmer obtains a 2.7 percent higher milk price due to less milk spoilage and better quality milk, especially during evening milking and the summer season. The farmer sells all his milk to the cooperative
Fatomatic: The milk cooperative pays the farmer a 16 percent higher milk price due to installing milk-fat testing machines in its collection centres. The farmer sells all his milk to the cooperative.
Coop Union: The milk cooperative pays the farmer an 11 percent higher milk price due to becoming autonomous and therefore making better and quicker business decisions. The farmer sells all his milk to the cooperative.
Fodder Sales: The farmer replaces the rice crop with green fodder (Napier). He sells all his green fodder and by-products from other crops such as jowar. The family living expenses increase to buy rice, milk and manure for fuel, which were supplied by own farm production (for a total annual market value of US-$ 67, 48 and 33 respectively). The family farm labour needs are reduced, but their off-farm working time is kept unchanged.
Labour Sales: The household operates as in the baseline situation and dedicates around 2,700 hours to off-farm work, which is the maximum employment potential this family has in the area.
WSHG (woman self-help group): The family joins a Women Self-Help Group, whose members invest in a mini-dairy plant to process and pack their milk in plastic bags. Members must invest the equivalent to about 13 US-$ per adult dairy animal owned per year. The group expects to obtain a milk price at least 20 percent higher than that paid by the local vendor, once the profits from the dairy plant are distributed to the members.
Coop12: Milk unions in other areas of the state pay up to 15 Rupees per kg of quality buffalo milk (0.33 US-$). Farmers in Mahboobnagar welcome a similar opportunity to sell top quality milk for at least 12 Rupees per kg (0.27 US-$).

4. Evaluation of Dairy Development Programs in Andhra Pradesh
34
Technical parameters associated with the marketing programs
1 2 3 4 5 6 7 8 9 10 11
Herd management Units MN-3 C-membr QtrCoop C-plant C-Cooling Fatomatic CoopUnion FodderSales LabourSales WSHG Coop-12
Adult female units No. 3 3 3 3 3 3 3 0 3 3 3
Type of animal Description
Local Buffalo
Local Buffalo
Local Buffalo
Local Buffalo
Local Buffalo
Local Buffalo Local Buffalo N/A Local Buffalo
Local Buffalo
Local Buffalo
Lactation yield (Non-ECM) Kg/ head 540 540 540 540 540 540 540 0 540 540 540
Daily lactation yield (Non-ECM) Kg/ head 2 2 2 2 2 2 2 0 2 2 2
Milk price US$/ 100 kg ECM 16.62 15.56 16.35 16.80 15.97 18.05 17.22 0 16.62 19.94 19.94
Fat content (Non-ECM) % 6 6 6 6 6 6 6 0 6 6 6Area under fodder crops Ha 1 1.07 1.07 1.07 1.07 1.07 1.07 0 1.07 1.07 1.07
Concentrate Kg/ lact. animal 0.68 0.68 0.68 0.68 0.68 0.68 0.68 0 0.68 0.68 0.68
Minerals Kg/ SAU 0 0 0 0 0 0 0 0 0 0 0
Dry fodder Kg/ SAU 2.33 2.33 2.33 2.33 2.33 2.33 2.33 0 2.33 2.33 2.33
Green fodder Kg/ SAU 1.77 1.77 1.77 1.77 1.77 1.77 1.77 0 1.77 1.77 1.77
Concentrate Ton/ yr 0.36 0.36 0.36 0.36 0.36 0.36 0.36 0 0.36 0.36 0.36
Minerals Ton/ yr 0 0 0 0 0 0 0 0 0 0 0
Dry fodder Ton/ yr 0 0 0 0 0 0 0 0 0 0 0
Green fodder Ton/ yr 4 4 4 4 4 4 4 0 4 4 4
Insemination method Description Natural Natural Natural Natural Natural Natural Natural 0 Natural Natural Natural
Breeding costs US$ /hd/yr. 1 0.59 0.59 0.59 0.59 0.59 0.59 0 0.59 0.59 0.59
Calving interval Months 20.00 20 20 20 20 20 20 0 20 20 20
Lactation length Days 270 270 270 270 270 270 270 0 270 270 270
Age at first calving Months 50 50 50 50 50 50 50 0 50 50 50
Medicine expenses US$ /hd/ yr. 0.74 0.74 0.74 0.74 0.74 0.74 0.74 0 0.74 0.74 0.74
Cow mortality % 5 5 5 5 5 5 5 0 5 5 5
Heifer mortality % 4 4 4 4 4 4 4 0 4 4 4
Calf mortality % 40 40 40 40 40 40 40 0 40 40 40
MN-3: typical farm (Baseline farm) LaborSales: household sells maximun labor time for off-farm work
C-membr: farmer becomes a cooperative member WSHG: women self-help group associated for milk marketing
QtrCoop: farmer sells only 25 percent of marketable milk to the Cooperative Coop12: Cooperative pays 12 Rs/ kg of buffalo milk
C-plant: cooperative set up a processing plant in the current facilities ECM = Energy Corrected Milk
C-Cooling: cooperative install cooling units and summer milk wastage is minimised SAU: Standard Animal Unit (1 adult female unit)
Fatomatic: cooperative installs milk testing machines in collection centers means >5% above baseline
CoopUnion: the cooperative become autonomous means <5% below baseline
FodderSales: farmer keeps no dairy animals and sells by-products & green fodder
MARKETING PROGRAMS
Abbreviations:
Daily feeding ration (DM)
Bought-in Feed (as is)
Herd reproduction
Health parameters

4. Evaluation of Dairy Development Programs in Andhra Pradesh
35
4.5.2 Impacts of the programs
Household income
The household currently obtains a total income of 0.80 US-$/capita per day with a probability of 0.47 to achieve an income above this level (and a 0.53 risk to fall below this level).
The assessed marketing programs increase the per capita income to 0.926 (about 14 percent increases for both Fodder Sales and Labour Sales), indicating the relevance of a local fodder market and more off-farm employment for increasing the total income of this type of household. Regarding the Fodder Sales scenario, the family must spend more in purchasing rice, milk and manure as to keep the same living standard as in the Baseline farm.
Likewise, these programs have slight impacts on improving the risk profile of the household income, except for the Fodder Sales, Labour Sales, Coop 12, and Fatomatic. From these four programs, the Fodder Sales scenario demands cautions from the reader, since the set of risk input variables used in this study excludes relevant risk factors affecting a fodder crop enterprise. This is why the risk of a low household income is highly underestimated.
Dairy competitiveness on the local labour market
The dairy enterprise returns nearly 0.047 US-$/man-hour utilized, with a probability of 0.55 to provide higher returns.
The marketing programs increase the return to dairy labour to up to 0.095 US-$/man-hour (about 100 percent increase for the Coop-12 with respect to the baseline). They also increase the probability of earning a higher return to labour than the current 0.05 US-$ to up to 0.86 and Coop-12 even achieves a probability of 0.19 of obtaining a return to labour above the regional wage rate.
All scenarios, except the C-Member, reduce the risk of achieving a return to labour below the baseline level. This can be explained by the lower milk price paid by the cooperative to its members on one hand, and, on the other hand, by the poor access and little capability of this farm to capitalize on the services provided by the cooperative.
Competitiveness of milk production
The dairy enterprise has total costs of 24 US-$ to produce 100 kg ECM milk while its milk price is only 16.5 US-$ for the same amount. The chances of bringing production costs below the milk price level are extremely slim.
The marketing programs assessed reduce costs of milk production to 21 US-$/100 kg milk (a decrease of 13 percent). More importantly, they also increase the probability of the farm breaking even (costs = returns) to 0.41 as compared to 0 for the baseline.
As shown by the Fatomatic scenario, farmers see the poor recording of fat content in their buffalo milk as one of the main reasons for the low cooperative milk price. (Cooperative representatives, along with farmers, provided their perspectives in building this scenario.)
Explanation of variables: Household income: Income from farming and off farm activities. It includes cash and non cash transactions Per capital calculation: Household income divided by number people (adult equivalents) in the household Return to labour: For dairy enterprise: Entrepreneur‘s profit plus labour costs divided by total labour input. Cost of milk production: Costs of the dairy enterprise – non milk returns like livestock, manure, etc. Stoplight chart: It is a simplified way to show the risk results by probabilities of reaching targets. Stoplight chart costs: Below/above milk price means costs are at least 10% below/10% above the milk price

4. Evaluation of Dairy Development Programs in Andhra Pradesh
36
Competitiveness of milk production
Dairy competitiveness on the local labour market
Household income
Household per capita income
0.00
0.20
0.40
0.60
0.80
1.00
1.20M
N-3
C-m
embr
QtrC
oop
C-p
lant
C-C
oolin
g
Fato
mat
ic
Coo
pUni
on
Fodd
erSa
les
Labo
urSa
les
WS
HG
Coo
p-12
US$
/ C
apita
/ Day
BaselinePer capita income/ day1 US$/ Capita/ Day Line
Return to labour
0.00
0.02
0.04
0.06
0.08
0.10
0.12
MN
-3
C-m
embr
QtrC
oop
C-p
lant
C-C
oolin
g
Fato
mat
ic
Coo
pUni
on
Fodd
erSa
les
Labo
urSa
les
WS
HG
Coo
p-12
US$
/ hou
r
BaselineReturn to LabourRegional wage rate
Costs of milk production
0
5
10
15
20
25
MN
-3
C-m
embr
QtrC
oop
C-p
lant
C-C
oolin
g
Fato
mat
ic
Coo
pUni
on
Fodd
erSa
les
Labo
urSa
les
WS
HG
Coo
p-12
US$
/ 100
Kg
ECM
Baseline Opportunity costs Costs from P&L account - non-milk returns Milk price
Probability for household income to be:
0%
10%
20%
30%
40%
50%
60%
70%
80%
90%
100%
MN
-3
C-m
embr
QtrC
oop
C-p
lant
C-C
oolin
g
Fato
mat
ic
Coo
pUni
on
Fodd
erSa
les
Labo
urSa
les
WS
HG
Coo
p-12
Above 1 US$/ Cap/ Day lineBetween Baseline & 1 US$ lineBelow Baseline
Probability of cost of milk production to be:
0%
10%
20%
30%
40%
50%
60%
70%
80%
90%
100%
MN
-3
C-m
embr
QtrC
oop
C-p
lant
C-C
oolin
g
Fato
mat
ic
Coo
pUni
on
Fodd
erSa
les
Labo
urSa
les
WSH
G
Coo
p-12
Below milk price +/- 10% around milk price Above milk price
Probability of return to dairy labour to be:
0%
10%
20%
30%
40%
50%
60%
70%
80%
90%
100%
MN
-3
C-m
embr
QtrC
oop
C-p
lant
C-C
oolin
g
Fato
mat
ic
Coo
pUni
on
Fodd
erSa
les
Labo
urSa
les
WS
HG
Coo
p-12
Above regional wage levelBetween baseline and regional wageBelow baseline

4. Evaluation of Dairy Development Programs in Andhra Pradesh
37
4.6 Husbandry Programs
4.6.1 Description of the Programs Watering: Livestock in Mahboobnagar normally face high temperatures and direct solar radiation, which increases the need for water. In spite of these conditions, buffaloes in MN-3 farm types tend to graze for most of the day with little or no access to water for drinking, let alone to bathe as is typical for water buffalo. Therefore, this scenario assumes the farmer uses more labour to provide animals with drinking water (ad libitum three times per day instead of twice as is currently the case) and yield increases by 8 percent.
Calf Rearing: As part of a program, the farmer obtains a weekly allowance of concentrated calf feed equivalent to 0.25 kg per day per calf under six months of age. This feed is given free of charge and the family only needs to allocate time to pick up the feed and give it to the calves. The benefits are lower calf mortality (down from 40 to 25 percent, which translates into higher cattle sales and ultimately lowers the costs of producing milk.
Prenatal: Pregnant animals receive 0.75 kg of concentrates during the last trimester of gestation. As a consequence, milk yield increases by 15 percent while female-buffalo mortality decreases to 30 percent.
Stall Feeding: All buffaloes are kept in confinement, which increases milk yield but also costs such as feed, veterinary medicine, breeding, etc. Buffaloes do not graze on public land (cheaper fodder) and must be artificially inseminated as they no longer have access to local bulls at grazing.
Building: Insulation of the barn roof against solar heat is improved and animals are kept in the barn during the peak hot time of the day. Heat stress is significantly reduced, which increases dry matter intake, milk yield and conception rate.
Yield: The farmer increases fodder and concentrate purchases to reach the state-average-daily yield of 2.5 kg per lactating animal. Reproductive (inter-calving period, days dry, etc) parameters remain unchanged.
DIM (days in milk): The days in milk (lactation length) increase from 270 to 280 and the inter-calving period decreases from 20 to 18 months due to improved management. Daily milk yield is kept unchanged and this scenario assesses the impact of improving the reproductive parameters of the farm while keeping all other parameters unchanged. Feed use is increased to cover the increase in annual milk output.
Yield + DIM: The farm achieves both a daily milk yield of 2.5 kg and more days in milk per animal per year (a combination of the previous two scenarios). Feed purchases and other production factors are adjusted accordingly.

4. Evaluation of Dairy Development Programs in Andhra Pradesh
38
Technical parameters associated with the husbandry programs
1 2 3 4 5 6 7 8 9
Herd management Units MN-3 Watering CalfRearing Prenatal Stall Feeding Yield DIM Yield+DIM BuildingAdult female units No. 3 3 3 3 3 3 3 3 3
Type of animal Description Local Buffalo Local Buffalo Local Buffalo Local Buffalo Local Buffalo Local Buffalo Local Buffalo Local Buffalo Local Buffalo
Lactation yield (Non-ECM) Kg/ head 540 581 540 621 675 675 560 700 621
Daily lactation yield (Non-ECM) Kg/ head 2.00 2.15 2.00 2.30 2.50 2.50 2.00 2.50 2.30
Intercalving period Days 610 610 610 580 580 610 549 549 580
Fat content (Non-ECM) % 6 6 6 6 6 6 6 6 6Area under fodder crops Ha 1.07 1.07 1.07 1.07 1.07 1.07 1.07 1.07 1.07
Concentrate Kg/ lact. animal 0.68 0.68 0.76 1.36 1.35 1.31 0.95 1.35 1.26
Minerals Kg/ SAU 0 0 0 0 0 0 0 0 0
Dry fodder Kg/ SAU 2.33 2.33 2.44 2.49 2.30 2.27 1.58 2.24 2.39
Green fodder Kg/ SAU 1.77 1.77 1.63 1.67 1.75 1.72 1.72 1.78 1.75
Concentrate Ton/ yr 0.36 0.36 0.41 0.77 0.77 0.70 0.59 0.84 0.71
Minerals Ton/ yr 0 0 0 0 0 0 0 0 0
Dry fodder Ton/ yr 0 0 0 0 0 0 0 0 0
Green fodder Ton/ yr 4 4 4 4 4 4 4 5 4
Insemination method Description Natural Natural Natural Natural Artificial Natural Natural Natural Natural
Breeding costs US$ /hd/yr. 0.59 0.59 0.59 0.59 3.31 0.59 0.59 0.59 0.59
Calving interval Months 20 20 20 19 19 20 18 18 19
Lactation length Days 270 270 270 270 270 270 280 280 270
Age at first calving Months 50 50 48 48 48 50 50 48 48
Medicine expenses US$ /hd/ yr. 0.74 0.74 0.74 0.74 1.10 0.74 0.74 0.74 0.74
Cow mortality % 5.0 5.0 5.0 3.5 4.0 5.0 5.0 4.0 5.0
Heifer mortality % 4.0 4.0 3.5 3.5 4.0 4.0 4.0 3.0 4.0
Calf mortality % 40 40 25 30 40 40 40 20 40
MN-3: typical farm (Baseline farm) Yield+DIM: both yields and days in milk increase
Watering: buffaloes have access to water three times aday (instead of only 2 as now) Building: better insolated roof lowers buffaloes' heat stress
CalfRearing: calves receive a concentrate supplement during the first 6 months of life ECM = Energy Corrected Milk
Prenatal: dry buffaloes are fed a concentrate feed mix during the last trimester of pregnancy SAU: Standard Animal Unit (1 adult female unit)
Stall Feeding: buffaloes are fully confined means >5% above baseline
Yield: buffaloes reach the average state milk yield for such non-descript animals means <5% below baseline
DIM: days in milk per buffalo per year is increased to the levels of local well-managed buffalo farms
HUSBANDRY PROGRAMS
Abbreviations:
Daily feeding ration (DM)
Bought-in Feed (as is)
Herd reproduction
Health parameters

4. Evaluation of Dairy Development Programs in Andhra Pradesh
39
4.6.2 Impacts of the Programs
Household income
The household currently obtains a total income of 0.80 US-$/capita per day with a probability of 0.47 to achieve an income above this level (and a 0.53 risk to fall below this level).
The programs of improved animal husbandry increase the per capita income up to 0.88 US-$ per day (i.e. 8.6 percent for the Yield+DIM program). They also increase the probability of making or surpassing the 0.80 US-$/day income mark up to 0.73 from the 0.45 probability of the baseline situation.
Despite these positive results (higher income and lower risk), the overall impacts are again slight due to the low share of the dairy income (of only 16 percent) in the total household income of the baseline farm.
Dairy competitiveness on the local labour market
The assessed changes in husbandry practices increase the return to dairy labour to up to 0.12 US-$ per man-hour, equivalent to a 150 percent increase, for Yield+DIM compared to the baseline situation. An interesting case is Stall Feeding, which increases risk. The probability of achieving the regional wage rate is 0.55 for the baseline while Stall Feeding only has a 0.47 probability of obtaining the same result despite the higher predicted income. On the other hand, Stall Feeding has a probability of obtaining a return to labour above the Regional wage rate of 0.03, while for the baseline case this probability is nil. Overall, however, this scenario is likely to be perceived as too risky by this type of farmer.
Higher yields combined with more days in milk (Yield+DIM) increases the chances to reach the regional wage from 0 to 0.37 while also reducing the risk of falling below the baseline return from 0.45 to 0.08. This scenario however requires more working capital than this household currently has at its disposal.
Competitiveness of milk production
The assessed husbandry practices bring costs of milk production down to 16 US-$ / 100 kg, a decrease of 33 percent, for the Yield+DIM scenario. They also increase the probability of the farm breaking even (costs = returns) to up to 0.73. The probability to bring costs of milk production below the milk price increased from 0 (baseline) to up to 0.13.
All the scenarios of improved husbandry reduce the cost of milk production and make this farm type very competitive in the local as well as global dairy market.
Explanation of variables: Household income: Income from farming and off farm activities. It includes cash and non cash transactions Per capita calculation: Household Income divided by number people (adult equivalents) in the household Return to labour: For dairy enterprise: Entrepreneur‘s profit plus labour costs divided by total labour input. Cost of milk production: Costs of the dairy enterprise – non milk returns like livestock, manure, etc. Stoplight chart: A simplified way to show the risk results by probabilities of reaching target values. Stoplight chart costs: Below/above milk price means costs are at least 10% below/10% above the milk price

4. Evaluation of Dairy Development Programs in Andhra Pradesh
40
Household income
Dairy competitiveness on the local labour market
Competitiveness of milk production
Household per capita income
0.00
0.20
0.40
0.60
0.80
1.00
1.20M
N-3
Wat
erin
g
Cal
fRea
ring
Pre
nata
l
Sta
ll Fe
edin
g
Bui
ldin
g
Yie
ld
DIM
Yie
ld+D
IM
US$
/ C
apita
/ Day
Per capita income/ dayBaseline1 US$/ Capita/ Day Line
Return to labour
0.00
0.02
0.04
0.06
0.08
0.10
0.12
MN
-3
Wat
erin
g
Cal
fRea
ring
Pre
nata
l
Sta
ll Fe
edin
g
Bui
ldin
g
Yie
ld
DIM
Yie
ld+D
IM
US
$/ h
our
BaselineReturn to LabourRegional wage rate
Costs of milk production
0
5
10
15
20
25
MN
-3
Wat
erin
g
Cal
fRea
ring
Pre
nata
l
Sta
ll Fe
edin
g
Bui
ldin
g
Yie
ld
DIM
Yie
ld+D
IM
US$
/ 100
Kg
ECM
Baseline Opportunity costs Costs from P&L account - non-milk returns Milk price
Probability for household income to be:
0%
10%
20%
30%
40%
50%
60%
70%
80%
90%
100%
MN
-3
Wat
erin
g
Cal
fRea
ring
Pre
nata
l
Sta
ll Fe
edin
g
Bui
ldin
g
Yie
ld
DIM
Yie
ld+D
IM
Above 1 US$/ Cap/ Day lineBetween Baseline & 1 US$ lineBelow Baseline
Probability of cost of milk production to be:
0%
10%
20%
30%
40%
50%
60%
70%
80%
90%
100%
MN
-3
Wat
erin
g
Cal
fRea
ring
Pre
nata
l
Sta
ll Fe
edin
g
Bui
ldin
g
Yie
ld
DIM
Yie
ld+D
IM
Below milk price +/- 10% around milk price Above milk price
Probability of return to dairy labour to be:
0%
10%
20%
30%
40%
50%
60%
70%
80%
90%
100%
MN
-3
Wat
erin
g
Cal
fRea
ring
Pre
nata
l
Sta
ll Fe
edin
g
Bui
ldin
g
Yie
ld
DIM
Yie
ld+D
IM
Above regional wage levelBetween baseline and regional wageBelow baseline
4. Evaluation of Dairy Development Programs in Andhra Pradesh
41
4.7 Breeding Programs
4.7.1 Description of the Programs
Herd-Reduction: The farmer sells his three local buffaloes and purchases two grade buffaloes. Production parameters for this scenario were obtained from an existing 2-grade-buffalo farm in the study area.
1-Grade+Loan: The farmer sells one of his local buffaloes and obtains a loan of 5,000 Rupees (12% interest rate over 3 years) to buy a grade buffalo. As a condition for obtaining the loan, he pays 280 Rs. / year for life insurance for this grade buffalo (insurance fee = 8.4 percent of the purchase price of 10.000 Rs.). The two local buffaloes are grazed as before while the grade buffalo is stall-fed. This decreases both the cost of hired labour for grazing (down to 2/3 since the farmer normally pays a fee per animal joining the communal grazing herd, which is looked after by a herdsman) and the green fodder obtained from public land (down to 2/3). As a second condition for the loan, the farmer grows 5 tons of green fodder on his own land. Costs for concentrates, medicine and artificial insemination for the grade buffalo increase.
1-Grade: Instead of purchasing a lactating grade buffalo, the farmer raises a grade buffalo from his own herd. All the conditions detailed in the previous scenario (1-Grade+Loan) apply, except that the farmer does not have to repay a loan nor take out animal life insurance. (It would take over four years after successful insemination for this animal to be productive).
2-Grade+Loan: After having successfully reared one grade buffalo, the farmer decides to sell one of his two local animals, obtain a loan and to buy an adult grade buffalo. The payments and conditions are as in 1-Grade+Loan, but the changes in herd management and performance are more significant since no hired labour is needed for grazing (all animals are stall fed) and over nine tons of green fodder must be home-grown each year.
2-Grade: Instead of purchasing the second grade lactating buffalo, the farmer raises it from his own herd. All the conditions of the previous scenario (2-Grade+Loan) apply, except that the farmer has no loan to repay nor to pay animal life insurance fees.
3-Grade+Loan: The farmer decides to replace the last local buffalo in his herd with a grade animal through the same loan procedure (payments and conditions as in 1-Grade+Loan). The farmer now requires over 13 tons of home-grown green fodder, which he produces on half of the irrigated land he owns.
3-Grade: Instead of purchasing the third grade lactating buffalo, the farmer raises it from his own herd. All the conditions of the previous scenario (3-Grade+Loan) apply, except that the farmer has no loan and no animal life insurance fee to pay.
5-Grade: The farmer expands the herd by rearing replacements to five grade buffaloes. In this scenario, the irrigated land is utilized for (green) fodder production solely and over three tons of straw are purchased. Purchases of concentrates, medicine, and services also increase. The family now has to buy rice for own consumption. This scenario assumes that major constraints to farm expansion such as market, finance and farming skills are greatly reduced.

4. Evaluation of Dairy Development Programs in Andhra Pradesh
42
Technical parameters associated with the breeding programs
1 2 3 4 5 6 7 8 9
Herd management Units MN-3 Herd-Reduct 1-Grad+Loan 1-Grad 2-Grad+Loan 2-Grad 3-Grad+Loan 3-Grad 5-Grad
Adult female units No. 3 2 3 3 3 3 3 3 5
Type of animal Description
Local Buffaloes
Graded Buffaloes
1 Graded + 2 Local Buffaloes
1 Graded + 2 Local
Buffaloes
2 Graded + 1 Local
Buffaloes
2 Graded + 1 Local
BuffaloesGraded
BuffaloesGraded
BuffaloesGraded
Buffaloes
Lactation yield (Non-ECM) Kg/ head 540 1400 827 827 1113 1113 1400 1400 1400
Daily lactation yield (Non-ECM) Kg/ head 2 5 3 3 4 4 5 5 5
Intercalving period Days 610 549 590 590 569 569 549 549 549
Fat content (Non-ECM) % 6 6 6 6 6 6 6 6 6Area under fodder crops Ha 1.07 1.22 1.16 1.16 1.21 1.21 1.27 1.27 1.46
Concentrate Kg/ lact. animal 0.68 2.53 1.53 1.53 2.07 2.07 2.50 2.50 2.59
Minerals Kg/ SAU 0 0 0 0 0 0 0 0 0
Dry fodder Kg/ SAU 2.33 3.63 2.73 2.75 3.37 3.37 3.67 3.67 2.57
Green fodder Kg/ SAU 1.77 4.02 2.40 2.42 2.88 2.88 4.16 4.16 5.46
Concentrate Ton/ yr 0.36 1.05 0.83 0.83 1.14 1.14 1.55 1.55 2.68
Minerals Ton/ yr 0 0 0 0 0 0 0 0 0
Dry fodder Ton/ yr 0.00 0.35 0.00 0.00 1.25 1.25 2.00 2.00 3.00
Green fodder Ton/ yr 4.00 0.0 2.67 2.67 0.0 0.0 0.0 0.0 0.0
Insemination method Description NaturalArtificial
Insemination Both BothArtificial
InseminationArtificial
InseminationArtificial
InseminationArtificial
InseminationArtificial
Insemination
Breeding costs US$ /hd/yr. 0.59 1.76 0.98 0.98 1.37 1.37 1.76 1.76 1.76
Calving interval Months 20 18 19 19 19 19 18 18 18
Lactation length Days 270 280 273 273 277 277 280 280 280
Age at first calving Months 50 44 49 49 47 47 44 44 44
Medicine expenses US$ /hd/ yr. 0.74 3.31 1.59 1.59 2.45 2.45 3.31 3.31 3.31
Cow mortality % 5.0 3.0 3.3 4.3 2.0 3.0 3.0 3.0 3.0
Heifer mortality % 4.0 3.5 3.8 3.8 3.3 3.3 3.0 3.0 3.0
Calf mortality % 40 25 37 38 37 37 30 30 30
MN-3: typical farm (Baseline farm) 3-Grad: farmer replaces the last local buffalo and has no loan
Herd-Reduct: the three local buffaloes are replaced by two graded 5-Grad: farmer expands to 5 graded buffaloes
1-Grad+Loan: farmer has a loan and replaces 1 local with a graded buffalo ECM = Energy Corrected Milk
1-Grad: farmer replaces 1 local with a graded buffalo and no loan SAU: Standard Animal Unit (1 adult female unit)
2-Grad+Loan: farmer has a loan and replaces a second local buffalo with a graded one means >5% above baseline
2-Grad: farmer replaces a second local buffalo with a graded one and no loan means <5% below baseline
3-Grad+Loan: farmer has a loan and replaces the last local buffalo with a graded one
Daily feeding ration (DM)
Bought-in Feed (as is)
BREEDING PROGRAMS
Herd reproduction
Abbreviations:
Health parameters
4. Evaluation of Dairy Development Programs in Andhra Pradesh
43
4.7.2 Impacts of the Programs
Household income
The household currently obtains a total income of 0.80 US-$/capita per day with a probability of 0.47 to achieve an income above this level (and a 0.53 risk to fall below this level).
The breeding programs increase the per capita income to up to 0.95, i.e. by about 18 percent, for Herd-Reduct. They also increase the probability of surpassing the 0.80 US-$ per day income to up to 0.94 from the 0.45 probability of the baseline.
Despite these positive results, higher income and lower risk, as seen before, the impacts of the various programs are slight.
Dairy competitiveness on the local labour market
The breeding programs assessed increase the baseline return to dairy labour of 0.047 US-$ / hr to up to 0.08 US-$ / hour, or by 71 percent, for 3-Grade. Having three grade buffaloes increases the probability of achieving the baseline return to labour from 0.55 to 0.80 with a 0.12 probability of achieving a return to labour equivalent to the regional wage rate.
This impact of improved genetics, when combined with an expansion of the herd by two additional grade buffaloes, raises the return to labour to 0.10 US-$ / hr with a probability to achieve least the baseline returns of 0.84.
Competitiveness of milk production
The dairy enterprise has total costs of 24 US-$ to produce 100 kg ECM milk while the milk price received is only 16.5 US-$ per 100 kg ECM. The probability of bringing total production cost down to the current milk price is nil.
The breeding programs reduce the cost of milk production to 18 US-$ / 100 kg, a decrease of 25 percent, for the 1-Grade scenario. They also increase the probability of the farm to break even (costs = returns) from 0 to 0.38 for 3-Grade. Furthermore, unlike the baseline situation, 3-Grade even has a slight (0.02) probability to make an entrepreneurial profit by bringing production costs below milk price.
With respect to herd expansion, 5-Grade reduces production costs to 17 US-$ / 100 kg, i.e. another six percent lower than 3-Grade. Finally 5-Grade has a much lower risk profile since it has a 0.58 probability to reach the break even cost and a 0.12 chance reduce cost to such an extent that the farmer even makes an entrepreneurial profit.
All the breeding programs, including those requiring loans, have a positive impact in terms of reducing the cost of milk production, making these farm types competitive in the local as well as global dairy market.
Explanation of variables: Household income: Income from farming and off farm activities. It includes cash and non cash transactions Per capita calculation: Household Income divided by number people (adult equivalents) in the household Return to labour: For dairy enterprise: Entrepreneur‘s profit plus labour costs divided by total labour input. Cost of milk production: Costs of the dairy enterprise – non milk returns like livestock, manure, etc. Stoplight chart: A simplified way to show the risk results by probabilities of reaching target values. Stoplight chart costs: Below/above milk price means costs are at least 10% below/10% above the milk price

4. Evaluation of Dairy Development Programs in Andhra Pradesh
44
Household income
Dairy competitiveness on the local labour market
Competitiveness of milk production
Household per capita income
0.00
0.20
0.40
0.60
0.80
1.00
1.20M
N-3
Her
d-R
educ
t
1-G
rad+
Loan
1-G
rad
2-G
rad+
Loan
2-G
rad
3-G
rad+
Loan
3-G
rad
5-G
rad
US
$ / C
apita
/ Da y
BaselinePer capita income/ day1 US$/ Capita/ Day Line
Return to labour
0.00
0.02
0.04
0.06
0.08
0.10
0.12
MN
-3
Her
d-R
educ
t
1-G
rad+
Loan
1-G
rad
2-G
rad+
Loan
2-G
rad
3-G
rad+
Loan
3-G
rad
5-G
rad
US
$/ h
our
BaselineReturn to LabourRegional wage rate
Costs of milk production
0
5
10
15
20
25
MN
-3
Her
d-R
educ
t
1-G
rad+
Loan
1-G
rad
2-G
rad+
Loan
2-G
rad
3-G
rad+
Loan
3-G
rad
5-G
rad
US$
/ 100
Kg
ECM
Baseline Opportunity costs Costs from P&L account - non-milk returns Milk price
Probability for household income to be;
0%
10%
20%
30%
40%
50%
60%
70%
80%
90%
100%
MN
-3
Her
d-R
educ
t
1-G
rad+
Loan
1-G
rad
2-G
rad+
Loan
2-G
rad
3-G
rad+
Loan
3-G
rad
5-G
rad
Above 1 US$/ Cap/ Day lineBetween Baseline & 1 US$ lineBelow Baseline
Probability of cost of milk production to be;
0%
10%
20%
30%
40%
50%
60%
70%
80%
90%
100%
MN
-3
Her
d-R
educ
t
1-G
rad+
Loan
1-G
rad
2-G
rad+
Loan
2-G
rad
3-G
rad+
Loan
3-G
rad
5-G
rad
Below milk price +/- 10% around milk price Above milk price
Probability of return to dairy labour to be;
0%
10%
20%
30%
40%
50%
60%
70%
80%
90%
100%M
N-3
Her
d-R
educ
t
1-G
rad+
Loan
1-G
rad
2-G
rad+
Loan
2-G
rad
3-G
rad+
Loan
3-G
rad
5-G
rad
Above regional wage levelBetween baseline and regional wageBelow baseline

4. Evaluation of Dairy Development Programs in Andhra Pradesh
45
4.8 Animal Health Programs
4.8.1 Description of the Programs
Vaccines: The farmer joins the cooperative to take advantage of the lower cost for health services, thereby decreasing veterinary and medicine expenses. Consequently, the farmer gets a lower milk price.
Vet-Clinic: The farmer makes about six visits to the nearest veterinary clinic, which costs him about 24 extra man-hours and doubles yearly expenses for veterinary advice and medicine. The assumed benefits are lower mortality rates, while milk yield remains unchanged.
Vet-to-Farm: The farmer calls in the veterinarian whenever it appears necessary. Farm expenses for the veterinarian and veterinary medicine increase fivefold. The benefits are lower mortality rates and a lower age at first calving. Additionally, milk yield is slightly increased due to better buffalo health particularly during the first trimester of lactation.
Health-INS: The farmer buys a health insurance policy at 200 Rupees per adult buffalo per year. Normally small farmers would pay for health care of adult buffaloes only and when the problem is in advanced stages (since they wait for the animal to recover by itself or with minimal intervention). Having paid an annual insurance fee, farmers are much more alert to detect health problems for all types of animals and call the veterinarian before the problem becomes too serious. This results in better health of lactating animals (consuming and producing more) and lower mortality rates in the whole herd. Although only adult animals are insured, better health conditions spill over young stock through two main ways: (a) farmer becomes more skilled in health issues and (b) farmers start to invest more in the health of their young stock, particularly of the heifers.
INS-Solo: The farmer buys livestock life insurance for all three adult animals. This means that in case of death of a female-buffalo, the farmer receives the current local market price of such an animal. Since the farmer takes out the insurance on his own, he has to pay a policy fee of 15 percent of the animals’ market value for a five year period. All production parameters remain unchanged.
INS-Coop: The farmer joins the cooperative and purchases its livestock life insurance for members. The milk price now is lower, but the same insurance package (as in INS-Solo) only costs him 8.4 percent of the buffaloes’ market value.
INS-WSHG (women self help group): As part of a local Women Self Help Group, the farmer has access to the same livestock life insurance for only 6 percent of the animals’ market value. Experts acknowledge that well-managed local farms could get this type of insurance for 4 to 6 percent of the market value of their animals, since they would be considered low-risk clients. To decrease the risk level for the insurance company, the WSHG requires that veterinary care and medicine expenses per female-buffalo are increased.

4. Evaluation of Dairy Development Programs in Andhra Pradesh
46
Technical parameters associated with the health programs
1 2 3 4 5 6 7 8
Herd management Units MN-3 Vaccines Vet-Clinic Vet-2-Farm Health-INS INS-Solo INS-Coop INS-WSHG
Adult female units No. 3 3 3 3 3 3 3 3
Type of animal Description 0 0 0 0 0 0 0 0
Lactation yield (Non-ECM) Kg/ head 540 540 540 567 621 540 540 540
Daily lactation yield (Non-ECM) Kg/ head 2.00 2.00 2.00 2.10 2.30 2.00 2.00 2.00
Intercalving period Days 610 610 595 580 549 610 610 580
Fat content (Non-ECM) % 6 6 6 6 6 6 6 6Area under fodder crops Ha 1.07 1.07 1.07 1.07 1.07 1.07 1.07 1.07
Concentrate Kg/ lact. animal 0.68 0.68 0.68 0.99 1.22 0.68 0.68 0.68
Minerals Kg/ SAU 0 0 0 0 0 0 0 0
Dry fodder Kg/ SAU 2.33 2.33 2.26 2.19 2.22 2.27 2.27 2.19
Green fodder Kg/ SAU 1.77 1.77 1.72 1.66 1.69 1.72 1.72 1.66
Concentrate Ton/ yr 0.36 0.36 0.37 0.56 0.73 0.36 0.36 0.38
Minerals Ton/ yr 0 0 0 0 0 0 0 0
Dry fodder Ton/ yr 0 0 0 0 0 0 0 0
Green fodder Ton/ yr 4 4 4 4 4 4 4 4
Insemination method Description Natural Natural Natural Natural Natural Natural Natural Natural
Breeding costs US$ /hd/yr. 0.59 0.59 0.59 0.59 0.59 0.59 0.59 0.59
Calving interval Months 20 20 20 19 18 20 20 19
Lactation length Days 270 270 270 270 270 270 270 270
Age at first calving Months 50 50 50 48 46 50 50 48
Medicine expenses US$ /hd/ yr. 0.74 0.62 1.47 3.31 0.00 0.74 0.74 2.21
Cow mortality % 5.0 5.0 4.0 3.5 2.0 0.0 0.0 0.0
Heifer mortality % 4.0 4.0 3.0 3.0 2.5 4.0 4.0 3.0
Calf mortality % 40 40 35 30 30 40 40 30
MN-3: typical farm (Baseline farm) INS-WSHG: through a women self help group, farmer buys
Vaccines: farmer utilizes a subsidized vaccine program run by the Cooperative a group livestock life insurance
Vet-Clinic: farmer takes sick animals to the closest veterinary institution ECM = Energy Corrected Milk
Vet-2-Farm: farmer receives veterinary services at his doorsteps SAU: Standard Animal Unit (1 adult female unit)
Health-INS: farmer buys health insurance for all adult animals means >5% above baseline
INS-Solo: farmer pays for livestock life insurance independently means <5% below baseline
INS-Coop: farmer buys livestock life insurance through the local dairy cooperative
HEALTH PROGRAMS
Herd reproduction
Health parameters
Abbreviations:
Daily feeding ration (DM)
Bought-in Feed (as is)

4. Evaluation of Dairy Development Programs in Andhra Pradesh
47
4.8.2 Impacts of the Programs
Household income
The household currently obtains a total income of 0.80 US-$/capita per day with a probability of 0.47 to achieve an income above this level (and a 0.53 risk to fall below this level).
The health programs marginally increase the per capita income, up to a maximum of 0.83 US-$ / day, about 2 percent, for Health-INS. They however also increase the probability of achieving the baseline income level of 0.80 US-$ / day from 0.45 to up to 0.67.
The livestock insurance scenarios where the farmer purchases livestock insurance at market and cooperative rate show lower expected household incomes than the baseline and higher probabilities of not achieving the baseline income. These two programs are thus much too expensive for this particular type of farmers.
Dairy competitiveness on the local labour market
The dairy enterprise returns 0.047 US-$ / hour utilized, with a probability of 0.55 to overachieve such return.
The health programs have the potential to increase the return to dairy labour from the current level to up to 0.078 US-$ / hour, or by 68 percent, for Health-INS. Two programs, Vet-2-Farm and Health-INS, assume increases in milk yield of 5 and 15 percent respectively, which significantly increases their impact on returns to labour. These two scenarios also increase the probability of exceeding the baseline return to labour from 0.55 to up to 0.83 with 0.02 chance to reach the regional wage level.
The panel expressed the need for affordable quality veterinary services at their doorsteps and their willingness to pay for these services.
Competitiveness of milk production
Some of the health programs bring the cost of milk production down to 17 US-$ / 100 kg ECM, e.g. Health-INS decreases milk production cost by 29 percent. The same programs also increase the probability of the farm to break even (costs = returns) from 0 for the baseline to up to 0.31.
Most of the health programs have the potential to increase competitiveness of milk production, particularly if accompanied by appropriate feeding and management programs. Standing alone, some programs, such as the vaccine or animal life insurance are unattractive for these types of farmers.
Explanation of variables: Household income: Income from farming and off farm activities. It includes cash and non cash transactions Per capita calculation: Household Income divided by number people (adult equivalents) in the household Return to labour: For dairy enterprise: Entrepreneur‘s profit plus labour costs divided by total labour input. Cost of milk production: Costs of the dairy enterprise – non milk returns like livestock, manure, etc. Stoplight chart: A simplified way to show the risk results by probabilities of reaching target values. Stoplight chart costs: Below/above milk price means costs are at least 10% below/10% above the milk price

4. Evaluation of Dairy Development Programs in Andhra Pradesh
48
Competitiveness of milk production
Dairy competitiveness on the local labour market
Household income
Household per capita income
0.00
0.20
0.40
0.60
0.80
1.00
1.20M
N-3
Vac
cine
s
Vet
-Clin
ic
Vet
-2-F
arm
Hea
lth-IN
S
INS
-Sol
o
INS
-Coo
p
INS
-WS
HG
US$
/ C
apita
/ Day
Per capita income/ dayBaseline1 US$/ Capita/ Day Line
Return to labour
0.00
0.02
0.04
0.06
0.08
0.10
0.12
MN
-3
Vac
cine
s
Vet
-Clin
ic
Vet
-2-F
arm
Hea
lth-IN
S
INS
-Sol
o
INS
-Coo
p
INS
-WS
HG
US
$/ho
ur
Return to Labour BaselineRegional wage rate
Costs of milk production
0
5
10
15
20
25
MN
-3
Vac
cine
s
Vet
-Clin
ic
Vet
-2-F
arm
Hea
lth-IN
S
INS
-Sol
o
INS
-Coo
p
INS
-WS
HG
US$
/ 100
Kg
ECM
Baseline Opportunity costs Costs from P&L account - non-milk returns Milk price
Probability for household income to be:
0%
10%
20%
30%
40%
50%
60%
70%
80%
90%
100%
MN
-3
Vac
cine
s
Vet
-Clin
ic
Vet
-2-F
arm
Hea
lth-IN
S
INS
-Sol
o
INS
-Coo
p
INS
-WS
HG
Above 1 US$/ Cap/ Day lineBetween Baseline & 1 US$ lineBelow Baseline
Probability of cost of milk production to be:
0%
10%
20%
30%
40%
50%
60%
70%
80%
90%
100%
MN
-3
Vac
cine
s
Vet
-Clin
ic
Vet
-2-F
arm
Hea
lth-IN
S
INS
-Sol
o
INS
-Coo
p
NS
-WS
HG
Below milk price +/- 10% around milk price Above milk price
Probability of return to dairy labour to be:
0%
10%
20%
30%
40%
50%
60%
70%
80%
90%
100%
MN
-3
Vac
cine
s
Vet
-Clin
ic
Vet
-2-F
arm
Hea
lth-IN
S
INS
-Sol
o
INS
-Coo
p
INS
-WS
HG
Above regional wage levelBetween baseline and regional wageBelow baseline
4. Evaluation of Dairy Development Programs in Andhra Pradesh
49
4.9 Summary: Ranking Program Impacts on Household Incomes
Current Household Income The MN-3 baseline household currently obtains a total daily income of 0.80 US-$ per capita with a probability of 0.47 to achieve an income above this level.
Despite mostly positive impacts of the programs on household incomes (often higher incomes and lower risks), the overall impacts are slight and the household never reaches an income of 1 US-$ per person and day. These low levels impact are basically due to the low share of the dairy income (16 percent) in the total household income portfolio of the baseline farm.
Ranking Programs and Farmers’ Ideas
The three programs with the highest impact on household income are Fodder Sales, Herd-Reduction and Labour Sales, which increase the household while keeping the risk income falling below the baseline at less than 0.10.
1- Fodder Sales increases the household income by 27 percent. In this scenario, the farmer exits dairy farming completely and produces Napier grass for sale to dairy farmers in an organized fodder market. Similarly, he sells other crop by-products. However, the family living expenses increase to purchase the milk and rice formerly sourced from the own farm.
2- Herd-Reduct increases the household income by 18 percent. In this scenario, the farmer sells his three local buffaloes and buys two grade buffalo. The buffaloes are fully confined and receive home-grown green fodder, straw and bought-in concentrates. The family potentially increases its off-farm income as it needs less labour for the dairy.
3- Labour Sales increases the household income by 14 percent. In this scenario, the family keeps the farm as in the baseline and captures as much off-farm employment as possible. All family members combined have an aggregate off-farm employment potential of 2,700 hours a year, which they do not fully utilize.
Other programs, such as 5-Grade and 3-Grade also increase the per capita income, but they are riskier, with a 0.17 chance of decreasing household income.
4- 5-Grade increases the household income by 17 percent. In this scenario, the farmer expands the herd to five grade buffaloes. It is assumed that no loan is needed since herd growth is by rearing replacements. All irrigated land is now used for highly productive fodder crops like Napier grass, but straw and concentrates are bought-in. One full-time person is hired, but the family keeps working off-farm since the regional wage level remains higher than the dairy return to labour.
5- 3-Grade increases the household income by 13 percent. In this scenario, the farmer has three grade buffaloes. It is assumed that no loan is needed since the animals are home grown replacements. The farm produces all the green fodder required, but buys straw and concentrates. Off-farm income remains as in the baseline scenario.
MN-3 household income decreases by 3 percent when the farmer buys livestock insurance as a single farmer or through the cooperative.
Explanation of variables: Household income: Income from farming and off farm activities. It includes cash and non cash transactions. Per capita calculation: Household Income divided by number people (adult equivalents) in the household. Stoplight chart: A simplified way to show the risk results by probabilities of reaching target values.

4. Evaluation of Dairy Development Programs in Andhra Pradesh
50
Household income
Household per capita income
0.00
0.20
0.40
0.60
0.80
1.00
1.20M
N-3
C-C
amp
Ure
aStra
wG
roun
dnut
AllS
traw
G-F
odde
rG
F-C
utte
rFb
ank
Vco
mm
ons
Fallo
wLa
ndC
attle
Feed
Com
plet
Fee
C-m
embr
QtrC
oop
C-p
lant
C-C
oolin
gFa
tom
atic
Coo
pUni
onFo
dder
Sal
esLa
bour
Sal
esW
SH
GC
oop-
12
Wat
erin
gC
alfR
earin
gP
rena
tal
Sta
ll Fe
edin
gB
uild
ing
Yie
ldD
IMY
ield
+DIM
Her
d-R
educ
t1-
Gra
d+Lo
an1-
Gra
d2-
Gra
d+Lo
an2-
Gra
d3-
Gra
d+Lo
an3-
Gra
d5-
Gra
d
Vacc
ines
Vet
-Clin
icV
et-2
-Far
mH
ealth
-INS
INS
-Sol
oIN
S-C
oop
INS
-WS
HG
US
$ / C
apita
/ Day
Per capita income/ dayBaseline1 US$/ Capita/ Day Line
Probability of household income to be:
0%
10%
20%
30%
40%
50%
60%
70%
80%
90%
100%
MN
-3C
-Cam
pU
reaS
traw
Gro
undn
utA
llStra
wG
-Fod
der
GF-
Cut
ter
Fban
kV
com
mon
sFa
llow
Land
Cat
tleFe
edC
ompl
etFe
e
C-m
embr
QtrC
oop
C-p
lant
C-C
oolin
gFa
tom
atic
Coo
pUni
onFo
dder
Sal
esLa
bour
Sal
esW
SH
GC
oop-
12
Wat
erin
gC
alfR
earin
gP
rena
tal
Sta
ll Fe
edin
gB
uild
ing
Yie
ldD
IMY
ield
+DIM
Her
d-R
educ
t1-
Gra
d+Lo
an1-
Gra
d2-
Gra
d+Lo
an2-
Gra
d3-
Gra
d+Lo
an3-
Gra
d5-
Gra
d
Vacc
ines
Vet
-Clin
icV
et-2
-Far
mH
ealth
-INS
INS
-Sol
oIN
S-C
oop
INS
-WS
HG
Below Baseline Between Baseline & 1 US$ line Above 1 US$/ Cap/ Day line

4. Evaluation of Dairy Development Programs in Andhra Pradesh
51
4.10 Summary: Ranking Program Impacts on Return to Labour
Current Situation of Return to Labour in the Dairy Enterprise
The family makes a return of 0.047 US-$ per hour of (man equivalent) labour utilized in the dairy while the off-farm wages are 0.11 US-$ per hour. However, the family off-farm employment is limited to 2,700 hours per year and seasonally bound. This leaves the family with little choice, but to keep dairy farming. The chance of achieving a return to labour above 0.047 per hour lies by 0.55.
Ranking Programs and Farmers’ Ideas
The programs F-Bank (fodder bank), V-Commons, All straw, G-Fodder and C-Camp all increase the returns to dairy labour raising them close to or above the regional wage level. All programs have probabilities between 0.85 and 0.90 to achieve returns above the baseline scenario.
1- F-Bank increases the return to labour by 145 percent. In this scenario, the farmer joins a farmer group that grows green fodder in irrigated public land. Access to extra green fodder and more bought-in concentrates allows him to utilize his home-grown straw and increase milk yield of the local buffaloes. The probability of achieving returns to labour above the baseline is close to 0.90.
2- V-Commons increases the return to labour by 133 percent. In this scenario, the farmer pays a fee per animal grazing on the public land near the village. This allows him to meet the green fodder requirement for the animals to take in more straw and concentrates. This in turn results in a higher milk yield and better reproductive herd performance. The probability of achieving returns to labour above the baseline is close to 0.85.
3- C-Camp increases the return to labour by 125 percent. In this scenario, the farmer receives one ton of straw as part of a drought relief program. Milk yields and prices however remain unchanged. The probability of achieving returns to labour above the baseline is close to 0.88.
On the other hand, three scenarios, namely vaccines (joining the coop to benefit from vaccination programs), INS-Solo (purchase of livestock life insurance as single farmer) and INS-Coop (purchase of livestock life insurance as cooperative member) decrease the returns to dairy labour by 20, 46 and 50 percent.
With respect to risk, seven scenarios increase the probability of returns to labour below the baseline despite raising average / expected returns to labour. This occurs; when the farmer joins the cooperative and receives a lower milk price, when he confines his animals leading to higher input costs, when he buys expensive and more demanding grade buffaloes and when he buys livestock life insurance. Proponents of such dairy development activities must identify measures to decrease the risk for the participating farmers.
Explanation of variables: Return to labour: For dairy enterprise: Entrepreneur‘s profit plus labour costs divided by total labour input. Stoplight chart: A simplified way to show the risk results by probabilities of reaching selected target values.

4. Evaluation of Dairy Development Programs in Andhra Pradesh
52
Dairy competitiveness on the local labour market
Probability of return to dairy labour to be:
0%
10%
20%
30%
40%
50%
60%
70%
80%
90%
100%
MN
-3C
-Cam
pU
reaS
traw
Gro
undn
utA
llStra
wG
-Fod
der
GF-
Cut
ter
Fban
kV
com
mon
sFa
llow
Land
Cat
tleFe
edC
ompl
etFe
e
C-m
embr
QtrC
oop
C-p
lant
C-C
oolin
gFa
tom
atic
Coo
pUni
onFo
dder
Sal
esLa
bour
Sal
esW
SH
GC
oop-
12
Wat
erin
gC
alfR
earin
gP
rena
tal
Sta
ll Fe
edin
gB
uild
ing
Yie
ldD
IMY
ield
+DIM
Her
d-R
educ
t1-
Gra
d+Lo
an1-
Gra
d2-
Gra
d+Lo
an2-
Gra
d3-
Gra
d+Lo
an3-
Gra
d5-
Gra
d
Vac
cine
sV
et-C
linic
Vet-2
-Far
mH
ealth
-INS
INS
-Sol
oIN
S-C
oop
INS
-WS
HG
Below baseline Between baseline and regional wage Above regional wage level
Return to labour input in the dairy enterprise
0.00
0.02
0.04
0.06
0.08
0.10
0.12M
N-3
C-C
amp
Ure
aStra
wG
roun
dnut
AllS
traw
G-F
odde
rG
F-C
utte
rFb
ank
Vco
mm
ons
Fallo
wLa
ndC
attle
Feed
Com
plet
Fee
C-m
embr
QtrC
oop
C-p
lant
C-C
oolin
gFa
tom
atic
Coo
pUni
onFo
dder
Sal
esLa
bour
Sal
esW
SH
GC
oop-
12
Wat
erin
gC
alfR
earin
gP
rena
tal
Sta
ll Fe
edin
gB
uild
ing
Yie
ldD
IMY
ield
+DIM
Her
d-R
educ
t1-
Gra
d+Lo
an1-
Gra
d2-
Gra
d+Lo
an2-
Gra
d3-
Gra
d+Lo
an3-
Gra
d5-
Gra
d
Vac
cine
sV
et-C
linic
Vet-2
-Far
mH
ealth
-INS
INS
-Sol
oIN
S-C
oop
INS
-WS
HG
US$
/ hou
r
Return to Labour Baseline Regional wage rate

4. Evaluation of Dairy Development Programs in Andhra Pradesh
53
4.11 Summary: Ranking Program Impacts on Dairy Competitiveness
Current Situation of the Costs of Milk Production in the Dairy Enterprise
The MN-3 dairy enterprise has total costs of 24 US-$ to produce 100 kg ECM milk while the milk price received is only 16.5 US-$ per 100 kg ECM. The probability of bringing expected total production cost down to the current milk price is nil and the farm has no chance of reaching the break even point (costs = milk price).
Ranking Programs and Farmers’ Ideas
The two programs leading to the largest reduction in the cost of milk production are 5-Grade and F-Bank.
1- 5-Grade decreases the costs of milk production by 31 percent. It increases the probability of breaking even to 0.58 with a 0.12 chance for the dairy to even make an entrepreneurial profit. In this scenario, the farmer expands the herd to five grade buffaloes. It is assumed that this is achieved by rearing replacements and that no loan is needed. All irrigated land is used to produce highly productive fodder crops such as Napier; additional straw and concentrates are bought-in; and one full-time person is hired, while the family keeps working off-farm as the regional wage level remains higher than the dairy return to labour.
2- F-Bank (fodder bank) decreases the costs of milk production by 32 percent. It increases the probability of breaking to 0.57 with a 0.11 chance for the dairy to make an entrepreneurial profit. In this scenario, the farmer joins a farmer group that grows green fodder on irrigated public land. Access to extra green fodder and more bought-in concentrates allows the farmer to utilize his home-grown straw and to increase milk yield of the local buffaloes.
Other programs such as V-Commons and All straw also decrease the costs of milk production by 30 percent with lower probabilities of breaking even of 0.38 and 0.42.
On the other hand, two scenarios increase the costs of milk production by 6 and 12 percent, namely when the farmer buys livestock insurance through the cooperative or as a non-cooperative farmer, respectively. In addition, these scenarios have no positive impact on the level of risk faced in the baseline situation.
Explanation of variables: Cost of milk production: Costs of the dairy enterprise – non milk returns like livestock, manure, etc. Stoplight chart: A simplified way to show the risk results by probabilities of reaching target values. Stoplight chart costs: Below/above milk price means costs are at least 10% below/10% above the milk price

4. Evaluation of Dairy Development Programs in Andhra Pradesh
54
Competitiveness of milk production
Probability of cost of milk production to be:
0%
10%
20%
30%
40%
50%
60%
70%
80%
90%
100%
MN
-3C
-Cam
pU
reaS
traw
Gro
undn
utA
llStra
wG
-Fod
der
GF-
Cut
ter
Fban
kV
com
mon
sFa
llow
Land
Cat
tleFe
edC
ompl
etFe
e
C-m
embr
QtrC
oop
C-p
lant
C-C
oolin
gFa
tom
atic
Coo
pUni
onFo
dder
Sal
esLa
bour
Sal
esW
SH
GC
oop-
12
Wat
erin
gC
alfR
earin
gP
rena
tal
Sta
ll Fe
edin
gB
uild
ing
Yie
ldD
IMY
ield
+DIM
Her
d-R
educ
t1-
Gra
d+Lo
an1-
Gra
d2-
Gra
d+Lo
an2-
Gra
d3-
Gra
d+Lo
an3-
Gra
d5-
Gra
d
Vac
cine
sV
et-C
linic
Vet-2
-Far
mH
ealth
-INS
INS
-Sol
oIN
S-C
oop
INS
-WS
HG
Above milk price +/- 10% around milk price Below milk price
Costs of milk production (only)
0
5
10
15
20
25
30
MN
-3C
-Cam
pU
reaS
traw
Gro
undn
utA
llStra
wG
-Fod
der
GF-
Cut
ter
Fban
kV
com
mon
sFa
llow
Land
Cat
tleFe
edC
ompl
etFe
e
C-m
embr
QtrC
oop
C-p
lant
C-C
oolin
gFa
tom
atic
Coo
pUni
onFo
dder
Sal
esLa
bour
Sal
esW
SH
GC
oop-
12
Wat
erin
gC
alfR
earin
gP
rena
tal
Sta
ll Fe
edin
gB
uild
ing
Yie
ldD
IMY
ield
+DIM
Her
d-R
educ
t1-
Gra
d+Lo
an1-
Gra
d2-
Gra
d+Lo
an2-
Gra
d3-
Gra
d+Lo
an3-
Gra
d5-
Gra
d
Vac
cine
sV
et-C
linic
Vet-2
-Far
mH
ealth
-INS
INS
-Sol
oIN
S-C
oop
INS
-WS
HG
US
$/ 1
00 K
g E
CM
Costs from P&L account - non-milk returns Opportunity costs Baseline costs level Milk price

55
5. DAIRY DEVELOPMENT LADDER FOR MAHBOOBNAGAR
5.1 Introduction
In Mahboobnagar, as in most of India, one can find well-managed buffalo farms producing milk at competitive costs. A number of these farms were identified and production, biological and economic data was collected from them.
These top farms had several characteristics in common such as: (1) access to a relatively reliable milk market, (2) a milk price above 12 Rupees/kg of buffalo milk, (3) above average dairy farming skills, and (4) adequate working capital to cover the variable expenses their more intensified production systems incurred on a daily basis. Assuming that these success factors are not binding constraints for MN-3 to develop into a competitive milk producer, we combined the knowledge gathered from these top farms and the dairy development programs evaluated in the previous section we considered most appropriate and devised a phased development plan for MN-3 type farms, which we refer to as the ‘MN-3 Dairy Development Ladder’.
Local farmers, being the main stakeholders, were asked to comment on the concept and results of the ‘Dairy Development Ladder’ for MN-3 and adjustments were made to it so as to include their viewpoints.
5.2 Overview of the Dairy Development Ladder
Top-MN3: The farmer manages the animals to reach a milk yield 2.5 kg per day per lactating buffalo (25% increase from current level). Reproductive performance of the herd is also excellent for local standards. The animals are grazed with hired labour and the farmer buys one ton of Napier grass and some local concentrates (0.82 tons of groundnut cake and rice polish).
3-Grade: The farmer switches to three grade buffaloes, producing 5 kg milk per head per day and purchases more concentrates (1.55 tons/year of a commercial lactating ration). However he grows all the green fodder required. The herd is stall-fed.
3-Murrah: The farmer upgrades the herd to three Murrah buffaloes, producing 6.5 kg milk per head per day. He purchases even more concentrates (2.15 tons/year of a commercial lactating ration), but he grows all the green fodder required. The herd is stall-fed.
5-Murrah: The farmer expands his herd to five Murrah buffaloes, producing 6.5 kg milk per head per day. In addition to the concentrates (3.48 tons/year of a commercial lactating ration), he has to buy 18 tons of fodder per year his home-grown fodder is not enough. The herd is stall-fed.
10-Murrah: The farmer expands his herd ten Murrah buffaloes, producing 6.5 kg milk per head per day. Due to the high requirements for green fodder, the farmer substitutes the crops of paddy, jowar and castor with Napier and multiple-cut fodder Sorghum. Under these cropping conditions, the farmer must still purchase about 20 tons of green fodder along with 7.16 tons of concentrates. The herd is stall-fed.
This dairy development ladder clearly points to a development strategy with two general phases: first to improve management up to the Top-MN3 case and secondly to reach some degree of dairy intensification and herd expansion that fits within the local conditions and farm resources. The timeframe to realize these two overall phases will depend on how key factors are combined to ‘pull’ the farmers upwards on the ladder.

5. Dairy Development Ladder
56
1 2 3 4 5 6
Herd management Units MN-3 Top-MN3 3-Graded 3-Murrah 5-Murrah 10-Murrah
Adult female units No. 3 3 3 3 5 10
Type of animal Description Local Buffalo Local Buffalo Graded Buffalo Murrah Buffalo Murrah Buffalo Murrah BuffaloLactation yield (Non-ECM) Kg/ head 540 688 1400 1820 1820 1820Daily lactation yield (Non-ECM) Kg/ head 2.0 2.5 5.0 6.5 6.5 6.5
Intercalving period Days 610 549 549 549 549 549Fat content (Non-ECM) % 6 6 6 6 6 6Area under fodder crops Ha 1.07 1.07 1.36 1.46 1.46 1.58
Concentrate Kg/ lact. animal 0.68 1.35 2.50 3.46 3.37 3.46
Minerals Kg/ SAU 0 0 0 0 0 0
Dry fodder Kg/ SAU 2.33 2.33 2.22 2.28 2.14 1.10
Green fodder Kg/ SAU 1.77 1.86 5.91 7.98 8.19 9.11
Concentrate Ton/ yr 0.36 0.82 1.55 2.15 3.48 7.16
Minerals Ton/ yr 0 0 0 0 0 0
Dry fodder Ton/ yr 0.0 0.0 0.0 0.5 2.0 5.0Green fodder Ton/ yr 4 5 0.00 0.00 18 20
Insemination method Description Natural Natural Artificial Artificial Artificial Artificial
Breeding costs US$ /hd/yr. 0.59 0.59 3.31 3.31 3.31 3.31
Calving interval Months 20 18 18 18 18 18
Lactation length Days 270 275 280 280 280 280
Age at first calving Months 50 48 44 42 42 42
Medicine expenses US$ /hd/ yr. 0.74 1.10 4.41 5.51 5.51 5.51
Cow mortality % 5 4 3 3 3 3
Heifer mortality % 4 3 3 3 3 3
Calf mortality % 40 30 25 20 20 20
MN-3: typical farm (Baseline farm) 10-Murrah: potential Murrah buffalo farm
Top-MN3: an existing well managed MN-3 like farm ECM = Energy Corrected Milk
3-Graded: existing well managed 3 graded buffalo farm SAU: Standard Animal Unit (1 adult female unit)
3-Murrah: potential Murrah buffalo farm means >5% above baseline
5-Murrah: potential Murrah buffalo farm means <5% below baseline
Daily feeding ration (DM)
Bought-in Feed (as is)
DAIRY DEVELOPMENT LADDER
Herd reproduction
Health parameters
Abbreviations:

5. Dairy Development Ladder
57
5.3 Economic Outcomes
5.3.1 Household income Currently the household achieves a total daily income of 0.80 US-$/household member with a 0.47 probability to obtain a higher income (and a 0.53 risk to achieve a lower income.)
The proposed development steps increase MN-3’s per capita income to a final level 1.2 US-$ per day, i.e. by 50 percent. The measures also increase the probability of surpassing the daily 0.80 US-$ income level to 0.83 percent (as compared with 0.47 for the baseline). Viewed from another angle, the risk of MN-3 obtaining a meagre daily income below 0.80 US-$ per capita reduces from a high 0.53 to a low 0.17. This decrease in risk has significant positive impacts on the livelihood of subsistence dairy farmers.
5.3.2 Dairy competitiveness on the local labour market The dairy enterprise currently produces a return of 0.047 US-$/hour of (‘man equivalent) labour invested in the dairy, with a probability of 0.55 to exceed this return.
The proposed changes in husbandry increase the return to labour invested in dairy to 0.25 US-$/’man’-hour or by 400 percent compared with the baseline. The probability to achieve a return to labour higher than the baseline is 0.99, and the probability to achieve a return higher than the regional wage level reaches0. 84.
Interestingly all these scenarios decrease risk of the return to labour falling below 0.05 US-$/hour from a high 0.45 to practically nil (0.01 to 0.02).
5.3.3 Competitiveness of milk production MN-3 has total costs of 24 US-$ to produce 100 kg ECM milk while the milk price received is only 16.5 US-$/100 kg. The probability of bringing production costs down to the milk price level (17 US-$) is nil.
The steps in the outlined development ladder enable MN-3 to bring the costs of milk production below the milk price (even when the opportunity costs of family labour are accounted for), which means that the farmer makes an entrepreneurial profit (with a probability of 20 percent).
MN-3 has the potential to make an entrepreneurial profit of 4 to 5 US-$ per 100 kg ECM milk produced, a profit level which is considered high within the IFCN (See the IFCN Dairy Report in any year).
5.4 Conclusion
The result of this ex-ante assessment of the development plan for MN-3 is that this farm type has the potential to become a very competitive milk producer, reduce the risk inherent in farming and substantially improve household income. As a consequence of the sequence of interventions MN-3 develops in a gradual manner, which should present a realistic development path for the predominant milk production system in Mahboobnagar, as it draws on regional expertise and builds on local cases of competitive milk producers

5. Dairy Development Ladder
58
Explanation of variables:
Household income: Income from farming and off farm activities. It includes cash and non cash transactions Per capita calculation: Household Income divided by number people (adult equivalents) in the household Return to labour: For dairy enterprise: Entrepreneur’s profit plus labour costs divided by total labour input. Cost of milk production: Costs of the dairy enterprise – non milk returns like livestock, manure, etc. Stoplight chart: A simplified way to show the risk results by probabilities of reaching target values. Stoplight chart costs: Below/above milk price means costs are at least 10% below/10% above the milk price
Household income
Dairy competitiveness on the local labour market
Competitiveness of milk production
Household per capita income
0.00
0.20
0.40
0.60
0.80
1.00
1.20
1.40
MN
-3
Top-
MN
3
3-G
rade
d
3-M
urra
h
5-M
urra
h
10-M
urra
h
US$
/ C
apita
/ Day
Per capita income/ dayBaseline1 US$/ Capita/ Day Line
Return to labour
0.00
0.05
0.10
0.15
0.20
0.25
MN-
3
Top-
MN
3
3-G
rade
d
3-M
urra
h
5-M
urra
h
10-M
urra
h
US$
/ hou
r
Baseline Regional wage level
Costs of milk production
0
5
10
15
20
25
MN
-3
Top-
MN
3
3-G
rade
d
3-M
urra
h
5-M
urra
h
10-M
urra
h
US$
/ 100
Kg
ECM
Baseline costs level Opportunity costs Costs from P&L account - non-milk returns Milk price
Probability for household income to be:
0%
10%
20%
30%
40%
50%
60%
70%
80%
90%
100%
MN
-3
Top-
MN
3
3-G
rade
d
3-M
urra
h
5-M
urra
h
10-M
urra
h
Above 1 US$/ Cap/ Day lineBetween Baseline & 1 US$ lineBelow Baseline
Probability of cost of milk production to be:
0%
10%
20%
30%
40%
50%
60%
70%
80%
90%
100%
MN
-3
Top-
MN
3
3-G
rade
d
3-M
urra
h
5-M
urra
h
10-M
urra
h
Below milk price +/- 10% around milk price Above milk price
Probability of return to dairy labour to be:
0%
10%20%
30%
40%
50%
60%70%
80%90%
100%
MN
-3
Top-
MN
3
3-G
rade
d
3-M
urra
h
5-M
urra
h
10-M
urra
h
Above regional wage levelBetween baseline and regional wageBelow baseline

59
6. CONCLUSIONS
Milk production in Andhra Pradesh has grown remarkably, but the potential role of dairy farming as a means to increase household income and generate rural employment by increasing the competitiveness of (small-scale) milk production in the state is still far from being realized. For the dairy sector to play this developmental role, there is an urgent need to provide the vast majority of small-scale dairy farmers with a quality livestock service package which is affordable, both to the recipients and the providers, and which has maximum impacts on the key production and financial parameters of the predominant farm types.
The potential benefits of feeding improvements
This study shows that feeding programs are likely to increase the return to dairy labour by an impressive 145 percent, lifting it above the regional wage level for unskilled labour. For dairy households this means that whichever family member stays on the dairy farm, (s)he is likely to obtain a higher notional wage than the family members working off-farm. With such an attractive outcome the question of why not more farmers are adopting better animal feeding practices arises. The answer seems to be complex, but this study points to two main factors for the low adoption of feeding programs: (a) the higher risk associated with the latter and (b) the higher working capital requirements.
The importance of risk
Assessments of livestock services and dairy development programs traditionally have not considered the impacts of adoption on the risk profile of the farms. However, it is well-known that resource-poor farmers are, by necessity, risk avoiders. They are unlikely to participate in a ‘promising’ program if it increases the probability of the farm to fall below its current performance levels as they do not have a financial buffer to mitigate any income shortfall. Therefore, the development programs must simultaneously increase the financial performance as well as the risk profile of the target farms.
Farmers participating in this study were not only highly risk averse but they were also reluctant to make ‘optimistic’ assumptions such as having more or better access to water, working capital, health services and a remunerative and reliable milk price. Such assumptions, however, were a prerequisite for running the program scenarios. Furthermore, MN-3 farmers and those with smaller farms agreed that without these conditions in place to diminish or eliminate their risk in adopting new technologies, they would not subscribe to the main dairy development programs on offer, in spite of their obvious potential benefits. They considered their risk levels as simply too high and gave breeding as an example of how they would have to stop grazing in public land and replace paddy, their main staple food, with green fodder, while producing for a very unreliable market (milk vendors) or for a non-remunerative milk price (from the cooperative).
Lessons for dairy development programs
The vast majority of dairy development programs in Andhra Pradesh, as anywhere else, are not conceived to address the above factors, which however determine the adoption and success of the programs. It is questionable whether it would make practical sense for any one program to tackle all the identified issues. However, a promising approach could be to forge strategic partnerships among already existing programs which are likely to have strong complementary effects. Going back to the farmers’ most quoted example, if MN-3 were going to upgrade its animals, it would require a reliable remunerative milk price, access to affordable quality health services, etc. Consequently, the breeding efforts driven by the Andhra Pradesh Livestock

5. Dairy Development Ladder
60
Development Agency (APLDA) must be accompanied by other complementary programs for enhanced uptake.
The need for one program to partner and / or build on another is evident in the ‘Dairy Development Ladder’ developed with stakeholders in Mahboobnagar. The results indicate that, gradually effective partnerships, among various programs and with the farming community, can effectively lift MN-3 households out of poverty through a competitive dairy farming business, which provides not only an excellent wage level under local conditions, but which is also well-positioned against international competition in a global economy.
The Dairy Development Ladder for MN-3 proposed as long-term goal a herd expansion to five well-managed Murrah buffaloes. This would lead to significant changes in the numbers and sizes of MN-3 type farms. Some will expand, others will remain as they are while a third group is expected to switch to more remunerative activities such as growing fodder for the other two groups. This study shows that when MN-3 quits dairy farming and grows fodder for sale its household income increases, while when daily milk yield per animal reaches 2.5 kg, the farmer can afford to purchase fodder and thereby make a higher dairy income. Both scenarios show that a fodder market could play a vital role in increasing household income while supporting the genetic upgrading and up-scaling of local dairy farms. This study shows athta as in other regions, dairy competitiveness and poverty-alleviating role in Mahboobnagar can be significantly increased by facilitating the adoption of better dairy genetics and larger herds.
61
A1 METHODOLOGICAL BACKGROUND
In this chapter, we will present the methods and sources of information used to collect data about the Andhra Pradesh dairy sector and how the costs of production for the selected typical production systems are calculated.
This project has followed the framework used by the International Farm Comparison Network (IFCN). IFCN is a world-wide association of agricultural researchers, advisors and farmers. These participants select typical agricultural systems in key production regions in their individual countries. In 2004, the number of participating countries extended to 31 countries with 102 farm types that represent more than 80 percent of the world milk production.
The central objectives of IFCN are: 1. To create and maintain a standardised infrastructure through which production data of the major agricultural products (milk, beef, wheat, sugar, etc.) and from major producing regions of the world can be effectively compared and discussed.
2. To analyse the impact of the structure of production, technology applied and country-specific policies on the economic performance of agribusinesses, their costs of production and global competitiveness.
In order to achieve these objectives, IFCN employs the following methods and principles:
Direct contact with the production protagonists. A team of advisors and farmers is put together to set up the typical production models and to revise the final results. This approach brings the results closest to reality.
The principle of ‘Total Costs’. IFCN considers both direct costs and margins, and the indirect (fixed) costs (i.e. depreciation and interests of the infrastructure used) and the opportunity costs for owned assets and production factors (i.e. family labour, land, capital).
A single and homogeneous method is utilised to calculate the costs of production for all participating countries. The IFCN standard is not the only truth, but a) it is scientifically correct, b) it includes all the existing production costs, and c) it creates transparency and international comparability in the arena of costs of agricultural production. Each IFCN member and client can reorganise the costs at his convenience and present them in the particular format of his country while he maintains an internationally comparable set of results.
The concept of setting (regional) typical agricultural models. A team of country experts, advisors and producers is formed to identify and set up the typical regional production models for each agricultural product. Typical production models must represent the common production structures in the region or country.
In the case of dairy production, for example, a working team composed of advisors, consultants and producers is formed as a panel. The first working step is to define the typical milk production systems of the major dairy regions in country. This model may be a 4-cow farm, feeding mostly cut grasses to fully confined animals, combine milk production with some other agricultural activities such as wheat and rice production in 3 ha of irrigated owned land, and milking is done by hand twice a day.
The second working step is to collect all the needed information from these typical models. For this, IFCN has developed a standard questionnaire. It is crucial that these data collected should neither reflect an individual farm (too many particularities may hurt the ability to generalise the results) nor be an arithmetic average (an average does not show much about the technology and the economics involved). The typical model should rather represent real and common situations of the region and show clearly the

A1 Methodological Background
62
predominant technology and infrastructure. Such models will be preferred by analysts. The model TIPI-CAL (Technology Impact and Policy Impact Calculations) is utilised for the simulations of these typical models and the calculations of their costs of production. TIPI-CAL can be easily shared with all IFCN members since it is a spreadsheet in MS-Excel. This model is a combination of production (physical data) and accounting (economic data). TIPI-CAL also consists of both a structure of costs of production and a simulation component (without optimisation). The simulations can be done for a period of up to 10 years in order to evaluate the growth, investments, policies or market conditions. For each year, TIPI-CAL produces a ‘Profit and Loss Account’, a balance and cash flow statement.
Allocation of costs of production. When the typical milk production systems have several agricultural activities besides dairy, fixed costs and expenses (i.e. depreciation) are distributed to each activity according to their use. For example, the depreciation of the machinery, which is used, for the dairy and the crop enterprises is allocated according to the hours worked in each.
Data about farm and off-farm household economics. IFCN takes into account all activities of the typical production systems, plus all the off-farm incomes and expenses realised by the owner and his family. This more complete picture of the typical model is necessary to obtain reliable information about the current economic situation of the model (and the household) and about the future of the farm (simulations).
All the methods and principles above have been applied in this project. Full panels were not set up since these models have already been part of the IFCN activities for the year 2002. The IFCN fieldwork experience supports that the analysis of costs of production shows no significant difference between the participation of one advisor and a ‘full panel’. Therefore, it was decided that an IFCN scientist first visit each and every model, talk with the owners to collect project-specific information, analyse the data and then have the results cross-checked by local experts and farmers.
The analysis of costs of production and the competitiveness of the typical models are found in part 3.4 to 3.6. The graphs follow the same structure as those in the ‘IFCN Annual Dairy Report’. The main objectives of this report are a) to analyse the main typical milk production systems in the state of Andhra Pradesh, India and b) to evaluate the farm level impacts of dairy development programs and ideas in Andhra Pradesh. This report shows the comparative national position of the Andhra Pradesh dairy industry and its potential and a comparison of the costs of production for the main milk production systems in Andhra Pradesh.
For more information about IFCN, visit http://www.ifcnnetwork.org and http://www.ifcndairy.org

63
A2 IFCN METHOD: COSTS OF PRODUCTION CALCULATIONS
Cost Calculation
The cost calculations are based on dairy enterprises that consist of the following elements: Milk production, raising of replacement heifers and forage production and/ or feed purchased for dairy cows and replacements.
The analysis results in a comparison of returns and total costs per kilogram of milk. Total costs consist of expenses from the profit and loss account (cash costs, depreciation, etc.), and opportunity costs for farm-owned factors of production (family labour, own land, own capital). The estimation of these opportunity costs must be considered carefully because the potential income of farm owned factors of production in alternative uses is difficult to determine. In the short run, the use of own production factors on a family farm can provide flexibility in the case of low returns when the family can chose to forgo income. However, in the long run opportunity costs must be considered because the potential successors of the farmer will, in most cases, make a decision on the alternative use of own production factors, in particular their own labour input, before taking over the farm. To indicate the effects of opportunity costs we have them separated from the other costs in most of the figures.
For the estimations and calculations the following assumptions were made:
Labour costs
For hired labour, cash labour costs currently incurred were used. For unpaid family labour, the average wage rate per hour for a qualified full-time worker in the respective region was used.
Land costs
For rented land, rents currently paid by the farmers were used. Regional rent prices provided by the farmers were used for owned land. In those countries with limited rental markets (like NZ), the land market value was capitalised at 4 per cent annual interest to obtain a theoretical rent price.
Capital costs
Own capital is defined as assets, without land and quota, plus circulating capital. For borrowed funds, a real interest rate of 6 per cent was used in all countries; for owner’s capital, the real interest rate was assumed to be 3 per cent.
Quota costs
Rent values were used for rented or leased quota. Purchased quota values were taken as being the annual depreciation of values from the profit and loss accounts.
Depreciation
Machinery and buildings were depreciated using a straight-line schedule on purchase prices with a residual value of zero.
Adjustments of fat content
All cost components and forage requirements are established to produce ECM (Energy Corrected Milk with 4 percent fat and 3.5 percent protein).

A2 IFCN Method: Costs of Production Calculations
64
Adjustment of VAT
All cost components and returns are stated without value added tax (VAT).
Adjustment of milk ECM 4 percent
The milk output per farm is adjusted to 4 percent fat and 3.5 percent protein ECM. Formula: ECM milk = Milk production / ((0.383* fat in percent +0.242 * protein in percent + 0.7832)/3.1138)

A2 IFCN Method: Costs of Production Calculations
65
Farm Economic Indicators (IFCN Method)
+ Total receipts =
+ Crop (wheat, barley, etc.)
+ Dairy (milk, cull cows, calves, etc.)
+ Government payments
- Total expenses =
+ Variable costs crop
+ Variable costs dairy
+ Fixed cash cost
+ Paid wages
+ Paid land rent
+ Paid interest on liabilities
= Net cash farm income
+ Non cash adjustments =
- Depreciation
+/- Change in inventory
+/- Capital gains / losses
= Farm income (Family farm income in Dairy Report 2001)
- Opportunity costs =
+ calc. interest on own capital
+ calc. rent on land
+ calc. cost for own labour
= Entrepreneurs profit

66
A3 DESCRIPTION OF IFCN RESULT VARIABLES
Cost of Milk Production (only)
Method The total costs of the dairy enterprise are related to the total returns of the dairy enterprise including milk and non-milk returns (cattle returns and direct payments). Therefore the non-milk returns have been subtracted from the total costs to show a cost bar that can be compared with the milk price. The figure beside explains the method.
Other costs: Costs from the P&L account minus non-milk returns (cattle returns and direct payments, excl. VAT).
Opportunity costs: Costs for using own production factors inside the enterprise (land * regional land rents, family working hours * wage for qualified workers, capital: Own capital * 3 per cent).
Returns of the dairy enterprise Milk price: Average milk prices adjusted to fat corrected milk (4 percent excl. VAT).
Cattle returns: Returns from selling cull cows, male calves and surplus heifers + /- livestock inventory (excl. VAT).
Other Returns: Selling/home use of manure
Costs by costs items Costs for means of production: All cash costs like fuel, fertiliser, concentrate, insurance, maintenance plus non-cash costs like depreciation for machinery and buildings (excl. VAT).
Labour costs: Costs for hired labour + opportunity costs for family labour.
Land costs: Land rents paid + calculated land rents for owned land.
Capital costs: Non-land assets * interest rate (equity * 3 percent, liabilities * 6 percent).
Quota costs: Payments for rented quota and depreciation for quota bought.
Returns of the dairy enterprise Costs of the
dairy enterprise
Other costs- Non-milk
returns
Costs of milk production only
Returns& CostsUS $ /100 kg
milk
Opportunity costs
Returns = Milkprice
Non-milk returns
Other costs
Opportunity costs
Entrepreneurs profit Family
farm income

A3 Description of IFCN Result Variables
67
Cash and non-cash costs Cash Costs: Cash costs for purchase feed, fertiliser, seeds, fuel, maintenance, land rents, interest on liabilities, wages paid, vet + medicine, water, insurance, accounting, etc (excl. VAT).
Depreciation: Depreciation of purchase prices for buildings, machinery and quotas (excl. VAT).
Opportunity costs: Costs for using own production factors (land owned, family labour input, equity).
Economic results of the dairy enterprise Farm income per farm: Returns minus costs from P&L account of the dairy enterprise.
Farm income per kg milk: Farm income per farm (dairy enterprise) / milk production
Profit margin: Share of farm income on the total returns: Farm income divided by the total returns.
Entrepreneurs profit: Returns minus costs from P&L account of the dairy enterprise – opportunity cost allocated to the dairy enterprise.
Net cash farm income: Cash receipts minus cash costs of the dairy enterprise or: Farm income + depreciation
Return to labour: Entrepreneurs profit plus labour costs (wages paid plus opportunity costs) divided by total labour input.
Average wages on the farm: This figure represents the gross salary + social fees (insurance, taxes, etc.) the employer has to cover. Calculation: Total labour costs (wages paid plus opportunity costs) divided by the total hours worked. To calculate this, the number of hours worked by the employees and the family has been estimated by experts.
Labour input: The estimation of hours worked and the valuation of these hours is extremely difficult especially in family farms. In the IFCN network this method will be intensively discussed and improved during the next workshops.
Labour costs: Paid wages and opportunity costs for own labour of the dairy enterprise.
Land costs: Paid land rents and opportunity costs for own land (calculated rent) of the dairy enterprise.
Stocking rate: Number of cows / ha land.
Capital costs: Paid interests and opportunity costs for own capital (excluding land capital and quota capital). For equity 3 per cent and for liabilities 6 per cent interest rate is used in all countries. This reflects the method of “capital using costs” developed by Isermeyer 1989.
Capital input: Total Assets (land, buildings, machinery, cattle)/ number cows

68
A4 MILK PRODUCTION IN ANDHRA PRADESH
Estimated milk production and milk density by district in Andhra Pradesh, India
Source: Various issues of Integrated Sample Survey, Government of Andhra Pradesh, India

69
A5 DAIRY PRODUCTION SYSTEMS IN ANDHRA PRADESH

70
A 6 MAJOR STAKEHOLDERS AND SUPPLY CHAIN IN THE ANDHRA
Andhra AP Dairy Industry
Production Sector Processing Sector Marketing Sector
Milk Producers
1. Smallholders
2. Large Producers
3. Peri-urban Dairy Farms
4. Commercial Dairy Farms
5. Institutional Dairy Farms
Milk Processors
1. Co-operative Sector
2. Private Sector
3. State Government
4. Non-government Organizations and Associations
5. Bilateral agencies
6. Informal Sector (sweet meat makers/Halwaiis)
Marketing Channels
1. Private Companies
2. State Co-operatives
3. Milk Marketing Federations
4. Wholesalers and Retailers
5. Non government Organizations and Associations
6. Informal Sectors (Dudhias, Contractors, Milk Producers)
Health Services
Breeding Services
Financial services
Feed Services
Livestock services
Milk Marketing Services
Consultancy services
Government Hospitals Livestock Aid centres Polyclinics Dispensaries Rural Livestock Units
Artificial Insemination centres Frozen Semen Depots Frozen Semen Bull Stations Mother Bull Farms
Nationalized banks District banks Cooperative banks Private banks Self help groups Rural banks
Feed plants Fodder markets Distributors Retailers Co-operatives Fodder Farms
Slaughter houses Livestock markets
Milk procurement Milk processing Milk and products marketing
Bilateral agencies NGOs Contractors Engineers Consultants Quality control agencies Inspection officers
Source: Authors’ own illustration
Andhra Pradesh Dairy Development Cooperat ive Federat ion (APDDCF) Directorate of Veterinary and Health Services of the State Government of Andhra Pradesh
Distr ic t Cooperat ive Mi lk Unions Mutual ly Aided Cooperat ive Societ ies
Indo Swiss Project Andhra Pradesh ( ISPA) National Dairy Development Board (NDDB) Bharat Agro industries Foundation (BAIF)

71
A7 RISK VARIABLES AND ASSUMPTIONS
Selection of Stochastic Variables
Units Mean* Minimum** Maximum**
1 Milk Price Rs / Kg 10 8 12
2 Milk yield per cow Kg/cow/year 540 432 648
3 Livestock prices(live weight) Rs / Kg 13 10 15
4 Mortality rate % 5% 3% 20%
5 Purchased feed price(basis cotton seed cake)
Rs / ton 6667 5333 8000
6 Crop yield index index 108 86 130
7 Crop price index index 108 86 130
8 Culling rate % 10% 8% 12%
9 Wage rate of hired labour per hour c/hour 5 4 6
10 Family living expenses c/year 26,400 21,120 31,680
11 Own milk consumption t/year 0.22 0.17 0.26
*The mean values are collected from the typical farm based on the panel discussion around MN-3 farm in state of
Andra Pradesh. ** The minimum and maximum values are estimated through different sources found in the region ;
• Statistical data if available • Farmer’s experience in the area • Expert assessment
Standardized Man Equivalent
Standardized Man Equivalent
Adult Man (> 18) 1.00
Adult women (> 18 ) 0.92
Old age parents (> 65) 0.80
Children (14-18 year) 0.85
Children (under 14 year) 0.25
Other family labour type 0.25
*Concept reference: Bradshaw J and Millar J (1991) Lone Parent Families in the UK, Department of social security research report No 6, KoMSO (P.19)

72
REFERENCES
1 GoAP (2002-03) Integrated sample survey estimates on production of milk, egg and meat for the year 2002-03, Government of Andhra Pradesh, Animal resources development department, Statistics branch, directorate of animal husbandry and veterinary services, Andhra Pradesh, Hyderabad.
2 Government of Andhra Pradesh (2004) Annual Report 2004, Department of Forestry, Govt. of Andhra Pradesh, Hyderabad, India.
3 GoAP (2004) Statistical Abstract, Andhra Pradesh 2004, Directorate of Economics and Statistics, Government of Andhra Pradesh, Hyderabad
4 GoAP (2004a) Economic Survey 2003-2004, Directorate of Economics and Statistics, Planning and Coordination Department; Hyderabad, Government of Andhra Pradesh.
5 GoAP (2004b) State’s economy in figures Andhra Pradesh 2003, Directorate of Economics and Statistics, Planning and Coordination Department; Andhra Pradesh, Government of Andhra Pradesh.
6 GoAP (2004d) An Outline of Agricultural Situation in Andhra Pradesh 2003-2004, Directorate of Economics and Statistics, Government of Andhra Pradesh, Hyderabad
7 GoAP (2004c) Annual Administrative Report 2003-04, Unpublished report of Govt. of Andhra Pradesh, AH Dept., AP; India.
8 Government of India (2004) Basic Animal Husbandry Statistics, AHS Series, Department of Animal Husbandry and Dairying, Ministry of Agriculture, Krishi Bhawan, New Delhi.
9 Hemme, T. , Garcia, O. , Saha, A. (2003) A review of milk production in Haryana – India with special emphasis on small milk producers, PPLPI working paper No. 2, FAO; Rome
10 Hemme, T. et al. (2004) IFCN dairy report 2004, IFCN Centre, Braunschweig, Germany
11 IFCN Databases
12 ISPA (1994) The Bovine Sector of Andhra Pradesh, Bovine and Dairy Development in Andhra Pradesh, 5-23.
13 NDDB (2005) National statistics, per capita availability of milk by states, 1991-2004, www.nddb.org, Information and Development Research Group, NDDB, Anand, Gujarat, India
14 NSS (2000-01) NSS 56th round (July 2000-june 2001) report on household consumer expenditure and employment situation in India for 2000-01, Government of India, New Delhi.

References
73
15 Personal Communications (2005) Interviews with farmers, veterinarians, local milkmen, and dairy cooperative managers of dairy plants and chilling plants, April to July 2005.
16 Saha, A., Garcia, O., Hemme, T. (2004) A review of milk production in Orissa– India with special emphasis on small milk producers, PPLPI working paper No. 16, FAO; Rome
17 Saha (2005) Unpublished sample survey estimates of typical farms in India carried out in November 2004 – July 2005.