dairy sub-sector analysis - value chains · dairy sub-sector map ... draft report on revitalizing...
TRANSCRIPT
The Kenyan Dairy Sub-Sector
A Study for DfID Kenya
Ebony Consulting International September 2001
Draft Report
For DfID Kenya
Ebony Consulting International
1. Introduction..................................................................................................................... 1 2. Overview of the Dairy Sub-Sector.................................................................................. 1 3. Supply of Milk and Milk Products.................................................................................. 3 4. Demand for Milk Products.............................................................................................. 6 5. Key Participants in the Dairy Sub-sector........................................................................ 8
5.1 Smallholder Farmers................................................................................................. 8 5.2 Medium and Large-Scale farmers............................................................................. 9 5.3 Traders .................................................................................................................... 10 5.4 Co-operatives/Self-Help Groups............................................................................. 10 5.5 Processors ............................................................................................................... 12 5.6 Retailers .................................................................................................................. 14
6. Input Suppliers .............................................................................................................. 15 6.1 Artificial Insemination (AI) .................................................................................... 15 6.2 Feeds ....................................................................................................................... 15 6.3 Veterinary Services................................................................................................. 16 6.4 Heifers..................................................................................................................... 17 6.5 Extension Services .................................................................................................. 17 6.6 Testing Services ...................................................................................................... 18 6.7 Animal Health Products.......................................................................................... 18 6.8 Kenya Dairy Board ................................................................................................. 19 6.9 Dairy Industry Stakeholders Association of Kenya (DISAK)................................ 19
7. Dairy Sub-sector Map................................................................................................... 19 7.1 Channel One - Raw milk direct from Farmer to Rural Consumer.......................... 21 7.2 Channel Two - Raw milk via intermediaries to urban consumers.......................... 21 7.3 Pasteurised packaged milk to urban consumers...................................................... 23 7.4 Channel four – Milk Products to Urban Consumers............................................... 24
8. Dairy Sub-sector Dynamics .......................................................................................... 25 9. Scope for Interventions ................................................................................................. 26
9.1 Major Constraints.................................................................................................... 26 9.2 Nodes for potential intervention ............................................................................. 27 9.3 Geographical concentrations................................................................................... 27 9.3 Opportunities for interventions ............................................................................... 27
9.3.1 Legitimising the informal sector (High) .......................................................... 28 9.3.2 Improving milk safety through all channels (Medium) ................................... 28 9.3.3 Improving the quality of inputs to smallholder producers (Medium).............. 28 9.3.4 Facilitating availability of critical inputs (Medium)........................................ 28 9.3.5 Increasing the overall supply of milk from smallholders (High)..................... 29 9.3.6 Improving productivity and reducing smallholder costs (High)...................... 29 9.3.7 Improving real prices paid to smallholder farmers (Medium)......................... 29 9.3.8 Improving returns to informal and small-scale sellers/processors (Medium) . 29 9.3.9 Strengthening accountability and capability of Industry Bodies (Medium, contingent on more inclusive attitude)...................................................................... 30
References......................................................................................................................... 31
Dairy Sub-sector Study, DfID Kenya, DRAFT i

Ebony Consulting International
List of Tables Table 1 Estimated Milk Production and Dairy Herd .......................................................... 4 Table 2 Projected Supply of Milk to 2010.......................................................................... 4 Table 3 Demand Projections for Milk ................................................................................ 7 Table 4 Number of Dairy Co-operatives, membership and sales ..................................... 11
List of Figures Figure 1. Dairy Sub-sector Map........................................................................................ 20
Dairy Sub-sector Study, DfID Kenya, DRAFT ii

Ebony Consulting International
1. Introduction For the purpose of this Sub-sector Study, the analysis is limited to bovine milk and milk products (hereafter referred to as the ‘Dairy Sub-sector’), therefore excluding milk from goats, sheep and camels. The Dairy Sub-sector was initially selected because of its current scale, its future growth potential, the significant involvement of smallholder farmers/micro-enterprises and its potential for interventions that might have an impact on poverty. Further detail is provided in the report on phase one of this consultancy. This more detailed look at the Sub-sector draws on the considerable amount of secondary data that is available, of which the main publications are listed in annex 1. Use of Key Informants has been a key part of understanding the situation and dynamics in the sub-sector. These include representatives from Government, NGOs, Research Organisations/Institutes and the Private Sector including large and small businesses/producers. Given the relatively short time available to undertake this sub-sector analysis, the role of field visits was restricted to providing insight and developing the consultant’s understanding of the dynamics in the sub-sector, rather than as a source of primary data. The particular emphasis in this sub-sector analysis was to identify opportunities for encouraging the offering, and further development, of sustainable Business Services as well as considering other areas for intervention. Therefore the presence, absence and potential for Business Services have been the particular focus in the interviews and analysis.
2. Overview of the Dairy Sub-Sector The Dairy Sub-sector is the second largest contributor to agricultural GDP after beef, with an estimated 14% of the total agricultural production in 1995.1 The Dairy industry in Kenya is still one of the largest in Africa second only to South Africa and is of particular significance because it is dominated at the producer end by smallholder farmers and in the marketing channels by informal sector traders and hawkers. The accelerating collapse of Kenya Co-operative Creameries (KCC) from the early 1990s and the liberalisation of the market (milk marketing in urban areas) in 1992 were catalytic events that changed the nature of milk marketing and processing. This has been accompanied by a more general breakdown in services previously provided on a highly subsidised basis by Government.2 Overall, there is no consensus on the actual outcomes and effects of these events and it is important to note that these changes are still working their way through all channels and levels of the sub-sector, something that will become apparent in the analysis that follows. This may partly explain the divergent views on what is actually happening in the sub-sector. The different interests of different key players in and around the industry also influence perspectives.
1 Tegemeo, Draft Report on revitalizing the Dairy Industry. 2 These changes are documented historically in Omore 1999
Dairy Sub-sector Study, DfID Kenya, DRAFT 1
Ebony Consulting International
The main divergence is between those who want a return to a predominantly cold-chain, pasteurised milk system as in the pre-1990 days and those who seek to improve the current ‘warm-chain’ raw-milk system that accounts for 80% of all marketed milk. The questions surrounding the two main approaches have particular implications for:
1. geographically and economically marginal producers, 2. the large processors of pasteurised milk, 3. informal marketing agents (‘pick-up traders’, unlicensed milk retailers and mobile
hawkers) and co-operatives, 4. the relative rewards for (smallholder) producers, (mainly large) processors and (informal)
distributors, 5. long-term prospects for the development of the industry and potential for exports 6. the price and availability of ‘quality’ milk to consumers (particularly the urban poor)
Those who favour a cold-chain industry with pasteurised milk, characterise the current situation as: chaotic distribution; with stagnant production and demand; poor returns to producers; low productivity by inefficient smallholder producers; wasted milk that cannot get to market; a breakdown of essential services to producers; and raw milk that carries considerable health risks for consumers through poor handling and adulteration. Those who support improvements to the informal warm-chain system can be broadly characterised as seeing: growing smallholder production (and overall increased national production); increasing demand from growing urban populations (partly offset by declining incomes); efficient, quick and relatively low cost system of getting milk from producer to consumer; improving returns to smallholder producers with potential to improve yields considerably; improving provision of essential services by the private sector; problems with both raw and pasteurised milk quality though poor practices on and off farm, but no widespread and serious risk to consumer health. It is clear that the transition from a highly controlled production and marketing chain supported by extensive government services to a market driven system with thousands of small players is not complete. The situation is still very dynamic, probably accounting for some of the apparent contradictions, for example over the effectiveness of the private sector in filling gaps. There are gaps in support services to producers, there are producers who cannot get milk to the market and there are consumers who cannot get milk or milk products when and where they want them.3 However, the situation appears to have improved considerably over the last three to four years, with formal and informal private sector providers filling many of the gaps. Anecdotally, what is very striking about the functioning of the ‘informal’ market (at least in Nairobi) is how efficiently it is operating. Services to producers that were formerly the responsibility of government, are now being provided by the private sector in what appears to be a competitive manner, at least in the high concentration areas of milk production. Government services to large and small producers had in many cases ceased to function in practice or were very erratic at the time of liberalisation in 1992. Whilst large producers may have been able to find ways around this, smallholders would have been 3 These ‘gaps’ also occurred when production and marketing were highly controlled.
Dairy Sub-sector Study, DfID Kenya, DRAFT 2
Ebony Consulting International
considerably disadvantaged, through lack of individual purchasing power. However, the scale of the smallholder market seems to have brought forward private sector supply in many dairy-producing areas, in a sustainable way. There are gaps in more marginal production areas4 or for more economically viable services (extension support) but these could provide the very opportunities where donor interventions are justified to stimulate a market response. Given the nature of raw/pasteurised milk, imports and exports of ‘fresh’ liquid milk are likely to be minimal. However, there are opportunities for imports and exports of milk products, particularly powders and butterfat products as imports and processed milk products as exports. Kenya has gone from being a net exporter to being a net importer, but the figures indicate that imports still only account for less than one percent of milk production.5 Given the vibrancy of private sector provision of support services and products, there are also emerging opportunities for the export of feed pre-mixes, minerals and other products. The potential for Dairy to impact on poverty is significant. In the Nairobi Milk Shed, 60% of Dairy Smallholders employ at least one person either long term or casually. In Kiambu district, 77% of households keep dairy cows for which it is the main source of income for 40% of these (i.e. 30% of all households).6 Dairy is a major component of many rural households at least in the High and Medium Potential Lands (HMPL). The sections below analyse the overall market in terms of supply and demand, , the nature of each of the main category of players, the main sub-sector channels, sub-sector constraints and the identified areas for potential intervention.
3. Supply of Milk and Milk Products There is no up to date census data on the number of Dairy cattle, average milk yields or total production. The last census was conducted in 1969 though credible estimates in 19967 and showed an estimated output of 2,500 million litres from 3.2m dairy cattle.8 Historical data in this trend analysis shows milk production rising steadily (from 1,300 million litres in 1981 to 2,520 million litres in 1991) until liberalisation then stagnating and declining to 2,224 million litres in 2000. An alternative estimate based on the same census and more recent small scale studies of several of the milk producing areas indicates a higher output figure of 3,000 million litres (for 1998) from 3.05 million dairy cattle of which 2.5 million (83%) are in smallholder farms (Omore 1999).
4 As addressed by Animal Health Projects, such as FARM Africa’s work around Meru to establish private AH practitioners with access to medicines/vaccines etc. 5 Karin (2001) 6 Staal et al (2001) 7 Ministry of Agriculture with FAO support. 8 Improved exotic breeds or crosses, excluding ‘local’ Zebu suited to arid areas which has lower milk yields and where much of the milk is for self-consumption or is not otherwise marketed.
Dairy Sub-sector Study, DfID Kenya, DRAFT 3

Ebony Consulting International
Table 1 Estimated Milk Production and Dairy Herd
1981 1991 1992 1993 1994 1995 1996 1997 1998 1999 2000 Milk Prod’n M.litres
1,300 2,530 2,365 2,360 2,368 2,448 2,396 2,415 2,362 2,342 2,224
Dairy Cows (million)
3.1 3.1 3.1 3.0 3.1 3.2 3.2 3,2 3.2 3.1 3.0*
Source: MoARD (2001) * Provisional These Ministry figures are based on estimates of the dairy cattle population and calculating milk production by taking standard lactation cycles, proportion of cows lactating and a standard (census based) yield. If any of the estimates is incorrect, then the calculated milk production will be incorrect. Those arguing that the supply is growing find evidence of positive herd growth for all cattle production systems (extensive and intensive, small and large scale)9. They also found higher production per cow of 1,750 kg/cow/year for smallholders and 4,000 kg/cow/year for large-scale systems versus the MoARD’s estimates of 1,300kg/cow/year.10 The data suggests that there are considerable differences in management practices of dairy cattle, (such as the length of time the cattle are dried off) and also the need for more reliable and recent census data. The supply of milk is related to farm gate prices, productivity of the cows, the size of the herd and access to support services (Omore 1999). Future projections of supply depend on assumptions about these key variables. Projections modelled on current trends suggest that supply will grow as follows:
Table 2 Projected Supply of Milk to 2010
Millions Litres 1998 2005 2010 Current trend 3,156 4,267 5,059 3% productivity improvement
3,156 5,399 7,354
Source Omore et al (1999) Taking these figures along with the demand data (see below) suggest that demand will (continue to) outstrip supply. However, with an annual improvement of 3% per annum in productivity, then Kenya could dramatically increase supply and become a net exporter of dairy produce. Whilst there are different views about the baseline level of supply, there is a consensus that improved productivity is both necessary and possible. There are further changes taking place in the balance of supply from different areas. Prices paid to farmers are no longer at a standard rate (as in the past with KCC) but reflect what the market will
9 Omore et al (1999) 10 Peeler and Omore (1997)
Dairy Sub-sector Study, DfID Kenya, DRAFT 4
Ebony Consulting International
pay. This has meant higher prices in real terms (plus 50% 1990-95) for those farmers nearest to major markets like Nairobi,11 reflecting the ability to reach the market without requiring a cold-chain and also reduced transport costs for less distance travelled.12 For example, the best prices paid in Karen, were Ksh.24/litre ex-farm and Ksh.24/litre in Kiambu, whereas prices in areas such as Muranga were closer to Ksh.22/litre. When prices were uniform and KCC operated as a guaranteed buyer of any milk offered as well as operating cooling centres, this encouraged production in areas with low production costs13 but limited access to potential markets. However, it also acted to limit production in areas close to markets but with more expensive intensive ‘zero-grazing’ systems, like Kiambu. Whilst Kiambu remains a high cost production area (Tegemeo 1999), its ready access to the Nairobi market supports the anecdotal evidence that smallholder production is increasing in this area, whilst the breakdown of the network of cooling plants and collection by KCC is reducing supply from lower cost production areas far from the market. The response to these market driven changes is either to (re-)introduce cooling plants and associated infrastructure, as a number of organisations were advocating or to let the market changes work their way through, ultimately leading to a redistribution of supply to those areas nearer to the demand. Heifer Project International and Technoserve were looking at supporting the development of cooling plants in areas away from markets, whilst two of the largest private processors, Brookside and Spinknit had already installed their own cooling plants (Eldoret) to take advantage of low cost production in this milk surplus areas. Therefore distance from the market may not be a problem if the cost of production is low enough, there is sufficient volume to gain economies of scale in collection and there are parties willing to invest in a cold-chain. Whilst there is some debate about whether the overall supply of milk has increased or stagnated, it is accepted that there has been a major shift from consumption of pasteurised milk to raw milk since KCC lost its sales monopoly in urban areas. Raw milk was always available and traded in rural areas where dairy farmers supplied their neighbours, but liberalisation in 1992 speeded up the trend from packaged pasteurised milk to ‘loose’ raw milk in urban areas. Raw milk, sold in poly bags or customer’s own containers, now accounts for 80% of the liquid milk consumed in Nairobi, up from an estimated 45% in 1992.14 The significance of this is that Nairobi accounts for more than 50% of all marketed milk in Kenya. There is a major question about how much milk is lost due to poor infrastructure, both roads and cooling collection facilities. Estimates are that up to 30% of production in Nyandarua and Kericho lost through poor infrastructure, with an annual total of 200 million Litres valued at Ksh.3.7 billion, failed to reach the market annually due to transport and pre-cooling problems (ASIP). Since 1992, 45 new Processors have been licensed by the Kenya Dairy Board post liberalisation, however the decline in the Processors’ share of the urban milk markets is attributable mainly to the
11 Owango et al (1998) 12 See Staal et al (2001) 13 Eextensive grazing areas, such as the Northern Rift 14 Industry sources
Dairy Sub-sector Study, DfID Kenya, DRAFT 5

Ebony Consulting International
continued demise of KCC. Despite KCCs installed capacity of 1.2 million litres/day, KDB data suggests that its milk intake was as low as 20,000 litres/day in 1999, rising to 35,000 in 2001. Of the 45 new processors, only 33 were operating in 1999 processing a total of 573,500 litres/day, of which only 12 were processing more than 5,000 litres/day. A further four medium sized processors have since ceased production in 2000. Further consolidation and the exit of weaker producers seems likely with two to four large producers emerging to dominate the processed milk supply over the next few years. In 1995, Kenya (effectively KCC) produced 2,480 tonnes of dried Whole Milk Powder and 3,101 of Skimmed Milk Powder, but has since ceased production. Butter and Ghee production was 3,985 tonnes in 1995 down to 268 tonnes in 1999 (includes all producers) and 113 tonnes in 2000. Cheese production was at 365 tonnes in 1995 falling to 315 tonnes in 2000. Exports of these products in 1997 totalled 1,513 tonnes valued at Ksh.256 million15. Since 1999 Kenya has become a net importer of dairy products (mainly powdered baby milk which cannot be produced in Kenya at present), though this is more due to declining exports than the smaller increase in imports.
4. Demand for Milk Products Several factors are critical in determining the level and trend in demand for milk and milk products. The population of Kenya was increasing in 1999 at an estimated rate of 2.4% p.a. reaching 28.7 million at the 1999 census, with almost 10 million living in urban centres and over 2.1 million living in Nairobi alone16. However whilst Gross Domestic Product has grown from 1995-99, GDP per capita at constant prices has begun to decline since 1997. With a slowing economy and continued growth in the population this is likely to have accelerated the rate of decline in 2000 and 2001. Marginal propensity to consume was calculated at between 4.3% for deciles one to four and 8.2% for deciles four to seven17 indicating that consumption would be significantly affected by changes in incomes. Therefore, over the last four years, increases in population (and absolute demand for milk) may have been partly or wholly offset by a reducing propensity to consume as incomes have been static or declining in real terms. However, there is likely to have been an additional effect of lower real incomes in that consumers trade down, from more highly priced packaged pasteurised milk to cheaper informally ‘hawked’ raw milk. With a price differential between raw and packaged pasteurised milk in Nairobi of Ksh.18-20/litre (36-40% saving), trading down on a ‘necessity’ would seem to be a more likely response to economic difficulties than reducing consumption. Now that KCC intakes have reached such a low level that there is little scope for a further reduction, the overall amount of milk processed may increase by 2-3% per year (reflecting growing demand overall for milk), at least according to one of the major processors. However, the same processor believes that this would not be sufficient to regain market share for processed milk 15 Peak year for exports in 1990s 16 Statistical Abstract 2000 17 See Report on Phase One.
Dairy Sub-sector Study, DfID Kenya, DRAFT 6
Ebony Consulting International
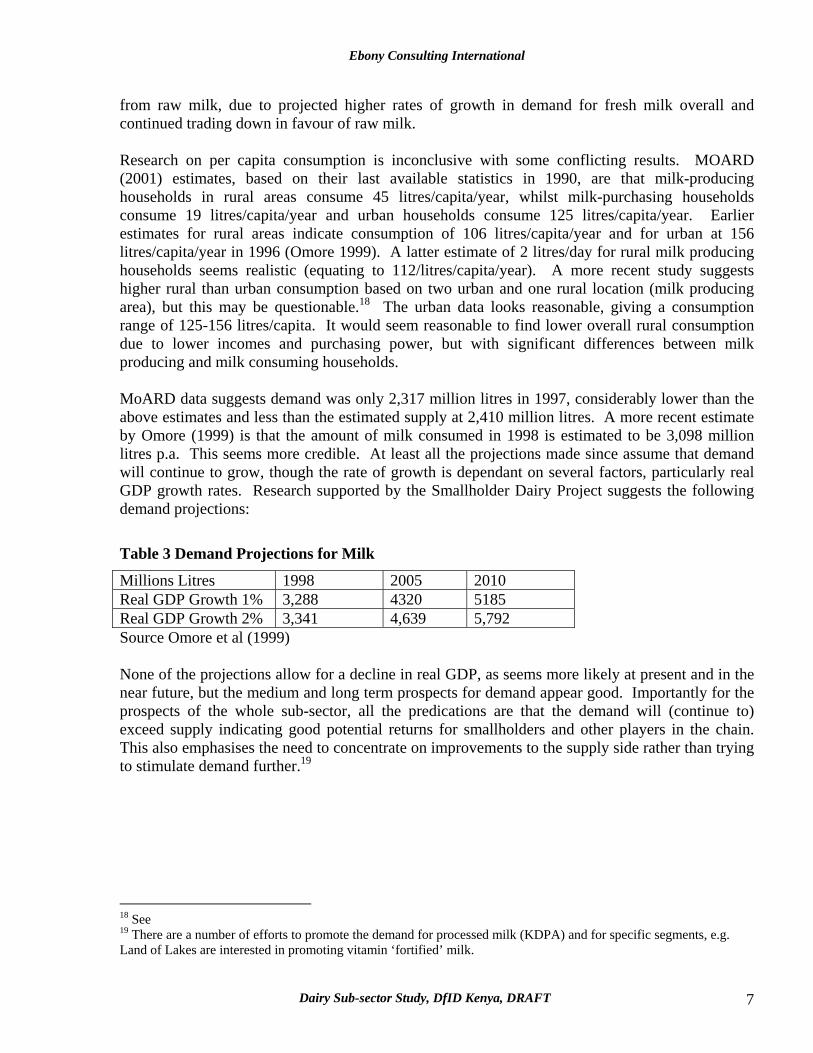
from raw milk, due to projected higher rates of growth in demand for fresh milk overall and continued trading down in favour of raw milk. Research on per capita consumption is inconclusive with some conflicting results. MOARD (2001) estimates, based on their last available statistics in 1990, are that milk-producing households in rural areas consume 45 litres/capita/year, whilst milk-purchasing households consume 19 litres/capita/year and urban households consume 125 litres/capita/year. Earlier estimates for rural areas indicate consumption of 106 litres/capita/year and for urban at 156 litres/capita/year in 1996 (Omore 1999). A latter estimate of 2 litres/day for rural milk producing households seems realistic (equating to 112/litres/capita/year). A more recent study suggests higher rural than urban consumption based on two urban and one rural location (milk producing area), but this may be questionable.18 The urban data looks reasonable, giving a consumption range of 125-156 litres/capita. It would seem reasonable to find lower overall rural consumption due to lower incomes and purchasing power, but with significant differences between milk producing and milk consuming households. MoARD data suggests demand was only 2,317 million litres in 1997, considerably lower than the above estimates and less than the estimated supply at 2,410 million litres. A more recent estimate by Omore (1999) is that the amount of milk consumed in 1998 is estimated to be 3,098 million litres p.a. This seems more credible. At least all the projections made since assume that demand will continue to grow, though the rate of growth is dependant on several factors, particularly real GDP growth rates. Research supported by the Smallholder Dairy Project suggests the following demand projections:
Table 3 Demand Projections for Milk
Millions Litres 1998 2005 2010 Real GDP Growth 1% 3,288 4320 5185 Real GDP Growth 2% 3,341 4,639 5,792 Source Omore et al (1999) None of the projections allow for a decline in real GDP, as seems more likely at present and in the near future, but the medium and long term prospects for demand appear good. Importantly for the prospects of the whole sub-sector, all the predications are that the demand will (continue to) exceed supply indicating good potential returns for smallholders and other players in the chain. This also emphasises the need to concentrate on improvements to the supply side rather than trying to stimulate demand further.19
18 See 19 There are a number of efforts to promote the demand for processed milk (KDPA) and for specific segments, e.g. Land of Lakes are interested in promoting vitamin ‘fortified’ milk.
Dairy Sub-sector Study, DfID Kenya, DRAFT 7

Ebony Consulting International
5. Key Participants in the Dairy Sub-sector
5.1 Smallholder Farmers According to MoARD (2001), Smallholder farmers account for 80% of milk production. There has been no national census on the number of smallholder dairy farmers since 1969, but data from 1996 indicated 625,000 households with one or more dairy cattle.20 However, it is important that smallholders are not seen as one homogenous group. They vary in their motivations for keeping dairy cow(s) from providing milk for the family, a supplementary source of income alongside other cash/subsistence crops or the main source of income (40% of those with dairy cows in Kiambu21) for the household. Other reasons for owning dairy cows include status, a store of wealth and a valuable source of manure for the shamba or sale.22 A minority of smallholders do not treat milk production as a priority or as a commercial activity and may behave completely differently from others who regard it as a ‘business’. The cost of producing milk varies according to the system (intensive zero-grazing requires more expenditure), the location (access to necessary inputs) and yields achieved. A critical calculation is how the cost of family labour and land is treated, whether imputed at market rates or not given that there may be a limited opportunity cost. Work by Tegemeo (1999) suggests that producers in high cost zero grazing areas (like Kiambu) may be ‘unprofitable’, but this may involve an over-estimation of the actual costs (use of own fodder and plant waste), an under-estimation of the prices achieved, ignoring the value of bi-products such as sale/use of manure and too simplistic a view of the motivation for keeping dairy cows. Producers further from the market may be able to produce at low cost due to extensive systems, but without cooling facilities they may not be able to access a market. Number of dairy cows, genetic types, mix with other agricultural crops, size of land holdings (1 ha in intensively and 2.5 in extensively farmed areas)23, intensity of production (zero-grazing versus extensive grazing), management practices (e.g. use of Artificial Insemination), marketing outlets and other factors all vary to create a diverse group under the broad heading of Smallholder Farmer. In addition to the relative poverty of many smallholder dairy households, several studies show that a high proportion of dairy smallholders employ agricultural workers (60%). The reasons for this may be complex24, but the likely impact of growth in the sector is more jobs for the landless/unemployed rural poor. Where the different smallholders sell their milk varies considerably according to opportunity, motivation and smallholder priorities. Self-consumption and feeding to calves is high at 36%25 of smallholders, reflecting both the motivation for having dairy cows and also lack of available markets. 20 Ministry of Agriculture sources. 21 See Staal et al (2001) 22 Ksh.1, 000-1,500 per pick-up. 23 Omore 1999 24 It may even represent that some of the owners of these smallholdings had other businesses or formal employment, based on anecdotal information from visit to Kiambu. 25 As a proportion of smallholder production, Omore et al 1999
Dairy Sub-sector Study, DfID Kenya, DRAFT 8
Ebony Consulting International
Many smallholders have benefited not just from an overall increase in real prices received compared to returns from KCC, but also the prospect of being paid for the milk is much higher. There are examples of farmers being cheated by traders who take credit and then disappear, but smallholders are learning from their mistakes to determine the risks of each route.26 Many take a diversified strategy of self-consumption, sale to neighbours, sale to local outlets, sale to traders, co-operatives and sometimes direct to processors. There is a need to balance the return per litre, the certainty of purchase,27 the immediacy of payment, the risk of non-payment and the need to maintain transactions record for access to services (e.g. credit via the Co-operative) and as an outlet for milk in the peak production period. Price received appears to be a function of: • Distance from markets (prices increase closer to Nairobi and other urban centres) • Whether the supplier is in a milk surplus or deficit area • Channel selected – to traders, co-operatives, local retailers or processors • Willingness to take on marketing functions (search out buyers, transport to buyers etc.) and
incur the cost of transport to get to the market • Amount and quality for sale (small amounts make it less worth pursuing active marketing
strategies and large amounts may be difficult to dispose of, requiring securing a guaranteed market such as a processor but at a lower price)
There are suggestions that significant amounts of milk are lost through poor roads, especially in the wet season. It is difficult to establish how much is actually lost, though the poor roads do add to the cost of transport through higher fuel consumption and higher vehicle maintenance, as well as an increased risk of spoilage through greater elapsed time in collection and more time wasted by farmers to get to collection points. The extent of the problem varies from area to area. It seems that evening milk is more commonly lost due to lack of cooling for next day collection. This affects those in more distant and marginal production areas without a local market. Recent data on yields is absent, with the most recent official estimates being 5 litres/day of those dairy cows lactating (1,300 litres/year), but with a wide range from 1 litre upwards. Other studies indicate higher figures, such as 7.2 in Kiambu28. However, all sources agree that there is considerable potential to improve yields, with potential to impact on the livelihoods of large numbers of relatively poor smallholders and their workers.29
5.2 Medium and Large-Scale farmers The economics of medium and large-scale dairy farming is different from small-scale farming. Many of the inputs such as labour and feeds have to be bought in, but this may be compensated for by higher yields. These can be as high as 30-35 litres/day with an average of 17-19 litres/day during lactation according to one medium-scale farmer, but at least double smallholder yields. 26 Co-operatives, KCC and other Processors also fail to pay on time or at all 27 Processors theoretically buy all year but also impose quotas and reject more milk in the peak season 28 Omore et al (1999) 29 Omore et al (1999)
Dairy Sub-sector Study, DfID Kenya, DRAFT 9

Ebony Consulting International
Given the scale of operation and the higher yields, there are large amounts of milk to be disposed of daily. The certainty of market is absolutely crucial to farmers at this scale, which is why the guaranteed purchase by KCC was a major factor encouraging larger scale production. With the disappearance of this guaranteed buyer and greater competition from smallholders, larger-scale farmers without guaranteed access to markets are likely to be more vulnerable. Those businesses that integrate farming with processing appear to be doing well, based on anecdotal evidence, supporting the importance of a guaranteed outlet for milk. Otherwise, they have to compete with smallholders and co-operatives that can supply bulk milk direct to processors at Ksh.16-19/litre.
5.3 Traders The number of traders is estimated to be 4,000 selling an average of 500 - 1,000 litres/day, according to the Kenya Dairy Board (KDB). However, many of the traders are not registered, making KDB figures unreliable and likely to be a gross under-estimation. Trading is function that brings milk from surplus to deficit areas, particularly urban centres and it is unclear how many of the traders also undertake other functions. It appears that many Co-operatives and Self-help Groups also operate as traders, typically taking a pick-up from smallholder farmer collection points and drive to poorer areas of cities or to a recognised marketing point for onward sale. There are many private sector traders using different means of transport from pick-ups and small trucks at the top end to those on bicycles at the lower end. Speed and volume are critical to the trader who may pay a premium to smallholders (and co-operatives) to secure supplies over other potential channels. By the time the milk gets to Nairobi, the cost (price plus transport) is likely to be Ksh.19-24/litre for wholesaling at Ksh.22-26/litre. Some will be sold retail at Ksh.30-32, but most appears to go to be wholesaled to Milk Bars, Dukas and Hawkers. There is anecdotal evidence of specific supply chains developing offering farmers, co-operatives, traders and retailers certainty of a market, certainty of supply and reassurance on quality. All stand to gain from this informally organised but reliable chain, though there is still the temptation to adulterate the milk to increase volume and mask poor quality for those who are spot purchasers and sellers. The market appears to have created its own mechanism to overcome uncertainty of supply and quality.
5.4 Co-operatives/Self-Help Groups Data from the Central Bureau of Statistics indicates that the number of Dairy Farmer Co-operatives is growing. Membership of Co-operatives and sales are increasing, but in real terms sales appear to have declined prior to 1998 and then stabilised thereafter.
Dairy Sub-sector Study, DfID Kenya, DRAFT 10

Ebony Consulting International
Table 4 Number of Dairy Co-operatives, membership and sales
1994 1995 1996 1997 1998 1999 2000 No of Dairy Co-ops
210 267 291 313 323 331 337
Membership (000s)
266 284 302 318 332 344 N/a
Turnover (Ksh. m)
1614 2,782 2,955 3,126 3,295 3,364 N/a
Sales value in real terms (Ksh. m)
N/a N/a 2782 2421 1501 1530 1529
Source Central Bureau of Statistics, Statistical Abstract 2000 Industry sources suggest high levels of mis-management in the past at many co-operatives. Co-operatives initially faced a boom in supply immediately after liberalisation, but have struggled in the late 1990s to adjust to increased competition from traders and processors, hence falling intakes. The latter have now stabilised as many co-operatives have also begun ‘trading’ raw milk into the large cities. Increasing numbers of registered co-operatives and increasing membership may reflect the growing importance of smallholder farmers rather than successful Co-operatives. There are many perceived advantages from belonging to a Co-operative, particularly access to immediate credit (up to the value of milk sold that month) for inputs like animal feeds and also human food. The Co-operative also provides a fall back outlet for those with other alternative outlets, especially in the peak production season for surplus output. In Kiambu, many farmers are members of one of the four main Co-operatives, but most appear to sell only the minimum necessary to the Co-operative to maintain access to subsidised inputs bought at wholesale prices with minimal mark-up and to credit. In Kiambu, District Livestock data suggests only 38% of farmers marketed milk goes via Co-operatives. Many of the members may not be active at all, even though the definition of active is very wide (any sale of milk in the last two years for one Co-operative). Where there a few outlets for milk, due to distance from markets or high surplus areas, the Co-operatives serve the crucial function of bulking and marketing. In other areas, they have to compete for farmers’ milk against their opportunities to sell direct. Prices paid to farmers in Kiambu are around Ksh. 17/litre, when they can get Ksh. 20-22 from other sources for at least some of their production. This results in narrow margins for the co-operatives, which are reduced further by inefficiencies in collection and distribution to the market and excessive overheads. In effect, many Co-operatives are competing with more efficient private sector traders, who have minimal overheads (not entirely due to their informal status) and more aggressive selling. Many Co-operatives are therefore either becoming more like the traders in the method of operation (taking pick-ups from collection points straight to the poorer areas of Nairobi) or seeking to become processors. Both Limuru and Meru Co-operatives have become large-scale milk
Dairy Sub-sector Study, DfID Kenya, DRAFT 11
Ebony Consulting International
processors in their own right, but seem to be suffering from relatively low capacity utilisation rates (> 50%)30 relative to other processors. Co-operatives suffer from uncertain supply from farmers who pass on the problem of disposal of surpluses to the Co-operative in the peak production period. Like the smallholders, Co-operatives adopt a diversified strategy for disposal, including fixed minimum contracts from large processors at almost no profit (Ksh.20 including delivery), which they maintain to ensure that they can sell milk in the peak production season. Sales to hawkers and local institutions at c. Ksh.24, increases the average price that can be paid to members. Self-help Groups differ from Co-operatives in the degree of sophistication and their inability to borrow. They are mostly arrangements for marketing and have grown more popular due to mismanagement in the Co-operative sector. Self-help Groups face the same problems as Co-operatives in terms of supply and marketing. Sales average 2,000 litres/day according to the Kenya Dairy Board
5.5 Processors There are 29 surviving licensed processors, processing almost 600,000 litres/day. Of this, the largest eight processors accounted for almost 500,000 litres/day.31 There is evidence of consolidation of market share in the industry, with the weakest processors simply ceasing to trade. It appears that the larger Processors like Brookside, Premier and Spinknit are gaining share, whilst some of the small processors that specialise in a limited high value product range are also doing well (e.g. Eldoville in Yoghurts and fresh juices). The key to success seems to be a combination of being able to source milk consistently at good prices, regular payment of milk suppliers combined with strong distribution and branding. Whilst the prices paid to farmers and Co-operatives are relatively low at Ksh.16-19/litre delivered, willingness to buy regularly and to pay on-time offer sufficient incentives to farmers to supply at least part of their surpluses to this channel. These latter benefits override the low prices and are important to farmers and Co-operatives in the peak production season when there are fewer alternative outlets. Supply contracts are struck but these appear to be no more than indications of intent as there are widespread breaches (by supplier and buyers). When processors have enough milk, particularly in the peak production season, some will reject milk on quality grounds (bacterial counts etc.) that they would accept at other times. However, those processors that abuse this option begin to find that supply in the production trough will dry up and therefore affect their own sales. Delaying payment appears to be a sign of impending problems, as one of the major reasons for supplying at low prices for the producers is the certainty and regularity of payment. This is one major reason why KCC has seen its intakes of milk reducing over the last decade to such a low level. The bigger processors appear willing to invest in cooling facilities in selected locations where there are low cost producers in milk surplus areas. The cost of bulk transport is relatively low with one processor illustrated by one processor that was bringing milk from Uganda to Nairobi within 30 KDB Licensed Milk Processors, 1999 data. 31 Based on data for the whole of 1999.
Dairy Sub-sector Study, DfID Kenya, DRAFT 12

Ebony Consulting International
the last two years. Both Spinknit and Brookside have invested in collection and cooling facilities near Eldoret, totalling over 60,000 litres/day and seem likely to do so in other milk surplus areas to guarantee their access to cheap milk. This assists smallholders in that area to find a regular outlet for large quantities of milk, but they are then ‘price takers’ dependent on what these two firms decide to offer. There is a lot of emphasis on cooling facilities in this channel and several NGOs link with large processors to support community owned and managed facilities. Heifer Project International appears to have a successful scheme in Bomet/Sirongoi (10,000 litres/day) and is experimenting with others, though the technical input cost is highly subsidised. These initiatives are attempts to link into the large Processors’ cold-chains, to ensure a market for the milk, even at relatively low prices. In effect, they are an uncoordinated attempt to recreate the KCC network of cooling centres into a national cold-chain. As mentioned before, most processors are tied in to the Tetra-Pak system of packaging, for historical reasons. There are experiments with pasteurised milk in pouches, but these have not yet taken off in most retail market, though bulk packs are more common in the catering and institutional supply market. Spinknit is trying hard to push cheaper bulk packaging and may be making some progress, given the relatively large cost savings. Several smaller processors appear willing to experiment with pasteurised milk in pouches, with Palmhouse already distributing its product around Nairobi and pouches available in Voi. Nairobi is the main market for pasteurised packaged milk, but the large processors are also distributing pasteurised milk to the other main urban centres of Nakuru, Mombassa and Kisumu. The major processors have recently invested in Long-life facilities, such that it now accounts for 20% of one of the main Processors sales. Long-life milk and other milk products have been distributed to rural centres for many years and are now beginning to be shipped to Uganda and Tanzania, through overseas based wholesalers. Export sales are limited at present but look set to grow. The large processors are not competing effectively with the raw milk supplied through channel two, either on price or quality of the product, rather they are seeking to make raw milk supply into a health and standards issue. Research co-ordinated by the Smallholder Dairy Project32 suggests that there are risks with both raw and pasteurised packaged milk relative to the existing standards. These risks are limited in effect because virtually all purchasers of milk are aware of the need to boil it. There are adulteration problems from the start of the chain, including smallholder farmers, but awareness by other players in the chain, especially processors, has lead to the widespread use of testing for at least some of the adulteration problems. Processors, through the Kenya Dairy Processors Association (KDPA) and the KDB are pushing for enforcement of standards whilst claiming that they could take up the loss of supply from the informal channels. Given that they supply less than as little as 12% of the liquid milk purchases and that they are operating at 60-75% capacity (excluding KCC), this claim appears not to be credible. They also assert that they would attack the informal market with cheaper bulk raw product (which is possible given their current 32 KARI 2001
Dairy Sub-sector Study, DfID Kenya, DRAFT 13
Ebony Consulting International
margins), if there were a concerted effort to crack down on unlicensed providers. Even if they could do this successfully, the result is likely to be small-scale operators going out of business and lower prices for smallholder farmers, especially if larger processors did capture a big share of the market. Several processors are importing dried milk powder (and butterfat) for reconstitution during the production trough (dry seasons) for a period of about six weeks to supplement supplies of liquid milk. This enables them to smooth out supply problems, but the quantities are relatively small accounting for less than one percent of all milk production.
5.6 Retailers There are several different types of retailers. Data from 1990 calculated almost 2,000 small and large retailers in Nairobi, which is probably an underestimation of the number of kiosks alone and is likely to have increased considerably by 2001. Large retailers deal only with the processors, selling only refrigerated packaged pasteurised milk in large urban centres. The range and breadth of products is considerable with multiple brands of milk, cheese, yoghurts, butter etc. Some of the longer life products are imported as are packaged infant milk powders. There are also many small retailers in urban areas, many of which are not licensed to sell/handle milk. Those in Nairobi and other major cities sell packaged pasteurised milk and/or raw milk in poly-bags. Some have refrigeration, but many do not to, requiring pasteurised and raw milk to be sold quickly and twice-daily stocking. Those suppliers with good distribution would presumably be able to gain market share just through availability. Additionally, there are specialist milk retailers (Milk Bars) in many urban areas, which KDB estimated to be selling an average of 200 litres/day.33 These require specific licenses from KDB to operate, but it seems that many do not have them. KDB have licensed about 300 Milk Bars nationally, but any trip to the slum areas of Nairobi would indicate much larger numbers of specialist milk retailers, let alone the many small duka/kiosks that also sell milk. As well as the KDB license, licenses are required from the local councils, which are very costly for a small retailer.34 The Milk Bars visited did have basic testing equipment such as a hydrometer and alcohol testing kits for water adulteration and bacterial development. They also tried to use established and regular suppliers, in one case developing its own supplier quality assurance system. Having a member of staff with a “good nose” to detect old milk, despite the use of hydrogen peroxide, was a more informal quality check. Margins in Nairobi for milk retailers/milk bars were between Ksh.4-8/litre. Sales of other products particularly Mala and drinking yoghurt were smaller but of much higher margins. Competition from Hawkers in Nairobi is intense though many milk bars will sell at wholesale to Hawkers, making only Ksh.2/litre.
33 According to SITE 34 One milk bar in Kibera suggested that they had been asked to pay Ksh 10,000 for a yearly license.
Dairy Sub-sector Study, DfID Kenya, DRAFT 14

Ebony Consulting International
The official estimate for the number of Hawkers in Nairobi alone is around 4,000, probably selling an average of 50-70 litres/day at Ksh.25-30/litre in Nairobi35. This is likely to be a major underestimate of the numbers, given the informal nature of this market. The figure may be at least treble this amount, based on anecdotal sources. There is a temptation for hawkers to adulterate or sell old milk and then move on. However, given the number of hawkers, it would be reasonable to assume that many would work a particular area and seek to build up regular clients. Any short-term gain from adulteration would soon be exposed and they would need to move on to a more uncertain area.
6. Input Suppliers A number of inputs are crucial, particularly for smallholder farmers. In the past, many of these were provided by Government at highly subsidised levels, leading to poor quality services and limited availability. Each of these services is now considered in brief.
6.1 Artificial Insemination (AI) AI provided by the Kenya National Artificial Insemination Service (KNAIS) has suffered a major decline since 1985 when 450,000 inseminations were undertaken. This was down to 100,000 by 1994 and 90,000 in 2000. AI used to be the dominant form of inception and contributed to the relatively high quality of the dairy herd in Kenya. Since the mid 1990s, private sector providers have made up much of the ground left by the unavailability of KNAIS in many areas. The model use by American Breeders Services (ABS) is very interesting at it has trained ‘entrepreneurs’ to offer AI as a profitable business. This appears to be very successful with increasing market share in areas where entrepreneurs operate (c.40-45% according to ABS estimates, 20% according to other sources). As well as learning the technical skills necessary for AI, the entrepreneurs learn business skills and wider knowledge about cow evaluation, directory reading, mastitis prevention and control, ear tagging etc. Whilst their overall technical knowledge of animal husbandry might be limited they are at least a potential source of information to farmers. There are three private companies operating in this field alongside KNAIS, resulting in healthy competition and a private sector led service to farmers. AI has the potential to improve yields through improving the genetic quality of the stock, however, there appear to be a considerable number of dairy cows that are not reaching their potential output because of the limited amounts of feed/fodder. This appears to be a more significant problem than the genetic potential of the herd.
6.2 Feeds Farmers use a combination of home grown or purchased fodder plus concentrates (manufactured feeds) and minerals. Zero-grazing smallholders may grow some Napier grass on part of their smallholding and will feed other waste vegetation. Many are likely to buy in fodder and feeds for at least part of the time. There is a growing fodder supply business in Kenya. For example there is 35 According to SITE
Dairy Sub-sector Study, DfID Kenya, DRAFT 15
Ebony Consulting International
now a large farm harvesting hay in Nakuru and selling at Ksh.50/bale. As the season goes on, the price of a bale might increase to Ksh.350. A lactating cow would probably need one bale/day, supplemented by green fodder. This would usually be enough to give a major boost to milk production to cover the cost of the bale bought soon after harvest and stored on the farm. UNGA Feeds continues to dominate the manufactured feed market with a claimed 70% market share, but given the intensity of competition in this market from new competitors, this seems likely to decline especially as UNGA’s products tend to be 3-5% more expensive at the retail level. UNGA have 10 ‘Business Partners’ who are effectively the main wholesalers supplying many feed stores in smaller towns and rural communities. These wholesalers sell to around 5-700 stockists, probably representing over half of the total number of feed retailers nationally. Whilst the Business Partners only sell UNGA products, the stockists carry three or more brands. Margins are low (10-15% for stockists c.Ksh.30/bag) but volumes relatively high. UNGA train their distributors in some of the technical aspects of feeds, but it is unlikely that many of the stockists are anything more than traders with limited technical knowledge. UNGA provides support to farmers through co-operatives and self-help groups, running seminars and training sessions. These are likely to reflect the company’s perspective on suitability of feeds, but would probably also contain some useful information for farmers. There are also Field Days at which feed companies, AI providers, District Livestock Staff, Animal Health Companies and others provide information to large groups of farmers (c.700 at the last one in Kiambu). With so many smallholder farmers, these mass means of communication are likely to be much more cost effective and sustainable than one to one extension services, which are no longer readily provided by government. UNGA had tried radio in the past but it felt that it had limited impact, possibly because there was low awareness of when its programme was being aired. There is a Kenya Association of Feed Manufacturers, but industry sources indicate that it is moribund as a promotional organisation for the industry. Feed is often sold via Co-operatives who buy in bulk and sell on credit to members. Some large processors have tried to provide feed on credit in exchange for milk with mixed results. Overall it does appear that the private sector is functioning well in terms of distribution of feeds and related products. Even in marginal areas, there are businesses offering feed, animal health products and services, AI, Veterinary services and other related products and services to farmers in an integrated manner as a sustainable business.36 These may be ex-government extension staff in some cases.
6.3 Veterinary Services Anecdotal indications are that the Government veterinarian services are still good on disease control vaccinations. There is an explicit agreement that where a private vet establishes a practice in a particular area, the government will withdraw its own services. From anecdotal sources, it appears that there are many vets operating in high concentration areas, around Nairobi for example, possibly even an over-supply.37 36 See the experience of FARM Africa in Meru. 37 There are 14 in Kiambu district and c.20 in Ngong.
Dairy Sub-sector Study, DfID Kenya, DRAFT 16

Ebony Consulting International
There are also areas that are not well serviced, such as around Meru and many ASAL areas. The model used by FARM Africa originally to support dairy goats, has resulted in different levels of Animal Health practitioners serving an area with limited prior access to such services. There are several NGOs operating other models to achieve similar results. The interesting point is that the private sector is able to function successfully in marginal areas (primarily by offering a broad product and service range) but needs encouragement to enter what might seem to be unpromising areas.
6.4 Heifers The supply of heifers is important for the industry, especially new entrants. Many farmers would breed their own stock as a natural part of milk production, but may buy in heifers to improve the quality of their herd, expand the herd quickly or when starting. This has been a useful source of sales for larger dairy farmers in the past with pedigree surplus stock (c. Ksh.30,000 each for the best animals) and is a business opportunity in its own right. Heifer Project International is attempting to introduce poor farmers in milk deficit areas to dairy farming through providing heifers and then taking the first heifer as repayment.
6.5 Extension Services Research indicates that high numbers of dairy farmers claim to have received extension support from Government.38 This would seem to contradict the view from within the industry and a common sense view from the field, which suggests that Dairy Extension Officers only operate with a limited number of farmers. For example, in Kiambu, there are 70,000 smallholder farmers and one Dairy Extension Officer without a regular means of transport. Even seeing 10 farmers/day every working day would mean that only c.5% of farmers are visited in any year! Field Days and seminars are organised alongside commercial companies at which the District Livestock Staff are active participants, but these still only cover a fraction of the smallholder farmers. Extension information and advice is being offered by several commercial companies as part of their package and linked to the sales of their particular products. This is done at the point of sale (feed merchants, agro-vets, AI practitioners etc) or occasionally by field based staff (e.g. UNGA Feeds). Inevitably there is a risk that farmers will not be getting the best information, if this does not suit the particular company providing the information. However, it would be wrong to assume that the information from these sources is necessarily wrong, or disadvantageous to the farmer. It also assumes that farmers are naïve enough to believe, let alone act upon everything they are told and that they do not share information between themselves formally and informally. There is also scope for the Farmer Field Schools to develop as effective mechanisms for extension. According to FAO, most of the horticultural farmers in Central have requested dairy as their ‘special topic’ within the Field School, indicating a demand and a mechanism for dairy extension advice.
38 Nyangaga et al (2001) indicate 93% of farmers interviewed in Western Kenya claim some extension contact. Staal (2001) estimated that 60% in the Nairobi Milk Shed had contact.
Dairy Sub-sector Study, DfID Kenya, DRAFT 17

Ebony Consulting International
There is also some extension training work being undertaken with informal sector milk retailers, co-operatives and small scale producers in relation to hygiene standards and basic processing skills, supported by Land o’ Lakes and Technoserve, involving the Kenya Dairy Board. The involvement of the latter is encouraging given the wider hostility to the informal sector that exists.
6.6 Testing Services Large dairy processors are well equipped to test incoming milk and outgoing milk products. However problems are more likely to occur in the more informal channels for raw milk. The use of Lactometers/Hydrometers to test for adulteration by water seems common practice for co-operatives and milk bars (at least the specialised ones). However there are examples of flour and margarine being added, presumable to add solids/fat content in addition to water to achieve the right density. The hydrometers are readily available and cost Ksh.350-400. However, because they are glass, they are easily broken especially if used in the field and may require regular replacement. Glass would seem to be an unusual material for use in the field and in a food product. The alcohol ‘gun’ tests are also common, though often used without the gun,39 to test for bacterial development. The tilt test that is more commonly used is less accurate. Because the alcohol used is expensive, the test is rarely carried out unless the product is suspect. Hydrogen Peroxide is used to mask old milk, particularly by those traders bringing milk from long distances to Nairobi. Buyers often have to rely on a keen sense of smell. Maningate Agencies indicate that they will soon be importing strip tests for hydrogen peroxide at Ksh. 8,500 – 11,000. A cheap, simple test would be a valuable aid to reducing adulteration. There also appears to be problems with the feed suppliers and the quality of feeds. There may be conscious cheating or poor processing that means that the feed falls below its specification. Addition of bulking (sawdust) and weighting (sand) ingredients by input suppliers to the feed manufacturers and by some manufacturers is a problem, resulting in poor value and potential risks to the animals.
6.7 Animal Health Products There are three main suppliers of chemicals, biocides and animal health medicines, probably indicating a competitive market. Distribution appears to be very effective in high-density areas. It was even possible to find acaricides on sale in a major Uchumi store in Nairobi and also in (human) pharmacies in dairy producing areas. The emergence of many more Agri-vets is interesting. These distribute animal health care products (de-wormers, tick control products, medicines) and provide advice to farmers. Coopers, probably the leading supplier, works through master distributors who then supply stockists, some of whom provide other products including feeds. The master distributor for Coopers in Nairobi and Kiambu employs four vets who visit 1,000 retailers on a regular cycle in fully stocked vans. These vets can provide instant information to stockists on questions raised by their customers.
39 The ‘gun’ costs circa Ksh.35, 400 according to Maningate Agencies Ltd.
Dairy Sub-sector Study, DfID Kenya, DRAFT 18

Ebony Consulting International
6.8 Kenya Dairy Board Whilst KDB is not an input provider it has an important role in setting and enforcing standards of milk production and marketing. It is funded through a cess, which has recently been increased from 5 to 20 cents/litre and through licences. It has limited resources and therefore struggles to carry out its mandate. Any discussion of revised standards to reflect the market reality and practices would need to closely involve the Board. At present there is considerable resistance to the lowering of standards at KDB and amongst the KDPA and processors who are well represented within KDB. The main statements from KDB are that they intend to enforce the standards as they stand to the detriment of smallholders, hawkers, milk bars and the urban poor, if successful.
6.9 Dairy Industry Stakeholders Association of Kenya (DISAK) Land O Lakes is assisting DISAK to be established and registered as an industry wide forum to promote milk. The emphasis still seems to be on pasteurised cold-chain milk and the body has not yet been registered. According to Land O Lakes there is active representation and participation from the formal sector. There is no specific association covering all milk hawkers and sellers, but there are indications that groups of hawkers are beginning to organise themselves.
7. Dairy Sub-sector Map A distinction is drawn between ‘marketed’ milk, which is sold or exchanged and ‘non-marketed’, which is milk for self-consumption or for feeding to calves. Non-marketed milk does not involve any transaction, though it does account for 36% of all milk produced and represents an important cost saving for the household concerned in terms of milk for human consumption and reduced need for purchased animal feeds. Four main channels for ‘marketed’ milk have been identified, and are represented in Figure 1 below. This is a simplification of what is a complex reality, but enables stakeholders to focus on the main potential intervention points. Each channel is described in turn.
Dairy Sub-sector Study, DfID Kenya, DRAFT 19

Ebony Consulting International
Figure 1. Dairy Sub-sector Map
Dairy Sub-sector Study, DfID Kenya, DRAFT
Urban Consumers Poor Rich
Rural Consumer
Retailing
Wholesaling
Transporting
Processing
Pateurising
Cooling
Collection/Bulking
ProductionSmallholder Farmers
(625,000)
Co-operatives/ Self-help Groups
(1,000)
Medium/Large Dairy Farmers
(2,000)
Large/ Medium Dairies (10)
Small Dairy (20)
Traders(5,000)
Small Retailer(90,000)
Large Retailer
(10)
Hawker/ Milkbar(10,000)
Caterer/Hoteli
(145,000)
Channel 1 Channel 2 Channel 3 Channel 4 RawMilk PasteurisedMilk MilkProd’s
20

Ebony Consulting International
7.1 Channel One - Raw milk direct from Farmer to Rural Consumer Farmers, predominantly smallholders, have always supplied milk for consumption by neighbours as the most efficient way to dispose of surpluses quickly and cost effectively for payment or other form of value exchange. Research in the Nairobi Milk Shed indicated that 42% of smallholders sold to neighbours as their main market. Farmers do supply more distant consumers directly either in rural or urban centres, depending on individual circumstances such as the amount of surplus, the cost of transport and the availability of sales in the immediate locality. There are obvious economic trade-offs for the farmer in both extra costs and time incurred, limiting how far and how much effort farmers will make. The perishable nature of the product is also an important limiting factor in terms of the potential market. Prices paid by consumers depend on the region (milk-surplus/deficit area), but even more so the micro-locality of milk available in the immediate neighbourhood. The agreed price will depend on the balance of power between smallholder farmer and rural consumers, but will be limited by rural households relatively low purchasing power. Price information at the micro-level is both hard to obtain and likely to be highly variable. Anecdotal information from Karen and Kiambu suggest that the prices paid by neighbours at Ksh.22-24/litre, were the highest obtained for the farmer from any source (normally Ksh.17-22/litre) and the lowest paid by any consumers (normally Ksh.30/litre). The directness of the channel with no intermediaries or transport/processing costs results in considerable cost savings to both parties. The lack of availability of pasteurised milk and the high cost of long-life milk in rural areas mean that there is little real competition for raw milk. The vibrancy of this channel depends on what happens to rural incomes, rural population and continued growth of supply in the particular areas. Logic would suggest that this is a favoured channel for smallholder farmers because of the premium price, simplicity and immediate payment relative to other channels. It is therefore likely to remain strong and continue to grow, even if the rural population and incomes are growing more slowly than urban population and income.
7.2 Channel Two - Raw milk via intermediaries to urban consumers It is estimated that more than 80% of milk consumed in urban areas is raw milk. This is an important and highly efficient channel accounting for 30% of all marketed milk.40 Smallholder farmers will supply any surplus, over and above self-consumption and that supplied via channel one, to either traders, co-operatives or self-help groups. According to research, 22% of smallholders in the Nairobi Milk Shed sold to traders as their main market outlet and 12% to Co-operatives and Self-help Groups.41 These bodies act primarily as intermediaries to bulk the milk (for transport and other economies of scale) and get it to urban markets. Speed is essential, given the perishable nature of milk and time of day also seems to be critical, with the best prices and highest chance of selling early in the morning, with a second peak in early evening coinciding with consumers need for milk.
40 KARI (2001) 41 Staal et al (2001)
Dairy Sub-sector Study, DfID Kenya, DRAFT 21
Ebony Consulting International
There are wide variations in the chain and the number of intermediaries used, but one example from Kiambu/Nairobi illustrates the process.
1. Smallholder producers in areas such as Kiambu are milking at 1-2.00 a.m., 2. Milk is collected by the co-operatives and sold to traders at the collection points from 2.30
a.m. 3. Milk is transported to all areas of Nairobi (particularly slums and poorer areas) and is on
sale from 5.00 a.m. 4. ‘Hawkers’ buy the milk and take it to individual households for purchase in any quantity
(often 10-30 ml) or it is delivered direct to ‘milk bars’ for sale 5. Households use the milk immediately and can purchase again for evening consumption.
Despite the number of intermediaries (often two sometimes more), the chain appears to be very efficient at getting milk from rural producers to urban consumers at the right time and at the right place. The ruling prices are between Ksh.30-35/litre with hawkers at the low end and milk bars/retailers at the higher end. Local factors, such as the number of outlets selling milk and local income levels are important. Price paid to the co-operatives and self-help groups depend on distance from the market and whether the milk was delivered. Many co-operatives and self-help groups have begun to take the milk in their own vehicles (usually pick-ups), park at a known place in a slum area and wholesale it to milk bars and hawkers at Ksh.23-26/litre. The Co-operatives in Kiambu were paying members an average price based on all milk sales to different sources minus the operating costs. Selling to urban areas seems to give Co-operatives the best return per litre, despite the transport and associated costs (driver/ salesperson). The farmers in Kiambu were getting Ksh.17-18/litre from the co-operatives. This was a relatively low rate, compared to other outlets, but there were other perceived advantages from supplying the co-operatives (see section on co-operatives). There will be occasions when milk is returned unsold from Nairobi, especially in the peak production periods however, there are also examples of shortages of milk at specific times and on particular days, in particular areas. The market does not function perfectly, but it does operate very efficiently for both intermediaries and consumers with available supply usually cleared at prices well below the main alternative product (packaged pasteurised milk). Whilst some players in this channel are licensed to sell milk (Co-operatives, Specialist Milk Bars and some Traders), many are not (Hawkers, Kiosks, Dukas and many Pick-up Traders). The returns from this channel appear to be good for these players (particularly those who are not licensed) and there can be extra profits to be made from adulteration by water, margarine and hydrogen peroxide (by intermediaries and producers). Indications are that consumers prefer raw milk because it is whole milk without having any of the cream removed (to make butter and other products). This is in contrast to package milk from large processors, which has its butterfat content ‘standardised’ down through partial skimming. This is true across income ranges42 indicating continued increasing demand for raw milk even as real incomes rise. The issue of shelf life of raw versus pasteurised milk is of little relevance to 42 Ouma et al (2000)
Dairy Sub-sector Study, DfID Kenya, DRAFT 22

Ebony Consulting International
consumers given that most milk appears to be consumed immediately with at least 60% used in Tea (boiled)43 and with 98-100% awareness of the need to boil milk before consumption. As most households in the slum areas buy and consume immediately (as there are few households or even retailers with refrigeration) pasteurisation would seem to be necessary only because of the length of time in the large processor’s distribution chain and for the limited number of households that can refrigerate. Given the highly informal nature of this channel, volumes, value and growth in urban raw milk sales are hard to determine. The KDPA and other industry sources suggest 80-90% of urban liquid milk volumes are supplied in this way and that this is a growing channel relative to packaged pasteurised milk. Urban populations are growing44 more rapidly than rural population, as are urban incomes. The recent slow down in GDP per capita growth will limit the overall market for milk but, as indicated earlier, this may encourage trading down, with a greater effect on packaged pasteurised milk. Indications from research by the Smallholder Dairy Project are that milk sold through the informal sector (effectively channel two) creates three direct jobs per hundred litres and one indirect job, whilst processed pasteurised creates less than one job per hundred litres.45 This emphasises the potential impact of developing this channel for employment and poverty impact. Overall the swift delivery of raw milk from farm to (poorer) consumers in urban areas at relatively low prices appears to be highly efficient and the channel that is growing.
7.3 Pasteurised packaged milk to urban consumers This is the smallest of the three liquid milk channels (c.12% of milk)46, with a daily average of 593,000 litres processed by 29 firms. Large dairy farmers and co-operatives fulfil a bulking function making it simpler and more economical for processors to contract with one large organisation for supply. They may also ‘cool’ the milk to increase its shelf-life and maintain its quality, depending on whether they have the facilities. Bulk transport is provided by (large) processors to a central facility, usually located near to the market.47 Milk is pasteurised and packaged as liquid ‘fresh’ milk or treated at Ultra High Temperature (UHT) for long-life milk. These are distributed directly to large retailers and small retailers through the processors’ transport and delivered directly to institutions for resale or use in catering. This channel is distinguished from the other two channels through the milk being pasteurised and through its use of a cold distribution chain, at least as far as the retailers. This requires a higher technology level and more complex production and distribution management resulting in higher
43 According to Brookside and others 44 Rate of 7% p.a. according to 1999 census data 45 SDP. 46 KARI (2001) 47 Bulk transport is about half the price of moving finished package products; therefore closeness to the main market is preferred.
Dairy Sub-sector Study, DfID Kenya, DRAFT 23

Ebony Consulting International
costs. Because these processors are in the formal sector, they also incur additional ‘business’ costs through payment of VAT and corporate taxes. All the major processors (with the exception of Palmhouse) use tetra-pak packaging systems and materials. This is the format that KCC originally used and which the Kenyan consumer has got used to. Therefore it has become the norm for packaged pasteurised milk, even though it is technically not necessary and it adds significantly to the cost of the product at Ksh. 6.4 per litre (c.13% of the retail price). As well as being pasteurised, the milk is partially skimmed and homogenised. This enables the processor to use the cream that is removed (the most valuable part of the milk) for making butter and other high value products. The result is that processed milk has lower average butterfat content (minimum 3.25% by regulation) than raw milk. Much of the research has shown that consumers prefer raw milk to pasteurised ‘standardised’ milk, especially for making tea (its main use). This may partially account for the use of raw milk in richer households in addition to packaged pasteurised milk i.e. it is the skimming not the pasteurisation that makes the difference. Processors appear to be buying milk for collection in bulk from co-operatives and farmers at Ksh16-19/litre, depending on location. Higher prices are paid for milk delivered to the plants, but the premium appears minimal (c. Ksh.1-2/litre). Processors are selling direct to retailers at Ksh.46-48/litre for retail at Ksh. 50-52/litre, leaving retailers with relatively small margins on packaged pasteurised milk of up to Ksh.4-6/litre. It is difficult to establish the costs of packaging and processing, for reasons of commercial confidentiality, but the consultant’s estimate is that it is around Ksh.27-30/litre. Distribution costs from factory to retailer are carried by the Processor and may account for an additional Ksh2-3/litre, giving a net margin of Ksh.12-18/litre before overheads. Whilst overheads are likely to be high relative to other players, due to capital invested, marketing and the other costs of managing a large business, it appears that the processors get the highest share of the profits per litre in the channel. The suggestion from one of the main Processors is that the pasteurised milk market is growing at 2-3% p.a. Overall, this channel is probably growing slowly, reflecting increased urbanisation and medium to long-term income growth. However it is not as dynamic as channel two and presents much lower returns to smallholders and small retailers.
7.4 Channel four – Milk Products to Urban Consumers This channel is the smallest in volume and value terms, as the market for added value milk products is still very limited and underdeveloped. It shares much of the infrastructure of channel three as the milk is supplied from larger farmers to medium/large processors or is supplied by the same source and co-operatives to small processors. The large processors are removing cream from the milk (standardising down) to make butter, ghee and other products. They have also recently started making flavoured long life drinks. The small processors differ from the large ones in that pasteurised liquid milk is not the main product, rather they specialise in particular added value products such as yoghurt (Eldoville) or cheeses with more chance of getting space in the major supermarkets. Distribution is again crucial as the products
Dairy Sub-sector Study, DfID Kenya, DRAFT 24

Ebony Consulting International
require refrigeration and only appeal to a limited urban middle-income group. There are some sales to hotels that cater for tourists and visitors. No data was available for the growth of further processed products such as yoghurt and cheese, but the indication from the processors was that these products were growing at a higher rate. With many brands of imported cheese on the large supermarket shelves, this would indicate potential for further growth even if only at the expense of imports. For yoghurt production, packaging and distribution costs are significantly higher than pasteurised milk, but the retail prices of yoghurt gives a margin of Ksh. 8-11/150ml pot (Ksh.53-73/litre of milk). Retail margins (sold via large retailers only) are similarly high. The long-term prospects for this channel appear to be good, but its overall value to the dairy industry is limited at present and for the foreseeable future.
8. Dairy Sub-sector Dynamics Of the four channels in the dairy sub-sector, the Urban Raw Milk channel (two) is by far the most dynamic. This supplies c.80-90% of all milk into urban areas and operates very efficiently to get milk from 625,000 smallholders in adjacent rural areas, right to the doors of urban households, even though it may pass through several players to get there. This milk is considerably cheaper than the alternative pre-packed pasteurized milk and rich and poor Kenyans alike prefer its taste. Because of the ‘informal’ and illegal nature of much of this trade, it is impossible to get accurate data on volumes and growth, but there appears to be sufficient demand to clear all the supply that can reach Nairobi. The low incomes of most households and the preference for raw milk drive the growth of this channel, despite the attempts of industry bodies, the Processors and the police to stop the trade. The rural raw milk market is even more informal, characterized by many small direct transactions between neighbours, which are impossible to monitor. As a very short supply chain, it delivers the best prices to smallholder farmers and lowest prices to consumers (and probably the best quality). Its growth depends on what happens to rural incomes and increasing availability of local supply. This is likely to be the preferred route for Smallholders due to the best returns of all channels. The decline of Kenya Co-operative Creameries, has reached rock bottom and therefore the large falls in the supply of pasteurized milk seen in recent years have probably bottomed out. There may be some limited growth though there is continued rationalization amongst processors. Growth in this channel could be stimulated by limiting the Raw Milk channels, as the overall level of demand for milk is high. However, this has proved elusive in the past. It is more likely to come from increases in real incomes, but the prospects appear limited at present and processors are looking to increase volumes of Long-life milk for distribution to rural areas and for export to Uganda and Tanzania. Channel four, which includes milk products such as cheese, butter, ghee, yogurt etc., is the smallest of the four channels but is showing growth through innovation and potential for export.
Dairy Sub-sector Study, DfID Kenya, DRAFT 25

Ebony Consulting International
However, domestic demand is constrained by static real incomes, particularly of the middle and upper income households. It is likely to be a long time before these added value products are regular purchases for a majority of households. Milk is a price and income sensitive product. The ready availability of large quantities of raw milk in all areas of Nairobi at affordable prices has stimulated demand, particularly for smallholder milk from areas adjacent to urban areas. Liberalization did cause a chaotic transition, which is still ongoing, however, many of the supply arrangements have been worked out informally and appear to operate efficiently, leading to continued investments and overall growth in supply to meet an excess of demand.
9. Scope for Interventions The scope for intervention needs to consider the major constraints in the sub-sector and any points of leverage.
9.1 Major Constraints From the mapping and analysis of the Dairy Sub-sector, a number of key constraints can be identified:
1. Poor and inadequate information of a strategic nature on supply and demand issues at farm and marketing levels
2. Slow/no growth in consumer incomes limits rate of growth in overall market demand 3. Seasonal fluctuations in supply result in unsatisfied demand and lost supply at different
times. 4. Poor infrastructure combined with spatial supply and demand imbalances result in
unsatisfied demand and lost supply 5. Smallholder productivity is unnecessarily low, thereby limiting returns 6. Smallholder access to capital and knowledge constrains improvements in yields and supply 7. Critical inputs to smallholders, such as feeds, are not consistently to the right quality 8. Critical inputs are not always available to smallholders in all economically viable areas 9. Smallholders are partly dependent on inefficient intermediaries (Co-operatives) or
vulnerable to exploitative behaviour by powerful buyers (Processors). 10. Growth of ‘formal’ Dairy Industry constrained by success of Raw Milk Channel and
limited real income growth of urban middle classes. 11. Supervisory body is partisan on behalf of Processors, but is mostly ineffective 12. Raw milk is not perceived by some consumers to be safe or free from adulteration leading
to purchase of more expensive, less desired product 13. The informal actors in the urban raw milk channel are not seen or treated as legitimate by
the authorities, thereby affecting their ability to operate efficiently. 14. Limited value adding taking place in the raw milk channels that reach the rural and urban
poor due to lack of capital and knowledge.
Dairy Sub-sector Study, DfID Kenya, DRAFT 26

Ebony Consulting International
Whilst there are many constraints in the sub-sector, this should not detract from the overall dynamism in the sub-sector and that many of these are surmountable. The points of leverage detailed below indicate the areas where working with a small number of organisations could reach many smaller players.
9.2 Nodes for potential intervention Nodes are points where a small number of players interact with very large numbers of players. These provide potential points of leverage. Potential nodes include: • Co-operatives and self-help groups • Large processors • Traders • Input suppliers (AI, Animal Health Service Providers, Feed/Fodder suppliers) • Agro-vets • Suppliers of Heifers It is also worth noting that many smallholders also grow coffee, tea and horticultural products, including green beans. It was suggested by District Livestock Staff that smallholder dairy farmers could also be reached through associations and co-operatives that span these sub-sectors.
9.3 Geographical concentrations There are very strong geographical concentrations of dairy smallholder farmers, in the HMPL areas, especially Rift Valley and Central Provinces. This makes it easier to access relatively large numbers of smallholders. Successful strategies that could be adopted include the use of Farmer Field Days, as supported by the MoA, Smallholder Dairy Project and commercial companies. There would also be scope for use of broadcast media in the dominant languages of these areas, linked to promoting the timing and content of the programme through posters in Agri-vet and feed stores. There are other heavy concentrations in Western and Coastal Provinces that could also be targeted.
9.3 Opportunities for interventions There are many opportunities for interventions in the dairy sub-sector. The main ones have been set out below in outline, with some indication of where opportunities to develop business services exist. Those with the highest priority have been indicated. Low priority interventions have not been included.
Dairy Sub-sector Study, DfID Kenya, DRAFT 27

Ebony Consulting International
9.3.1 Legitimising the informal sector (High) The key interventions would seek to:
1. Develop the wider understanding of the function, scale and actual operation of the informal sector (channels one and two) based on accurate qualitative and quantitative information
2. Change the standards and licensing requirements to encompass this group, particularly the traders, retailers and hawkers, and to reflect the realities of the how milk is consumed
3. Enable informal sector providers to get licensed
9.3.2 Improving milk safety through all channels (Medium) The key interventions would seek to:
1. Improve knowledge and performance of smallholder farmers in the production and handling of safe milk (Business Service – through commercial training by input providers and/or Farmer Schools)
2. Improve knowledge and performance of sellers and small scale processors in milk hygiene and handling (Business Service – through commercial training by input and equipment suppliers)
3. Enable wide-scale access to robust and affordable testing kits for detecting adulteration and poor quality at each level in the supply chain (Business Service – by equipment manufacturers/importers/distributors and through agro-vet/feed suppliers)
4. Increase availability of affordable and appropriate containers for use at all stages of informal raw milk handling (Business Service – by equipment manufacturers/ importers/distributors and through agro-vet/feed suppliers)
5. Educate consumers in safe handling and use of milk and how to identify poor quality/adulteration (Business Service, sub contracted by industry-wide body)
9.3.3 Improving the quality of inputs to smallholder producers (Medium) The key interventions would seek to:
1. Ensure current standards are adequate and appropriate 2. Facilitate enforcement of standards in the marketplace 3. Develop and make available robust and affordable testing systems for use in the field
suitable for smallholders (Business Service by equipment manufacturers/ importers/distributors)
9.3.4 Facilitating availability of critical inputs (Medium) The key interventions would seek to:
1. Facilitate the private sector to provide critical inputs and services that are not readily available in economically viable dairy areas (Business Service – establishment of multi-service input providers)
2. Facilitate smallholder farmers have access to critical information and advice (Business Service – provided by commercial companies and ‘neutral’ bodies at Field Days and through Farmer Schools)
Dairy Sub-sector Study, DfID Kenya, DRAFT 28
Ebony Consulting International
9.3.5 Increasing the overall supply of milk from smallholders (High) The key interventions would seek to:
1. Enable smallholders to increase their yields, though access to and use of appropriate inputs and through improved management practices (Business Service – Input Suppliers and Farmer Schools)
2. Stimulate more smallholder farmers to start dairying in economically viable areas (Business Service – by Input Suppliers, especially Heifer providers)
3. Stimulate smallholder farmers to expand herds and production in economically viable areas (Business Service – by Input suppliers especially Heifer providers)
4. Improve access and connection to potential markets through each channel (Business Service – management services to Co-operatives and Self-help groups)
5. Reduce wastage and loss of milk through poor infrastructure in economically viable areas (Business Service – opportunities for (small scale) cooling facilities run as businesses or producer owned enterprises)
6. Improve economically viable preservation options for milk at early stages in the chain (Business Service by providers of biological agents and equipment)
7. Improve supply in times of excess demand (dry season) in commercially viable ways (Business Service – through fodder suppliers and fodder preservation equipment suppliers)
9.3.6 Improving productivity and reducing smallholder costs (High) The key interventions would seek to:
1. Ensure that research that delivers practical gains in performance of smallholder dairy systems is undertaken and widely disseminated (Business Service – subcontract dissemination, or use existing input providers and input outlets)
2. Improve smallholder dairy management knowledge and practices that directly improve yields (Business Service – use Co-operatives/Processors, Input Suppliers, Field Days and Farmer Schools)
3. Improve access to services and inputs that improve returns (Business Service – especially feed/fodder and through more integrated Input Suppliers)
4. Facilitate competitiveness in service and input markets to reduce real input costs (Business Services – more Input Suppliers in under-serviced areas)
9.3.7 Improving real prices paid to smallholder farmers (Medium) The key interventions would seek to:
1. Strengthen the mechanisms for smallholders to get better prices and terms from buyers 2. Increase competitiveness of intermediaries and processors (Business Service –
development and dissemination of handling and processing technologies/ equipment by suppliers and trainers)
9.3.8 Improving returns to informal and small-scale sellers/processors (Medium) The key interventions would seek to:
1. Increase the range of products that Milk Bars and Micro-scale Processors can offer profitably, including non-milk products (Business Service – Commercial Trainers and/or equipment Suppliers)
Dairy Sub-sector Study, DfID Kenya, DRAFT 29
Ebony Consulting International
2. Facilitate product diversification by small-scale processors and improve their competitiveness (Business Services – Commercial Trainers and/or equipment suppliers)
3. Facilitate access to micro/small scale processing equipment that is affordable (Business Service – Equipment Suppliers)
4. Facilitate access to other milk and non-milk products that complement raw milk (Business Service – product and equipment suppliers, such as juice makers etc.)
9.3.9 Strengthening accountability and capability of Industry Bodies (Medium, contingent on more inclusive attitude) The key interventions would seek to:
1. Develop the mandate of industry-wide bodies to represent all groups, including informal sector and consumers
2. Strengthen capacity of industry-wide bodies to fulfil their mandate 3. Enable such bodies to promote the industry and to lobby on behalf of all constituent groups 4. Gather information of strategic importance to the industry (Business Service – subcontract
local research providers)
Dairy Sub-sector Study, DfID Kenya, DRAFT 30

Ebony Consulting International
References Government of Kenya, (2001) Kenya Rural Development Strategy, Nairobi, Kenya Agricultural Research Institute, (2001) Workshop Proceedings: Assessing and Managing Milk Health Borne Risks for the Benefit of Consumers in Kenya, KARI, Nairobi. Karin, F.Z., (2001), Overview of Dairy Sector Development: Constraints and Opportunities, Tegemeo Institute of Agricultural Policy and Development, Nairobi. Kodhek G.A., (1999), Draft Report on Revitalising the Dairy Sector in Kenya, Tegemeo, Nairobi Kristjanson P., Wangia C. and Kashangaki J., (1995), Agribusiness Subsector Study, Mwaniki Associates Ltd., Nairobi Mariuki, H.G., (2001), Kenya Country Paper, Paper presented to the South:South Workshop on Smallholder Dairy Production and Marketing – Constraints and Opportunities, Anand, India. Ministry of Agriculture, Livestock, Development and Marketing, (1997), Inter Ministerial Workshop on Agricultural Sector Investment Programme, KCCT, Mbagatheri. Ministry of Agriculture, Livestock, Development and Marketing, (2001), Kenya Dairy Industry Population and Consumption Projections to the Year 2025, MOARD, Nairobi Morara A., (2001), Monitoring and Evaluation of the Micro-PED Project, Final Report, Capacity Development Africa for Technoserve, Nairobi. Mulindo, J.C., Omore, A., Islam S.M.F., Nurah, G., Khan M.I. and Staal, S., (2001) Employment Generation through Small-scale Dairy Marketing and Processing: Experiences from Kenya, Bangladesh and Ghana, FAO, Nairobi. Nyangaga et al (2001), Characterisation of Western Kenya, Smallholder Dairy Project, Nairobi. Omore, A., Mariuki, H., Kenyanjui, M., Owango, M. and Staal, S., (1999) The Kenyan Dairy Sub-Sector, A Rapid Appraisal, Smallholder Dairy Project, Nairobi. Ouma, E., Staal S.J., Omore, A., Njoroge, L., Kang’ethe S., Arimi S.M. and Njubi D., (2000), Consumption Patterns of Dairy Products in Kenya, KARI/MoA/CBS/ILRI, Nairobi.
Owango M., Lukuyu, B., Staal, S.J., Kenyanjui M., Njubi D. and Thorpe W. (1998) Dairy Co-operatives and Policy Reform in Kenya: Effects of Livestock Service and Milk Market Liberalisation, Food Policy, U.K.
Dairy Sub-sector Study, DfID Kenya, DRAFT 31
Ebony Consulting International
Peeler E.J. and Omore, A. (1997), Manual of livestock Production Systems in Kenya, 2nd Edition, Kenya Agricultural Research Institute, Nairobi. Staal, S.J., Owango, M., Muriuki, H., Kenyanjui, M., Lukuyu, B., Njoroge, L., Njubi, D., Baltenweck, I., Musembi, F., Bwana, O., Kuriuki, K., Gichungu, G., Omore, A. and Thorpe, W. (2001), Dairy Systems Characterisation of the Greater Nairobi Milk Shed, Smallholder Dairy Project, Nairobi. Tegemeo (1999), Draft Report on Revitalising the Dairy Sector in Kenya, Tegemeo Institute of Agricultural Policy and Development, Nairobi.
Dairy Sub-sector Study, DfID Kenya, DRAFT 32