damping ratios at higher modes-experimental investigation
TRANSCRIPT

Journal of Engineering and Technology Research Vol. 4(6), pp. 114-128, November 2012 Available online at http://www.academicjournals.org/JETR DOI: 10.5897/JETR12.015 ISSN 2006-9790 ©2012 Academic Journals
Full Length Research Paper
Experimental determination of damping ratios at higher modes for use in modal superposition
V. Ramamurti1*, S. Mithun2, N. Prabhakar2 and T. Sukumar2
1Indian Institute of Technology Madras (IIT Madras), Chennai, India.
2WABCO India Limited, Plot No. 3 (SP), III Main Road, Ambattur Industrial Estate, Chennai, Tamil Nadu 600058, India.
Accepted 25 October, 2012
While carrying out the transient analysis, the major challenge is to provide accurate damping ratio data for higher modes as this is not reported. Hence an attempt is made to find out the damping ratios experimentally in this paper. Two approaches of experimental evaluation of damping ratios are discussed, for free and forced vibration, with four different materials namely: mild steel, aluminum, cast iron and plastics. For the first set, eleven cantilevers of uniform cross section with varying lengths are taken for evaluation. For the second set, fourteen components made of these materials used in air brake system of automobiles are also examined. For the free vibration, impact test is used to find the fundamental natural frequency and damping ratio. In forced vibration study, electro dynamic shaker is used to find the first three natural frequencies and damping ratios. Besides the above methods, natural frequencies are calculated analytically using finite element analysis (FEA). Based on the exhaustive experimental work carried out design guidelines on damping ratios for industrial problems are presented. Key words: Finite element method, experimental determination of damping ratios at higher modes for different materials.
INTRODUCTION One of the major problems encountered in transient analysis is the data needed on damping ratios corresponding to higher modes, when finite element method is used. It is well known that this depends on the material subjected to transient response and the natural frequency of the corresponding mode of vibration. This is the only method available to compute the damping matrix [C], even when one analyses transient vibration problems *Corresponding author. E-mail: [email protected].
Abbreviations: ([C], [K], [M]), Damping, stiffness, mass matrices of size (n*n); (B, L, T), width, length, thickness of the plate; E, Young‟s modulus; [X], eigen vector; (f1, f2, f3), natural frequencies Hz; x, amplitude; t, time; (α, β), mass and stiffness
multipliers; , Density; (η1, η
2), frequency ratios on two sides of
resonance; (ω1, ω2, ω3), natural frequencies rad/s; (ζ1, ζ2, ζ3), damping ratios; (S1, S2, S3), steel samples; (A1, A2, A3), aluminum samples; (C1, C2, C3), cast Iron samples; (P1, P2, P3), plastic samples; REV, relay valve; QRV, quick release valve; MTS, modular door system; BC, brake chamber.
using time integration scheme (Ramamurti, 2012). Basic requirement for the transient analysis is to get the damping ratios corresponding to the first few modes if the concept of Rayleigh damping is used in modal superposition technique.
Since damping matrix is expressed as a combination of stiffness and mass matrices, two damping ratios are needed, one corresponding to the fundamental mode and the other one corresponding to a higher mode. These two are obtained experimentally in this article to determine
the multipliers and . These transient vibrations are experienced by marine
structures subjected to severe impact due to floating ice bergs, rocket launchers during firing, machine tools like forging hammers and guillotine shears, inlet and delivery valves of compressors, brake pads of heavy duty vehicles during braking and space vehicles during launching.
Key researchers in the early era around 1950 like Ungar, Kerwin and Lazan addressed the damping problem. Companies like Bruel and Kjaer and LMS International collected considerable data, but they are not

Figure.1. Free vibration response
Figure 1. Free vibration response.
available in public domain. Besides most of them are not readily adaptable to modal super position technique. Standard packages like NASTRAN, ANSYS, ABAQUS and ADINA demonstrated Rayleigh damping concept through examples but did not spell out the procedure for computing the stiffness (β) and mass matrix multipliers (α). It is understandable since user manuals of these packages are not expected to provide design guidelines. They did not explain the basis of arriving at these coefficients. Obviously, these are not constants like acceleration due to gravity, but variables which depend on the material with which the vibrating member is fabricated and its first few natural frequencies.
There are not many papers on damping ratios of the first few modes of vibration reported in the last few years. Most experimental investigations are on vibration response of linear and non-linear systems (Bellette et al., 2008; Chow et al., 2005; Huang, 2005; Kuljamic et al., 2008; Mann et al., 2008; Issa et al., 2008; Li hen et al., 2008; Xiao et al., 2005; Zhang et al., 2004). There are a few experimental results on bodies surrounded by water (Grace et al., 2008; Li et al., 2010; Ramajayathilagam et al., 2004) COMPUTING DAMPING RATIOS
There are two ways of experimentally figuring out the damping present in a system, one by the free vibration record and another by the forced vibration method (√2 method). By the first, one can compute the damping ratio for the fundamental mode only while by the second method it is possible to obtain the damping ratios for the first few modes. Free vibration response when disturbed
It is well known, that any complicated system, when
Ramamurti et al. 115
disturbed, vibrates, response gradually decreases and, towards the last phase of decay, exhibits the response corresponding to the fundamental mode.
The response of a single degree freedom can be written as )sincos)((exp 121111 tctctx (1) This can be represented by the curve shown in Figure 1.
In this figure three successive amplitudes 1x , 2x , 3x are
separated by time difference t = 2π/ω1 (2) Ratio of successive amplitudes is given by
12
2
1 e
x
x (3)
hence,
2log2
1
x
x (4)
Logarithmic ratio of successive displacements is equal to 2πζ. By making use of the time period and successive amplitudes towards the dying phase of the multi degree freedom system one can compute ω1 and ζ1 of practical vibrating systems. Since these systems have very low damping ratios Equations (3) and (4) used in finite element methods are valid. Determination of ζ by √2 Method In the forced vibration method, the system is excited harmonically, at a chosen frequency and the system has the maximum response corresponding to a given natural frequency falling steeply on either side of this natural frequency. Shown in Figure 2, is a resonance zone of the frequency response curve of forced vibration. For a given natural frequency ωi, let the maximum displacement be xmax corresponding to a given natural frequency. Let the frequency ratios for xmax/√2 values on either side of this resonance be ω* and ω**. If the natural frequency under consideration is ωi, the frequency ratios η1and η2 be ω* / ωi
and ω** / ωi with the ratio ηm =1at the peak frequency. Let the damping ratio present in the system be ζ.
From the expression for forced vibration response [18], one can write,
(5)
21
1
2
1
2
1
222
2
(5)

116 J. Eng. Technol. Res
Figure.2. Forced vibration response
Figure 2. Forced vibration response.
Since ζ, for practical systems is <<1.It can be proved that
)6(
2
)( 21
(6)
where η1 and η2 being the two frequency ratios as shown in Figure 2.
This method is known as the √2 method. This forced vibration test is a very useful tool for computing the damping ratios of the first few modes even for multi degree freedom systems.
RAYLEIGH DAMPING
For the multi degree freedom system, the determination of damping matrix [C] is not easy. Since only [M] and [K] are available Rayleigh damping assumes that [C] can be expressed as a linear combination of [M] and [K]. It is expressed as
][][ KMC (7)
andare matrix multipliers to be determined. Since K
is expressed in N/mm and M in Ns2/mm it implies from
Equation (7) α must be in s -1
and β in s. If Equation (8) is pre multiplied by eigen vectors [X], and post multiplied by
[X]T, one gets
]][[][]][[][]][[ XKXXMXXCX TTT (8)
From the basic properties of eigen pairs (Ramamurti, 2012)
0 0
0 0
0 0
][]][[][ ,
1 0 0
0 1 0
0 0 1
]][[
2
3
2
2
2
1
2
XKXXMX TT
(9)
If [X]
T [C][X] = is expressed as [2 ζiωi] to
make it diagonal
and expanding Equation (9) one gets
2
2
222
2
111
2
2
2
mmm
(10)
Equation (10) indicates α and β are not constants, but matrix multipliers which depend on the first few damping ratios and the natural frequencies of the member analyzed. In this paper, forced vibration response is used for experimental determination of the first three natural frequencies and damping ratios. This approach became popular after the finite element method was successfully

used to solve problems in the area of dynamics with computational efficiency in mind.
RELEVANCE OF INVESTIGATION
It may appear, as if, “Computing Damping Ratios” and “Rayleigh Damping” are well known and are reported in most books. If one looks at the industrial scenario, the following may be observed. A marine steel structure experiences disturbance due to floating iceberg, probably once an hour, a multi barrel rocket launcher impact once in four seconds, a guillotine shear made of a steel housing every two seconds (in continuous mode of shearing of thick plates) and exhaust and inlet valves of a reciprocating compressor every 0.02 s (when the compressor runs at 3000 RPM). A typical case of two gear pairs in mesh provides two extremities of time duration, the first, a high speed pinion running at 3000 RPM every 0.02 s and the second, a girth gear running at 2 to 3 RPM every 30 s. All these disturbances are transients which completely die down before successive hits. With duration of disturbance varying very widely, the two parameters ζ and ω play a crucial role in the behavior of the vibrating member. They depend on the material, geometry and boundary conditions of the vibrating member.
If the damping is underestimated, the member receives hits before the influence of the previous hit disappears. If overestimated, the predictions negate what is being experienced. It is easy to compute the first few natural frequencies accurately analytically or experimentally, but damping ratios can be determined only experimentally. It is for this purpose this investigation is taken up for different materials commonly used in mechanical engineering.
PROCEDURE FOR INVESTIGATION
Impulse hammer
The hammer used excites the test structure with constant force over the frequency range of interest and produces an analog voltage pulse which is an exact representation of the input impulse (F.t) both in amplitude and phase. It uses an accelerometer of Low Impedance Voltage Mode (LIVM) which is designed to measure shock and vibration phenomena over a wide frequency range. It contains integral IC electronics that converts the high impedance signal generated by the piezo crystals to a low impedance voltage that can drive long cables with excellent noise immunity. These accelerometers utilize quartz and piezo ceramic crystals in compression and shear mode. The accelerometer is mounted on the test object at the position defined by the customer and the
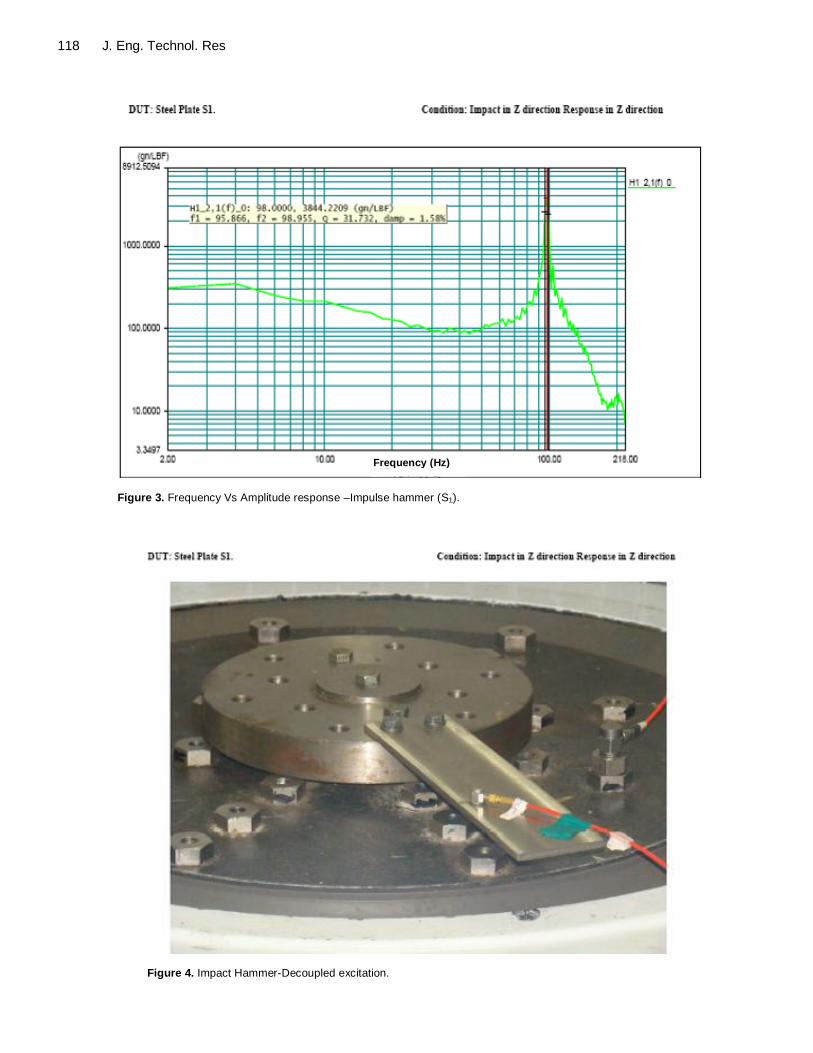
Ramamurti et al. 117 impact is given using Impact Hammer at the specified point and in specified direction and the data is collected using Focus Dynamic Signal Analyzer. Figure 4 shows the arrangement for this test and Figure 3 the response.
Forced vibration test
One of the major problems encountered in forced vibration test is the range of excitation available in the exciter. Mechanical double mass eccentric exciter produces pure sinusoidal excitations, but the range is limited up to 100 Hz. While heavy engineering units are having lower natural frequencies (in the range 5 to 100 Hz), components in automobiles like inlet and exhaust valves have natural frequencies as high as 18000 Hz. It is impossible to cover this wide range experimentally. In this investigation, a heavy duty electrodynamic exciter with a range up to 3500 Hz is used to collect meaningful data (Figures 5 and 6).
The vibration testing unit consists of a signal generator, a power amplifier and a vibration shaker. In addition to this, instrumentations like accelerometers, signal conditioners, charge amplifiers, Fast Fourier Transform (FFT) are also used.
Dynamic tests are performed with sinusoidal signal sweeping between the defined frequency range. The output of the signal generator is amplified in the power amplifier to a level sufficient to drive the vibration shaker. This vibration shaker converts this amplified signal to mechanical motion at the work table which transfers the same to the test samples. The mechanical motion at the table surface is sensed through the accelerometer. The electrical signal can be used for monitoring and feedback purposes to make the operation as a close loop. The acceleration level imposed on the specimen is measured and continuously compared with the program by the Digital signal controller. The difference between the command and the input signal is used to provide a continuous correction signal to the shaker, which causes this difference to minimum. Specifications of the experimental set up are shown in Table 1. Digital amplifier Model DSA 5K15, class D, Technology PWM, Output power 15 KVA (Suitable to drive shaker), Input power 415 V, 50 Hz, 3 phase, Frequency range DC to 3500 Hz. System control unit
Sinusoidal signal generator routes the path of signal towards the power amplifier. It can use its own signal or signal from the external source and thereafter to the shaker after amplifications.
118 J. Eng. Technol. Res
Figure.3. Frequency Vs Amplitude
response –Impulse hammer (S1)
Figure.4. Impact Hammer-
Decoupled excitation
Frequency (Hz)
Figure 3. Frequency Vs Amplitude response –Impulse hammer (S1).
Figure.3. Frequency Vs Amplitude
response –Impulse hammer (S1)
Figure.4. Impact Hammer-
Decoupled excitation
Figure 4. Impact Hammer-Decoupled excitation.

Figure 5. Vibration shaker.
Figure 6. Experimental setup-forced vibration for the first set.
Accelerometers Accelerometer of Model 2224C is a high precision Piezo electrical pickup over a wide frequency range. Nominal charge sensitivity 10 pC/g, Resonant frequency > 32000 Hz, mechanical shock limits 2000 „g‟, Sensing element shear ceramic , Transverse sensitivity < 3%, Mounting thread 10 to 32 coax type, Weight 15 g, Cable Microdot to Microdot 5 m length.
TESTS CONDUCTED Twenty five specimens have been chosen for the analysis. The first set of 11 specimens are cantilevers of
Ramamurti et al. 119 three varying lengths (Table 2) and four different materials (Mild Steel, Cast Iron, Aluminium and Plastics) of uniform cross section (Figure 4). It is well known that their first three natural frequencies in bending mode are decoupled. This program is expected to give controlled values of damping ratios. The other set of fourteen components constituting four materials (Mild Steel, Cast Iron, Aluminum and Plastics) (Ramamurti et al., 2010) are used in air brake system of automobiles and heavy vehicles. These details are shown in Table 3. Test specimens are shown in Figure 7. The first few mode of vibrations are coupled. These are also studied to find out how the complex systems behave.
Assumed ratio of values of E/ (taken from Hand books) are the same for steel and aluminium and hence computed natural frequencies of these two will be the same for geometrically identical plates.
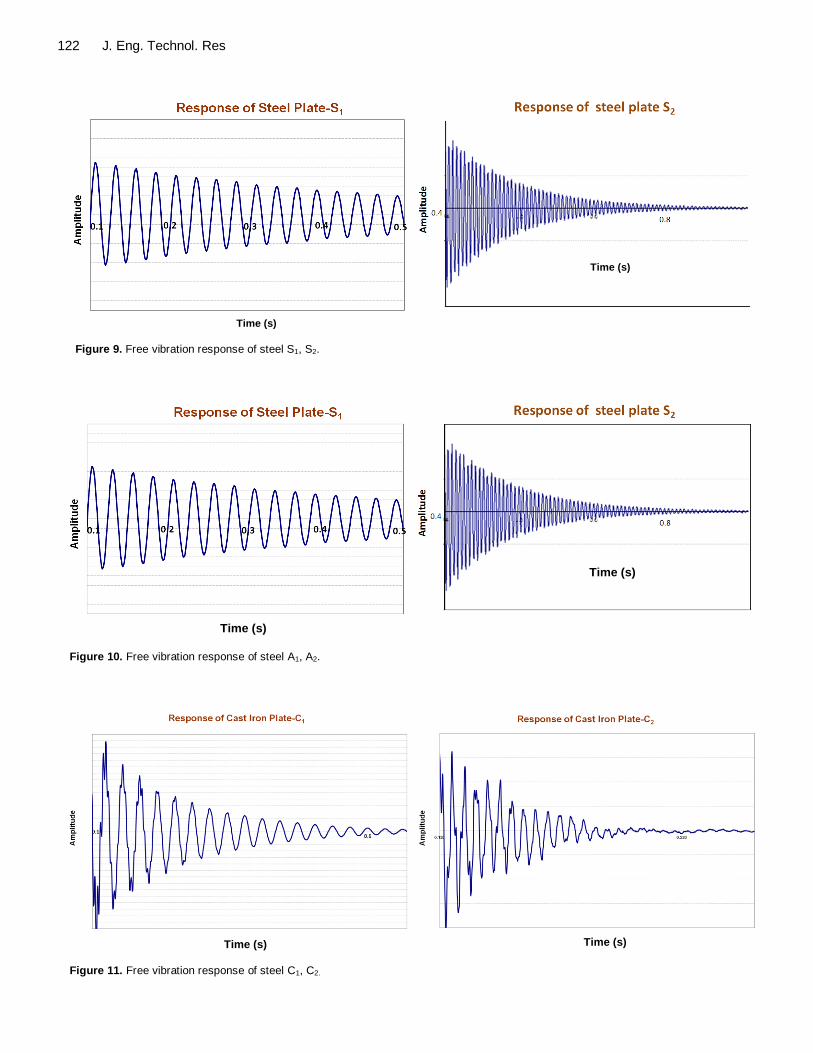
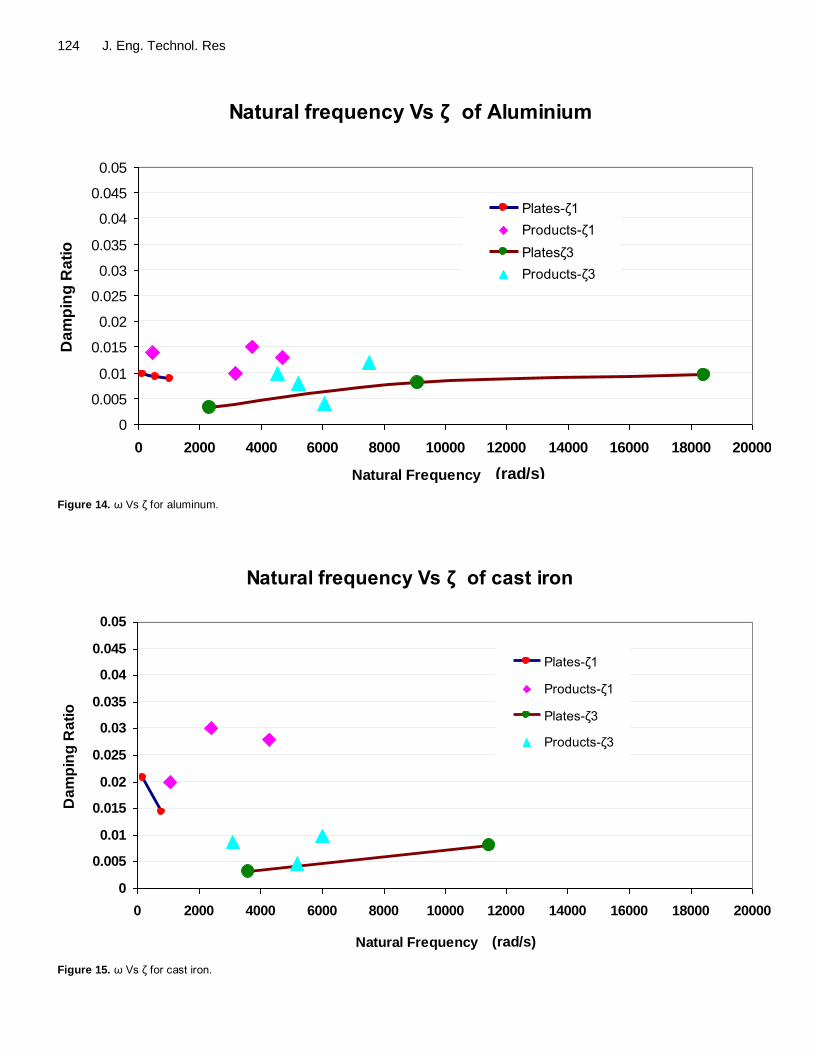
All the 25 specimens listed in Tables 2 and 3 are modeled using finite element method (ANSYS) and the first three natural frequencies are computed. Figure 8 shows the first three modes for S1 using finite element method. The specimens are subjected to free vibration test using impulse hammer. Figures 9, 10, 11 and12 show the free vibration records for steel, aluminum, cast iron and plastics. Forced vibration on electro dynamic exciter is also performed. The results on damping ratios are shown in Figures 13 to 16. Firm lines indicate the response for plates of uniform rectangular cross section (uncoupled modes) whereas dots represents products of manufacture of complicated shapes (coupled modes). RESULTS AND DISCUSSION
From the Tables 2 and 3, and Figures 13 to 16, the following observations have been summarized and are shown in Table 4
The plots of ω Vs ζ for the first and third modes are made available for the four materials investigated (Figures 13 to 16). ζ obtained by two approaches were compared. Damping ratios ζ1 for all the specimens computed by using logarithmic decrement approach and Tables 2 and 3 by using the √2 method with electro dynamic exciter agree well. (i) ζ values of these materials are in the following order aluminum < mild steel < cast iron < plastics. (ii) Plastics exhibit a maximum value of ζ1 4.1% whereas for mild steel it does not exceed 2.9%. (iii) Values of ζ3 are less than the corresponding values of ζ1, for most of the specimens tested (Tables 1 and 2). INFLUENCE ON DYNAMIC STRESS As per international standards, for continuous operation, the threshold of vibration disturbance is of the order of 2 mm/s. It is presumed that very severe vibration due to

120 J. Eng. Technol. Res
Table 1. Specifications of shaker and subsystem
Subsystem Model Shaker SEV 150 Electro dynamic shaker SEV 150 Rated force 1500 Kgf (Peak SINE) Digital power amplifier DSA 5K15 Operating frequency range 1 Hz to 3500 Hz Digital system interface SCU 011C Stroke 40 mm Piezo electric accelerometers 2224 C (2 nos) Acceleration bare table 80 ‟g‟ „SINE” S/W package SVC 2205-FW Maximum velocity 1200 m/s Moving Platform diameter 240 mm
Table 2. Details of standard plates investigated (set-1)
Plates
L
mm
B
mm
T
mm
Finite element method
Free vibration method (Experimental)
Forced vibration method
(Experimental)
ω1 ω3 ω1 ζ1 ω1 ω3 ζ1 ζ3
S1 420 50 4 132 2262 138 0.0145 128 2284 0.0150 0.0030
S2 220 50 4 522 9117 540 0.0115 548 9192 0.0130 0.0064
S3 220 50 8 1043 18234 993 0.0104 1087 19578 0.0110 0.0100
A1 420 50 4 132 2262 138 0.0085 130 2314 0.0096 0.0031
A2 220 50 4 522 9117 528 0.0200 547 9079 0.0097 0.0090
A3 220 50 8 1043 18234 1005 0.0180 1030 18414 0.0088 0.0090
C1 420 50 8 201 3569 214 0.0300 196 3625 0.0208 0.0031
C2 220 50 8 817 11520 754 0.0360 804 11451 0.0144 0.0080
P1 375 50 4 50 880 63 0.0320 63 921 0.0300 0.0260
P2 185 50 4 239 4191 264 0.0360 283 4659 0.0330 0.0450
P3 220 50 8 371 5623 415 0.0230 425 5329 0.0177 0.0180
Table 3. Details of components tested (Set-2)
Components Material
Finite Element method
Free vibration method
(Experimental)
Forced vibration method
(Experimental)
ω1 ω3 ω1 ζ1 ω1 ω3 ζ1 ζ3
RE 6 Steel 477 1903 483 0.0270 444 1717 0.0290 0.0110
QRV Steel 1149 4090 852 0.0200 784 3596 0.0220 0.0160
BC type 12 Steel 1746 6729 2418 0.0290 2500 4481 0.0290 0.0080
MTS Steel 3623 8664 3443 0.0270 3237 7546 0.0270 0.0130
Fixture Steel 3631 9710 3321 0.0140 3257 9555 0.0120 0.0110
RE6 Al 477 4803 483 0.0140 440 4506 0.0140 0.0100
QRV Al 5400 11828 6063 0.0100 6195 10687 0.0100 0.0040
MTS Al 3623 8664 3443 0.0190 3670 7516 0.0150 0.0120
Flange (compressor) Al 5510 10499 4423 0.0180 4668 10675 0.0130 0.0080
Compressor (over hang) CI 2022 3700 2150 0.0240 2023 4668 0.0200 0.0087
Compressor CI 5015 7320 4724 0.0370 4324 6014 0.0330 0.0046
Compressor CI 5510 10499 4461 0.0290 4706 10710 0.0280 0.0100
QRV Plastics 823 4012 911 0.0440 924 3522 0.0410 0.0035
MTS Plastics 3623 8664 3443 0.0380 3675 7053 0.0400 0.0030
transients acting for a very short period of time will not exceed 300 mm/s. The ratio of fall in amplitude for
transient vibration is of the order 150 (300/2). Fall in amplitude for every oscillation for viscous damping is e
2πζ.

Ramamurti et al. 121
dsdgds
Hg ddwe g ffeethth
Steel
RE6 Valve BC Type 12 Fixture MTS
Aluminum
RE6 Valve QRV Flange-Compressor MTS
Cast Iron
Comp-Over hanged Flange compressor Compressor
Plastics
MTS QRV
khgf
Figure 7. Test specimens.
dgzre
hx
1st natural frequency is 132 rad/sec 2
nd natural frequency is 522 rad/sec 3
rd natural frequency is 1043 rad/sec
Figure.8.Finite element analysis of S1 along with its mode shapes
Figure.9.Free vibration response of steel S1, S2
Figure.10.Free vibration response of steel A1, A2
Figure 8. Finite element analysis of S1 along with its mode shape.
122 J. Eng. Technol. Res
Figure.9.Free vibration response of steel S1, S2
Time (s)
Time (s)
Figure 9. Free vibration response of steel S1, S2.
1st natural frequency is 132
rad/sec
2nd
natural frequency is
522 rad/sec
3rd
natural frequency is
1043 rad/sec
Figure.8.Finite element analysis of S1 along with its mode shapes
Time (s)
Time (s)
Time (s)
Figure 10. Free vibration response of steel A1, A2.
Figure.11.Free vibration response of Cast iron C1, C2,
Figure.12.Free vibration response of plastics P1, P2
Time (s) Time (s)
Figure 11. Free vibration response of steel C1, C2.

Ramamurti et al. 123
Figure.11.Free vibration response of Cast iron C1, C2,
Figure.12.Free vibration response of plastics P1, P2
Time (s) Time (s) Figure 12. Free vibration response of plastics P1, P2.
Natural frequency Vs ζ of steel
0
0.005
0.01
0.015
0.02
0.025
0.03
0.035
0.04
0.045
0.05
0 2000 4000 6000 8000 10000 12000 14000 16000 18000 20000
Natural Frequency (rad/sec)
Da
mp
ing
Ra
tio
PLATE-ζ1
PRODUCTS-ζ1
"PLATE-ζ3"
PRODUCTS-ζ3
(rad/s) Figure 13. ω Vs ζ for steel.
Hence the ratio of fall in amplitude in one second (e
2πζ
)ω/2π
= eζω
. If eζω
is to have a maximum value of 150, then ζω should be of the order of 5 (e
5 ~ 150).
To study the effect of damping ratio, as an example delivery valve stopper used in reciprocating air compressor is taken for investigation. This is very light with very high fundamental natural frequency of 18000 Hz.
Figure 17 shows the delivery valve stopper sub assembly with a shoulder held by helical spring. Figure
18 shows the stopper alone for the delivery valve (Ramamurti et al., 2010). This experiences, dynamic stress due to movement of ring valve which discharges air from the compressor. Since this valve stopper is subjected to repetitive shock pulses when the force acts for a very short period of time Figure 19, transient dynamic analysis is carried out using mode superposition technique.
In order to know the influence of damping ratio on the dynamic response of the valve stopper, four cases are
124 J. Eng. Technol. Res
Natural frequency Vs ζ of Aluminium
0
0.005
0.01
0.015
0.02
0.025
0.03
0.035
0.04
0.045
0.05
0 2000 4000 6000 8000 10000 12000 14000 16000 18000 20000
Natural Frequency (rad/sec)
Da
mp
ing
Ra
tio
Plates-ζ1
Products-ζ1
Platesζ3
Products-ζ3
(rad/s)
Figure 14. ω Vs ζ for aluminum.
Natural frequency Vs ζ of cast iron
0
0.005
0.01
0.015
0.02
0.025
0.03
0.035
0.04
0.045
0.05
0 2000 4000 6000 8000 10000 12000 14000 16000 18000 20000
Natural Frequency (rad/sec)
Da
mp
ing
Ra
tio
Plates-ζ1
Products-ζ1
Plates-ζ3
Products-ζ3
(rad/s)
Figure 15. ω Vs ζ for cast iron.

Ramamurti et al. 125
Natural frequency Vs ζ of plastics
0
0.005
0.01
0.015
0.02
0.025
0.03
0.035
0.04
0.045
0.05
0 2000 4000 6000 8000 10000 12000 14000 16000 18000 20000
Natural Frequency (rad/sec)
Da
mp
ing
Ra
tio
Plates-ζ1
Products-ζ1
Plates-ζ3
Products-ζ3
Natural Frequency (rad/s) Figure 16. ω Vs ζ for plastics.
Table 4. ζ and f of different materials.
Material f 1 (Hz) ζ1 f 3 (Hz) ζ3
Steel 21 to 518 0.011 to 0.029 273 to 1521 0.003 to 0.016
Aluminum 21 to 985 0.01 to 0.015 368 to 2930 0.003 to 0.012
Cast Iron 31 to 748 0.014 to 0.033 576 to 1822 0.003 to 0.01
Plastics 10 to 584 0.017 to 0.041 146 to 1122 0.003 to 0.045
Figure.17. Delivery valve assembly in
the cylinder head.
Figure. 18.Valve stopper.
1.8 (mm)
Figure 17. Delivery valve assembly in the cylinder head.
Figure.17. Delivery valve assembly in
the cylinder head.
Figure. 18.Valve stopper.
Figure 18. Valve stopper.

126 J. Eng. Technol. Res
Figure.19.Shock pulse as input to delivery valve
Time (s)
Figure 19. Shock pulse as input to delivery valve.
Table 5. Dynamic response of valve stopper.
Case ζ1 ζ3 Maximum dynamic stress (MPa) Time of decay(s)
1 0.015 0.01 40.70 1.5 e-3
2 0.015 0.02 40.50 1.4 e-3
3 0.010 0.01 40.83 2.04 e-3
4 0.010 0.02 40.60 2.01 e-3
taken for the analysis By varying ζ1 and ζ3 obtained from the experimental findings transient dynamic analysis is carried out. For the first two cases, ζ1 is assumed to be 0.015, ζ3 is varied with 0.01 and 0.02. For the second set ζ1 is assumed to be 0.01 and ζ3 is varied with value 0.01 and 0.02.The dynamic stress obtained in these cases is shown in Figure 20 (i) to (iv).
When ζ1 is kept constant, the effect of ζ3 on dynamic stress is negligibly small and the time of decay (fall in ratio of amplitude around 150) is also small. When ζ3 is kept constant at 0.01 if ζ1 is altered from 0.01 to 0.015, the maximum value of dynamic stress varies from 40.83 to 40.7 MPa. When ζ3 is 0.02 the dynamic stress varies from 40.6 to 40.5. With ζ1 0.01 the dynamic stresses dies down at 2.01e
-3 s whereas it takes 1.4e
-3 s for ζ1 of 0.015
(Table 5). Conclusion Experimental evaluation has been carried out to find out the damping ratios for free and forced vibration using four different materials. Besides the above, the natural frequencies have been calculated analytically using finite element analysis (FEA). The natural frequency values obtained using the analytical method, free and forced
vibration methods have a fairly good agreement with each other for both standard plates investigated and components tested. It was observed that for all the four materials covered in this paper Figures (13 to 16), ζ1 has never exceeded 4.5% (mostly less than 2%) Table 4. The value of ζ1 obtained by free vibration method and √2 method agree well. Since the natural frequencies cover a wide range of values in industrial parlance, the damping ratios ζ1 and ζ3 obtained give a very good database for a designer using steel, aluminium, cast iron and plastics. As an example, in “Influence on Dynamic Stress”, axis symmetric element is used for modeling a valve stopper transient vibration study. Figures 13 to 16 provide good data base for computing ζ1 and ζ3. After computing the first few natural frequencies of a member which is to be analyzed (eigen pairs) these damping ratio values are to be used in modal super position technique. “Influence on Dynamic Stress” also indicates that the effect of damping ratio ζ3 on dynamic stress is negligible whereas ζ1 has some influence. However, it is premature to conclude that the change in damping ratio has marginal influence on the magnitude of dynamic stress. Since Equation 8 is the basic relationship connecting the damping matrix [C] with stiffness and mass matrices [K] and [M], in our opinion, the picture is likely to change if other types of finite elements are used for modeling.

Ramamurti et al. 127
Figure.20. Dynamic stress plot
Time (s)
Time (s)
Time (s)
Time (s)
Figure 20. Dynamic stress plot.

128 J. Eng. Technol. Res ACKNOWLEDGEMENT The authors gratefully acknowledge the support given by Messer‟s WABCO India Limited, Chennai in carrying out this investigation and permitting publication of this article in a journal. REFERENCES
Bellette PA, Meehan PA, Daniel WJK (2008). Effect of variable pass speed on wear type corrugation growth. J. Sound Vib. 314(3-5):616-634
Chow F, Lu W (2005). Experimental observation of nonlinear vibration in a rub impact rotor system. J. Sound Vib. 283(3-5):621-643.
Grace IF, Ibrahim RA (2008). Modelling and analysis of ship roll
oscillation intensity with stationary ice berg. Proc. IMechE, Part C:J. Mech. Eng. Sci. 222(C10):1873-1884
Huang CH (2005).Transverse vibration analysis and measurement for
the Piezo ceramic annular plate with different boundary conditions. J. Sound Vib. 283:655-683.
Issa J, Mukherjee R, Diaz AR, Shaw SW (2008). Modal disparity and
its experimental verification. J. Sound Vib. 311:465-1475. Kuljamic E, Sorting M, Totoos G (2008). Multisensor approaches for
chatter detection in milling. J. Sound Vib. 312(4-5):622-693.
Li hen Z, Zhengjia He, Wang ZY, Xue Y (2008). Customized wavelet
devices using intra and inter scale dependency for bearing fault detection. J. Sound Vib. 313:342-359
Li LJ, Jiang WK, Ai YH (2010). Experimental study of deformation and shock damage of cylindrical shell strut subjected to under water explosion. Proc. IMechE, Part C: J. Mech. Eng. Sci. 224(C11):2505-
2514. Mann BP, Liu J, Hazra SS (2008). Measurement of nonlinearity
interpreted as material behavior in dynamic nano indentation. J.
Sound Vib. 311(3-5):1358-1370. Ramajayathilagam K, Vendhan CP (2004). Deformation and rupture of
thin wave rectangular plate subjected to under water shock. J. Impact
Eng. 30:699-719. Ramamurti V (2012). Finite Element Method in Machine Design. Alpha
Sciences International, London.
Ramamurti V, Sridhar S, Mithun S, Kumaravel B (2010). Transient dynamic analysis of valve stoppers used in reciprocating air compressor. Proc. INSA 76(3):119-128.
Xiao L, Cox TX, Aris UR (2005). Active diffuser measurement, some prototypes and 2D measurements. J. Sound Vib. 285:321-339.
Zhang D, Engeda A, Hardin JR, Aungier RH (2004). Experimental study
of steam turbine control valves. Proc. IMechE, Part C: J. Mech. Eng. Sci. 218(C2):493-508.