danamon ppt template · recoveries as well as on streamlining the network ... remain adequate to...
TRANSCRIPT

PT Bank Danamon Indonesia Tbk terdaftar dan diawasi oleh OJK
A n a l y s t B r i e f i n g
F Y 2 0 1 7 F i n a n c i a l R e s u l t s
Jakarta, 12 February 2018

• Excluding micro loans, total portfolio including trade finance grew 5% YoY
• SME and Consumer Mortgage loan portfolios increased by 10% and 36% YoY, respectively.
Enterprise Banking loans grew 5% QoQ
• ADMF’s 2W new financing amount grew by 5% in FY17 compared to a decline of 2% in FY16.
Similarly 4W new financing amount increased by 6% in FY17 vs. a 3% growth in the previous year
• CASA ratio in FY17 stood at 48.3%, a 230 bps increase from the prior year level
• NPL amount declined by 9% YoY to Rp3.4 tn. NPL ratio improved to 2.8% from 3.1% in FY16
• Cost of credit (CoC) amount decreased by 20% to Rp3.5 tn. CoC ratio improved from 3.5% in FY16
to 2.8% in FY 2017
• Net interest income excluding Micro loans increased 7% YoY
• Risk-Adjusted NIM moved up from 5.4% last year to 6.5%, due to lower CoC & improved funding
• NPAT grew by 38% to Rp3.7 tn on the back of higher operating profit
• ROA improved by 60 bps to 2.1% while ROE also increased by 250 bps to 10.5%
1
FY 2017 H i gh l i gh t : D i ver s i f ied por t fo l i o re su l ted in
improved R i sk -Adjus ted N IM and 38% NPAT g rowth
Asset and
Liabilities
Asset
Quality
Profitability

2
FY 2017 Ba lance Sheet H i gh l i ght s
In Rp billion FY16 FY17 YoY 1Q17 2Q17 3Q17 4Q17 QoQ
Total Assets 174,437 178,257 2% 171,132 176,136 173,674 178,257 3%
Total Loan Portfolio and Trade Finance1) 127,310 129,724 2% 126,383 128,340 126,883 129,724 3%
Total Loan Portfolio and Trade Finance1)
excl. Micro 117,125 122,971 5% 116,972 119,783 119,181 122,971 3%
Government Bonds 9,563 10,911 14% 7,504 6,722 9,163 10,911 19%
Total Funding 126,224 125,702 0% 121,758 126,445 121,023 125,702 4%
CASA 48,536 50,501 4% 45,118 46,695 47,762 50,501 6%
Time deposits 56,955 54,144 -5% 55,636 58,770 52,687 54,144 3%
Borrowings and LT. Funding 20,733 21,057 2% 21,004 20,980 20,574 21,057 2%
Equity 35,942 38,660 8% 38,702 37,096 37,209 38,660 4%
1) Trade Finance includes related marketable securities

3
FY 2017 Income S ta tement
In Rp billion FY16 FY17 YoY 1Q17 2Q17 3Q17 4Q17 QoQ
Net Interest Income 13,793 14,170 3% 3,550 3,508 3,523 3,589 2%
Net Interest Income excl. micro 12,402 13,238 7% 3,263 3,271 3,299 3,405 3%
Non Interest Income(1) 3,913 3,489 -11% 851 867 889 882 -1%
Operating Income 17,706 17,659 0% 4,401 4,375 4,412 4,472 1%
Operating Expenses 8,632 8,646 0% 2,092 2,122 2,176 2,256 4%
PPOP(2) 9,074 9,014 -1% 2,309 2,253 2,236 2,216 -1%
Cost of Credit 4,358 3,466 -21% 831 859 818 957 17%
Operating Profit 4,716 5,548 18% 1,477 1,394 1,418 1,259 -11%
Net Restructuring Cost 260 206 -21% 0 0 0 206 100%
NPBT 4,456 5,342 20% 1,477 1,393 1,418 1,053 -25%
NPAT 2,669 3,682 38% 1,050 989 995 648 -35%
1) Consist of fee income of Rp3,513 bn vs Rp 3,842 bn in FY 2016 and other non-interest income
2) Pre-Provision Operating profit

4
FY 2017 Key F inanc ia l Ra t io s
In % FY16 FY17 YoY 1Q17 2Q17 3Q17 4Q17 QoQ
NIM 8.9 9.3 0.4 9.4 9.2 9.2 9.3 0.1
CoC 3.5 2.8 0.7 2.7 2.8 2.6 3.1 (0.5)
Risk-adjusted NIM 5.4 6.5 1.1 6.7 6.4 6.6 6.2 (0.4)
Cost to Income 48.8 49.0 (0.2) 47.5 48.5 49.3 50.5 (1.1)
CASA Ratio 46.0 48.3 2.3 44.8 44.3 47.5 48.3 0.7
Regulatory LFR 91.0 93.3 2.3 92.8 89.6 93.8 93.3 (0.5)
Consolidated LFR1) 96.6 98.8 2.2 98.8 96.1 100.2 98.8 (1.4)
NPL Gross 3.1 2.8 0.3 3.2 3.2 3.3 2.8 0.5
NPL Gross, including Trade
Finance2) 2.9 2.6 0.3 3.1 3.0 3.2 2.6 0.5
Loan Loss Coverage (LLC) 117.7 119.2 1.5 119.1 119.2 116.6 119.2 2.6
ROAA 1.5 2.1 0.6 2.4 2.3 2.3 1.5 (0.8)
ROAE 8.0 10.5 2.5 12.1 11.5 11.2 7.2 (4.0)
CAR – Consolidated 20.9 22.1 1.2 21.8 21.5 22.3 22.0 (0.3)
1) Consolidated including Adira Finance structured funding
2) Trade finance includes related marketable securities

5
Turn -a round in M ic ro bank ing per formance y ie lded
fu r ther ups ide fo r the Bank
Consolidated Financials
With SEMM
Consolidated Financials
If without SEMM*
FY16 FY17 YoY FY16 FY17 YoY
NIM (%) 8.9 9.3 0.4 8.9 9.3 0.4
Cost of Credit (%) 3.5 2.8 0.8 2.4 2.3 0.1
Cost-to-Income Ratio (%) 48.8 49.0 (0.2) 45.9 46.7 (0.7)
NPAT (Rp bn) 2,669 3,682 38% 3,320 3,824 15%
ROAE (%) 8.0 10.5 2.5 10.8 11.5 0.7
Micro Banking Update
> Micro banking will continue to focus on improving credit quality, collections, and
recoveries as well as on streamlining the network
* Opex reduction are based on SEMM direct cost only

Regulatory LFR* (%) – Liquidity has been stable
LDR (%) by BUKU – BUKU 3 Banks posted the highest LDR
• CASA to consolidated funding continued to
improved on the back of higher granular saving
account (Danamon Lebih).
*) Loan to Funding Ratio (“LFR”) calculation is as stipulated in BI regulation No. 17 / 11 / PBI / 2015 dated 25 June 2015 effective in
August 2015.
S tab le l i qu id i ty coup led w i th improv ing fund ing m ix
Borrowings
TD
CASA
4Q17
126
17%
43%
40%
122
17%
46%
37%
4Q16
126
16%
45%
38%
3Q17
121
17%
44%
39%
2Q17
126
17%
46%
37%
1Q17
Consolidated Funding (Rp tn, %) – Increase in CASA ratio
98.8%100.2%96.1%98.8%96.6%
Consolidated LFR
93.389.692.891.0 93.8
4Q173Q172Q171Q174Q16
LFR
92.492.591.791.9 91.6
Ave Daily
90.786.796.092.4
84.8 89.086.196.0
83.976.3
BUKU 4 IndustryBUKU 3BUKU 1 BUKU 2
6
Nov-17
Nov-16

Capital Adequacy Ratio (%)
% 4Q16 1Q17 2Q17 3Q17 4Q17
CAR w/ Credit
Risk26.9 28.1 27.6 28.6 28.2
Market Risk
Charge0.1 0.1 0.1 0.1 0.1
Operational
Risk Charge6.0 6.2 6.0 6.3 6.1
CAR
Consolidated20.9 21.8 21.5 22.3 22.1
Tier 1 and Tier 2 Consolidated Capital Ratio (%)
Cap i ta l s t ruc ture rema ins s t rong
Market and Operational Risk Charges (%)
• Danamon’s capital level and internal capital
generation remain strong.
• The capital level is significantly above the minimum
regulatory requirement.
• Even after considering the potential impact of IFRS 9
implementation, Danamon’s capital level would
remain adequate to support growth.
22.321.521.820.9 22.1
4Q173Q172Q171Q174Q16
23.223.823.223.222.3
Bank OnlyConsolidated
20.9 21.0 20.7 21.5 21.3
4Q17
22.1
0.8
3Q17
22.3
0.8
2Q17
21.5
0.8
1Q17
21.8
0.8
4Q16
21.7
0.8
Tier 1 CapitalTier 2 Capital
7
8
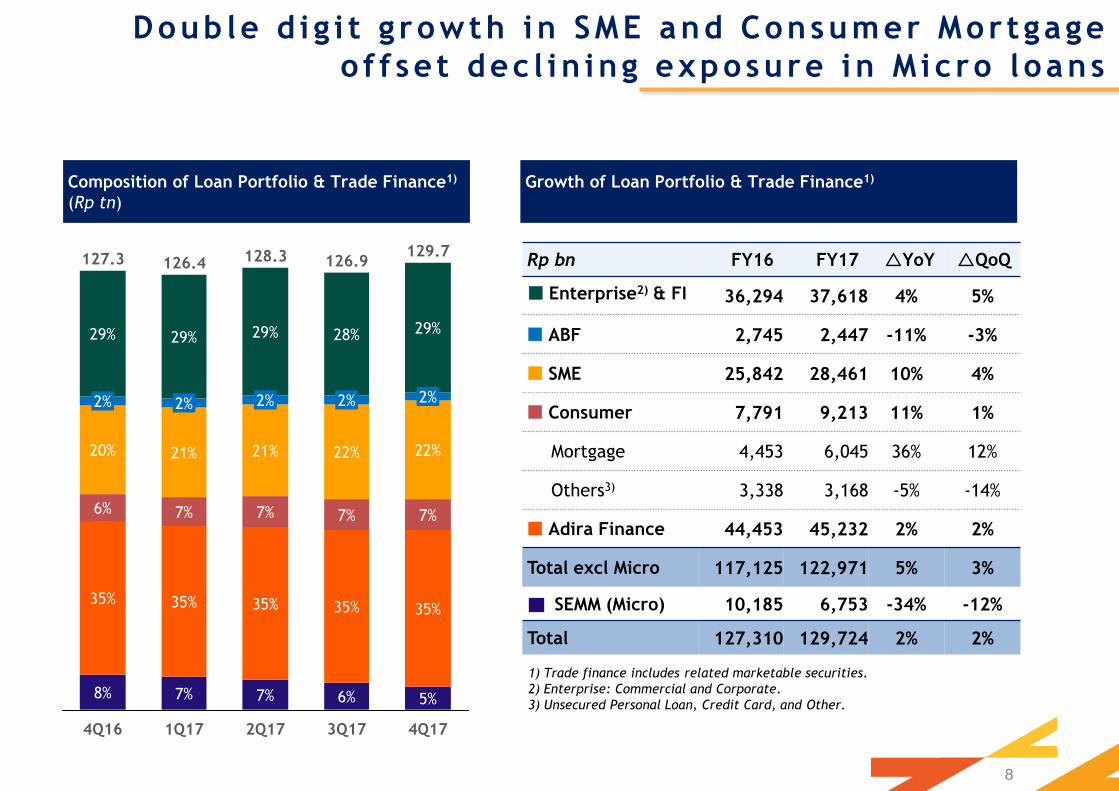
Doub le d i g i t g rowth in SME and Consumer Mor tgage
o f f se t dec l in ing exposure in M ic ro l oans
Rp bn FY16 FY17 YoY QoQ
Enterprise2) & FI 36,294 37,618 4% 5%
ABF 2,745 2,447 -11% -3%
SME 25,842 28,461 10% 4%
Consumer 7,791 9,213 11% 1%
Mortgage 4,453 6,045 36% 12%
Others3) 3,338 3,168 -5% -14%
Adira Finance 44,453 45,232 2% 2%
Total excl Micro 117,125 122,971 5% 3%
SEMM (Micro) 10,185 6,753 -34% -12%
Total 127,310 129,724 2% 2%
Composition of Loan Portfolio & Trade Finance1)
(Rp tn)
Growth of Loan Portfolio & Trade Finance1)
4Q173Q17
126.9
28%
2%
22%
7%
35%
6%
2Q17
128.3
2%
29%29%
2%
21%
7%
35%
7%
1Q17
126.4
29%
2%
21%
7%
35%
7%
4Q16
127.3
29%
2%
20%
6%
35%
8% 5%
129.7
35%
7%
22%
1) Trade finance includes related marketable securities.
2) Enterprise: Commercial and Corporate.
3) Unsecured Personal Loan, Credit Card, and Other.

Rp bn FY16 FY17 YoY QoQ
2W auto loans 21,275 21,340 0% 1%
4W auto loans 22,761 23,252 2% 3%
White goods and
others 417 640 14% 2%
Adira Finance 44,453 45,232 2% 2%
-9%-8%
-5%
-3%
-5%-8%
-7%
-9%
0%
-1%
FY16 1Q17 1H17 9M17 FY17
ADMF 2W Industry 2W
ADMF units New Financing vs. Industry
(% YoY growth based on cumulative YTD)
ADMF Outstanding Loan
9
ADMF’s new 2W & 4W f inanc ing amount g rew by 5% &
6% respect i ve ly
-1%
5%0%
2% 1%
5% 6%
0%
-1% -2%
FY16 1Q17 1H17 9M17 FY17
ADMF 4W Industry 4W
-2%
1%
5%7%
5%
3%
8%5%
8%6%
FY16 1Q17 1H17 9M17 FY17
ADMF 2W ADMF 4W
ADMF New Financing amount
(% YoY growth)

Risk-Adjusted NIM
(%)
R i sk ad jus ted N IM s teady desp i te sh i f t i ng away f rom
Micro
Composition of Loan Portfolio & Trade Finance
(Rp tn)
24%
4Q16
127.3
75%
25%
4Q17
129.8
78%
22%
3Q17
126.9
77%
23%
2Q17
128.3
76%
24%
1Q17
126.4
76%
Lower Yield (Non-Mass Market + 4W)
Higher Yield (SEMM +2W+ Durable goods)
6.1 6.7 6.4 6.6 6.5
3.3 2.8 2.7 2.82.7
4Q16
9.4 9.3
4Q17
9.3
3Q17
9.4
2Q171Q17
9.2
YTD Risk Adj NIMYTD CoC
10

BDI’s NPL
9% YoY decreaseNPL amount
(Rp bn)
and
Composition
(% of Total NPL)
2.93.13.13.2
2.9
NPL ra t i o improved 30 bps YoY to 2 .8%
128,135
132,984
133,144
133,276
132,864
Source : Industry NPL based on SPI as of October 2017.
9.9 10.514.2
3.1
3.3
12.1 11.0
3.2
3.2
2.8
4Q173Q172Q171Q174Q16
BDI-SM
BDI NPLLoan
Collectability
(% of Total
Loans)
Industry’s NPL
4% increase
Industry’s NPL Ratio
27%
5%
25%
4Q17
3,412
28%
23%
6%
3Q17
44%
3,987
43%
2Q17
3,871
47%
5%24%
24%
1Q17
3,844
45%
5%26%
24%
4Q16
3,735
49%
6%23%
22%
Mass Market
SME
Consumer
Enterprise & FI
11

BDI Loans by Sector (% of total loans)
BDI NPL by Sector (%)
Industry Loans by Sector (% of total loans)
Industry NPL by Sector (%)
Source: SPI Nov 2017
T h e m a j o r i t y o f p o r t f o l i o i s i n t h e t r a d i n g , p r o c e s s i n g a n d h o u s e h o l d s e c t o r s w i t h l o w e x p o s u r e i n m i n i n g
3.04.9
6.53.94.7
17.6
9.1
19.4
2.3
5.56.8
3.84.7
17.2
9.3
19.0
MiningConstructionAgriTransportRE, Rental
& Svcs
ProccesingMortgageTrading
Nov-17Nov-16
7.4
4.3
1.9
4.7
2.83.9
2.8
4.8
7.2
3.9
1.5
4.2
3.03.22.9
4.3
MiningConstructionAgriTransportRE, Rental
& Svcs
ProcessingMortgageTrading
Nov-17Nov-16
1.32.24.54.75.6
16.216.0
38.1
1.12.54.74.95.8
17.317.2
36.3
MiningConstructionAgriTransportRE, Rental
& Svcs
ProccesingHouseholdTrading
Dec-17Dec-16
2.8
1.82.2
3.4
1.92.8
4.2
2.22.8
2.0
3.4
0.71.31.5
5.1
Mining
26.6
ConstructionAgriTransportRE, Rental
& Svcs
ProccesingHouseholdTrading
Dec-17Dec-16
12
• NPL ratio in Processing segment increased by 100 bps due to customers in the steel industry
• NPL ratio in Transport segment worsened by 90 bps due to customers in vessel related services

4Q17
957
65%
35%
3Q17
818
65%
35%
2Q17
859
67%
33%
1Q17
831
68%
32%
4Q16
997
77%
23%
CoC ra t io and Res t ruc tured Loans dec l ined YoY
Restructured
Loans(% of Total Loans
and Rp bn)
8% YoY
decrease
YTD CoC as % of
avg loan
Cost of Credit(% of Avg Loans and
Rp bn)
3,1513,4163,4443,2933,451
2.52.82.82.72.8
3Q17 4Q172Q171Q174Q16
Restructured Loan
% of total loan
2.82.72.72.73.5
13
Non Mass Market
Mass Market

Non-Credit Related Fee Income (Rp bn)
Tota l fee dec l ined ma in ly due to c red i t re l a ted fees .
Bancas surance fee g rew 17%
315
535
295 304
495
345
Bancassurance
-4%
-7%
+17%
Cash Mgmt & OthersGeneral Insurance
(Net Underwriting
Profit)
FY17
FY16
Fee Income (Rp bn)
3,842
263
1,146
2,433
3,513
287
1,144
2,082
Total Fee
Income
+9%
0%
-9%
-14%
TreasuryNon-Credit
Related
Fee Income
Credit Related
Fee Income
FY16
FY17
14

Investor Relations
PT Bank Danamon Indonesia, TbkMenara Bank Danamon, 16th Floor
Jl. H.R. Rasuna Said Kav. C-10
Setiabudi - Kuningan, Jakarta Selatan 12940
Phone: +62 21 8064 5000
Email: [email protected]
THANK YOU