danish meteorological institute - dmi.dk meteorological institute ... monthly statistics generated...
TRANSCRIPT

Danish Meteorological Institute Ministry of Transport
www.dmi.dk/dmi/tr04-25 page 1 of 44
Technical Report 04-25
Carburettor Icing-probability
Monthly statistics generated from radiosonde data (WMO st. no. 06181, Jægersborg) using the "New Carburettor Icing-probability Chart"
Mette F. Nielsen, Kim Sarup, Mikael Scharling & Søren Brodersen
Copenhagen 2004

Danish Meteorological Institute Technical Report 04-25
www.dmi.dk/dmi/tr04-25 page 2 of 44
Colophon Serial title: Technical Report 04-25 Title: Carburettor Icing-probability Subtitle: Monthly statistics generated from radiosonde data (WMO st. no. 06181, Jægersborg) using the "New Carburettor Icing-probability Chart" Author(s): Mette F. Nielsen, Kim Sarup, Mikael Scharling & Søren Brodersen Other contributors : Front page photo by Birgitte Knudsen Responsible institution: Danish Meteorological Institute, Ministry of Transport Language: English Keywords: Carburettor icing; radiosonde data; temperature; dew point temperature; dew point depression. Url: www.dmi.dk/dmi/tr04-25 ISSN: 1399-1388 Version: November 2004 Website: www.dmi.dk Copyright: Danish Meteorological Institute

Danish Meteorological Institute Technical Report 04-25
www.dmi.dk/dmi/tr04-25 page 3 of 44
Content: Abstract ................................................................................................................................................ 4 Introduction.......................................................................................................................................... 5 Carburettor icing .................................................................................................................................. 5 Data ...................................................................................................................................................... 6 Methods................................................................................................................................................ 7 Results .................................................................................................................................................. 8
Carburettor icing-probability at ground level (124.26 feet)......................................................... 9 Carburettor icing-probability at 1250 feet ................................................................................. 10 Carburettor icing-probability at 2500 feet ................................................................................. 11 Carburettor icing-probability at 3750 feet ................................................................................. 12 Carburettor icing-probability at 5000 feet ................................................................................. 13 Carburettor icing-probability at 6250 feet ................................................................................. 14 Carburettor icing-probability at 7500 feet ................................................................................. 15 Summary.................................................................................................................................... 16
Conclusions ........................................................................................................................................ 17 Comments and suggested recommendations ..................................................................................... 17
Comments .................................................................................................................................. 17 Suggested recommendations...................................................................................................... 17
References .......................................................................................................................................... 19 Previous reports.................................................................................................................................. 19 Appendix A........................................................................................................................................ 20 Appendix B........................................................................................................................................ 25 Appendix C ........................................................................................................................................ 28 Appendix D........................................................................................................................................ 41
Danish Meteorological Institute Technical Report 04-25
www.dmi.dk/dmi/tr04-25 page 4 of 44
Abstract This report investigates and reports of the probability of carburettor icing, based on radiosonde data from WMO station no. 06181 Jægersborg, located 7 km north of Copenhagen. The carburettor icing-probability has been calculated for 7 different heights including ground level based on measurements of temperature and dew point temperature. The carburettor icing-probability is determined by classifying observations into five icing-probability classes using The New Carburettor Icing-Probability Chart recommended by The Australian Transport Safety Bureau. Statistics have been generated for each month for nightly and daily measurements respectively. The risk of serious and moderate carburettor icing is present at all heights throughout the year. There are, however, variations with height and seasonal differences. The probability of serious and moderate carburettor icing generally decreases with height, while the seasonal variation increases with peak values in July and August. Except from at ground level no major difference in distribution of the icing probability is observed when comparing daily (12 UTC) and nightly (00 UTC) values.

Danish Meteorological Institute Technical Report 04-25
www.dmi.dk/dmi/tr04-25 page 5 of 44
Introduction This report is written at the request of the Danish Accident Investigation Board. The purpose of the report is to quantify the probability of aircraft carburettor icing in Denmark. The resulting statistics will hopefully contribute to improved flight safety. The carburettor icing probability statistics are generated from radiosonde data using observations of temperature and dew point temperature from WMO st. no. 06181 at Jægersborg. The radiosonde is sent up daily at 00 UTC and 12 UTC. The risk of carburettor icing is estimated using The New Carburettor Icing-Probability Chart (figure 1). More than 20 years of radiosonde data are used (1980 to 2004) to generate statistics describing the icing-probability for each month, for the seven heights of 124.26 feet (ground level), 1250, 2500, 3750, 5000, 6250 and 7500 feet, at both 00 UTC and 12 UTC.
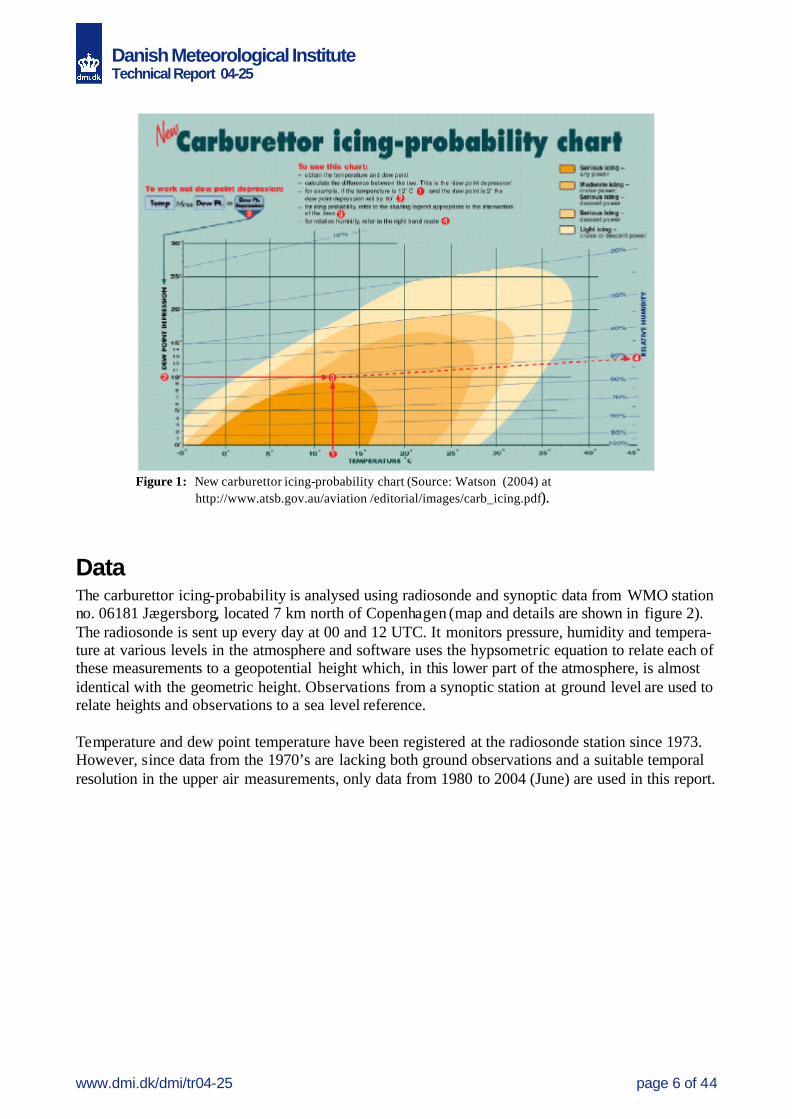
Carburettor icing Carburettor icing is the most common of several types of induction system icings. It occurs as a consequence of the sudden drop of temperature caused by the vaporization of the fuel and the pressure reduction in the carburettor venturi. The decline of temperature of up to 20-30 degrees Celsius causes the moist in the atmosphere to freeze, and the ice will gradually block the venturi tube. In extreme cases, at reduced power settings, the free movement of the throttle butterfly may be restricted. This will affect the fuel/air ratio and thereby progressively reduce the tractive force and eventually choke the engine. Carburettor icing can occur at most temperatures likely to occur in Denmark. The probability of icing depends on both air temperature, air humidity, engine power and fuel type. The greatest risk and the most severe icing is found in air temperatures above freezing. The probability of icing increases with the relative humidity of the atmosphere. At reduced engine power there is a higher risk of carburettor icing caused by the lower intake temperature and the partly closed throttle valve. (Jørgensen, 2003; Civil Aviation Authority, 2000). The probability of carburettor icing can be predicted from values of air temperature and dew point depression1 by use of The New carburettor Icing-Probability Chart (figure 1).
1 Dew Point depression = temperature – dew point temperature.
Danish Meteorological Institute Technical Report 04-25
www.dmi.dk/dmi/tr04-25 page 6 of 44
Figure 1: New carburettor icing-probability chart (Source: Watson (2004) at
http://www.atsb.gov.au/aviation /editorial/images/carb_icing.pdf).
Data The carburettor icing-probability is analysed using radiosonde and synoptic data from WMO station no. 06181 Jægersborg, located 7 km north of Copenhagen (map and details are shown in figure 2). The radiosonde is sent up every day at 00 and 12 UTC. It monitors pressure, humidity and tempera-ture at various levels in the atmosphere and software uses the hypsometric equation to relate each of these measurements to a geopotential height which, in this lower part of the atmosphere, is almost identical with the geometric height. Observations from a synoptic station at ground level are used to relate heights and observations to a sea level reference. Temperature and dew point temperature have been registered at the radiosonde station since 1973. However, since data from the 1970’s are lacking both ground observations and a suitable temporal resolution in the upper air measurements, only data from 1980 to 2004 (June) are used in this report.

Danish Meteorological Institute Technical Report 04-25
www.dmi.dk/dmi/tr04-25 page 7 of 44
Figur 2: Location and details of the WMO station no. 06181 radiosonde station.
Methods Statistics illustrating the carburettor icing-probability for each of 7 heights have been generated for each month, for nightly (00 UTC) and daily (12 UTC) measurements respectively. At ground level (126.24 feet) observed values are used, and at 1250, 2500, 3750, 5000, 6250 and 7500 feet values of temperature and dew point temperature has been estimated using linear interpolation using the statistical software SPSS. The New Carburettor Icing-Probability Chart (figure 1) was used to categorize the data into the probability classes shown in table 1. The chart was vectorized from a bitmap image using WinChips software. Data were categorized according to the 5 different probability classes (polygons) using values of temperature (x) and dew point depression (y) as coordinates. The last step of this proce-dure was performed in ArcView 3.2.
Carburettor icing-probability classes A Serious icing, any power B Moderate icing, cruise power / Serious icing, descent power C Serious icing, descent power D Light icing, cruise or descent power E No icing
Table 1: Carburettor icing-probability classes. See figure 1 for reference.
There are two drawbacks of using The New Carburettor Icing-Probability Chart for this purpose. During winter and at levels above ground level the air temperature can easily drop below the lower limit of -5 degrees Celsius. A reasonable assumption would be that the polygon representation class D ought to be extended to -8 degrees. Instead of modifying the graph it was decided to use the graph in its current form, as no information on the creation of the graph was available. Conse-quently some of the observations currently classified as class E (No icing) should probably have
WMO Station no: 06181
Latitude: 55.77N
Longitude: 12.53E
Radiosonde type: Vaisala RS90
Barometer Height: 40m
Radiation correction: Y (V93)
Wind finding system: LORAN-C
Ground st.: DIGICORA MW-11
Main frequencies (MHz): 400-406
Operational flights (UTC): 00, 12

Danish Meteorological Institute Technical Report 04-25
www.dmi.dk/dmi/tr04-25 page 8 of 44
been classified as class D (Light icing). An updated version of this report based on a carburettor icing-probability chart modified to suit the Danish winter climate is expected by early spring 2005. Also, The New Carburettor Icing-Probability Chart refers to conditions near MSL (Mean Sea Level). At higher levels the relative pressure reduction caused by induction is expected to be less than at ground level. This means that the risk of carburettor icing will be correspondingly less. However the extent of this effect is unknown and is therefore not considered in this report. In a few cases missing values of temperature and dew point temperatures in heights below 1250 feet will cause errors in the interpolated values since the interpolation routine in SPSS will automatically generate an interpolated value from the nearest previous and preceding observed value. In those few cases where no observations are available in heights less than 1250 feet, the temperature and dew point temperature at 1250 feet will be calculated using the last observation from the previous date (in a height of ca.7 km). Hence the estimation of both temperature and dew point temperature will be much too low. This error will affect heights lower than that of the first measured value. These erroneous data are very few and easy to spot since they are all located in the lower left area of the plot. They all fall into the category of class E (no icing). It is unlikely that they would have fallen into class E if the interpolated values had been correct since the probability of carburettor icing in 1250 feet is generally high. The number of erroneous values is much too low (<0,1%) to affect the overall results.
Results In this section the resulting statistics are briefly described in regard to variation with height, season and in respect to daily and nightly values. The statistics are presented in both graphs and tables. In this section fourteen bar charts are shown representing each of the seven heights for daily (12 UTC) and nightly (00 UTC) values respectively. The bar charts illustrates the relative distribution of the five carburettor icing-probability classes for each month. In Appendix A the frequencies of the five icing-probability classes are listed in both counts and percentage. In these tables the data are grouped according to month before heights. In order to ease overall comparison the yearly variations are summarized in Appendix B (See also tables 2a & 2b and 3a & 3b).

Danish Meteorological Institute Technical Report 04-25
www.dmi.dk/dmi/tr04-25 page 9 of 44
Carburettor icing-probability at ground level (124.26 feet)
124.26 feet - 00 UTC
0%
20%
40%
60%
80%
100%
1 2 3 4 5 6 7 8 9 10 11 12
Month
% o
f all
data
at t
his
heig
ht
124.26 feet - 12 UTC
0%
20%
40%
60%
80%
100%
1 2 3 4 5 6 7 8 9 10 11 12
Month
% o
f all
data
at t
his
heig
ht
CARBURETTOR ICING-PROBABILITY CLASSES A Serious icing, any power B Moderate icing, cruise power / Serious icing, descent power C Serious icing, descent power D Light icing, cruise or descent power E No icing

Danish Meteorological Institute Technical Report 04-25
www.dmi.dk/dmi/tr04-25 page 10 of 44
Carburettor icing-probability at 1250 feet
1250 feet - 00 UTC
0%
20%
40%
60%
80%
100%
1 2 3 4 5 6 7 8 9 10 11 12
Month
% o
f all
data
at t
his
heig
ht
1250 feet - 12 UTC
0%
20%
40%
60%
80%
100%
1 2 3 4 5 6 7 8 9 10 11 12
Month
% o
f all
data
at t
his
heig
ht
CARBURETTOR ICING-PROBABILITY CLASSES A Serious icing, any power B Moderate icing, cruise power / Serious icing, descent power C Serious icing, descent power D Light icing, cruise or descent power E No icing
Danish Meteorological Institute Technical Report 04-25
www.dmi.dk/dmi/tr04-25 page 11 of 44
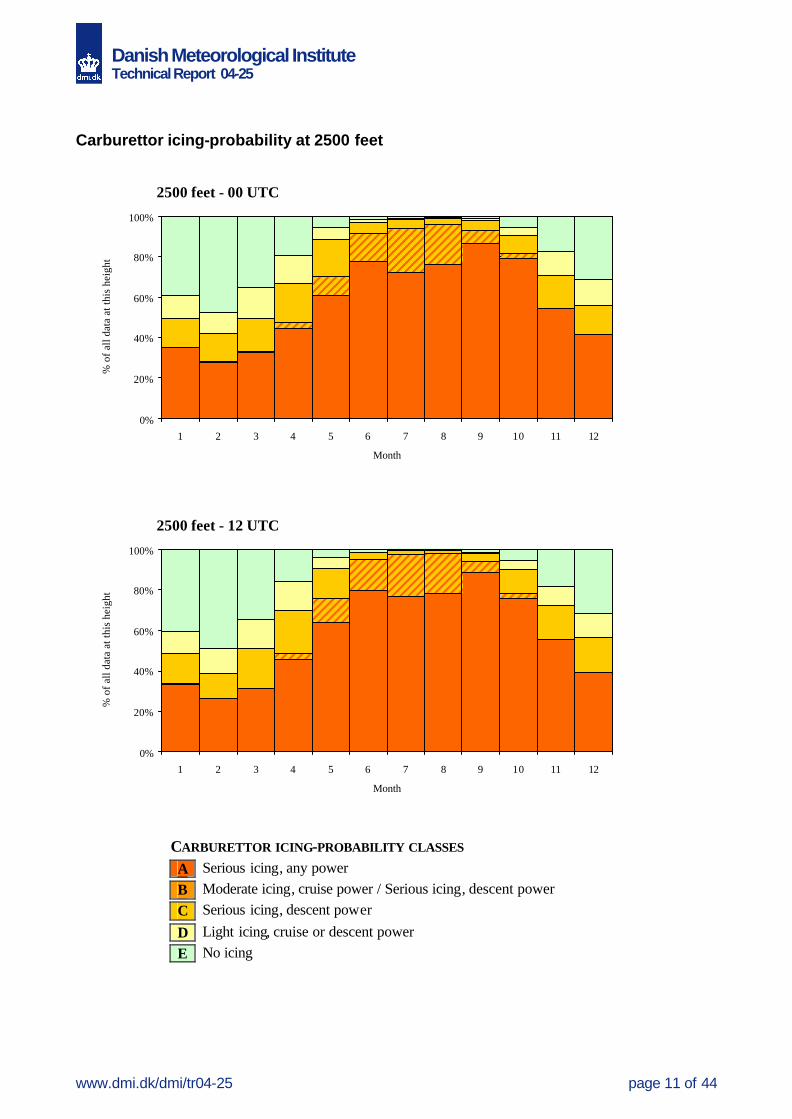
Carburettor icing-probability at 2500 feet
2500 feet - 00 UTC
0%
20%
40%
60%
80%
100%
1 2 3 4 5 6 7 8 9 10 11 12
Month
% o
f all
data
at t
his
heig
ht
2500 feet - 12 UTC
0%
20%
40%
60%
80%
100%
1 2 3 4 5 6 7 8 9 10 11 12
Month
% o
f all
data
at t
his
heig
ht
CARBURETTOR ICING-PROBABILITY CLASSES A Serious icing, any power B Moderate icing, cruise power / Serious icing, descent power C Serious icing, descent power D Light icing, cruise or descent power E No icing

Danish Meteorological Institute Technical Report 04-25
www.dmi.dk/dmi/tr04-25 page 12 of 44
Carburettor icing-probability at 3750 feet
3750 feet - 00 UTC
0%
20%
40%
60%
80%
100%
1 2 3 4 5 6 7 8 9 10 11 12
Month
% o
f all
data
at t
his
heig
ht
3750 feet - 12 UTC
0%
20%
40%
60%
80%
100%
1 2 3 4 5 6 7 8 9 10 11 12
Month
% o
f all
data
at t
his
heig
ht
CARBURETTOR ICING-PROBABILITY CLASSES A Serious icing, any power B Moderate icing, cruise power / Serious icing, descent power C Serious icing, descent power D Light icing, cruise or descent power E No icing

Danish Meteorological Institute Technical Report 04-25
www.dmi.dk/dmi/tr04-25 page 13 of 44
Carburettor icing-probability at 5000 feet
5000 feet - 00 UTC
0%
20%
40%
60%
80%
100%
1 2 3 4 5 6 7 8 9 10 11 12
Month
% o
f all
data
at t
his
heig
ht
5000 feet - 12 UTC
0%
20%
40%
60%
80%
100%
1 2 3 4 5 6 7 8 9 10 11 12
Month
% o
f all
data
at t
his
heig
ht
CARBURETTOR ICING-PROBABILITY CLASSES A Serious icing, any power B Moderate icing, cruise power / Serious icing, descent power C Serious icing, descent power D Light icing, cruise or descent power E No icing

Danish Meteorological Institute Technical Report 04-25
www.dmi.dk/dmi/tr04-25 page 14 of 44
Carburettor icing-probability at 6250 feet
6250 feet - 00 UTC
0%
20%
40%
60%
80%
100%
1 2 3 4 5 6 7 8 9 10 11 12
Month
% o
f all
data
at t
his
heig
ht
6250 feet - 12 UTC
0%
20%
40%
60%
80%
100%
1 2 3 4 5 6 7 8 9 10 11 12
Month
% o
f all
data
at t
his
heig
ht
CARBURETTOR ICING-PROBABILITY CLASSES A Serious icing, any power B Moderate icing, cruise power / Serious icing, descent power C Serious icing, descent power D Light icing, cruise or descent power E No icing

Danish Meteorological Institute Technical Report 04-25
www.dmi.dk/dmi/tr04-25 page 15 of 44
Carburettor icing-probability at 7500 feet
7500 feet - 00 UTC
0%
20%
40%
60%
80%
100%
1 2 3 4 5 6 7 8 9 10 11 12
Month
% o
f all
data
at t
his
heig
ht
7500 feet - 12 UTC
0%
20%
40%
60%
80%
100%
1 2 3 4 5 6 7 8 9 10 11 12
Month
% o
f all
data
at t
his
heig
ht
CARBURETTOR ICING-PROBABILITY CLASSES A Serious icing, any power B Moderate icing, cruise power / Serious icing, descent power C Serious icing, descent power D Light icing, cruise or descent power E No icing

Danish Meteorological Institute Technical Report 04-25
www.dmi.dk/dmi/tr04-25 page 16 of 44
Summary In this section the results are briefly described on the basis of the generated charts and tables. To give a simplified overview the icing-probability classes A, B and C have been grouped to describe the risk of serious and moderate carburettor icing. The risk of serious/moderate icing (Class A-C) is present at all heights throughout the year. There are, however, variations with height and seasonal differences. On average the carburettor icing-probability decreases with height. Generally the probability of carburettor icing is highest during the summer months due to the higher level of humidity in the air. The seasonal variation is most dis-tinct in and above 2500 feet. At ground level and at 1250 feet there is a very high probability of serious/moderate carburettor icing throughout the year (median > 90%) with only minor seasonal variations. At 2500 and 3750 feet the probability of serious/moderate icing is decreasing but still relatively high (median > 60%) and the seasonal variation more pronounced resulting in a bell shaped monthly distribution with peak values in July and August. At 5000, 6250 and 7500 feet the risk of serious/moderate icing gradually decreases while the season variation increases, making the bell shaped distribution even more pronounced. At 7500 feet the median has dropped to below 20%, with monthly values ranging from 3 to 50%. Class A - 00 UTC Class A - 12 UTC Height (feet) max min median mean stdv Height (feet) max min median mean stdv
124.26 99 68 87 86 11 124.26 94 21 67 62 25 1250 91 47 68 68 14 1250 90 47 62 66 14 2500 87 28 58 57 21 2500 88 27 60 58 22 3750 78 17 47 47 24 3750 81 17 47 48 26 5000 69 9 29 34 24 5000 72 8 28 34 25 6250 56 4 19 24 19 6250 55 3 17 22 19 7500 41 1 11 15 14 7500 38 1 9 13 13
Table 2a & 2b: Descriptive statistics summarizing the monthly values (%) of Class A (serious icing, any power).
Class A+B+C - 00 UTC Class A+B+C - 12 UTC Height (feet) max min median mean stdv Height (feet) max min median mean stdv
124.26 100 80 99 95 7 124.26 100 85 98 95 6 1250 100 61 92 86 14 1250 100 62 91 86 14 2500 99 42 80 76 22 2500 99 39 81 76 23 3750 95 26 65 64 26 3750 96 25 64 63 28 5000 85 15 43 48 28 5000 87 14 42 47 30 6250 74 9 30 36 25 6250 74 8 29 35 26 7500 58 4 20 24 20 7500 55 3 18 23 19
Table 3a & 3b: In this table Class A, B & C are summed to provide an overview of the frequency of serious and moderate icing-probability (all in %).
The relative distribution of the five probability classes are generally similar when comparing results for each height based on daily (12 UTC) and nightly (00 UTC) observations respectively. The only marked difference is at ground level (124.26 feet) during the months April to October. In these months the relative distribution of probability Class A and B differs significantly. At 00 UTC the risk of serious icing ‘at any power’ (Class A) is present in averagely 86% of the time when viewing the year as a whole with monthly values ranging from 68-99% (see table 2a & 2b). The highest frequencies are found in spring and autumn, but the seasonal variation is generally low.
Danish Meteorological Institute Technical Report 04-25
www.dmi.dk/dmi/tr04-25 page 17 of 44
At 12 UTC the average frequency of Class A is significantly lower (62%) and the variation in the monthly values much higher (21-94%) as seen in table 2a & 2b (numbers highlighted in bold). Especially during the months April to September the share of values classified at Class A are significantly lower at 12 UTC than at 00 UTC. The share of values classified as Class B are corre-spondingly higher during these months, and when Class A, B & C are grouped this difference between night and day is much lees marked (see table 3a & 3b first row).
Conclusions The risk of serious/moderate carburettor icing is present at all heights throughout the year. There are, however, variations with height and seasonal differences. The probability of serious/moderate carburettor icing generally decreases with height, while the monthly variation increases. At ground level the probability of serious/moderate icing is very high (median > 95%) and the monthly varia-tion low (80-100%). At 7500 feet the probability of serious/moderate icing has decreased to an average of 20% (median) ranging from 3 to57%. The seasonal variation is most pronounced in and above 2500 feet. Generally the probability of carburettor icing is highest during the summer months, the distribution of monthly values becoming increasingly bell shaped with height, generally with peak values in July and August. Except from at ground level no major difference in distribution of the icing probability is observed when comparing daily (12 UTC) and nightly (00 UTC) values. The New Carburettor Icing-Probability Chart is designed to consider air temperatures between -5 and 45° C. As described on page 7 this may have an effect on the classification of observations representing air temperatures below - 5 ° C: the frequency of class D (Light icing) may be higher, and the frequency of class E (No icing) correspondingly lower, than suggested in this analysis. This will be dealt with in a later version of this report.
Comments and suggested recommendations By Søren Brodersen
Comments The finding that the probability of carburettor icing is highest during the summer months is impor-tant, as the majority of the pilot community would probably have expected the reverse tendency. Also, it is worth noting that the probability class “No Icing” exclusively relates to the risk of Carbu-rettor icing, as the air temperature falls below ca. -10 ° C. In these cases the relative humidity may well be up to 100%, indicating that clouds or precipitation is present at temperatures below 0 ° C. Using data at 00 UTC and 12 UTC exclusively should not lead to the impression, that 00 UTC represents night flying, and 12 UTC represents daytime flying. In general, the 00 UTC sounding represents morning weather conditions better than the 12 UTC sounding.
Suggested recommendations This report concludes, that weather conditions favourable for carburettor icing are present at virtu-ally all the time, especially at low levels and levels in which take-off and landing procedures are executed or prolonged VFR-cruising over land takes place.

Danish Meteorological Institute Technical Report 04-25
www.dmi.dk/dmi/tr04-25 page 18 of 44
The use of the carburettor icing chart requires knowledge of air temperature and dew point and these data are only available (to the pilot) at ground levels. Forecasting air temperature and dew point at various flight levels is not possible, as variations in three dimensions and time are very complex. Therefore, the pilot focus should not be on the temperature, the dew point, the relative humidity nor the carburettor icing chart. The focus should primarily be on timely and routinely monitoring engine performance (RPM & Manifold Pressure) followed by proper and consequent use of carburettor heating. The leaflet PISTON ENGINE ICING provided by UK-CAA (Civil Aviation Authority, 2000) gives recommendations of pilot procedures in order to minimize the risk of carburettor icing. The leaflet can be found at the URL : http://www.caa.co.uk/docs/33/SRG_GAD_SSL14.PDF A summary of the leaflet is provided in Appendix D.
Danish Meteorological Institute Technical Report 04-25
www.dmi.dk/dmi/tr04-25 page 19 of 44
References Civil Aviation Authority (2000). Civil Aviation Safety Sense 14A. Piston Engine Icing. Westward
documedia Limited, Cheltenham UK. Jørgensen, Knud (2003) Karburatoris. OY-SIK (2) 2003 p.14-18. Statens Lufthavnsvæsen. (Danish
Civil Aviation Administration). GASIL (4) Dec. 2002, p.35. Carburettor icing – it’s the humidity! Watson, M. (2004) “New carburettor icing-probability chart” in Melting moments: understanding
carburettor icing. Editorial, Australian Transport Safety Bureau (ATSB), the Australian Government. http://www.atsb.gov.au/aviation/editorial/images/ carb_icing.pdf
Previous reports Previous reports from the Danish Meteorological Institute can be found on: http://www.dmi.dk/dmi/dmi-publikationer.htm

Danish Meteorological Institute Technical Report 04-25
www.dmi.dk/dmi/tr04-25 page 20 of 44
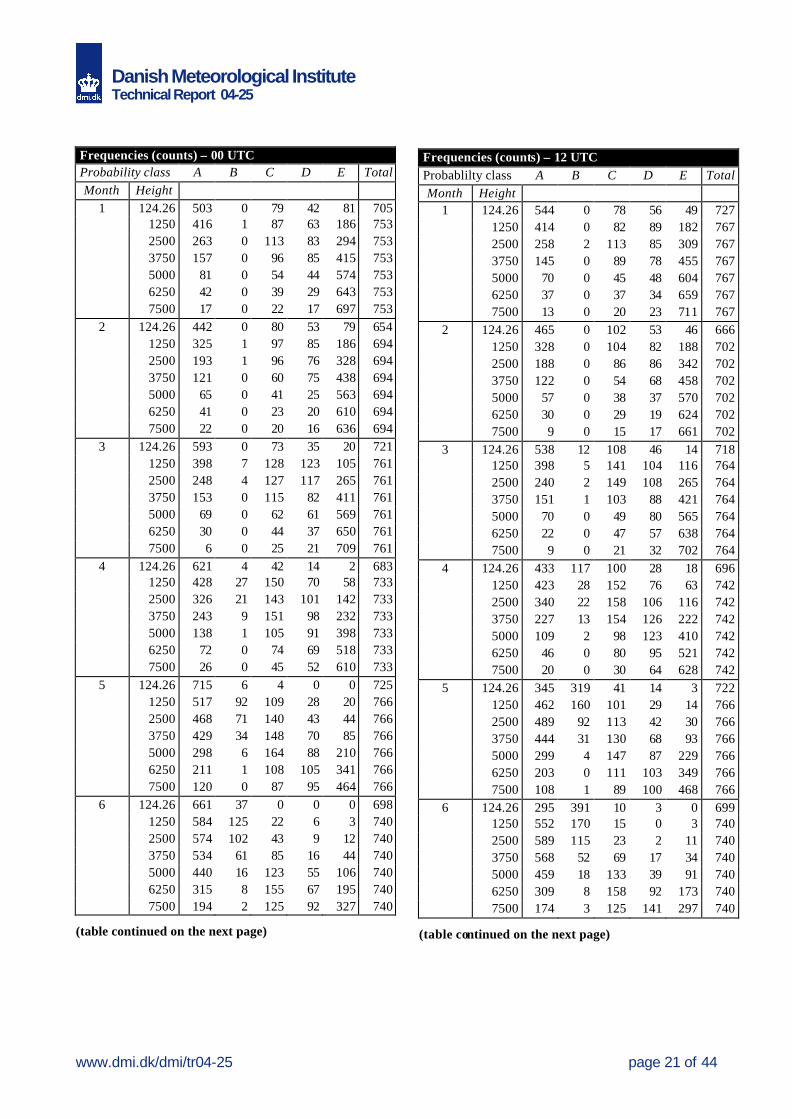
Appendix A The following tables list the frequencies of the analysed data categorized into the 5 carburettor icing probability classes. The first two tables (A1 & A2) list the frequencies in counts at 00 UTC and 12 UTC respectively. The next two tables (A3 & A4) list the corresponding frequencies in percentages. For explanation of probability classes and methods see the section “Methods” in the report.
Danish Meteorological Institute Technical Report 04-25
www.dmi.dk/dmi/tr04-25 page 21 of 44
Frequencies (counts) – 00 UTC Probability class A B C D E Total Month Height
1 124.26 503 0 79 42 81 705 1250 416 1 87 63 186 753 2500 263 0 113 83 294 753 3750 157 0 96 85 415 753 5000 81 0 54 44 574 753 6250 42 0 39 29 643 753 7500 17 0 22 17 697 753 2 124.26 442 0 80 53 79 654 1250 325 1 97 85 186 694 2500 193 1 96 76 328 694 3750 121 0 60 75 438 694 5000 65 0 41 25 563 694 6250 41 0 23 20 610 694 7500 22 0 20 16 636 694 3 124.26 593 0 73 35 20 721 1250 398 7 128 123 105 761 2500 248 4 127 117 265 761 3750 153 0 115 82 411 761 5000 69 0 62 61 569 761 6250 30 0 44 37 650 761 7500 6 0 25 21 709 761 4 124.26 621 4 42 14 2 683 1250 428 27 150 70 58 733 2500 326 21 143 101 142 733 3750 243 9 151 98 232 733 5000 138 1 105 91 398 733 6250 72 0 74 69 518 733 7500 26 0 45 52 610 733 5 124.26 715 6 4 0 0 725 1250 517 92 109 28 20 766 2500 468 71 140 43 44 766 3750 429 34 148 70 85 766 5000 298 6 164 88 210 766 6250 211 1 108 105 341 766 7500 120 0 87 95 464 766 6 124.26 661 37 0 0 0 698 1250 584 125 22 6 3 740 2500 574 102 43 9 12 740 3750 534 61 85 16 44 740 5000 440 16 123 55 106 740 6250 315 8 155 67 195 740 7500 194 2 125 92 327 740
(table continued on the next page)
Frequencies (counts) – 12 UTC Probablilty class A B C D E Total Month Height
1 124.26 544 0 78 56 49 727 1250 414 0 82 89 182 767 2500 258 2 113 85 309 767 3750 145 0 89 78 455 767 5000 70 0 45 48 604 767 6250 37 0 37 34 659 767 7500 13 0 20 23 711 767 2 124.26 465 0 102 53 46 666 1250 328 0 104 82 188 702 2500 188 0 86 86 342 702 3750 122 0 54 68 458 702 5000 57 0 38 37 570 702 6250 30 0 29 19 624 702 7500 9 0 15 17 661 702 3 124.26 538 12 108 46 14 718 1250 398 5 141 104 116 764 2500 240 2 149 108 265 764 3750 151 1 103 88 421 764 5000 70 0 49 80 565 764 6250 22 0 47 57 638 764 7500 9 0 21 32 702 764 4 124.26 433 117 100 28 18 696 1250 423 28 152 76 63 742 2500 340 22 158 106 116 742 3750 227 13 154 126 222 742 5000 109 2 98 123 410 742 6250 46 0 80 95 521 742 7500 20 0 30 64 628 742 5 124.26 345 319 41 14 3 722 1250 462 160 101 29 14 766 2500 489 92 113 42 30 766 3750 444 31 130 68 93 766 5000 299 4 147 87 229 766 6250 203 0 111 103 349 766 7500 108 1 89 100 468 766 6 124.26 295 391 10 3 0 699 1250 552 170 15 0 3 740 2500 589 115 23 2 11 740 3750 568 52 69 17 34 740 5000 459 18 133 39 91 740 6250 309 8 158 92 173 740 7500 174 3 125 141 297 740
(table continued on the next page)

Danish Meteorological Institute Technical Report 04-25
www.dmi.dk/dmi/tr04-25 page 22 of 44
Frequencies (counts – continued) – 00 UTC Probability class A B C D E Total Month Height
7 124.26 553 149 0 0 1 703 1250 512 226 11 2 1 752 2500 546 161 32 6 7 752 3750 568 83 58 10 33 752 5000 519 32 90 27 84 752 6250 423 18 116 66 129 752 7500 306 5 125 88 228 752 8 124.26 544 145 0 0 1 690 1250 509 211 8 1 1 730 2500 557 143 22 5 3 730 3750 573 79 44 13 21 730 5000 491 29 90 35 85 730 6250 367 13 137 53 160 730 7500 251 6 124 81 268 730 9 124.26 647 15 0 0 1 663 1250 643 51 10 2 2 708 2500 614 45 35 6 8 708 3750 525 20 69 23 71 708 5000 387 7 118 45 151 708 6250 288 5 96 64 255 708 7500 187 0 104 67 350 708
10 124.26 643 0 4 2 0 649 1250 661 7 35 11 10 724 2500 575 15 67 26 41 724 3750 420 13 109 67 115 724 5000 275 5 101 82 261 724 6250 192 2 83 77 370 724 7500 136 0 63 56 469 724
11 124.26 584 0 33 9 6 632 1250 543 1 85 41 33 703 2500 384 2 114 83 120 703 3750 263 2 120 85 233 703 5000 144 1 88 89 381 703 6250 86 0 69 54 494 703 7500 43 0 43 52 565 703
12 124.26 518 0 53 28 42 641 1250 445 0 103 74 94 716 2500 295 0 106 92 223 716 3750 180 0 82 84 370 716 5000 88 0 68 39 521 716 6250 46 0 46 38 586 716 7500 23 0 23 35 635 716
Frequencies (counts - continued) – 12 UTC Probablilty class A B C D E Total Month Height
7 124.26 144 531 24 1 0 700 1250 465 275 5 2 2 749 2500 575 156 13 4 1 749 3750 588 77 47 16 21 749 5000 540 27 82 26 74 749 6250 413 18 126 44 148 749 7500 282 9 124 98 236 749 8 124.26 144 531 16 1 0 692 1250 459 271 4 1 2 737 2500 576 148 9 2 2 737 3750 595 66 49 7 20 737 5000 508 32 96 28 73 737 6250 373 15 135 56 158 737 7500 239 5 134 88 271 737 9 124.26 419 243 0 0 1 663 1250 639 58 12 0 0 709 2500 627 41 25 6 10 709 3750 547 29 62 13 58 709 5000 384 15 111 56 143 709 6250 254 5 126 80 244 709 7500 160 2 104 88 355 709
10 124.26 621 25 11 1 0 658 1250 657 13 41 16 8 735 2500 557 20 85 33 40 735 3750 421 17 98 71 128 735 5000 269 3 114 74 275 735 6250 170 0 110 66 389 735 7500 100 1 75 60 499 735
11 124.26 592 1 32 14 0 639 1250 552 0 78 52 32 714 2500 396 2 119 68 129 714 3750 264 4 124 85 237 714 5000 134 0 88 77 415 714 6250 81 0 61 61 511 714 7500 37 0 44 46 587 714
12 124.26 549 0 49 26 19 643 1250 459 0 105 72 91 727 2500 285 0 126 88 228 727 3750 184 0 82 97 364 727 5000 75 0 62 65 525 727 6250 44 0 41 40 602 727 7500 24 0 23 24 656 727

Danish Meteorological Institute Technical Report 04-25
www.dmi.dk/dmi/tr04-25 page 23 of 44
Frequencies (%) – 00 UTC Probability class
A B C D E Total
Month Height 1 124.26 71,3 0,0 11,2 6,0 11,5 100 1250 55,2 0,1 11,6 8,4 24,7 100 2500 34,9 0,0 15,0 11,0 39,0 100 3750 20,8 0,0 12,7 11,3 55,1 100 5000 10,8 0,0 7,2 5,8 76,2 100 6250 5,6 0,0 5,2 3,9 85,4 100 7500 2,3 0,0 2,9 2,3 92,6 100 2 124.26 67,6 0,0 12,2 8,1 12,1 100 1250 46,8 0,1 14,0 12,2 26,8 100 2500 27,8 0,1 13,8 11,0 47,3 100 3750 17,4 0,0 8,6 10,8 63,1 100 5000 9,4 0,0 5,9 3,6 81,1 100 6250 5,9 0,0 3,3 2,9 87,9 100 7500 3,2 0,0 2,9 2,3 91,6 100 3 124.26 82,2 0,0 10,1 4,9 2,8 100 1250 52,3 0,9 16,8 16,2 13,8 100 2500 32,6 0,5 16,7 15,4 34,8 100 3750 20,1 0,0 15,1 10,8 54,0 100 5000 9,1 0,0 8,1 8,0 74,8 100 6250 3,9 0,0 5,8 4,9 85,4 100 7500 0,8 0,0 3,3 2,8 93,2 100 4 124.26 90,9 0,6 6,1 2,0 0,3 100 1250 58,4 3,7 20,5 9,5 7,9 100 2500 44,5 2,9 19,5 13,8 19,4 100 3750 33,2 1,2 20,6 13,4 31,7 100 5000 18,8 0,1 14,3 12,4 54,3 100 6250 9,8 0,0 10,1 9,4 70,7 100 7500 3,5 0,0 6,1 7,1 83,2 100 5 124.26 98,6 0,8 0,6 0,0 0,0 100 1250 67,5 12,0 14,2 3,7 2,6 100 2500 61,1 9,3 18,3 5,6 5,7 100 3750 56,0 4,4 19,3 9,1 11,1 100 5000 38,9 0,8 21,4 11,5 27,4 100 6250 27,5 0,1 14,1 13,7 44,5 100 7500 15,7 0,0 11,4 12,4 60,6 100 6 124.26 94,7 5,3 0,0 0,0 0,0 100 1250 78,9 16,9 3,0 0,8 0,4 100 2500 77,6 13,8 5,8 1,2 1,6 100 3750 72,2 8,2 11,5 2,2 5,9 100 5000 59,5 2,2 16,6 7,4 14,3 100 6250 42,6 1,1 20,9 9,1 26,4 100 7500 26,2 0,3 16,9 12,4 44,2 100
(table continued on the next page)
Frequencies (%) – 12 UTC Probablilty class
A B C D E Total
Month Height 1 124.26 74,8 0,0 10,7 7,7 6,7 100 1250 54,0 0,0 10,7 11,6 23,7 100 2500 33,6 0,3 14,7 11,1 40,3 100 3750 18,9 0,0 11,6 10,2 59,3 100 5000 9,1 0,0 5,9 6,3 78,7 100 6250 4,8 0,0 4,8 4,4 85,9 100 7500 1,7 0,0 2,6 3,0 92,7 100 2 124.26 69,8 0,0 15,3 8,0 6,9 100 1250 46,7 0,0 14,8 11,7 26,8 100 2500 26,8 0,0 12,3 12,3 48,7 100 3750 17,4 0,0 7,7 9,7 65,2 100 5000 8,1 0,0 5,4 5,3 81,2 100 6250 4,3 0,0 4,1 2,7 88,9 100 7500 1,3 0,0 2,1 2,4 94,2 100 3 124.26 74,9 1,7 15,0 6,4 1,9 100 1250 52,1 0,7 18,5 13,6 15,2 100 2500 31,4 0,3 19,5 14,1 34,7 100 3750 19,8 0,1 13,5 11,5 55,1 100 5000 9,2 0,0 6,4 10,5 74,0 100 6250 2,9 0,0 6,2 7,5 83,5 100 7500 1,2 0,0 2,7 4,2 91,9 100 4 124.26 62,2 16,8 14,4 4,0 2,6 100 1250 57,0 3,8 20,5 10,2 8,5 100 2500 45,8 3,0 21,3 14,3 15,6 100 3750 30,6 1,8 20,8 17,0 29,9 100 5000 14,7 0,3 13,2 16,6 55,3 100 6250 6,2 0,0 10,8 12,8 70,2 100 7500 2,7 0,0 4,0 8,6 84,6 100 5 124.26 47,8 44,2 5,7 1,9 0,4 100 1250 60,3 20,9 13,2 3,8 1,8 100 2500 63,8 12,0 14,8 5,5 3,9 100 3750 58,0 4,0 17,0 8,9 12,1 100 5000 39,0 0,5 19,2 11,4 29,9 100 6250 26,5 0,0 14,5 13,4 45,6 100 7500 14,1 0,1 11,6 13,1 61,1 100 6 124.26 42,2 55,9 1,4 0,4 0,0 100 1250 74,6 23,0 2,0 0,0 0,4 100 2500 79,6 15,5 3,1 0,3 1,5 100 3750 76,8 7,0 9,3 2,3 4,6 100 5000 62,0 2,4 18,0 5,3 12,3 100 6250 41,8 1,1 21,4 12,4 23,4 100 7500 23,5 0,4 16,9 19,1 40,1 100
(table continued on the next page)

Danish Meteorological Institute Technical Report 04-25
www.dmi.dk/dmi/tr04-25 page 24 of 44
Frequencies (% - continued) – 00 UTC Probability class
A B C D E Total
Month Height 7 124.26 78,7 21,2 0,0 0,0 0,1 100 1250 68,1 30,1 1,5 0,3 0,1 100 2500 72,6 21,4 4,3 0,8 0,9 100 3750 75,5 11,0 7,7 1,3 4,4 100 5000 69,0 4,3 12,0 3,6 11,2 100 6250 56,3 2,4 15,4 8,8 17,2 100 7500 40,7 0,7 16,6 11,7 30,3 100 8 124.26 78,8 21,0 0,0 0,0 0,1 100 1250 69,7 28,9 1,1 0,1 0,1 100 2500 76,3 19,6 3,0 0,7 0,4 100 3750 78,5 10,8 6,0 1,8 2,9 100 5000 67,3 4,0 12,3 4,8 11,6 100 6250 50,3 1,8 18,8 7,3 21,9 100 7500 34,4 0,8 17,0 11,1 36,7 100 9 124.26 97,6 2,3 0,0 0,0 0,2 100 1250 90,8 7,2 1,4 0,3 0,3 100 2500 86,7 6,4 4,9 0,8 1,1 100 3750 74,2 2,8 9,7 3,2 10,0 100 5000 54,7 1,0 16,7 6,4 21,3 100 6250 40,7 0,7 13,6 9,0 36,0 100 7500 26,4 0,0 14,7 9,5 49,4 100
10 124.26 99,1 0,0 0,6 0,3 0,0 100 1250 91,3 1,0 4,8 1,5 1,4 100 2500 79,4 2,1 9,3 3,6 5,7 100 3750 58,0 1,8 15,1 9,3 15,9 100 5000 38,0 0,7 14,0 11,3 36,0 100 6250 26,5 0,3 11,5 10,6 51,1 100 7500 18,8 0,0 8,7 7,7 64,8 100
11 124.26 92,4 0,0 5,2 1,4 0,9 100 1250 77,2 0,1 12,1 5,8 4,7 100 2500 54,6 0,3 16,2 11,8 17,1 100 3750 37,4 0,3 17,1 12,1 33,1 100 5000 20,5 0,1 12,5 12,7 54,2 100 6250 12,2 0,0 9,8 7,7 70,3 100 7500 6,1 0,0 6,1 7,4 80,4 100
12 124.26 80,8 0,0 8,3 4,4 6,6 100 1250 62,2 0,0 14,4 10,3 13,1 100 2500 41,2 0,0 14,8 12,8 31,1 100 3750 25,1 0,0 11,5 11,7 51,7 100 5000 12,3 0,0 9,5 5,4 72,8 100 6250 6,4 0,0 6,4 5,3 81,8 100 7500 3,2 0,0 3,2 4,9 88,7 100
Frequencies (% - continued) – 12 UTC Probablilty class
A B C D E Total
Month Height 7 124.26 20,6 75,9 3,4 0,1 0,0 100 1250 62,1 36,7 0,7 0,3 0,3 100 2500 76,8 20,8 1,7 0,5 0,1 100 3750 78,5 10,3 6,3 2,1 2,8 100 5000 72,1 3,6 10,9 3,5 9,9 100 6250 55,1 2,4 16,8 5,9 19,8 100 7500 37,7 1,2 16,6 13,1 31,5 100 8 124.26 20,8 76,7 2,3 0,1 0,0 100 1250 62,3 36,8 0,5 0,1 0,3 100 2500 78,2 20,1 1,2 0,3 0,3 100 3750 80,7 9,0 6,6 0,9 2,7 100 5000 68,9 4,3 13,0 3,8 9,9 100 6250 50,6 2,0 18,3 7,6 21,4 100 7500 32,4 0,7 18,2 11,9 36,8 100 9 124.26 63,2 36,7 0,0 0,0 0,2 100 1250 90,1 8,2 1,7 0,0 0,0 100 2500 88,4 5,8 3,5 0,8 1,4 100 3750 77,2 4,1 8,7 1,8 8,2 100 5000 54,2 2,1 15,7 7,9 20,2 100 6250 35,8 0,7 17,8 11,3 34,4 100 7500 22,6 0,3 14,7 12,4 50,1 100
10 124.26 94,4 3,8 1,7 0,2 0,0 100 1250 89,4 1,8 5,6 2,2 1,1 100 2500 75,8 2,7 11,6 4,5 5,4 100 3750 57,3 2,3 13,3 9,7 17,4 100 5000 36,6 0,4 15,5 10,1 37,4 100 6250 23,1 0,0 15,0 9,0 52,9 100 7500 13,6 0,1 10,2 8,2 67,9 100
11 124.26 92,6 0,2 5,0 2,2 0,0 100 1250 77,3 0,0 10,9 7,3 4,5 100 2500 55,5 0,3 16,7 9,5 18,1 100 3750 37,0 0,6 17,4 11,9 33,2 100 5000 18,8 0,0 12,3 10,8 58,1 100 6250 11,3 0,0 8,5 8,5 71,6 100 7500 5,2 0,0 6,2 6,4 82,2 100
12 124.26 85,4 0,0 7,6 4,0 3,0 100 1250 63,1 0,0 14,4 9,9 12,5 100 2500 39,2 0,0 17,3 12,1 31,4 100 3750 25,3 0,0 11,3 13,3 50,1 100 5000 10,3 0,0 8,5 8,9 72,2 100 6250 6,1 0,0 5,6 5,5 82,8 100 7500 3,3 0,0 3,2 3,3 90,2 100

Danish Meteorological Institute Technical Report 04-25
www.dmi.dk/dmi/tr04-25 page 25 of 44
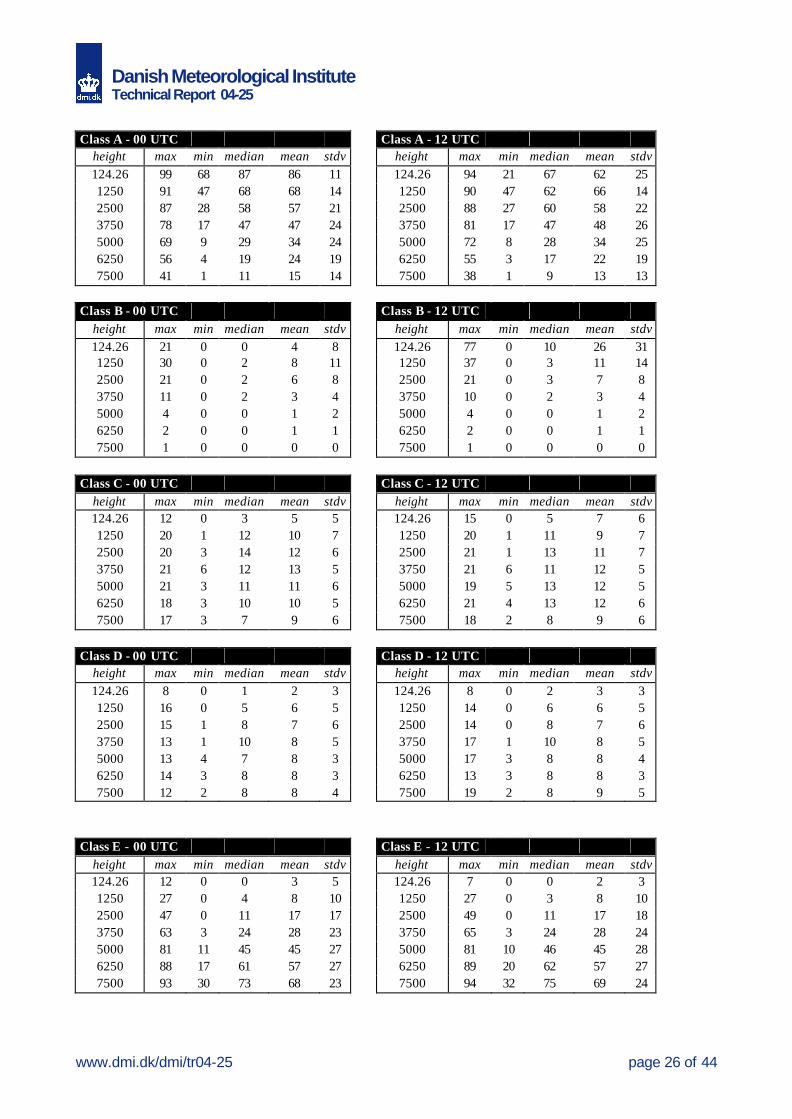
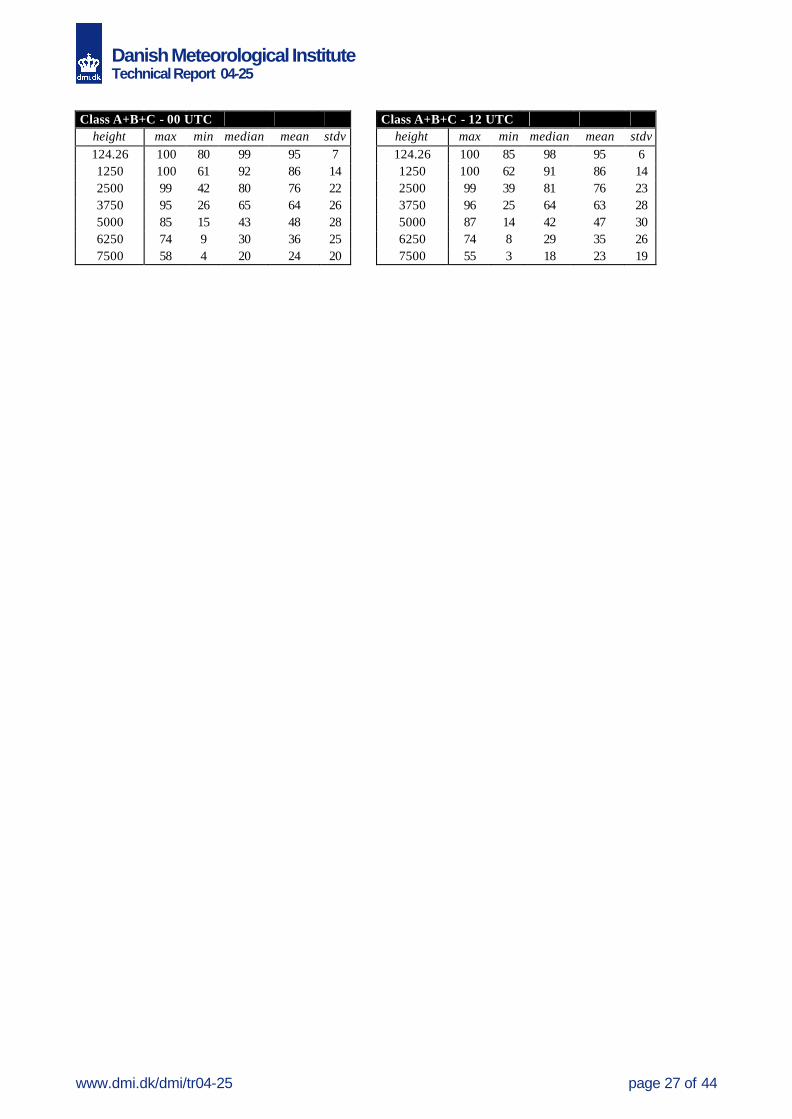
Appendix B Summary statistics (max., min., mean, median and std. var.) of monthly values (all in %) for each of the five probability classes and class A, B & C summarized. Tables to the left are based on nightly values (00 UTC) and tables on the right on daily values (12 UTC). For explanation of probability classes and methods see the section “Methods” in the report.
Danish Meteorological Institute Technical Report 04-25
www.dmi.dk/dmi/tr04-25 page 26 of 44
Class A - 00 UTC Class A - 12 UTC
height max min median mean stdv height max min median mean stdv 124.26 99 68 87 86 11 124.26 94 21 67 62 25 1250 91 47 68 68 14 1250 90 47 62 66 14 2500 87 28 58 57 21 2500 88 27 60 58 22 3750 78 17 47 47 24 3750 81 17 47 48 26 5000 69 9 29 34 24 5000 72 8 28 34 25 6250 56 4 19 24 19 6250 55 3 17 22 19 7500 41 1 11 15 14 7500 38 1 9 13 13
Class B - 00 UTC Class B - 12 UTC
height max min median mean stdv height max min median mean stdv 124.26 21 0 0 4 8 124.26 77 0 10 26 31 1250 30 0 2 8 11 1250 37 0 3 11 14 2500 21 0 2 6 8 2500 21 0 3 7 8 3750 11 0 2 3 4 3750 10 0 2 3 4 5000 4 0 0 1 2 5000 4 0 0 1 2 6250 2 0 0 1 1 6250 2 0 0 1 1 7500 1 0 0 0 0 7500 1 0 0 0 0
Class C - 00 UTC Class C - 12 UTC
height max min median mean stdv height max min median mean stdv 124.26 12 0 3 5 5 124.26 15 0 5 7 6 1250 20 1 12 10 7 1250 20 1 11 9 7 2500 20 3 14 12 6 2500 21 1 13 11 7 3750 21 6 12 13 5 3750 21 6 11 12 5 5000 21 3 11 11 6 5000 19 5 13 12 5 6250 18 3 10 10 5 6250 21 4 13 12 6 7500 17 3 7 9 6 7500 18 2 8 9 6
Class D - 00 UTC Class D - 12 UTC
height max min median mean stdv height max min median mean stdv 124.26 8 0 1 2 3 124.26 8 0 2 3 3 1250 16 0 5 6 5 1250 14 0 6 6 5 2500 15 1 8 7 6 2500 14 0 8 7 6 3750 13 1 10 8 5 3750 17 1 10 8 5 5000 13 4 7 8 3 5000 17 3 8 8 4 6250 14 3 8 8 3 6250 13 3 8 8 3 7500 12 2 8 8 4 7500 19 2 8 9 5
Class E - 00 UTC Class E - 12 UTC height max min median mean stdv height max min median mean stdv 124.26 12 0 0 3 5 124.26 7 0 0 2 3 1250 27 0 4 8 10 1250 27 0 3 8 10 2500 47 0 11 17 17 2500 49 0 11 17 18 3750 63 3 24 28 23 3750 65 3 24 28 24 5000 81 11 45 45 27 5000 81 10 46 45 28 6250 88 17 61 57 27 6250 89 20 62 57 27 7500 93 30 73 68 23 7500 94 32 75 69 24
Danish Meteorological Institute Technical Report 04-25
www.dmi.dk/dmi/tr04-25 page 27 of 44
Class A+B+C - 00 UTC Class A+B+C - 12 UTC
height max min median mean stdv height max min median mean stdv 124.26 100 80 99 95 7 124.26 100 85 98 95 6 1250 100 61 92 86 14 1250 100 62 91 86 14 2500 99 42 80 76 22 2500 99 39 81 76 23 3750 95 26 65 64 26 3750 96 25 64 63 28 5000 85 15 43 48 28 5000 87 14 42 47 30 6250 74 9 30 36 25 6250 74 8 29 35 26 7500 58 4 20 24 20 7500 55 3 18 23 19

Danish Meteorological Institute Technical Report 04-25
www.dmi.dk/dmi/tr04-25 page 28 of 44
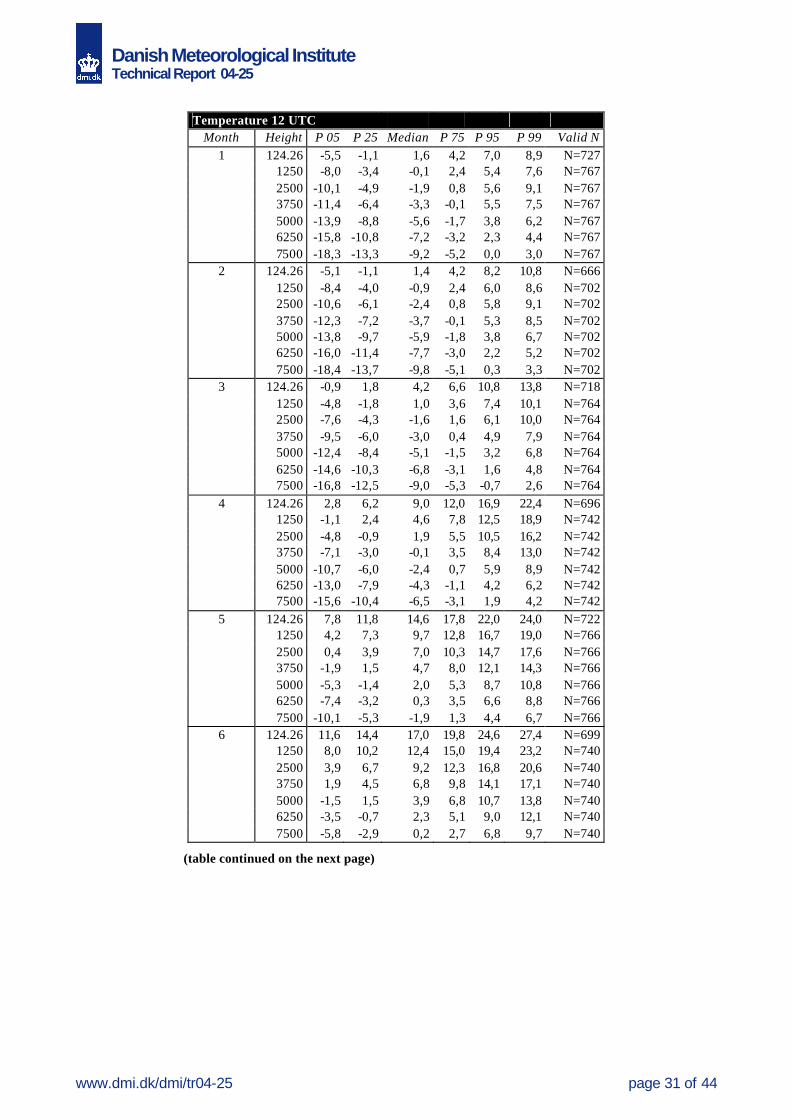
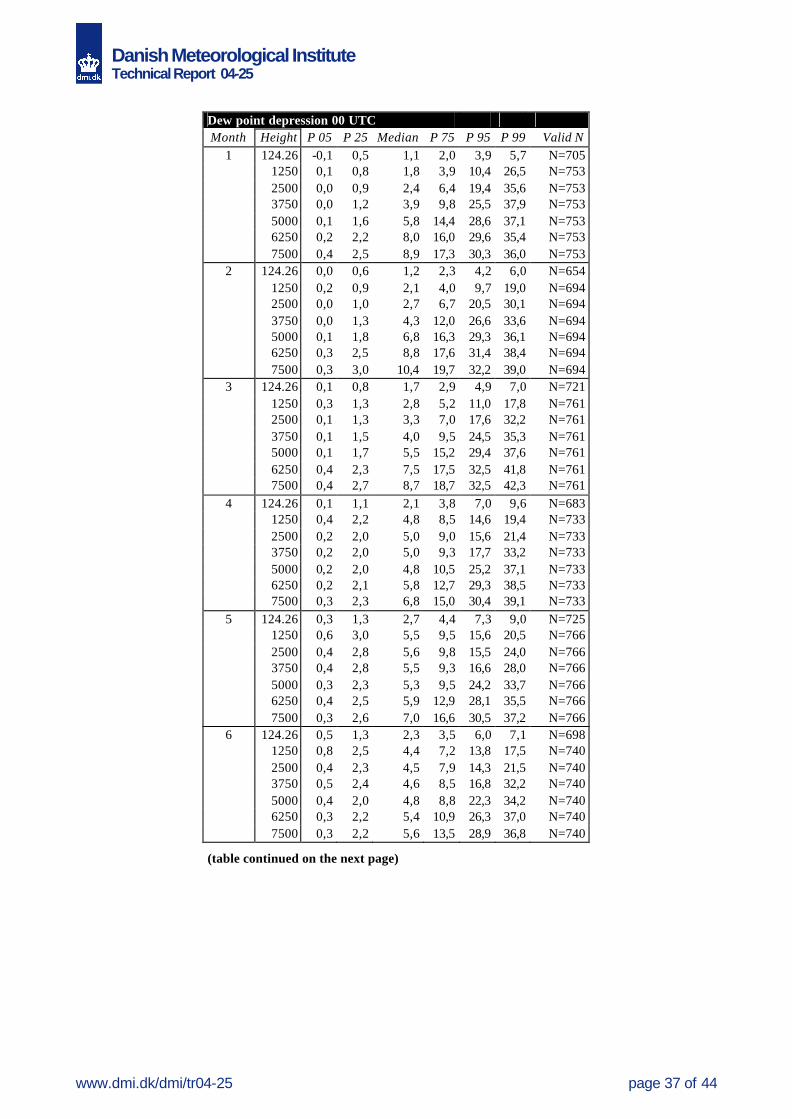
Appendix C Summary statistics (05, 25, 50, 75, 95 & 99 percentiles) of temperature, dew point temperature and dew point depression for nightly (00 UTC) and daily values (12 UTC).

Danish Meteorological Institute Technical Report 04-25
www.dmi.dk/dmi/tr04-25 page 29 of 44
Temperature 00 UTC Month Height P 05 P 25 Median P 75 P 95 P 99 Valid N
1 124.26 -9,0 -2,3 0,8 3,2 6,3 8,0 N=705 1250 -8,5 -3,5 -0,3 2,5 5,3 7,4 N=753 2500 -10,3 -5,2 -1,7 1,1 5,3 8,2 N=753 3750 -11,9 -6,5 -3,2 0,1 5,0 7,5 N=753 5000 -13,9 -8,7 -5,3 -1,8 3,8 5,8 N=753 6250 -16,2 -10,6 -7,0 -3,3 1,8 3,9 N=753 7500 -19,0 -12,9 -8,9 -5,1 -0,5 2,6 N=753 2 124.26 -7,1 -2,7 -0,1 3,0 6,5 9,0 N=654 1250 -8,4 -4,1 -1,0 1,8 5,7 8,6 N=694 2500 -10,6 -5,9 -2,5 0,2 5,8 8,3 N=694 3750 -11,9 -7,2 -3,8 -0,2 4,8 7,7 N=694 5000 -14,3 -9,5 -6,0 -2,2 3,2 6,4 N=694 6250 -16,1 -11,5 -7,8 -3,7 1,4 4,9 N=694 7500 -18,6 -13,8 -10,0 -5,6 -0,6 1,8 N=694 3 124.26 -3,3 -0,5 1,6 3,8 7,2 9,0 N=721 1250 -5,0 -2,1 0,8 3,4 7,0 9,8 N=761 2500 -7,6 -4,4 -1,6 1,7 6,3 9,7 N=761 3750 -9,5 -5,9 -3,0 0,3 5,1 8,1 N=761 5000 -12,2 -8,6 -5,3 -1,8 2,9 6,9 N=761 6250 -14,8 -10,3 -6,9 -3,6 0,9 5,0 N=761 7500 -17,1 -12,6 -9,2 -5,4 -1,1 1,9 N=761 4 124.26 0,0 3,0 4,6 7,0 10,4 13,2 N=683 1250 -1,2 1,7 4,1 7,1 12,3 18,5 N=733 2500 -4,5 -1,0 2,0 5,3 10,4 17,2 N=733 3750 -6,8 -2,9 0,3 3,6 9,1 14,1 N=733 5000 -10,2 -5,9 -2,5 1,0 5,9 8,9 N=733 6250 -12,9 -7,9 -4,3 -0,8 3,6 6,3 N=733 7500 -15,7 -10,2 -6,5 -3,0 1,1 3,8 N=733 5 124.26 4,5 7,0 9,4 11,4 13,8 15,6 N=725 1250 3,0 6,2 9,0 11,9 16,0 18,5 N=766 2500 0,1 3,6 6,9 10,4 15,1 17,2 N=766 3750 -1,8 1,8 4,7 8,5 12,6 14,2 N=766 5000 -5,2 -1,2 2,2 5,4 9,3 10,9 N=766 6250 -7,2 -3,0 0,1 3,6 7,2 8,7 N=766 7500 -10,0 -5,1 -2,2 1,1 4,4 6,6 N=766 6 124.26 8,2 10,8 12,2 14,2 17,0 18,6 N=698 1250 7,0 9,3 11,3 14,0 18,6 21,1 N=740 2500 3,5 6,3 8,8 12,1 16,9 20,1 N=740 3750 1,9 4,5 7,0 10,0 14,4 17,0 N=740 5000 -1,0 1,6 4,2 7,2 11,3 14,1 N=740 6250 -3,3 -0,5 2,3 5,4 9,5 12,3 N=740 7500 -5,8 -2,8 -0,1 3,3 7,2 9,9 N=740
(table continued on the next page)

Danish Meteorological Institute Technical Report 04-25
www.dmi.dk/dmi/tr04-25 page 30 of 44
Temperature 00 UTC (continued) Month Height P 05 P 25 Median P 75 P 95 P 99 Valid N
7 124.26 11,0 13,0 14,6 16,2 19,2 21,4 N=702 1250 9,4 11,6 13,7 16,5 20,3 23,2 N=752 2500 6,3 9,0 11,6 14,8 18,9 21,6 N=752 3750 4,4 7,1 9,5 12,4 16,7 18,5 N=752 5000 1,5 4,1 6,4 9,3 13,2 15,0 N=752 6250 -0,9 2,2 4,5 7,6 11,4 13,1 N=752 7500 -3,3 0,0 2,3 5,4 8,8 10,7 N=752 8 124.26 10,6 12,6 14,5 16,4 18,6 20,0 N=690 1250 9,7 11,7 13,9 16,7 20,5 22,5 N=730 2500 6,6 8,8 11,4 15,0 18,9 21,0 N=730 3750 4,6 6,7 9,5 12,6 15,9 18,7 N=730 5000 1,2 3,9 6,6 9,6 12,6 15,0 N=730 6250 -0,9 2,2 4,9 7,7 11,0 13,1 N=730 7500 -3,4 -0,1 2,7 5,5 8,6 9,9 N=730 9 124.26 7,4 10,0 11,6 13,2 15,6 17,6 N=663 1250 6,5 9,0 10,6 12,4 16,4 18,5 N=708 2500 3,5 6,1 8,1 10,2 14,9 16,9 N=708 3750 1,3 4,1 6,2 8,5 13,0 15,8 N=708 5000 -1,6 1,2 3,5 6,4 10,6 12,6 N=708 6250 -3,4 -0,5 2,1 4,9 9,3 11,5 N=708 7500 -6,0 -2,6 0,1 3,0 6,7 9,4 N=708
10 124.26 2,2 5,8 8,6 10,7 13,1 14,7 N=649 1250 1,8 5,0 7,3 9,6 12,8 16,3 N=724 2500 -1,1 2,6 5,0 7,8 12,5 16,1 N=724 3750 -3,1 0,7 3,3 6,8 10,9 14,7 N=724 5000 -6,0 -2,0 1,0 4,8 9,0 12,7 N=724 6250 -8,1 -4,0 -0,5 3,2 7,5 10,3 N=724 7500 -10,7 -6,1 -2,4 1,4 5,0 7,6 N=724
11 124.26 -1,7 2,0 4,4 6,8 9,1 10,8 N=632 1250 -3,0 0,6 3,2 5,3 8,0 10,2 N=703 2500 -5,7 -1,8 0,9 3,7 7,4 10,8 N=703 3750 -7,5 -3,4 -0,5 2,7 7,3 10,1 N=703 5000 -10,3 -5,7 -2,9 0,8 5,8 8,8 N=703 6250 -12,5 -7,6 -4,3 -0,7 4,1 6,7 N=703 7500 -14,2 -9,6 -6,4 -2,3 1,8 4,7 N=703
12 124.26 -5,7 -0,7 1,6 4,2 7,4 9,3 N=641 1250 -5,9 -2,2 0,3 2,8 6,3 8,2 N=716 2500 -8,2 -4,0 -1,3 1,6 5,7 8,4 N=716 3750 -9,8 -5,6 -2,8 0,6 5,3 8,4 N=716 5000 -12,9 -8,1 -4,8 -1,4 3,9 6,8 N=716 6250 -15,2 -9,9 -6,4 -2,8 2,6 4,9 N=716 7500 -17,5 -12,2 -8,3 -4,4 0,5 2,7 N=716
Danish Meteorological Institute Technical Report 04-25
www.dmi.dk/dmi/tr04-25 page 31 of 44
Temperature 12 UTC
Month Height P 05 P 25 Median P 75 P 95 P 99 Valid N 1 124.26 -5,5 -1,1 1,6 4,2 7,0 8,9 N=727 1250 -8,0 -3,4 -0,1 2,4 5,4 7,6 N=767 2500 -10,1 -4,9 -1,9 0,8 5,6 9,1 N=767 3750 -11,4 -6,4 -3,3 -0,1 5,5 7,5 N=767 5000 -13,9 -8,8 -5,6 -1,7 3,8 6,2 N=767 6250 -15,8 -10,8 -7,2 -3,2 2,3 4,4 N=767 7500 -18,3 -13,3 -9,2 -5,2 0,0 3,0 N=767 2 124.26 -5,1 -1,1 1,4 4,2 8,2 10,8 N=666 1250 -8,4 -4,0 -0,9 2,4 6,0 8,6 N=702 2500 -10,6 -6,1 -2,4 0,8 5,8 9,1 N=702 3750 -12,3 -7,2 -3,7 -0,1 5,3 8,5 N=702 5000 -13,8 -9,7 -5,9 -1,8 3,8 6,7 N=702 6250 -16,0 -11,4 -7,7 -3,0 2,2 5,2 N=702 7500 -18,4 -13,7 -9,8 -5,1 0,3 3,3 N=702 3 124.26 -0,9 1,8 4,2 6,6 10,8 13,8 N=718 1250 -4,8 -1,8 1,0 3,6 7,4 10,1 N=764 2500 -7,6 -4,3 -1,6 1,6 6,1 10,0 N=764 3750 -9,5 -6,0 -3,0 0,4 4,9 7,9 N=764 5000 -12,4 -8,4 -5,1 -1,5 3,2 6,8 N=764 6250 -14,6 -10,3 -6,8 -3,1 1,6 4,8 N=764 7500 -16,8 -12,5 -9,0 -5,3 -0,7 2,6 N=764 4 124.26 2,8 6,2 9,0 12,0 16,9 22,4 N=696 1250 -1,1 2,4 4,6 7,8 12,5 18,9 N=742 2500 -4,8 -0,9 1,9 5,5 10,5 16,2 N=742 3750 -7,1 -3,0 -0,1 3,5 8,4 13,0 N=742 5000 -10,7 -6,0 -2,4 0,7 5,9 8,9 N=742 6250 -13,0 -7,9 -4,3 -1,1 4,2 6,2 N=742 7500 -15,6 -10,4 -6,5 -3,1 1,9 4,2 N=742 5 124.26 7,8 11,8 14,6 17,8 22,0 24,0 N=722 1250 4,2 7,3 9,7 12,8 16,7 19,0 N=766 2500 0,4 3,9 7,0 10,3 14,7 17,6 N=766 3750 -1,9 1,5 4,7 8,0 12,1 14,3 N=766 5000 -5,3 -1,4 2,0 5,3 8,7 10,8 N=766 6250 -7,4 -3,2 0,3 3,5 6,6 8,8 N=766 7500 -10,1 -5,3 -1,9 1,3 4,4 6,7 N=766 6 124.26 11,6 14,4 17,0 19,8 24,6 27,4 N=699 1250 8,0 10,2 12,4 15,0 19,4 23,2 N=740 2500 3,9 6,7 9,2 12,3 16,8 20,6 N=740 3750 1,9 4,5 6,8 9,8 14,1 17,1 N=740 5000 -1,5 1,5 3,9 6,8 10,7 13,8 N=740 6250 -3,5 -0,7 2,3 5,1 9,0 12,1 N=740 7500 -5,8 -2,9 0,2 2,7 6,8 9,7 N=740
(table continued on the next page)

Danish Meteorological Institute Technical Report 04-25
www.dmi.dk/dmi/tr04-25 page 32 of 44
Temperature 12 UTC (continued)
Month Height P 05 P 25 Median P 75 P 95 P 99 Valid N 7 124.26 14,2 17,0 19,4 22,2 26,4 28,4 N=700 1250 10,4 12,7 14,8 17,2 21,6 23,7 N=749 2500 6,3 9,2 11,5 14,7 18,9 21,7 N=749 3750 4,3 7,0 9,1 11,8 16,3 18,3 N=749 5000 1,2 4,0 6,4 9,1 13,0 15,2 N=749 6250 -0,7 2,1 4,5 7,4 11,0 13,1 N=749 7500 -3,1 -0,2 2,3 5,1 9,0 12,5 N=749 8 124.26 14,6 16,8 19,0 21,6 25,8 28,0 N=692 1250 10,9 12,7 14,7 17,6 21,3 24,1 N=737 2500 6,6 9,2 11,6 14,9 18,9 22,0 N=737 3750 4,5 6,8 9,0 12,2 15,5 19,6 N=737 5000 1,0 3,6 6,5 9,4 12,4 15,5 N=737 6250 -1,2 1,9 4,8 7,7 10,7 13,0 N=737 7500 -3,6 -0,3 2,5 5,3 8,6 10,7 N=737 9 124.26 11,2 13,6 15,2 17,2 20,6 22,8 N=663 1250 7,5 9,9 11,4 13,2 16,7 19,1 N=709 2500 4,0 6,5 8,2 10,4 15,1 17,7 N=709 3750 1,5 4,1 6,1 8,5 13,1 15,8 N=709 5000 -1,6 1,3 3,5 6,5 11,1 13,1 N=709 6250 -3,6 -0,5 2,1 5,0 9,5 11,2 N=709 7500 -5,8 -2,7 0,2 3,1 7,2 9,5 N=709
10 124.26 5,4 8,8 10,8 12,8 16,0 18,8 N=658 1250 1,6 5,4 7,8 9,9 13,0 16,1 N=735 2500 -1,3 2,3 4,9 7,7 12,7 16,8 N=735 3750 -3,2 0,5 3,2 6,2 11,4 15,2 N=735 5000 -6,6 -2,1 1,1 4,8 9,5 12,5 N=735 6250 -8,5 -3,8 -0,4 3,3 8,0 10,4 N=735 7500 -10,6 -6,0 -2,2 1,6 5,5 8,2 N=735
11 124.26 0,4 3,6 6,0 8,0 10,4 11,7 N=639 1250 -2,7 0,7 3,4 5,5 8,0 10,0 N=714 2500 -5,7 -1,9 0,9 3,8 7,5 10,2 N=714 3750 -7,3 -3,4 -0,4 2,5 6,9 9,8 N=714 5000 -10,3 -5,6 -2,5 0,6 5,3 7,6 N=714 6250 -12,3 -7,2 -4,2 -0,8 3,7 6,6 N=714 7500 -14,5 -9,7 -6,1 -2,5 1,9 4,9 N=714
12 124.26 -3,5 0,4 2,6 4,8 8,0 10,0 N=643 1250 -6,3 -1,8 0,6 3,1 6,0 8,5 N=727 2500 -8,6 -3,9 -1,1 1,3 5,3 8,1 N=727 3750 -10,2 -5,5 -2,4 0,4 4,8 7,4 N=727 5000 -12,9 -7,9 -4,6 -1,3 3,8 6,4 N=727 6250 -15,0 -9,9 -6,2 -2,7 2,3 5,1 N=727 7500 -17,2 -12,1 -8,2 -4,4 0,3 3,6 N=727

Danish Meteorological Institute Technical Report 04-25
www.dmi.dk/dmi/tr04-25 page 33 of 44
Dew point temperature 00 UTC Month Height P 05 P 25 Median P 75 P 95 P 99 Valid N
1 124.26 -11,2 -4,1 -0,1 1,9 5,3 6,9 N=705 1250 -15,7 -7,6 -2,6 0,4 3,9 6,2 N=753 2500 -23,5 -10,5 -5,3 -1,6 2,9 4,9 N=753 3750 -28,2 -14,8 -8,5 -4,0 1,4 4,1 N=753 5000 -32,8 -21,2 -12,7 -6,9 -1,0 2,0 N=753 6250 -35,9 -24,2 -16,1 -9,8 -3,0 0,5 N=753 7500 -39,8 -27,7 -19,2 -12,5 -4,7 -1,1 N=753 2 124.26 -10,2 -4,2 -1,1 1,9 4,9 7,9 N=654 1250 -14,2 -7,8 -3,6 -0,1 4,1 6,6 N=694 2500 -22,3 -11,7 -6,6 -2,6 2,8 6,2 N=694 3750 -28,7 -16,3 -10,0 -5,1 1,3 4,6 N=694 5000 -34,0 -22,5 -14,2 -8,4 -0,8 1,9 N=694 6250 -38,7 -26,2 -17,6 -11,4 -2,8 0,9 N=694 7500 -42,4 -29,4 -21,2 -14,2 -4,4 -1,1 N=694 3 124.26 -6,9 -2,3 -0,1 1,9 5,9 7,8 N=721 1250 -11,7 -6,1 -2,5 0,4 4,2 6,4 N=761 2500 -19,7 -9,4 -5,4 -2,0 2,2 4,4 N=761 3750 -27,7 -13,2 -8,1 -3,8 0,6 3,3 N=761 5000 -33,2 -20,7 -12,2 -6,8 -1,6 0,4 N=761 6250 -38,2 -25,2 -15,7 -9,4 -3,6 -1,3 N=761 7500 -40,7 -28,4 -18,9 -12,0 -5,8 -3,4 N=761 4 124.26 -4,1 -0,1 2,7 4,9 7,9 9,9 N=683 1250 -10,1 -4,1 -0,6 2,2 6,1 8,0 N=733 2500 -13,4 -6,8 -3,1 0,3 4,6 7,5 N=733 3750 -17,7 -9,6 -4,8 -1,1 3,0 5,9 N=733 5000 -26,3 -14,3 -8,1 -4,1 0,4 3,3 N=733 6250 -32,9 -19,2 -11,7 -6,4 -1,2 1,5 N=733 7500 -36,3 -22,7 -14,7 -9,1 -3,6 -0,8 N=733 5 124.26 0,8 3,9 6,0 8,9 10,9 12,9 N=725 1250 -5,4 -0,1 2,9 5,9 9,1 11,4 N=766 2500 -8,1 -2,4 0,9 3,9 7,8 9,9 N=766 3750 -11,1 -4,6 -1,1 2,3 6,4 8,7 N=766 5000 -19,9 -8,6 -3,8 -0,2 3,9 6,5 N=766 6250 -28,1 -13,3 -7,1 -2,4 2,1 5,4 N=766 7500 -32,6 -18,2 -10,3 -5,1 -0,3 3,1 N=766 6 124.26 5,0 7,9 9,9 11,7 14,9 16,3 N=698 1250 0,6 4,4 6,5 8,9 11,9 14,4 N=740 2500 -2,4 1,6 4,0 6,4 10,4 12,8 N=740 3750 -8,0 -0,8 1,9 4,4 8,6 10,7 N=740 5000 -15,9 -4,5 -1,3 1,8 6,2 8,6 N=740 6250 -21,9 -9,1 -3,8 -0,3 4,4 7,3 N=740 7500 -28,2 -13,7 -6,6 -2,7 2,4 4,9 N=740
(table continued on the next page)

Danish Meteorological Institute Technical Report 04-25
www.dmi.dk/dmi/tr04-25 page 34 of 44
Dew point temperature 00 UTC (continued) Month Height P 05 P 25 Median P 75 P 95 P 99 Valid N
7 124.26 7,9 10,6 11,9 13,9 16,9 18,0 N=702 1250 2,9 6,4 8,8 10,9 13,9 15,9 N=752 2500 -0,2 3,9 6,3 8,7 12,2 14,2 N=752 3750 -5,0 1,3 4,0 6,9 9,9 12,4 N=752 5000 -13,0 -2,1 1,1 3,9 7,9 10,0 N=752 6250 -17,2 -5,6 -1,4 1,9 5,6 8,1 N=752 7500 -22,0 -9,8 -4,1 -0,5 2,9 5,6 N=752 8 124.26 7,9 10,1 11,9 13,9 16,9 17,9 N=690 1250 3,8 6,9 8,9 11,1 14,2 15,9 N=730 2500 0,9 4,2 6,4 8,9 11,9 14,4 N=730 3750 -4,1 1,6 4,2 6,9 10,3 12,6 N=730 5000 -12,7 -2,9 0,6 4,0 7,6 10,3 N=730 6250 -18,6 -6,8 -2,3 1,6 5,6 8,1 N=730 7500 -23,7 -11,3 -5,1 -1,1 3,3 5,4 N=730 9 124.26 4,9 7,9 9,9 11,9 13,9 15,5 N=663 1250 0,9 4,4 6,9 8,9 11,9 13,9 N=708 2500 -2,7 1,6 4,0 6,6 9,9 11,9 N=708 3750 -13,2 -1,6 1,6 4,6 8,1 10,4 N=708 5000 -22,1 -6,4 -1,7 1,6 5,4 7,8 N=708 6250 -26,0 -12,5 -4,4 -0,3 3,4 5,1 N=708 7500 -29,5 -16,9 -7,7 -2,8 1,4 3,1 N=708
10 124.26 -0,1 4,0 6,9 9,8 12,4 12,9 N=649 1250 -3,8 1,3 4,4 7,4 10,4 12,3 N=724 2500 -9,6 -1,6 1,6 4,7 8,9 10,4 N=724 3750 -18,7 -5,6 -1,1 2,7 6,9 8,9 N=724 5000 -25,1 -11,7 -4,9 -0,6 4,4 6,7 N=724 6250 -29,2 -16,2 -8,1 -2,4 2,9 5,4 N=724 7500 -33,2 -20,3 -11,8 -4,6 0,6 3,2 N=724
11 124.26 -4,1 -0,1 2,9 5,6 7,9 9,9 N=632 1250 -8,6 -2,6 0,9 3,4 6,4 8,4 N=703 2500 -13,9 -6,1 -2,4 0,6 4,9 7,6 N=703 3750 -22,7 -9,1 -4,6 -1,1 3,4 6,2 N=703 5000 -29,6 -14,7 -8,1 -3,8 0,7 4,4 N=703 6250 -32,7 -20,2 -11,9 -6,0 -0,8 2,9 N=703 7500 -37,2 -23,2 -15,7 -8,6 -2,7 0,5 N=703
12 124.26 -8,1 -2,1 0,7 2,9 6,5 7,9 N=641 1250 -11,5 -5,1 -1,6 1,1 5,0 7,1 N=716 2500 -22,7 -8,4 -4,5 -1,1 3,2 6,1 N=716 3750 -27,9 -12,9 -7,6 -3,1 2,4 5,0 N=716 5000 -32,4 -18,4 -11,7 -6,3 0,1 3,2 N=716 6250 -36,6 -22,9 -15,5 -8,6 -2,1 1,2 N=716 7500 -39,7 -26,2 -18,2 -11,3 -4,1 -0,9 N=716

Danish Meteorological Institute Technical Report 04-25
www.dmi.dk/dmi/tr04-25 page 35 of 44
Dew point temperature 12 UTC Month Height P 05 P 25 Median P 75 P 95 P 99 Valid N
1 124.26 -9,5 -3,1 -0,1 2,3 5,5 6,9 N=727 1250 -15,2 -7,6 -2,6 0,4 3,6 5,9 N=767 2500 -23,4 -10,9 -5,6 -1,8 2,4 4,4 N=767 3750 -29,0 -16,2 -9,1 -4,3 0,9 3,0 N=767 5000 -35,7 -22,4 -13,7 -7,8 -1,5 0,9 N=767 6250 -38,2 -26,5 -17,7 -10,2 -3,1 -0,4 N=767 7500 -40,7 -29,2 -20,5 -13,7 -5,5 -2,3 N=767 2 124.26 -9,1 -4,1 -1,1 1,9 5,9 7,8 N=666 1250 -14,7 -8,1 -3,6 -0,1 4,4 5,9 N=702 2500 -22,9 -12,2 -7,1 -2,7 2,6 5,0 N=702 3750 -28,1 -17,2 -10,4 -5,2 1,1 4,0 N=702 5000 -33,2 -21,7 -14,3 -8,6 -1,6 1,4 N=702 6250 -36,5 -25,7 -17,5 -11,2 -3,4 -0,8 N=702 7500 -39,2 -28,8 -20,7 -14,2 -6,1 -2,9 N=702 3 124.26 -7,1 -2,1 0,2 2,9 6,9 7,9 N=718 1250 -11,7 -6,6 -2,6 0,4 4,4 5,9 N=764 2500 -18,6 -9,6 -5,3 -2,1 2,6 4,7 N=764 3750 -27,4 -14,3 -8,4 -4,0 0,9 3,3 N=764 5000 -34,1 -20,7 -12,7 -7,1 -2,1 0,7 N=764 6250 -38,2 -24,7 -16,3 -9,5 -3,8 -0,7 N=764 7500 -41,5 -28,7 -19,7 -11,9 -5,8 -2,9 N=764 4 124.26 -6,1 -0,1 2,9 5,9 8,9 11,9 N=696 1250 -10,3 -4,1 -0,6 2,4 5,9 8,9 N=742 2500 -12,5 -6,4 -2,6 0,2 4,1 6,9 N=742 3750 -19,2 -9,1 -5,1 -1,7 2,5 4,9 N=742 5000 -27,7 -14,7 -8,6 -4,8 -0,5 2,9 N=742 6250 -32,3 -18,8 -11,9 -7,1 -2,4 1,3 N=742 7500 -36,9 -23,2 -15,2 -9,6 -4,4 -1,4 N=742 5 124.26 -0,1 3,9 6,9 9,9 12,9 13,9 N=722 1250 -5,1 0,4 2,9 6,1 9,0 11,4 N=766 2500 -7,1 -1,6 1,2 4,2 7,4 8,9 N=766 3750 -13,9 -4,4 -0,9 2,3 5,9 7,9 N=766 5000 -21,7 -9,1 -4,2 -0,6 3,4 5,9 N=766 6250 -28,0 -13,9 -7,1 -2,7 1,6 4,6 N=766 7500 -31,7 -18,8 -10,3 -5,3 -0,6 2,2 N=766 6 124.26 4,9 7,9 10,6 12,4 15,9 17,8 N=699 1250 0,9 4,3 6,8 8,9 12,3 14,4 N=740 2500 -1,1 1,9 4,5 6,9 10,2 12,2 N=740 3750 -6,1 -0,4 2,1 4,4 8,2 10,3 N=740 5000 -15,3 -4,1 -1,1 1,5 5,7 7,8 N=740 6250 -20,5 -7,6 -3,8 -0,4 3,9 6,0 N=740 7500 -24,7 -11,7 -6,8 -3,1 1,6 3,5 N=740
(table continued on the next page)

Danish Meteorological Institute Technical Report 04-25
www.dmi.dk/dmi/tr04-25 page 36 of 44
Dew point temperature 12 UTC (continued) Month Height P 05 P 25 Median P 75 P 95 P 99 Valid N
7 124.26 7,6 10,9 12,9 14,9 17,6 19,9 N=700 1250 3,4 6,7 8,9 10,9 13,6 15,6 N=749 2500 1,7 4,7 6,9 8,6 11,7 13,8 N=749 3750 -4,0 1,9 4,4 6,6 9,9 11,7 N=749 5000 -12,7 -1,8 0,9 3,5 6,9 8,9 N=749 6250 -18,5 -5,6 -1,6 1,3 5,1 7,5 N=749 7500 -22,9 -10,5 -4,6 -1,3 2,9 6,0 N=749 8 124.26 7,9 10,8 12,9 14,9 17,3 19,2 N=692 1250 3,9 6,9 8,9 10,9 13,9 16,1 N=737 2500 1,6 4,6 6,9 9,2 12,2 14,2 N=737 3750 -3,1 1,9 4,4 7,2 10,1 12,6 N=737 5000 -12,4 -2,4 0,6 3,9 7,4 9,7 N=737 6250 -16,7 -6,1 -2,1 1,2 5,4 7,7 N=737 7500 -22,5 -12,2 -5,3 -1,6 2,9 4,9 N=737 9 124.26 4,6 8,0 10,2 12,2 14,9 16,8 N=663 1250 0,9 4,6 6,9 9,1 11,9 13,9 N=709 2500 -2,2 1,9 4,3 6,9 9,7 11,9 N=709 3750 -10,2 -1,1 1,9 4,4 7,9 9,8 N=709 5000 -20,4 -6,4 -1,8 1,2 5,5 6,9 N=709 6250 -24,7 -11,2 -4,6 -1,1 3,2 5,2 N=709 7500 -28,2 -16,7 -7,6 -3,2 1,1 2,7 N=709
10 124.26 0,9 4,9 6,9 9,9 12,9 14,9 N=658 1250 -3,9 0,9 4,4 7,3 10,2 11,7 N=735 2500 -8,4 -1,8 1,2 4,4 8,2 10,7 N=735 3750 -18,3 -6,1 -1,1 2,2 6,6 9,8 N=735 5000 -26,2 -11,7 -5,1 -1,1 4,4 7,1 N=735 6250 -29,7 -16,9 -8,6 -3,1 2,4 6,4 N=735 7500 -32,7 -21,0 -12,6 -5,6 -0,1 3,7 N=735
11 124.26 -4,1 0,5 3,9 5,9 8,5 9,9 N=639 1250 -8,1 -2,6 0,9 3,7 6,7 8,4 N=714 2500 -14,2 -6,1 -2,4 0,9 4,9 6,9 N=714 3750 -22,5 -10,2 -4,6 -1,1 3,1 5,9 N=714 5000 -30,2 -16,0 -9,1 -4,3 0,6 3,4 N=714 6250 -33,5 -20,6 -13,2 -6,4 -1,1 1,9 N=714 7500 -36,2 -24,2 -16,6 -9,1 -3,1 -0,1 N=714
12 124.26 -6,1 -1,8 0,9 3,9 5,9 8,9 N=643 1250 -11,1 -5,1 -1,6 1,4 4,9 7,2 N=727 2500 -19,7 -8,6 -4,6 -1,1 3,4 5,7 N=727 3750 -27,2 -13,0 -7,3 -3,1 1,9 4,7 N=727 5000 -34,0 -18,7 -11,9 -6,6 -0,8 2,3 N=727 6250 -37,8 -23,2 -15,2 -9,1 -2,5 1,5 N=727 7500 -39,0 -26,2 -18,5 -11,4 -4,5 -0,6 N=727
Danish Meteorological Institute Technical Report 04-25
www.dmi.dk/dmi/tr04-25 page 37 of 44
Dew point depression 00 UTC Month Height P 05 P 25 Median P 75 P 95 P 99 Valid N
1 124.26 -0,1 0,5 1,1 2,0 3,9 5,7 N=705 1250 0,1 0,8 1,8 3,9 10,4 26,5 N=753 2500 0,0 0,9 2,4 6,4 19,4 35,6 N=753 3750 0,0 1,2 3,9 9,8 25,5 37,9 N=753 5000 0,1 1,6 5,8 14,4 28,6 37,1 N=753 6250 0,2 2,2 8,0 16,0 29,6 35,4 N=753 7500 0,4 2,5 8,9 17,3 30,3 36,0 N=753 2 124.26 0,0 0,6 1,2 2,3 4,2 6,0 N=654 1250 0,2 0,9 2,1 4,0 9,7 19,0 N=694 2500 0,0 1,0 2,7 6,7 20,5 30,1 N=694 3750 0,0 1,3 4,3 12,0 26,6 33,6 N=694 5000 0,1 1,8 6,8 16,3 29,3 36,1 N=694 6250 0,3 2,5 8,8 17,6 31,4 38,4 N=694 7500 0,3 3,0 10,4 19,7 32,2 39,0 N=694 3 124.26 0,1 0,8 1,7 2,9 4,9 7,0 N=721 1250 0,3 1,3 2,8 5,2 11,0 17,8 N=761 2500 0,1 1,3 3,3 7,0 17,6 32,2 N=761 3750 0,1 1,5 4,0 9,5 24,5 35,3 N=761 5000 0,1 1,7 5,5 15,2 29,4 37,6 N=761 6250 0,4 2,3 7,5 17,5 32,5 41,8 N=761 7500 0,4 2,7 8,7 18,7 32,5 42,3 N=761 4 124.26 0,1 1,1 2,1 3,8 7,0 9,6 N=683 1250 0,4 2,2 4,8 8,5 14,6 19,4 N=733 2500 0,2 2,0 5,0 9,0 15,6 21,4 N=733 3750 0,2 2,0 5,0 9,3 17,7 33,2 N=733 5000 0,2 2,0 4,8 10,5 25,2 37,1 N=733 6250 0,2 2,1 5,8 12,7 29,3 38,5 N=733 7500 0,3 2,3 6,8 15,0 30,4 39,1 N=733 5 124.26 0,3 1,3 2,7 4,4 7,3 9,0 N=725 1250 0,6 3,0 5,5 9,5 15,6 20,5 N=766 2500 0,4 2,8 5,6 9,8 15,5 24,0 N=766 3750 0,4 2,8 5,5 9,3 16,6 28,0 N=766 5000 0,3 2,3 5,3 9,5 24,2 33,7 N=766 6250 0,4 2,5 5,9 12,9 28,1 35,5 N=766 7500 0,3 2,6 7,0 16,6 30,5 37,2 N=766 6 124.26 0,5 1,3 2,3 3,5 6,0 7,1 N=698 1250 0,8 2,5 4,4 7,2 13,8 17,5 N=740 2500 0,4 2,3 4,5 7,9 14,3 21,5 N=740 3750 0,5 2,4 4,6 8,5 16,8 32,2 N=740 5000 0,4 2,0 4,8 8,8 22,3 34,2 N=740 6250 0,3 2,2 5,4 10,9 26,3 37,0 N=740 7500 0,3 2,2 5,6 13,5 28,9 36,8 N=740
(table continued on the next page)

Danish Meteorological Institute Technical Report 04-25
www.dmi.dk/dmi/tr04-25 page 38 of 44
Dew point depression 00 UTC (continued) Month Height P 05 P 25 Median P 75 P 95 P 99 Valid N
7 124.26 0,5 1,3 2,3 3,4 5,7 8,1 N=702 1250 1,0 2,6 4,7 7,6 14,0 17,1 N=752 2500 0,5 2,6 4,8 8,4 14,4 20,0 N=752 3750 0,4 2,7 4,8 8,1 16,7 30,3 N=752 5000 0,4 2,3 4,4 8,9 22,5 31,8 N=752 6250 0,6 2,4 5,1 10,6 24,0 33,4 N=752 7500 0,5 2,4 5,7 12,6 26,3 36,0 N=752 8 124.26 0,5 1,1 1,9 3,1 5,3 7,0 N=690 1250 1,0 2,9 4,7 7,3 12,7 16,1 N=730 2500 0,7 2,9 4,7 7,7 13,2 18,1 N=730 3750 0,7 2,8 4,6 7,5 14,4 22,5 N=730 5000 0,7 2,7 5,0 9,5 20,7 27,1 N=730 6250 0,7 2,9 5,7 12,6 24,3 31,7 N=730 7500 0,5 2,8 7,4 14,4 27,1 36,7 N=730 9 124.26 0,3 0,9 1,5 2,5 4,7 6,0 N=663 1250 0,5 2,1 3,6 5,5 9,5 12,9 N=708 2500 0,2 1,8 3,8 6,2 11,0 16,6 N=708 3750 0,3 2,0 4,2 7,4 19,8 32,0 N=708 5000 0,2 1,9 4,5 10,8 27,2 36,2 N=708 6250 0,2 2,1 5,6 14,5 29,2 36,3 N=708 7500 0,2 2,0 7,0 17,5 31,4 37,4 N=708
10 124.26 0,1 0,7 1,1 2,1 4,2 6,1 N=649 1250 0,4 1,5 2,7 4,6 7,9 11,9 N=724 2500 0,1 1,5 3,1 5,4 12,9 27,2 N=724 3750 0,1 1,6 3,6 8,0 22,0 31,6 N=724 5000 0,1 1,5 4,3 12,2 27,8 36,3 N=724 6250 0,1 1,7 6,5 14,7 30,0 36,8 N=724 7500 0,2 2,1 7,9 17,3 31,2 38,5 N=724
11 124.26 0,1 0,6 1,3 2,2 4,3 5,6 N=632 1250 0,3 1,0 2,0 3,7 7,7 13,4 N=703 2500 0,0 0,9 2,4 5,0 14,0 24,2 N=703 3750 0,1 1,1 3,3 7,7 23,4 33,5 N=703 5000 0,1 1,4 4,3 10,7 28,3 37,4 N=703 6250 0,2 1,8 6,0 15,0 30,7 38,6 N=703 7500 0,4 2,5 7,9 16,0 31,6 41,3 N=703
12 124.26 -0,1 0,5 1,1 2,0 4,1 7,3 N=641 1250 0,1 0,7 1,7 3,2 8,4 15,2 N=716 2500 0,0 0,7 2,2 5,7 19,7 33,8 N=716 3750 0,1 1,0 3,4 9,6 25,4 35,7 N=716 5000 0,2 1,3 5,4 13,3 28,3 35,9 N=716 6250 0,3 1,7 7,6 15,9 30,9 37,0 N=716 7500 0,4 2,3 8,6 17,2 30,3 38,3 N=716

Danish Meteorological Institute Technical Report 04-25
www.dmi.dk/dmi/tr04-25 page 39 of 44
Dew point depression 12 UTC
Month Height P 05 P 25 Median P 75 P 95 P 99 Valid N 1 124.26 0,0 0,7 1,6 2,8 5,0 8,0 N=727 1250 0,1 0,9 2,0 4,0 10,4 18,2 N=767 2500 0,0 1,0 2,7 6,6 19,8 32,0 N=767 3750 0,1 1,4 4,5 10,8 27,5 36,2 N=767 5000 0,3 2,2 7,1 15,4 30,5 40,8 N=767 6250 0,5 2,8 9,0 18,8 33,3 40,8 N=767 7500 0,6 3,4 10,2 19,3 33,7 43,8 N=767 2 124.26 0,0 1,1 2,2 3,7 6,9 8,0 N=666 1250 0,2 1,1 2,2 4,3 10,1 22,0 N=702 2500 0,0 0,9 2,9 7,5 21,0 31,1 N=702 3750 0,1 1,4 4,6 12,5 26,4 35,0 N=702 5000 0,3 2,1 6,9 16,3 29,9 38,0 N=702 6250 0,3 3,0 8,6 17,7 31,0 37,7 N=702 7500 0,7 3,6 9,8 19,5 31,3 41,8 N=702 3 124.26 0,3 1,7 3,8 6,3 10,0 12,0 N=718 1250 0,4 1,7 3,5 5,9 11,3 15,6 N=764 2500 0,3 1,4 3,2 6,3 18,3 27,5 N=764 3750 0,3 1,6 4,3 10,1 23,6 37,4 N=764 5000 0,6 2,3 6,6 15,0 30,5 38,4 N=764 6250 0,7 2,7 8,4 17,1 32,2 41,0 N=764 7500 0,8 3,2 9,7 18,5 32,9 40,9 N=764 4 124.26 0,7 3,9 7,0 9,7 15,0 18,4 N=696 1250 0,6 2,9 5,7 9,1 14,5 18,0 N=742 2500 0,3 2,0 4,8 8,2 14,4 18,8 N=742 3750 0,4 2,1 4,7 8,7 19,3 35,1 N=742 5000 0,4 2,1 5,1 10,8 26,3 34,5 N=742 6250 0,7 2,7 6,1 13,4 29,3 36,6 N=742 7500 0,9 2,9 7,4 15,8 30,8 38,3 N=742 5 124.26 1,1 5,0 8,0 11,0 16,0 19,2 N=722 1250 1,0 3,9 6,8 10,2 14,6 18,0 N=766 2500 0,6 2,6 5,5 9,4 14,1 22,0 N=766 3750 0,5 2,3 5,1 9,0 18,9 29,0 N=766 5000 0,5 2,3 5,3 10,8 24,1 36,7 N=766 6250 0,7 2,5 6,2 13,0 29,0 36,1 N=766 7500 0,9 2,9 7,3 16,5 28,9 35,6 N=766 6 124.26 1,1 4,3 7,0 9,1 14,2 17,0 N=699 1250 1,2 3,5 5,6 8,3 13,0 15,6 N=740 2500 0,6 2,4 4,3 7,5 13,0 17,8 N=740 3750 0,5 2,2 4,2 7,5 15,1 26,0 N=740 5000 0,4 2,0 4,4 8,0 22,0 32,8 N=740 6250 0,5 2,1 4,9 10,3 25,5 35,1 N=740 7500 0,4 2,5 5,7 12,2 27,2 36,1 N=740
(table continued on the next page)

Danish Meteorological Institute Technical Report 04-25
www.dmi.dk/dmi/tr04-25 page 40 of 44
Dew point depression 12 UTC (continued)
Month Height P 05 P 25 Median P 75 P 95 P 99 Valid N 7 124.26 1,3 4,8 7,1 9,5 13,0 15,6 N=700 1250 1,5 4,0 6,1 8,4 13,2 15,3 N=749 2500 0,7 2,6 4,6 7,3 12,8 16,6 N=749 3750 0,5 2,4 4,3 7,7 16,2 21,0 N=749 5000 0,6 2,6 4,7 8,4 21,9 32,0 N=749 6250 0,7 2,9 5,2 10,6 25,0 34,3 N=749 7500 0,7 3,1 6,4 13,1 27,1 35,3 N=749 8 124.26 1,3 4,7 6,9 9,0 12,2 16,1 N=692 1250 1,6 4,3 6,1 8,2 12,3 15,4 N=737 2500 0,7 2,7 4,7 7,1 12,4 14,9 N=737 3750 0,6 2,3 4,4 7,1 15,4 24,1 N=737 5000 0,6 2,4 4,8 8,6 19,8 31,7 N=737 6250 0,7 2,8 5,8 11,7 24,2 32,5 N=737 7500 0,8 3,0 6,8 14,8 26,2 36,0 N=737 9 124.26 0,9 3,1 5,3 7,3 10,2 12,5 N=663 1250 0,8 2,9 4,8 6,7 9,3 11,5 N=709 2500 0,5 2,2 4,0 6,0 10,5 16,3 N=709 3750 0,4 2,1 3,9 7,0 17,3 31,9 N=709 5000 0,4 2,1 4,5 11,0 26,5 35,3 N=709 6250 0,5 2,6 6,5 14,3 28,4 34,2 N=709 7500 0,5 2,5 8,0 17,4 29,0 35,4 N=709
10 124.26 0,3 1,9 3,5 5,1 7,3 9,9 N=658 1250 0,5 1,8 3,2 5,0 8,5 12,0 N=735 2500 0,3 1,5 3,2 5,6 14,0 21,6 N=735 3750 0,2 1,6 3,7 8,0 22,8 33,9 N=735 5000 0,2 2,0 4,8 12,4 27,7 37,9 N=735 6250 0,2 2,4 6,9 15,6 30,2 39,8 N=735 7500 0,3 3,2 9,5 17,8 31,2 38,2 N=735
11 124.26 0,1 1,0 2,1 3,6 6,5 8,7 N=639 1250 0,3 1,1 2,2 3,8 7,9 11,9 N=714 2500 0,1 1,0 2,4 5,4 13,9 25,7 N=714 3750 0,1 1,3 3,3 7,8 21,5 31,4 N=714 5000 0,2 1,8 5,1 12,6 27,8 38,9 N=714 6250 0,3 2,4 7,2 16,5 30,2 38,1 N=714 7500 0,6 2,8 8,5 17,3 31,1 37,4 N=714
12 124.26 0,1 0,6 1,5 2,5 4,7 8,4 N=643 1250 0,1 0,8 1,7 3,5 8,1 17,7 N=727 2500 0,0 0,8 2,1 5,5 17,9 33,6 N=727 3750 0,1 1,2 3,4 9,5 23,6 37,5 N=727 5000 0,2 1,9 6,3 13,6 29,6 39,9 N=727 6250 0,2 2,3 7,5 16,0 30,1 39,3 N=727 7500 0,4 2,8 8,8 17,5 31,0 39,6 N=727
Danish Meteorological Institute Technical Report 04-25
www.dmi.dk/dmi/tr04-25 page 41 of 44
Appendix D The leaflet PISTON ENGINE ICING provided by UK-CAA (Civil Aviation Authority, 2000) gives recommendations of pilot procedures in order to minimize the risk of carburettor icing. The leaflet can be found at the URL : http://www.caa.co.uk/docs/33/SRG_GAD_SSL14.PDF A summary of the leaflet is provided here.

Danish Meteorological Institute Technical Report 04-25
www.dmi.dk/dmi/tr04-25 page 42 of 44
PISTON ENGINE ICING (Civil Aviation Authority, 2000) SUMMARY
— Icing forms stealthily.
— Some aircraft/engine combinations are more susceptible than others.
— Icing may occur in warm humid conditions and is a possibility at any time of the year in the UK.
— Mogas makes carb icing more likely.
— Low power settings, such as in a descent or in the circuit, are more prone to give
carb icing.
— Use full carb heat frequently when flying in conditions where carb icing is likely. Remember that the RPM gauge is your primary indication for a fixed pitch
— propeller; manifold pressure for variable pitch.
— Treat the carb heat as an ON/OFF control – either full hot or full cold.
— It takes time for the heat to work and the engine may run roughly while the ice is
clearing.
— Timely use of appropriate procedures can PREVENT THIS PROBLEM. FINALLY: In the event of carb heat system failure in flight:
— Keep out of icing conditions. — Maintain high throttle setting – full throttle if possible. — Weaken the mixture slightly. — Land as soon as reasonably possible.
PREVENTION IS BETTER THAN CURE
Danish Meteorological Institute Technical Report 04-25
www.dmi.dk/dmi/tr04-25 page 43 of 44
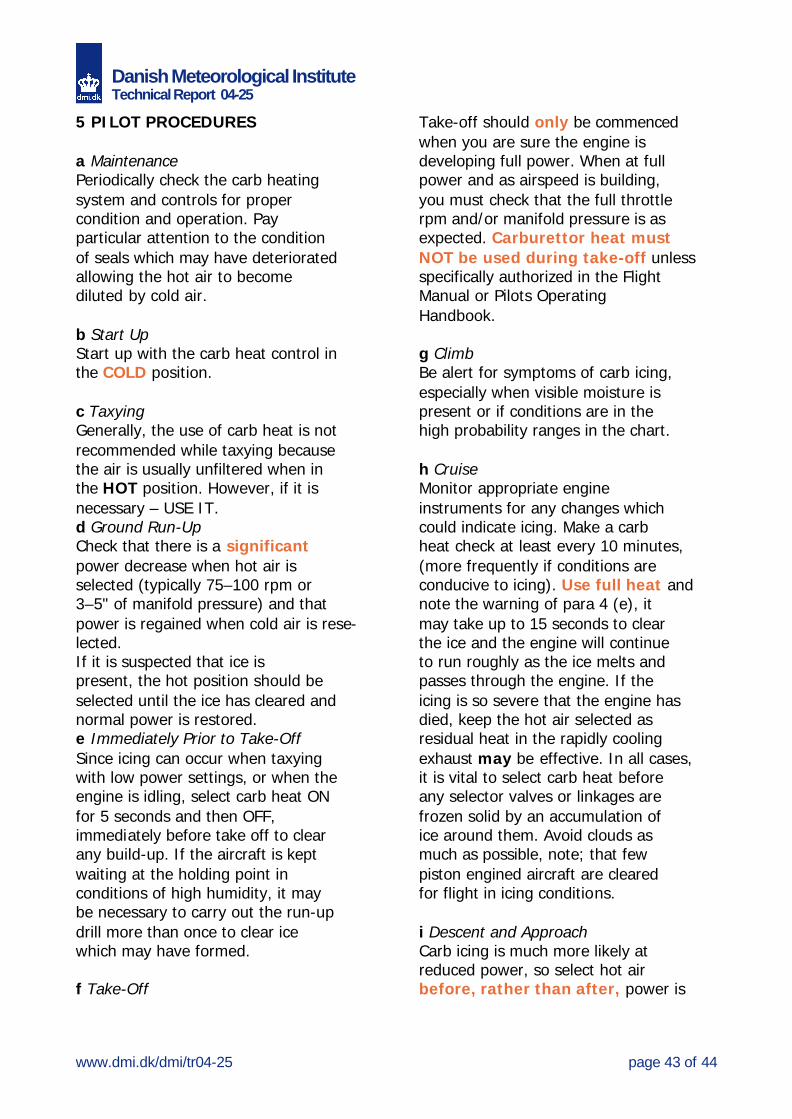
5 PILOT PROCEDURES a Maintenance Periodically check the carb heating system and controls for proper condition and operation. Pay particular attention to the condition of seals which may have deteriorated allowing the hot air to become diluted by cold air. b Start Up Start up with the carb heat control in the COLD position. c Taxying Generally, the use of carb heat is not recommended while taxying because the air is usually unfiltered when in the HOT position. However, if it is necessary – USE IT. d Ground Run-Up Check that there is a significant power decrease when hot air is selected (typically 75–100 rpm or 3–5" of manifold pressure) and that power is regained when cold air is rese-lected. If it is suspected that ice is present, the hot position should be selected until the ice has cleared and normal power is restored. e Immediately Prior to Take-Off Since icing can occur when taxying with low power settings, or when the engine is idling, select carb heat ON for 5 seconds and then OFF, immediately before take off to clear any build-up. If the aircraft is kept waiting at the holding point in conditions of high humidity, it may be necessary to carry out the run-up drill more than once to clear ice which may have formed. f Take-Off
Take-off should only be commenced when you are sure the engine is developing full power. When at full power and as airspeed is building, you must check that the full throttle rpm and/or manifold pressure is as expected. Carburettor heat must NOT be used during take-off unless specifically authorized in the Flight Manual or Pilots Operating Handbook. g Climb Be alert for symptoms of carb icing, especially when visible moisture is present or if conditions are in the high probability ranges in the chart. h Cruise Monitor appropriate engine instruments for any changes which could indicate icing. Make a carb heat check at least every 10 minutes, (more frequently if conditions are conducive to icing). Use full heat and note the warning of para 4 (e), it may take up to 15 seconds to clear the ice and the engine will continue to run roughly as the ice melts and passes through the engine. If the icing is so severe that the engine has died, keep the hot air selected as residual heat in the rapidly cooling exhaust may be effective. In all cases, it is vital to select carb heat before any selector valves or linkages are frozen solid by an accumulation of ice around them. Avoid clouds as much as possible, note; that few piston engined aircraft are cleared for flight in icing conditions. i Descent and Approach Carb icing is much more likely at reduced power, so select hot air before, rather than after, power is

Danish Meteorological Institute Technical Report 04-25
www.dmi.dk/dmi/tr04-25 page 44 of 44
reduced for the descent, and especially for a practice forced landing or a helicopter autorotation, ie, before the exhaust starts to cool. (This also allows a check that no ice is present and that the carb heat is still working.) Maintain FULL heat during long periods of flight with reduced power settings. At intervals of about 500 ft or more frequently if conditions require, increase power to cruise setting to warm the engine and to provide sufficient heat to melt any ice. j Downwind Ensure that the downwind check includes the following check: — Note the RPM/Manifold Pressure — Apply Full Carb heat for about 15 seconds and note the reduced indication. — Return Carb heat to Cold. The RPM/Manifold Pressure will return to the earlier indication if there
was no icing. If it is higher – icing was present. k Base Leg and Final Approach Unless otherwise stated in the Pilot's Operating Handbook or Flight Manual, the HOT position should be selected on base leg when power is reduced. On some engine installations, to ensure better engine response and to permit a go-around to be initiated without delay, it is recommended that the carb heat be returned to COLD at about 200/300 ft on finals. l Go-around or Touch and Go Ensure the carb heat is COLD, ideally before, or simultaneously as power is applied for a go-around. m After Landing Return to the COLD setting before taxying, if not already set COLD, (para k).