darden resturants policy final report
TRANSCRIPT

Darden RestaurantsApril 25th, 2016Group 2:Zach Bach, A.J. Buono,Jacob Kopinetz, Samantha Picciott,Nicole Taylor, Robert Zappaterrini
Table of Contents
I. Executive Summary...................................................................................................................................................................... 1A. Current Situation..............................................................................................................................................................................2
1. Brief History...............................................................................................................................................................................................................22. Current Mission and Vision.................................................................................................................................................................................23. Current Long-Term Objectives..........................................................................................................................................................................24. Current Corporate Strategies.............................................................................................................................................................................3
B. Functional Approach.......................................................................................................................................................................31. Management...............................................................................................................................................................................................................32. Marketing....................................................................................................................................................................................................................33. Accounting / Finance.............................................................................................................................................................................................54. Production/Operations.........................................................................................................................................................................................65. Information Systems..............................................................................................................................................................................................66. Research & Development.....................................................................................................................................................................................6
III. EXTERNAL AUDIT....................................................................................................................................................................... 7A. Macro Environmental Audit..........................................................................................................................................................7
1. Economic Forces......................................................................................................................................................................................................72. Demographic/ Sociocultural Forces................................................................................................................................................................83. Political/Legal Forces............................................................................................................................................................................................94. Technological Forces...........................................................................................................................................................................................10
B. Task Environment.........................................................................................................................................................................111. Industry Analysis..................................................................................................................................................................................................112. Competitor Analysis: Bloomin’ Brands and Yum! Brands...................................................................................................................12
IV. SWOT ANALYSIS....................................................................................................................................................................... 14
V. STRATEGY ANALYSIS AND CHOICE...................................................................................................................................... 14A. Revised Mission..............................................................................................................................................................................14B. Long-Term Objectives..................................................................................................................................................................15C. Generate Corporate Strategies...................................................................................................................................................15D. Craft Corporate Strategies- Accepting or Rejecting............................................................................................................15
VI. STRATEGY IMPLEMENTATION............................................................................................................................................ 19A. Management Issues.......................................................................................................................................................................19B. Marketing Issues............................................................................................................................................................................20C. Finance/Accounting Issues.........................................................................................................................................................20D. Production/Operations Issues..................................................................................................................................................21E. Information Systems Issues........................................................................................................................................................21F. Research and Development Issues...........................................................................................................................................22A. Three-Year Projected Income Statement with Explanation............................................................................................22
APPENDIX......................................................................................................................................................................................... 23
REFERENCES.................................................................................................................................................................................... 44

I. Executive SummaryDarden Restaurants Inc. owns and operates seven full-service restaurant brands including Olive Garden,
LongHorn Steakhouse, Bahama Breeze, Seasons 52, The Capital Grille, Eddie V’s, and Yard House. These
seven restaurants, totaling in over 1,500 different locations, serve millions of customers each year as
each brand creates a unique experience for its different market segments. An in depth analysis of Darden
Restaurants’ internal and external environment is detailed in this report as strengths, weaknesses,
opportunities and threats are identified. To address these areas of weakness and potential threats, this
plan details three strategies to improve Darden Restaurants’ environment to increase sales and to drive
growth within the industry.
The first of the three strategies will address the slow growth of Bahama Breeze, which does not match the
growth of the other six restaurant brands. Divesting Bahama Breeze and reallocating the funds to paying
off long-term debt ensures Darden’s financial stability into the foreseeable future. The next strategic plan
that will be addressed is the creation of an advertising plan for Yard House, a Darden brand that has been
steadily growing. The last of the three strategies will address an area of weakness that affects Darden
Restaurants in the category of inventory management. Darden currently donates approximately ten
million pounds of food annually. This strategy is built upon the implementation of additional POS
software that will decrease cost of goods sold as it aims to attack inventory controls, managing the
amount of food brought into individual brands.
With an increase in advertising spend to Yard House, Darden will see an initial increase in sales to the
specific brand of approximately 12 percent. Together, these three strategies will improve Darden
Restaurants’ overall net earnings by 35 percent.
Figure 1: Darden’s Current Brands
1

II. INTERNAL AUDIT
A. Current Situation1. Brief History William Darden created the concept of Darden Restaurants with his restaurant, The Green Frog, in 1938
(History of Darden Restaurants, Inc., 2016). Thirty years later, Darden opened Red Lobster and later
went onto sell his restaurant franchise to General Mills to support its increasing growth. As the franchise
grew, General Mills realigned its values and decided to ultimately separate its restaurant operations. In
1982, the first Olive Garden was opened and in 1995, Darden Restaurants, Inc. began trading on the New
York Stock Exchange while operating both Olive Garden and Red Lobster. Throughout the 1990’s Darden
Restaurants, Inc. launched Bahama Breeze restaurants, and in the early 2000’s, Seasons 52 was created
internally, expanding its markets. Darden then acquired Eddie V’s Prime Seafood and Wildfish Seafood
Grille. After continuous growth with their restaurant brands, Darden Restaurants acquired Rare
Hospitality in 2007, which included The Capital Grille and LongHorn Steakhouse. Darden’s most recent
acquisition was Yard House in 2012 and in 2014, Darden sold Red Lobster, totaling its current brands at
seven (Darden Restaurants, Inc., 2015). Darden Restaurant brands are leaders within the full service
dining industry as they have totaled 1,534 restaurants at the end of the 2015 fiscal year.
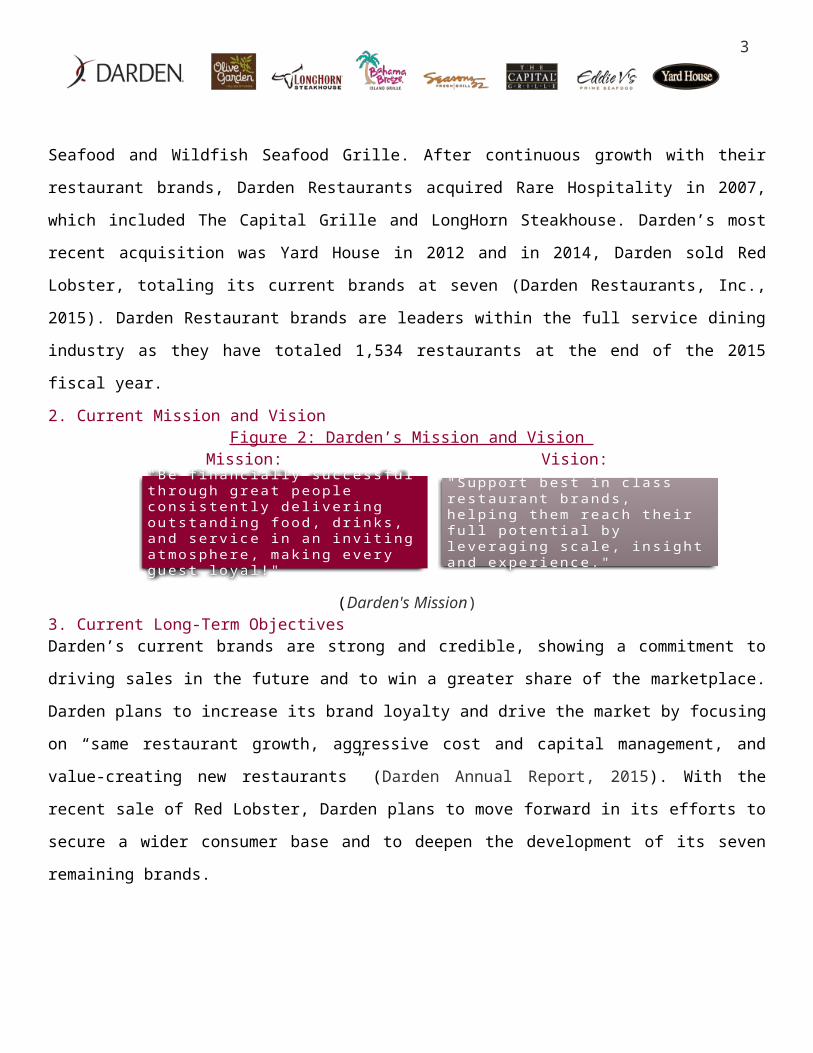
2. Current Mission and VisionFigure 2: Darden’s Mission and Vision
Mission: Vision:
(Darden's Mission)3. Current Long-Term ObjectivesDarden’s current brands are strong and credible, showing a commitment to driving sales in the future
and to win a greater share of the marketplace. Darden plans to increase its brand loyalty and drive the
market by focusing on “same restaurant growth, aggressive cost and capital management, and value-
creating new restaurants” (Darden Annual Report, 2015). With the recent sale of Red Lobster, Darden
plans to move forward in its efforts to secure a wider consumer base and to deepen the development of
its seven remaining brands.
"Be financially successful through great people consistently delivering outstanding food, drinks, and service in an inviting atmosphere, making every guest loyal!"
"Support best in class restaurant brands, helping them reach their full potential by leveraging scale, insight and experience."
2
4. Current Corporate Strategies Darden is currently implementing its “Back-to-Basics” strategy, which places an emphasis on “culinary
innovation, attentive service, an engaging atmosphere, and integrated marketing” to increase Darden’s
market share (Darden Restaurants, Inc., 2015). Cultural innovation can be seen throughout many of the
different Darden brands. Darden is implementing these strategies by developing new menu ideas, to-go
options, and focusing on consumer trends. In addition to its increasing efforts, the most significant
strategy that Darden has executed is its sale of Red Lobster. This sale was “the result of implementation
of a new management incentive plan that more directly emphasizes same-restaurant sales, free cash flow
and relative total shareholder return; continuation of the focus on our restaurant support platform costs;
and improvement of capital allocation discipline” (Darden Restaurants, Inc., 2015).
B. Functional Approach1. Management Darden management consists of a hierarchy structure overseen by its President and Chief Executive,
Gene Lee (Executive Leadership, 2016). The structure includes individual presidents and brand
managers of every restaurant brand. Under each president is a Senior Vice President and their job is to
manage multiple regions and/or several stores depending on the restaurant size and growth. Next is the
General Manager and their responsibility is restaurant-specific. Lastly, there are regular managers and
there can be anywhere from 2-6 regular managers in any given Darden Restaurant (See Appendix A, B).
Along with the executive leadership, the Board of Directors help balance the decisions of Darden
Restaurants. The “veteran business leaders” are knowledgeable in the restaurant, retail, finance, and real
estate fields which aid to Darden’s success (Executive Leadership, 2016).
2. Marketinga. Total Sales Darden’s total sales have been $6.76 billion, $6.28 billion, and $5.92 billion for 2015, 2014, and 2013
respectively (Darden Restaurants, Inc., 2015). Sales have been increasing steadily for the past three
years, between 6-7% each year. One major takeaway is the revenue brought in by each unit. Yard House
is the largest grossing brand per unit bringing in roughly $8.3 million annually, followed by The Capital
Grille at $7.2 million, next was Eddie V’s at $6.3 million per unit, Seasons 52 and Bahama Breeze were
tied at roughly $5.7 million per unit, Olive Garden earned $4.5 million per unit, and lastly, LongHorn
Steakhouse earns roughly $3.2 million per unit (2015 Annual Report).
3
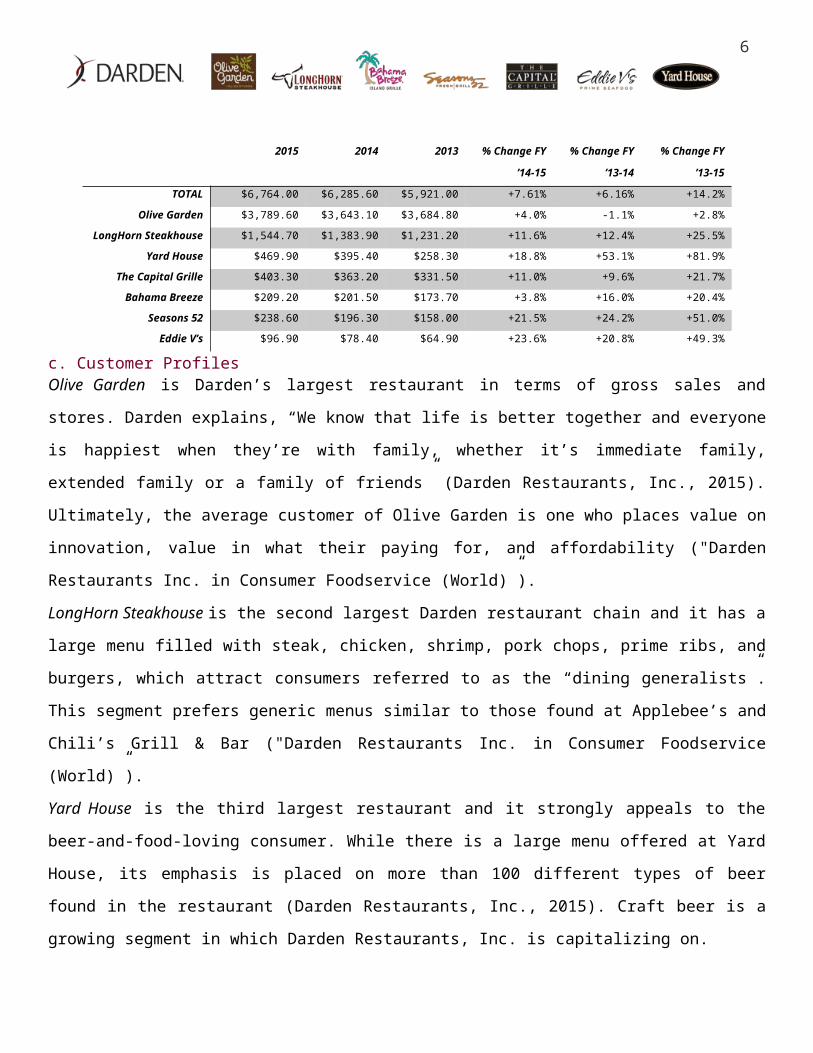
b. Segments with SalesDarden Restaurants, Inc. has shown growth over the last three years of operation. Total sales have
increased by 6.16% from 2013 to 2014 and 7.61% from 2014 to 2015 (Darden Restaurants, Inc., 2015).
The corresponding segments’ sales and growth data are listed in the table above. In 2013, all the brands
showed positive growth with the exception of Olive Garden. After implementing their strategic initiatives,
all restaurant segments grew throughout 2014. The figures listed above do not include sales from Red
Lobster, as it would skew the financial data for the restaurant group.
Table 1: Restaurant Sales by Segment2015 2014 2013 % Change FY
’14-15
% Change FY
’13-14
% Change FY
’13-15
TOTAL $6,764.00 $6,285.60 $5,921.00 +7.61% +6.16% +14.2%
Olive Garden $3,789.60 $3,643.10 $3,684.80 +4.0% -1.1% +2.8%
LongHorn Steakhouse $1,544.70 $1,383.90 $1,231.20 +11.6% +12.4% +25.5%
Yard House $469.90 $395.40 $258.30 +18.8% +53.1% +81.9%
The Capital Grille $403.30 $363.20 $331.50 +11.0% +9.6% +21.7%
Bahama Breeze $209.20 $201.50 $173.70 +3.8% +16.0% +20.4%
Seasons 52 $238.60 $196.30 $158.00 +21.5% +24.2% +51.0%
Eddie V’s $96.90 $78.40 $64.90 +23.6% +20.8% +49.3%
c. Customer ProfilesOlive Garden is Darden’s largest restaurant in terms of gross sales and stores. Darden explains, “We know
that life is better together and everyone is happiest when they’re with family, whether it’s immediate
family, extended family or a family of friends” (Darden Restaurants, Inc., 2015). Ultimately, the average
customer of Olive Garden is one who places value on innovation, value in what their paying for, and
affordability ("Darden Restaurants Inc. in Consumer Foodservice (World)”).
LongHorn Steakhouse is the second largest Darden restaurant chain and it has a large menu filled with
steak, chicken, shrimp, pork chops, prime ribs, and burgers, which attract consumers referred to as the
“dining generalists”. This segment prefers generic menus similar to those found at Applebee’s and Chili’s
Grill & Bar ("Darden Restaurants Inc. in Consumer Foodservice (World)”).
Yard House is the third largest restaurant and it strongly appeals to the beer-and-food-loving consumer.
While there is a large menu offered at Yard House, its emphasis is placed on more than 100 different
types of beer found in the restaurant (Darden Restaurants, Inc., 2015). Craft beer is a growing segment in
which Darden Restaurants, Inc. is capitalizing on.
4

The Capital Grille is a fine dining restaurants, which specializes in steak, seafood, and wine. It typical
consumers consist of businesspeople and luxury spenders ("Darden Restaurants Inc. in Consumer
Foodservice (World)”).
Bahama Breeze has a very specific consumer profile, which enables the restaurant to strengthen its brand
and menu. The restaurant supports an “island atmosphere” with menu items ranging from seafood,
chicken, steak, and specialty cocktails. Darden explains, “We are seeing growth with Millennial and
Hispanic consumers as well as catering to the adult ambience restaurant segment at Bahama Breeze”
(Darden Restaurants, Inc., 2015).
Seasons 52 specializes in a fresh grilled menu and a stellar wine selection. Darden describes their
customers as “casual, healthy and sophisticated” (Darden Restaurants, Inc., 2015).
Eddie V’s is the second fine-dining restaurant under Darden Restaurants and specializes in prime seafood.
These restaurants are located in mostly metropolitan areas and include a “sophisticated and
contemporary ambience” for customers (Darden Restaurants, Inc., 2015).
d. 4P’s (See Appendix C, D, E)
idity3. Accounting / Finance
Table 4: Financial Ratio Comparison2014 10-K Data Darden Restaurants Bloomin’ Brands Yum! Brands
Current Ratio 1.22 .72 .68Degree of Financial Leverage 3.28 6.02 5.20
Debt-to-Equity 2.28 4.98 4.20Gross Profit Margin 20.60% 16.66% 27.09%
PRODUCTSteaksPoultrySeafoodSeasonal Fruits/Vegetables Specialty Beverages
PRICECasual DiningFine Dining
PLACEUnited StatesCanadaCentral/South AmericaMiddle EastMalaysia
PROMOTIONNational, Cable, Local TelevisionDigital MarketingFlyersMisc. Channels
5

Darden’s current ratio, which is currently above one, indicates that the company is in relatively good
financial health especially compared to its competitors. The current ratio serves as a benchmark to “give
an idea of the company’s ability to pay back its liabilities with its assets” (Breaking Down ‘Current Ratio’).
Darden’s degree of financial leverage is lower than its competitors; therefore, they rely more on equity
for their assets. One strength that Darden has is its recent pay-down of debt. In 2014, they retired $1
billion of debt, which ultimately makes its financial structure less risky. The competitors, Yum! Brands
and Bloomin’ Brands, are almost double Darden’s overall degree of financial leverage.
4. Production/OperationsDarden receives their food from over 1,500 vendors across the world (Darden Sourcing). Darden
Restaurants owns and operates Darden Direct Distributions for a tighter grasp on supply chain
management. Darden explains, “Through our subsidiary, Darden Direct Distribution, Inc. ("Darden
Direct"), and long-term agreements with our third party national distribution companies, we maintain
inventory ownership of food and supplies in warehouses primarily dedicated to Darden where practical
to do so. Darden Direct further enables our purchasing staff to integrate demand forecasts into long-term
agreements driving efficiencies in production economics when we collaborate with vendors.” (Darden
Restaurants, Inc., 2015). Due to the rapid turnover of the food, it is important for Darden to analyze the
turnaround for food held in its warehouses and its restaurants to eliminate waste.
5. Information SystemsSince 2014, Darden restaurants combined its brands onto one “single digital technology platform”
(Darden Restaurants, Inc., 2015). This platform was created to improve Darden’s marketing, centralizing
it on one platform and allows the brands to be tailored to specific customers, strengthening the brand’s
image in the customer’s minds. This system tracks consumer trends as Darden is able to analyze what is
working well for the company and what is not. In addition, Darden is part of a multi-year plan to install
this new technology, catering to customer needs. Darden Restaurants utilizes a POS system to manage
incoming orders and maintains a restaurant support facility in Orlando, Florida, keeping information up
to date and secure from potential threats.
6. Research & Development Darden restaurants does not incur any Research and Development costs. Their more casual brands-
Bahama Breeze, LongHorn Steakhouse, Yard House, and Olive Garden- are considered to be “generalist”
menus, providing the basic food groups within each restaurant with little variation. Their upscale brands,
6
Eddie V’s, The Capital Grille, and Seasons 52, employ executive chefs who are responsible for selecting
and executing the chef’s choice of the day.
III. EXTERNAL AUDIT A. Macro Environmental Audit1. Economic ForcesUnited States
An economic force that affects Darden Restaurants can be seen in the comparison between the savings
rate and disposable personal income as this affects the amount of money customers are willing to spend
at a restaurant (Jones, 2015). Recently, average disposable personal income has been on a steady decline,
while savings rates have been volatile. In 2013, the savings rate took a big dip from around 7-8 percent to
4-5 percent and has been steady around the 5 percent mark ever since. With the disposable personal
income remaining steady and the decline in the savings rate, it is evident that consumers are spending
more money on average. Revolving credit has also shown an increase within the past year indicating that
more money is being spent and consumption has increased. Darden must take advantage of this recent
trend and provide consumers with the quality service they are looking for.
Canada
As one of the United States’ strongest allies, it is understandable that the two countries are heavily
dependent upon each other for international trade (Canada). The dependency has been considered both a
strength and weakness for Canada. On a positive light, they have strong international relations; however,
if the United States’ economy plummeted, Canada would be adversely affected. Furthermore, their
banking sector has been described as one of the most sound in the world for almost a decade which
correlates to a relatively strong economy (Canada). Overall, Canada’s economy is exceeding expectations
in its overall performance. One point of concern is the high household debt. As families take on higher
debt that means their income is being directed to other areas which means they have a smaller amount to
spend on dining out.
Malaysia
The Malaysian economy has seen significant growth in the past year, achieving an increase of 6.0%. Their
success is contributed to increased wages, government transfers, and a growing labor market. The
country has seen a spike in household debt due to low interest rates and relatively simple credit terms
which has increased the debt by more than 12% (Malaysia).
7

2. Demographic/ Sociocultural ForcesUnited States
Sociocultural and demographic forces allow Darden to understand the values and attitudes of their
clientele as understanding who dines within the full service industry and how to reach the different
segments is key. Darden should explore the trend of dining among men and women over the age of 55, as
this age segment frequents restaurants the most (Gallo-Torres, 2015). In addition, it is important to keep
track of trends among the prominent millennial generation, as trends within technology do not always
parallel the ideals of these age segments. With a focus on healthy living, Darden should cater its menus to
this lifestyle as this consumer segment increases so they are at least providing the opportunity to
customers (Wall, 2014). Darden should also study the demographics of areas where it wishes to expand
its brands as the values and trends of the demographics of the area will indicate if Darden will find
success at these locations. Furthermore, in order to achieve diversity in the workforce, Darden staffs its
local restaurant so it mirrors the population they will be serving (Darden Restaurants, Inc., 2015).
Canada
Canada is considered to be an advanced country in terms of human development and social factors. One
of the main differences between Canada and the United States is their advanced social welfare system.
There are billions of dollars spent on healthcare and education each year which drastically increases the
quality of life(Canada). Not only do they have intensive healthcare, but they also have employee training
programs to boost the unemployment rate. Canadians are used to a certain standard of life, similar to
Americans, and eating at restaurants is a commonality. Canada is primarily composed of Canadians,
English, French, Scottish, Irish, German, Italian, Chinese, North American Indian, and other backgrounds.
Given the diversity that the country sees, there is a demand for more ethnic cuisine and foodservice
throughout the country, specifically French, Mediterranean, Thai, Japanese, Chinese, and Korean.
Moreover, there is also an increased demand for aged or premium meats, specialty breads, and specialty
meats (Dover).
Malaysia
Malaysia’s social climate is drastically different from the United States and Canada. There are several
factors which go into their interest in eating at restaurants. Only 5.45% of the population is over the age
of 65 which indicates it is a very young country. Younger generations are on the forefront of social change
8

within their country; however, there is a lot of progress to be made. One area to focus on, in terms of their
social landscape, is their restriction on human freedom and religious affiliations (Malaysia). The Malays
have restricted internet access which make it difficult to advertise to specific use groups. Moreover, the
major religions within the country effect menu items for restaurants. Muslim is the primary religion
(61.3%) followed by Buddhism (19.8%), next is Christian (9%), then Hindu (6.3%), Confucianism,
Taoism, miscellaneous Chinese religions make up the next 1.3% (Malaysia). Given the prominence of the
Muslim religion, there are significant food restrictions as to what they can eat. Darden Restaurants, while
diverse, has popular dishes which conflict with the religion.
3. Political/Legal ForcesUnited States
Darden is subject to a wide variety of these regulations such as fire, health, and safety regulations
determined by where the restaurant is located. Other regulations including zoning laws when trying to
build new locations, liquor licenses to provide alcohol in our many stores, and “The Affordable Care
Act”/FDA requirement to disclose caloric and more nutritional information on menus (“Government
Regulation” Darden Restaurants, Inc., 2015). Darden must also be up to date on the Tip Rate Alternative
Commitment (“TRAC”), which reduces the likelihood of employees not reporting cash tips to the IRS. It is
important Darden adheres with all these regulations to avoid huge fines or possible delays/shut downs of
our services (“Government Regulation” Darden Restaurants, Inc., 2015).
Canada
Canada is structured slightly different from the United States in terms of regulating the restaurant
industry. The Canadian Food Inspection Agency is governed by governments, municipalities, and regional
health authorities (Workplace Standards). The Canadian government has recently implemented a new
standard: The Safe Food for Canadians Act. This is similar to the FDA’s purpose of monitoring the growth
and treatment of food to ensure health and safety are not put at risk (Workplace Standards). Canada is
stricter regarding drinking and driving with a limit of .05 (the United States is .08). If an adult is found
guilty of serving a minor alcohol the offense ranges from one to three months of jail time (Workplace
Standards). This sanction makes it imperative for restaurants to remain vigilant in the alcohol they serve
to customers to ensure they are following the regulations imposed by the government.
Malaysia
9

Malaysia is currently going through several political struggles since they are a relatively young country.
As previously mentioned, there are restrictions on human rights and they struggle with establishing a
democracy. The country has such strict rules in regards to freedom and human rights that make it
difficult for citizens to challenge authority (Malaysia). Any citizen found questioning or protesting the
government’s decision could face unfair processes regarding punishment. Overall there is a significant
amount of political unrest sparked by the desire for freedom.
4. Technological ForcesUnited States
Darden Restaurants manage their research through a POS System which allows them to track what
orders are being placed at a restaurant and how much of the products are being sold (Darden
Restaurants, Inc., 2015). Its current research into trends allow for technological innovation. One new
system that has been developed for the restaurant industry is their automated ordering devices. This
allows customers to place orders at their convenience. This may be an opportunity for Darden; however,
it has been found that millennials prefer face to face contact with their servers (Gallo-Torres, 2015).
Keeping in mind that technology has the potential to be either an opportunity or a threat, determining
how new technology is used is critical to Darden’s success.
Canada
Technology has a heavy influence on consumers’ desire to eat out at restaurants versus staying inside. It
has become more common for customers to search for deals and then come into the restaurant; however,
it is difficult to convert them into regular customers (Dover). In order to maintain this interest, they
would consistently have to provide some type of deal on their menu or “specialty night” where prices are
low for a specific food group. Technology also influences consumer demand because of the internet,
television, and travel. Consumers are becoming more informed of the different meal opportunities across
the world and they are seeking those opportunities out within their own country (Dover).
Malaysia
Malaysia exports computers, pharmaceuticals, scientific instruments, aerospace systems, and electrical
machinery making it a tech savvy country/government; however, citizens face difficulty obtaining
technological resources. As it is a developing country, they are making great strides with introducing
technology to families. Roughly 70 of 100 homes have broadband Internet, which is tremendous growth
10

for such a young country. The technological features that are present in the United States, such as tablets
at each table, are not yet realistic in this country, but in several years they may become more realistic.
B. Task Environment 1. Industry Analysisa. DescriptionAccording to its NAICS codes, Darden Restaurants operates primarily within the full service restaurant
industry and its secondary industry code indicates a presence in the drinking places industry. Darden
operates seven brands, which compete with thousands of other restaurants in any given region. There
are smaller, family-owned restaurants and corporate chains which create a significant amount of
competition for Darden.
b. Financial PerformanceThe financial performance of the overall industry is showing growth. Understanding that the full service
restaurant industry has grown by 3 percent, totaling in sales of over $208.5 billion, there is great
potential for Darden Restaurants to increase its market shares ("Darden Restaurants Inc. in Consumer
Foodservice (World)”). Currently, Darden accounts for 4 percent of the value share, claiming its
leadership within the industry.
c. Competitive Nature – Porter’s Model Threat of New EntryThere are low entry costs involved within the full service dining industry. This is prevalent in the high
number of small restaurants that exist today. Limited education is necessary to open a restaurant and
resources are available to start a restaurant because it is a large industry. One entry barrier is, however,
the level of competition that already exists within the full service industry. In addition, finding a new
location for a restaurant is difficult, as many restaurants already exist in high volume locations.
Buyer PowerThe buying power of customers is very strong as there are relatively no switching costs involved when
choosing which restaurant to frequent. Customers are able to look up information about a restaurant
online and refer to feedback found on these sites to determine if it is worthwhile to dine there or not.
Along with that, if a buy has a poor experience at Darden, they can potentially ruin the reputation of that
brand through negative word of mouth and other forms of negative publicity.
Threat of SubstitutionMany alternatives exist to the full service industry. The fast casual industry is on the rise as customers
may choose to dine somewhere where they do not have to stay for an extended amount of time. Fast food
11

restaurants and grocery stores that provide pre-packaged meals are a threat as more people eat on the
go. Home cooked meals also pose a threat as customers may view this as cost effective and convenient as
they do not have to leave their homes to prepare their meals.
Supplier PowerDarden operates with several different suppliers which provide its high quality food for its restaurants.
Darden instills a quality assurance plan to guarantee that its products meet government standards and
their internal standards. Food safety is critical to Darden’s success, giving their suppliers power over the
company if the food is not properly grown or stored. As mentioned previously, Darden operates Darden
Direct as its main supplier to maintain control over its products and to minimize power of their suppliers
(Darden Restaurants, Inc., 2015). The overall power of suppliers within the full-service industry is very
low because the suppliers rely on these restaurants for sales and there are a good amount of substitutes
available if one supplier does not meet a restaurant’s needs. One major factor in Darden’s operations
does not come from direct suppliers, but instead stakeholders who have interest in the organization. The
U.S. Food and Drug Administration and the Internal Revenue Service both have an influence on Darden
Restaurants. The FDA monitors our food safety and overall health regulations. At any point, they can
deem our restaurants unsafe which would have an adverse effect on operations and profitability.
Moreover, we have moderate relationship with the IRS due to tax regulations involving servers’ tips.
Servers are bound by law to report their earnings and Darden must uphold that standard.
2. Competitor Analysis: Bloomin’ Brands and Yum! Brandsa. Current ObjectivesBloomin’ Brands owns a variety of different brands including Outback Steakhouse, Carrabba’s Italian
Grill, Bonefish Grill and Fleming’s Prime Steakhouse and Wine Bar (Bloomin’ Brands, Inc. 2015). Each of
these restaurants parallel Darden brands, offering similar products and services within the restaurant
industry. Bloomin’ Brands provide a range of different atmospheres as their brands provide upscale,
casual, and fine dining experiences for its guests. Bloomin’ Brands prides itself on providing a
“compelling customer experience combining great food, highly attentive service and lively ambience at
attractive prices”.
Yum! Brands is working to expand its brands with innovation as it expands on the products offered at
each of its restaurants (Taco Bell, KFC, and Pizza Hut) (YUM! Brands, Inc. 2014). Yum! plans to offer value
that is “disruptive but distinctive, genuine and transparent”.
12
b. Current StrategiesBloomin’ Brands intends to continue in its efforts to remodel its restaurants with the end goal of
attracting more customers by keeping its locations up to date (Bloomin’ Brands, Inc. 2015). There will be
an increase distribution of limited-time offers and an increase in their marketing budget to drive traffic to
their locations. Bloomin’ plans to be innovative in its future offerings as it expands its menu options to
better cater towards its customers. Expansion in the number of stores will take place as Bloomin’ Brands
plan to open 40-50 stores within the next year, increasing its market reach. Bloomin’ also plans to expand
internationally to Latin America and Asia.
Yum! Brands focus its current strategies on building strong brands that are recognizable and drive
customers to its locations (YUM! Brands, Inc. 2014). Yum! plans to expand its marketing plans and to
expand its locations within current and emerging markets. It plans to maintain its global strategies as a
leader within both China’s and India’s markets. Yum! Intends to increase its long-term shareholder value
and obtain more return on its franchises.
c. CompetenciesBloomin’ Brands is able to gain competitive advantage with its Strategy and Market Intelligence (“SMI”)
which allows the company to take an in depth look of the analytics relating to sales and investments. This
system allows Bloomin’ to essentially test out future initiatives before launching them in the marketplace.
The system is able to calculate a price for its products and find target areas where its brands can succeed
(Bloomin’ Brands, Inc. 2015).
Yum! Brands are specifically competent within the research and development aspect of the company
(YUM! Brands, Inc. 2014). It maintains multiple operations within the United States and a location in
China where it studies the trends found within its restaurants and among the industry. Yum! allocates
approximately $30 million of its budget towards research and development that they conduct on their
own and with some of their independent suppliers.
d. Financial InformationBloomin’ Brands ended its 2014 fiscal year with $4,415,783 in sales (Bloomin’ Brands, Inc. 2015). Their
growth from 2013 to 2014 was roughly 7.5% which is comparable to Darden. Since Bloomin’ Brands is
such a key competitor with Darden, it was interesting to see how well they managed their inventory.
Their Inventory Turnover ratio was 17.77, whereas Darden was only 9.61. Ultimately, this means that
Bloomin’ Brands was able to flip their inventory over more times in a period than Darden was, implying
13

they have better inventory management. Since Bloomin’ Brands is working to grow quickly, their debt to
equity ratio was almost double Darden’s. Overall, Bloomin’ Brands is extremely competitive with Darden,
having around the same Return on Total Assets and Return on Sales.
At the end of the 2014 fiscal year, Yum! ‘s sales totaled at $11,324 billion (YUM! Brands, Inc. 2014). Yum!
Brands is exemplary of how a business should be ran to ensure optimal customer satisfaction, processes
and control, and overall restaurant management. Since Yum! Brands is located across the globe; they
have a very strong reach in terms of brand awareness. Moreover, their Gross Profit Margin is 27% which
is significantly higher than Darden and Bloomin’ Brands. They recently took on more debt in 2014 which
caused their Debt to Equity ratio to go from 2.8 to 4.2. Yum! Brands brings in almost double the sales as
Darden ($6.764 billion vs. $13.279 billion). Overall, they appear to be in great financial position.
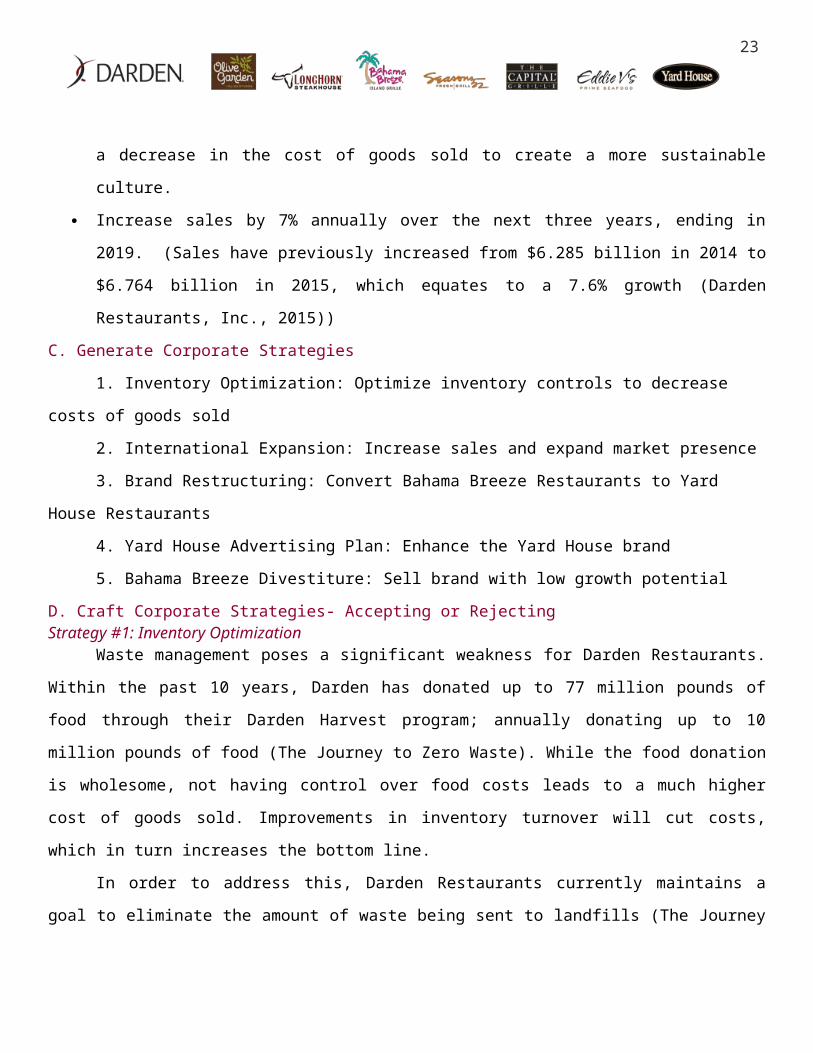
IV. SWOT ANALYSIS Figure 3: SWOT Analysis
These strengths, weaknesses, opportunities, and threats are based on information found within the internal and external analysis for Darden Restaurants (See Appendix F).
V. STRATEGY ANALYSIS AND CHOICEA. Revised Mission
N/A
Strengths- Seven Distinct Brand Identities-Menu with Dietary Approved Items-Large Operational Network-Company Control-Top-Line Growth
Weaknesses-Reliance on Domestic Market (Weak International Presence)-Poor Waste Management -Declining Liquidity
Opportunities-Increasing Online Presence-More Efficient Technology Available-Favorable Growth Trends
Threats-Intense Competition-Economic Trends in Consumer Spending -Health Concerns -Economic trends in Labor Costs
14
B. Long-Term Objectives
According to Darden’s President and Chief, Gene Lee, Darden Restaurants are committed “People, Planet
& Plate” (Citizenship). Based on this, Darden’s long term objectives are as followed:
Increase market share worldwide by 2% in total by the end of 2019.
Improve Darden Restaurants’ bottom line through increased efficiency in waste management. This
will be achieved, as the amount of waste will be reduced by 6% per year until 2019. In addition,
there will be a decrease in the cost of goods sold to create a more sustainable culture.
Increase sales by 7% annually over the next three years, ending in 2019. (Sales have previously
increased from $6.285 billion in 2014 to $6.764 billion in 2015, which equates to a 7.6% growth
(Darden Restaurants, Inc., 2015))
C. Generate Corporate Strategies
1. Inventory Optimization: Optimize inventory controls to decrease costs of goods sold
2. International Expansion: Increase sales and expand market presence
3. Brand Restructuring: Convert Bahama Breeze Restaurants to Yard House Restaurants
4. Yard House Advertising Plan: Enhance the Yard House brand
5. Bahama Breeze Divestiture: Sell brand with low growth potential
D. Craft Corporate Strategies- Accepting or RejectingStrategy #1: Inventory Optimization
Waste management poses a significant weakness for Darden Restaurants. Within the past 10
years, Darden has donated up to 77 million pounds of food through their Darden Harvest program;
annually donating up to 10 million pounds of food (The Journey to Zero Waste). While the food donation
is wholesome, not having control over food costs leads to a much higher cost of goods sold.
Improvements in inventory turnover will cut costs, which in turn increases the bottom line.
In order to address this, Darden Restaurants currently maintains a goal to eliminate the amount of
waste being sent to landfills (The Journey to Zero Waste). As explained previously, roughly 10 million
pounds of excess food is donated to charity each year with millions more being directed to landfills. With
71% of waste still being directed to landfills, Darden has remained stagnant in their diversion rate with a
minimal increase (2014 - 28%, 2015 - 29%). Darden Restaurants’ Sustainability Manager, Kristine Young,
explained, “Darden has 13 different waste streams- from discarded food to cardboard to plastic straws.
Currently Darden is diverting waste from landfills through food donation, organic recycling, energy
15

recovery from cooking oil, and mixed and cardboard recycling” (Food Waste Reduction Alliance). Darden
needs to continue to maintain ties with the community through their food donation program; however,
donating their food does not serve as a solution to the underlying problem at hand. There is a lack of
control on distribution, supply chain, and inventory management throughout the Darden network.
The objective of this strategy is to minimize the amount of overall waste being generated from
restaurant operations to ultimately decrease the amount being sent to landfills and divert it to other
areas. In order to achieve this, a new software must be incorporated into everyday operations to provide
better solutions for waste and inventory management. While Darden develops some of their software
internally, it is vital that they rely on software developed by a company who specializes in this specific
industry (Darden Restaurants, Inc.). We have selected SYRUS to integrate these new systems into each of
our restaurants, distribution centers, and headquarters. They specialize in enterprise reporting and food
cost management with an emphasis on waste, labor management, inventory, and ordering. Darden
intends to combat this issue through moving food waste into various recycling streams.
The objective of this strategy is to decrease the amount of waste being generated in the first place.
Instead of taking a passive approach to fixing the issue, Darden needs to remain aggressive.
Implementing a new POS system services will be costly initially, however, the long-term benefits from
this strategy greatly outweigh the costs. Accepting this strategy will increase Darden’s bottom line, as it
limits its inventory to specific quantities that will decrease the amount of pre-consumer waste at each of
its restaurant locations.
Accept: (See Appendix AB, AC)
Strategy #2: International ExpansionExpanding Darden Restaurants internationally would widen Darden brand’s presence and expose
the company to new market segments, potentially increasing its revenue. According to Darden’s 10K,
there was a recent increase in earnings during their 2015 fiscal year at their international locations,
which indicated growing potential within the foreign marketplace. International expansion would begin
with two of the most easily convertible brands- Olive Garden and LongHorn Steakhouse- into European
markets where there is forecasted high sales growth and potential.
Another key factor with this strategic initiative is to franchise the locations, or place company-
owned restaurants in new international locations. The benefits of franchising to third parties means that
16

Darden does not take on any additional costs; however, drawbacks of the franchise options are strict
contractual agreements, which limit Darden’s ability to exercise control over a situation. If Darden pays
for company-owned stores to be created in new locations, they have the opportunity to generate new
opportunities for the food they’re serving, the customers they’re working with, and the team members
they have on board with them.
Reject: (See Appendix AD)
Darden Restaurants currently operates stores internationally. These stores do not bring
substantial revenue for Darden compared to the United States restaurant locations. In addition,
maintaining control over franchise restaurants in international locations proves to be very costly for
Darden and previous earnings in these international locations indicate this to be a weak strategy for
Darden. An in depth study of the external environments of each international location would have to be
conducted and an in depth understanding of the laws and regulations of the countries is essential. Based
on the cost of expanding internationally and the numerous implications paired with it, this international
strategy is rejected.
Strategy #3: Brand RestructuringAfter assessing the overall performance of each restaurant brand, it is apparent that Bahama
Breeze is the most stagnant of the seven Darden brands. Bahama Breeze currently operates in 36
locations, of which 7 are located either in or around malls. This strategy aims to close the seven mall
locations of Bahama Breeze and convert them into a more profitable restaurant: Yard House. Yard House
is the third highest sales generator for Darden, while only representing 59 of Darden’s 1,534 restaurants
nationwide. In addition, this strategy includes aggressively growing the Yard House brand by placing the
additional new locations in large cities across the United States as demographics in these areas meet Yard
House’s customer profiles. These locations will be located in “Craft-Beer-Loving” cities. New locations will
include Hartford, CT, Columbus, OH, Cleveland, OH, Grand Rapids, MI, Washington D.C., San Francisco, CA,
Sacramento, CA, and Seattle, WA (Notte).
The potential of opening new waterfront locations of Bahama Breeze to add to the “ocean
atmosphere” that they attempt to provide to customers is also included in this strategy. Unfortunately,
having a Bahama Breeze in a mall does not coincide with the atmosphere and experience they are
advertising and this restructuring will allow each restaurant to maximize its presence and potential
17
revenue. A waterfront location not only creates value, it also piques interest of customers looking to
enjoy a relaxing meal.
Reject: (See Appendix AE)
Converting under-performing Bahama Breeze Restaurants to Yard House Restaurants poses
issues pertaining to the location space. The minimum square footage for a Yard House is larger than the
average square footage of current Bahama Breeze. In addition, Darden would have to train employees in
regards to the new menu and how to respond to the different clientele. Converting the Bahama Breeze
locations may initially increase sales, however, it does not address the fact that Bahama Breeze is not
forecasted to perform as well as Darden’s other six brands. This strategy contains many moving parts
that will be timely to implement. Because of these tactical issues, this strategy is rejected.
Strategy #4: Yard House Advertising PlanDarden Restaurants currently spends 80 percent of its media allowance on Olive Garden, one of its
most widely known and attractive brands (RedBooks). However, Darden allocates less than one percent
of its budget on each of its smaller brands such as Seasons 52, Yard House Restaurants and Capital Grille,
which make up a large percentage of Darden’s overall sales. This division of spending is limiting Darden’s
potential profit. Yard House sales have indicated that it generates the third most profit for Darden
Restaurants with limited marketing resources allotted to the brand. As the brand continues to grow by 6-
8 locations each year, marketing expenses will need to drastically increase to address this. This
advertising plan will be created to reach new market segments as well as existing segments, specifically
in Los Angeles, California where four Yard House Restaurants are currently located. There will be an
increase in Yard House’s budget by 30 percent in order to create a campaign that will be effective. This
campaign will include a corporate sponsorship of the Las Angeles Angels, regional and national
commercials, billboards, paid social media posts, and online advertisements to reach Yard House’s target
market.
Accept: (See Appendix V-AA, AF-AJ)
After a study of Olive Garden’s previous income based on their advertising efforts, it is projected
that this strategy will increase Yard House’s overall sales by 12 percent. The advertising plan will be built
based on an objective task strategy, building the budget for this plan from the bottom up. Reaching the
target market of millennial males proves that an effective approach would be focusing this campaign
18

around sports in the specific geographic regions where current Yard Houses are located. In addition, the
6-8 locations of the new Yard House locations in craft beer loving cities with a high rate of millennials
within these cities will make drive this strategy. Promoted posts on social media where the target market
is active will increase the reach of this strategy. In addition, focusing the efforts of this campaign around
building an experience at this restaurant will entice people to dine there. The increase in craft beer sales
prove that the market for restaurants providing craft beer is growing and to adhere to this, this campaign
must be aggressive and effectively reach the target market using a variety of different media forms.
Strategy #5: Bahama Breeze DivestitureDivesting Bahama Breeze is a viable option for Darden Restaurants, as it would generate revenue
to fund additional strategies for the company. Bahama Breeze is one of Darden’s most stagnant brands,
making it the most attractive to divest. This divestiture will give Darden Restaurants increased control
over its brands as it can focus its efforts on improving their operations.
As seen by the sale of Red Lobster in 2014 Darden has been restructuring its brands as a whole to
better fit its mission and vision. Bahama Breeze’s growth has been the least consistent and as a result, we
have decided to divest the brand and its assets. The proceeds from the sale will be used to pay off a
portion of Darden’s long-term debt. The lowering of long-term debt not only lowers Darden’s outstanding
obligations, but decreases the interest expense from year to year. This strategy will help to focus growth
of Darden’s six remaining stores and help to put Darden in an even more stable financial position.
Accept: (See Appendix S-U)
VI. STRATEGY IMPLEMENTATIONA. Management IssuesBahama Breeze Divestiture: There could be resistance amongst employees and management of Darden
for deciding to sell off this restaurant brand. Since Bahama Breeze was created internally within Darden,
it could be viewed as selling off a piece of the company that is inherent to the restaurant group. Next, it is
unclear as to whether or not Darden employees working at Bahama Breeze will remain employed or be
laid off; the new owners should exercise discretion.
Inventory Optimization: Implementing new software is key in reducing the amount of food going to
landfills. One negative aspect of this feature is that management may feel undermined in the process.
Until this point, they’ve had complete autonomy to order food and beverage items as they saw fit. Finding
out that their ordering processes are extremely wasteful could leave negative feelings.
19

Yard House Advertising Plan: Aside from Olive Garden and LongHorn Steakhouse, the remaining five
restaurants could feel animosity towards Yard House since they are the next restaurant brand to be
thrust into the spotlight. Higher sales mean higher bonuses for management and tips for servers.
B. Marketing IssuesBahama Breeze Divestiture: It may be viewed as a negative move to sell off another Darden Restaurant
brand. We do not want the stakeholders to think that our company is failing. Instead we are realigning
our restaurant brands to be more desirable.
Inventory Optimization: As it currently stands, Darden donates leftover food to their Harvest Program,
which then redistributes the food to local charities and shelters. Our objective is to decrease the amount
of waste being redistributed. It could look bad on Darden that they are decreasing the amount that they
are giving to the community.
Yard House Advertising Plan: One of the negatives for the marketing plan is the reliance on alcohol for
sales. That may be viewed negatively because we by no means want to promote irresponsible alcoholic
consumption.
C. Finance/Accounting IssuesBahama Breeze Divestiture: The divestiture will decrease our overall sales each year, but by paying off
long-term debt with the cash from purchase, it decreases our interest expense. We assume there is a
buyer for Bahama Breeze.
Inventory Optimization: This was a necessary financial strategy. Darden Restaurants is losing money
for every pound of food they redistribute. The new software has the capacity to forecast sales and
inventory. It will tell managers when to order certain products and overall it will reduce shelf-life and
spoilage. The cost for this strategy is relatively low when compared to the cost savings. Darden
Restaurants already owns their computer terminals, but they use their internally developed software.
The only negative aspect of this software is that it is to be rented from month to month. It would be
preferable to have a one-time purchase. However, since it is not a large expense, Darden is free to cancel
at any time. The cost is shown in Restaurant Expenses. We assume there to be a large cash savings each
year from the reduced amount of food purchased and the lower amount of food spoilage; however, this is
not promised.
20
Yard House Advertising Plan: There is a large amount of money being invested in the Yard House
marketing plan; but there is no way to know if that sales amount will produce definitive results. There’s
no way to guarantee what marketing initiatives yield results. As Yard House is such a profitable business
segment, once there is an audience visiting we expect a direct increase in Sales; however, this is not
promised.
D. Production/Operations IssuesBahama Breeze Divestiture: Eliminating Bahama Breeze means that our organizational structure has
shifted. This will affect operations, as Darden’s suppliers will no longer distribute Bahama Breeze
inventory to its locations. Jobs may be affected to adhere to this shift. In addition, Darden must address
whether or not to relocated Bahama Breeze managers to other Darden Restaurant locations.
Inventory Optimization: Overall there is a fear that new technology will negatively impact the supply
chain. While there is significant room for improvement- and improved efficiency is realistic- new systems
ordering may confuse employees and suppliers. Moreover, there is the business risk that the system may
be faulty or not perform to expectation.
Yard House Advertising Plan: Delays due to conflicts in production times in the filming of commercials
or printing of billboards may affect the potential reach if advertisements do not get placed accurately or
on time.
E. Information Systems Issues
Bahama Breeze Divestiture: Removing Bahama Breeze from the Darden system will be a timely task. In
addition, protecting customer information once the brand is divested is essential to maintain customer
loyalty to current Darden brands.
Inventory Optimization: The new POS features must be secure and not susceptible to hackers or other
cyber attacks. This system will contain vital information to the operation of the company in addition to
personal information about employees and customers. A cyber attack may delay operations or result in
significant capital expenditure to resolve the problem.
Yard House Advertising Plan: The social media portion of this strategy will drive traffic to Yard House’s
website. All technologies for this site must be up to date to accommodate this increase in online traffic. In
21

addition, the media form placed on social media must adhere to the technology available, using the most
effective mediums possible.
F. Research and Development IssuesDue to the nature of the restaurant industry Darden Restaurants does not incur and Research and
Development expenses.
VII. EVALUATION & CONTROL
A. Five-Year Projected Income Statement with Explanation
Darden Restaurants will undertake three strategic initiatives to ensure the long-term success and
stability of the company. The first strategy, the divestiture of Bahama Breeze, lowers our outstanding
long-term obligations and increases cash flows by eliminating $9 milion of interest expense paid each
year. The second strategy, the Yard House media plan, increases our top line to provide expanded growth
for a smaller brand. The final strategy, inventory optimization, cuts down on avoidable food waste which
in turn impacts our bottom line by decreasing expenses.
APPENDIX
Appendix A: Organizational Chart
Brand Manager
Operations Management
Team
Director of Operations
Managing Partner
Managers
Hourly Employees
Executive Chefs
Hourly Employees
The Capital Grille/ Seasons 52/ Eddie V’s/Bahama Breeze/ Yard House
Brand Manager: Reports directly to executive management
22
Appendix B: Organizational Chart
The Capital Grille/ Seasons 52/ Eddie V’s/Bahama Breeze/ Yard House
Brand Manager: Reports directly to executive management
23
President
Operations Management
Team
Senior Vice President of Operations
Director of Operations
Managing Partner
Managers
Hourly Employees
Executive Chefs
Hourly Employees
Olive Garden/LongHorn SteakhousePresident:
Reports directly to executive management
Operations Management Team: Visits and checks on various locations
Senior Vice President of Operations Oversees 100 restaurants
Director of Operations: Oversees 3-10 restaurants
Managing Partner: Oversees restaurant operations
Managers: Approximately 1-6 per restaurant
Executive Chefs: Approximately 1-3 per restaurant
Hourly Employees: Servers, line cooks, bussers, hostesses, etc.
24

Appendix C: Price per Plate and Price by Restaurant (Price)
Table 2: Entrée/Ticket Price by Restaurant
Olive
Garden
LongHorn
Steakhouse
The Capital
Grille
Bahama
Breeze
Yard
House
Eddie
V’s
Seasons
52
Lunch $7-15 $7-15 $12-39 $7-21 $7-32 N/A $8-31
Dinner $10-20 $12-25 $16-59 $9-30 $7-32 $18-61 $11-31
Average $17 $20 $75 $45 $31 $90 $26
The lunch and dinner rows highlight the prices of entrées and various meal options. The “average” row
shows what the typical price per person was including both meal and drink (Darden Restaurants, Inc.,
2015).
Appendix D: Store Breakdown in United States (Place)
Table 3: Stores in the United States
Olive
Garden
LongHorn
Steakhouse
The Capital
Grille
Bahama
Breeze
Yard
House
Eddie V’s Seasons
52
Stores 846 480 54 36 59 16 43
Franchised 20 13 1 0 0 0 0
Darden Restaurants, Inc. currently operates 1,534 restaurants in total between the United States and
Canada. There are an additional 34 franchised locations located in airports, Puerto Rico, Middle East,
Central and South America, and Malaysia. Overall, Darden projects 18-22 new restaurants to be opened in
2016, ranging from 0-1 Eddie V’s and Seasons 52, 6-8 Yard Houses, 1-2 Capital Grilles, Olive Gardens, and
Bahama Breezes, and lastly, 8-10 LongHorn Steakhouses.
Appendix E: Marketing Plan (Promotion)
Promotion and advertising vary strongly among the seven restaurants. Olive Garden advertises primarily
through national television, cable, and local TV ads, as well as utilizing digital advertising (Darden
Restaurants, Inc., 2015). In order to enhance its position across various demographics, Olive Garden has
created advertisements in Spanish to reach Hispanic customers. LongHorn Steakhouse focuses their
25

advertising strategy on local television time and digital advertising (Darden Restaurants, Inc., 2015). The
remaining five brands avoid television broadcasting, instead focusing on social media, outdoor platforms,
direct contact, mail, and the radio (Darden Restaurants, Inc., 2015). In years past, Darden used several
advertising agencies to manage their brands; however, in 2014 they began the move for all brands to be
handled by one agency.
Appendix F: Total Sales 2013-20152015 2014 2013
Sales (Millions) $6,764.0 $6,285.6 $5,921.0
Appendix G: SWOT
StrengthsSeven Distinct Brand Identities
As described under Customer Profiles, each of Darden’s restaurants provide customers with a unique
atmosphere to better serve its diverse customer base. Each restaurant offers a variety of different foods,
ranging from Olive Garden’s Italian cuisine to Longhorn’s high quality steak to Eddie V’s fresh seafood.
Darden offers food for any type of dining experience, hitting different markets within the dine-in
industry. This gives Darden a competitive advantage over Bloomin’ Brands and Yum! Brands as their
offerings are not as diverse or well defined.
Menu with Dietary Approved Items
With an increase in consumer awareness in the types of food that they are eating, customers are turning
towards healthy alternatives when dining out. Darden restaurants offer dietician approved menus that
allow people who are looking to eat healthy to dine at one of the various restaurants (“Darden Restaurant
Profile”). This also continues to broaden Darden’s customer base.
Large Operational Network
Darden operates 1528 restaurants in the United States as well as 40 more locations internationally
(Darden Restaurants, Inc.). Today, it is considered the “largest full service restaurant company” in
America, serving millions of patrons each year.
Company Control
26

Darden operates and owns all of its restaurants in the United States with optimal efficiency, as the only
sites that are franchised are its international restaurant locations (“Darden Restaurant Profile”). This
gives Darden complete control over its brands and ensures consistency among the restaurants in
different locations.
Top-Line Growth
From 2014 to 2015, Darden has increased its margins and profitability ratios due to the creation of new
restaurants and a better overall performance of existing restaurants (Darden Restaurants, Inc.). A
decrease in Darden’s expenses has also occurred, increasing its bottom line and creating better
operational efficiency for the company.
Weaknesses
Reliance on Domestic Market (Weak International Presence)
Darden lacks a large international presence, as only 40 of its 1568 restaurants are international locations
(Darden Restaurant Profile). Darden has struggled within the past couple of years to maintain these
restaurants abroad as strong brands like Olive Garden, do not hold the same integrity as they do in the
United States. Darden is missing out on a large portion of its potential market and revenue by sticking
mainly to the United States and limiting its expansion. Current competitors are taking advantage of
international expansion. To keep up with this competition, Darden needs to consider whether it would
add value to the company to expand.
Poor Waste Management
Currently, Darden sends 71% of its waste to landfills; while its food waste is something that Darden
should have complete control over. Inventory control is an extremely important matter for restaurant
companies and poor inventory management (waste management) is proving to be a large cost for Darden
that is affecting its bottom line.
Declining Liquidity
Darden’s decline in its current ratio from 1.2 in 2014 to .8 in 2015 proves that there is a decline in
liquidity (Darden Restaurants, Inc.). This prevents Darden from generating funds to pay off current debts
and prevents Darden from having funds at its expense in the case that an extraordinary expense is
incurred. If their liquidity continues to decrease, Darden is put more at risk to not be able to meet their
financial needs.
27

Opportunity
Increasing Online Presence
Darden has placed significant efforts towards growing its online presence, increasing brand awareness.
In 2014, Darden consolidated each of its brands onto one platform, enhancing its marketing towards
specific customers segments (“Darden Restaurant Profile”). This online marketing tool has also been able
to reach a wider customer base as its advertising is tailored to specific languages, preferences, and
locations of its customers. In addition, Darden has tested out new online ordering systems, increasing
consumer engagement and brand loyalty. This system was made available nationwide in 2015 in addition
to personalized e-gift cards, leveraging more business in alternative ways.
More Efficient Technology Available
Touch screen ordering systems and improvements in food management software can increase Darden’s
bottom line as it allows restaurants to forecast how much food will be necessary for operations, This will
also help to address Darden’s waste management concerns.
Favorable Growth Trends
According to a study by MarketLine in 2015, the restaurant industry is forecasted to grow at a compound
annual growth rate of 4.3% between 2014- 2019 (Darden Restaurant Profile). This will provide Darden
with new opportunities as its revenues are forecasted to increase because of this trend as well.
Threats
Intense Competition
The full service dining industry is a very competitive market as consumers’ choices are dependent on
their tastes, location, economic trends, demographic trends, ect. Darden’s competition comes from a
variety of other restaurants within the full service industry, while also competing with fast food
restaurants, local restaurants, pre-prepared meals sold at supermarkets, and home cooked meals. Each of
these forms of competition could potentially harm Darden’s market share.
Economic Trends in Consumer Spending
It is evident that consumer spending greatly affects the restaurant industry. Darden could experience a
decrease in revenue if there is an economic downturn, causing consumers’ disposable income to decrease
(Darden Restaurant Profile). With this decrease, customers will be less willing to spend their money on
activities like going out to eat.
28

Health Concerns
Restaurants are subject to numerous different health related issues on any given day as outbreaks of
viruses or food-borne illnesses may occur. These instances pose a major threat to Darden as poorly
prepared meals may affect Darden’s brand reputation. A health related concern does not have to begin in
a restaurant to cause a decrease in customers, as outbreaks like the flu can prevent people from trusting
others to handle their food in general.
Economic trends in Labor Costs
An increase in minimum wage could greatly affect Darden’s income as minimum wage has been rising
within the past few years (“Darden Restaurant Profile”). This, along with the threat of employees working
overtime, increases Darden’s labor cost, affecting it operating margin.
Appendix H: Food Service Transactions
KEY FINDINGS
Canada has the
highest amount of
food service
transactions per
capita
United States,
Australia, and Brazil
have the second
highest transactions
Russia, South Africa,
parts of Europe have
the lowest foodservice transactions
(Canada)
29
30

Appendix I: Total Sales by Segment 2013-2015
% of Sales 2015 2014 2013
Olive Garden 56.03% 57.96% 62.23%LongHorn Steakhouse 22.84% 22.02% 20.79%Yard House 6.95% 6.66% 4.36%The Capital Grille 5.96% 5.78% 5.60%Bahama Breeze 3.09% 3.21% 2.93%Seasons 52 3.53% 3.12% 2.67%Eddie V’s 1.43% 1.25% 1.10%*Disclaimer: Remaining .17% is considered other income. Appendix J: Number of Stores 2013-2015
2015 2014 2013
Olive Garden 846 837 828LongHorn Steakhouse 480 464 430Yard House 59 52 44The Capital Grille 54 54 49Bahama Breeze 36 37 33Seasons 52 43 38 31Eddie V’s 16 15 12
Appendix K#: Waste Management
ObjectiveDecrease Cost of Goods Sold
Problem
10 million pounds of preconsumer food gets donated to Darden HarvestSignifies there is more being wasted
StrategyRationalize supply chain to cut costs
Tactics
Invest in inventory and waste management softwareReal-time inventory updates and suggestionsConnect software to distribution centers
31

Appendix L: International Expansion
Appendix M: Brand Restructuring
ObjectiveIncrease revenue and expand market share
Problem
Darden Restaurants relies on its domestic marketplace to generate revenue. Because of this, they are limiting their reach in potential market segments in different geographic locations.
Strategy
Expand Olive Garden and LongHorn Steakhouse restaurants into the European market.
Tactics
Instead of franchising the international operations, Darden will own and control the restaurants
ObjectiveDecrease debt structure
Problem
Sales have grown overall, but Bahama Breeze has remained stagnant
Strategy
Avoid selling off brand Still generates moneyMakes our business look questionable to stakeholders
Tactics
Slowly transform underperforming Bahama Breeze's into Yard HousesYard House is the highest revenue-generating restaurant unitOpen new restaurants in "Beer Loving" cities
32

Appendix N: Yard House Advertising Plan
Appendix O: Bahama Breeze Divestiture
ObjectiveIncrease sales for Yard House.
Problem
The average advertising spend for Yard House is currently less than one percent of Darden Restaurant's total advertising expense. In addition, brand awareness for Yard House is not very high.
Strategy
Develop a more aggressive advertising plan specifically for Yard House.
Tactics
Implement social media marketingUtilize television combined with sports marketing to effectively reach the target market.
ObjectiveDecrease long-term debt and related expenses
ProblemBahama Breeze's growth has remained stagnant
StrategyDivest Bahama Breeze and its related assets
Tactics
Apply the cash from sale to an outstanding long-term note to decrease interest expense
33

Appendix P: Base Business Key Assumptions
% of Sales 2015 2014 2013
Olive Garden 56.03% 57.96% 62.23%LongHorn Steakhouse 22.84% 22.02% 20.79%Yard House 6.95% 6.66% 4.36%The Capital Grille 5.96% 5.78% 5.60%Bahama Breeze 3.09% 3.21% 2.93%Seasons 52 3.53% 3.12% 2.67%Eddie V’s 1.43% 1.25% 1.10%
Appendix Q: Restaurant Brand Sales Growth Rate2016 2017 2018 2019 2020
Olive Garden 2% 2% 2% 2% 2%LongHorn Steakhouse 12% 12% 12% 12% 12%
Yard House 18% 16% 14% 12% 10%The Capital Grille 10% 10% 10% 10% 10%Bahama Breeze 4% 4% 4% 4% 4%Seasons 52 20% 20% 20% 20% 20%Eddie V’s 22% 22% 22% 22% 22%
These growth rates were taken from a four-year historical average. In some cases, Darden rounded down
because there is no way that certain grown rates were sustainable in the long-term. For example, Yard
House had an average growth rate of 35%. Moreover, smaller revenue generating restaurants such as
Seasons 52 and Eddie V’s can support their larger growth rates because there is room for expansion in
the marketplace.
Appendix R: Expenses as Percentage of SalesFood and Beverage 31% Three year historical average
Restaurant Labor 31% Three year historical averageRestaurant Expenses 17% Three year historical averageMarketing Expenses 3% Three year historical averageGeneral and Administrative 6% Three year historical averageTax Rate 26.63% Eight year historical average, Darden 10-K
34

Appendix S: Divestiture of Bahama Breeze Key Assumptions
BB Sales $209 million Followed treatment for Red Lobster DisposalBB PP&E Valuation $54.6 million BB portion of Darden PP&E BB Land-Only Leases 16 Proportion of Total Restaurants Ground and Building Leases 2 Proportion of Total Restaurants Space/In-Line/Other Leases 5 Proportion of Total Restaurants Owned Sites 13 Proportion of Total RestaurantsBB Food/Beverage Expense $69.5 million Proportion of Total SalesBB Restaurant Labor Expense $69.9 million Proportion of Total SalesBB Restaurant Expenses $37 million Proportion of Total SalesBB Marketing Expenses $0.4 million Darden Marketing Plan - Red BooksBB Depreciation Expense $52 million Straight-line depreciationInterest Expense from Note 8 $18.6 million $150 million note at 6% interest due in 2035Red Lobster % of Sales 85.77% Darden 10-K (2014)
Appendix T: Property, Plant, Equipment and Sales Valuation
35

Appendix U: Bahama Breeze Divestiture Pro Forma
Appendix V: Yard House Marketing Plan Key Assumptions
Yard House Sales Base Business Pro FormaMarketing Sales Increase in sales of 12% (2016), 10% (2017),
8% (2018), 6% (2019), and 6% (2020)YH Food/Beverage Expense (2016) $14.6 million Proportion to YH SalesYH Labor Expense (2016) $14.8 million Proportion to YH SalesYH Restaurant Expense (2016) $7.8 million Proportion to YH SalesYH Increase in Sales Followed treatment for Olive Garden re-brandOlive Garden Rebrand Sales Increase 5.5% Darden 10-K (2014)Social Media Reach % Increase 20% Followed treatment for Olive Garden re-brand
36

Appendix W: Yard House Media Spend Plan
Appendix X: Schedule of Advertisements
37
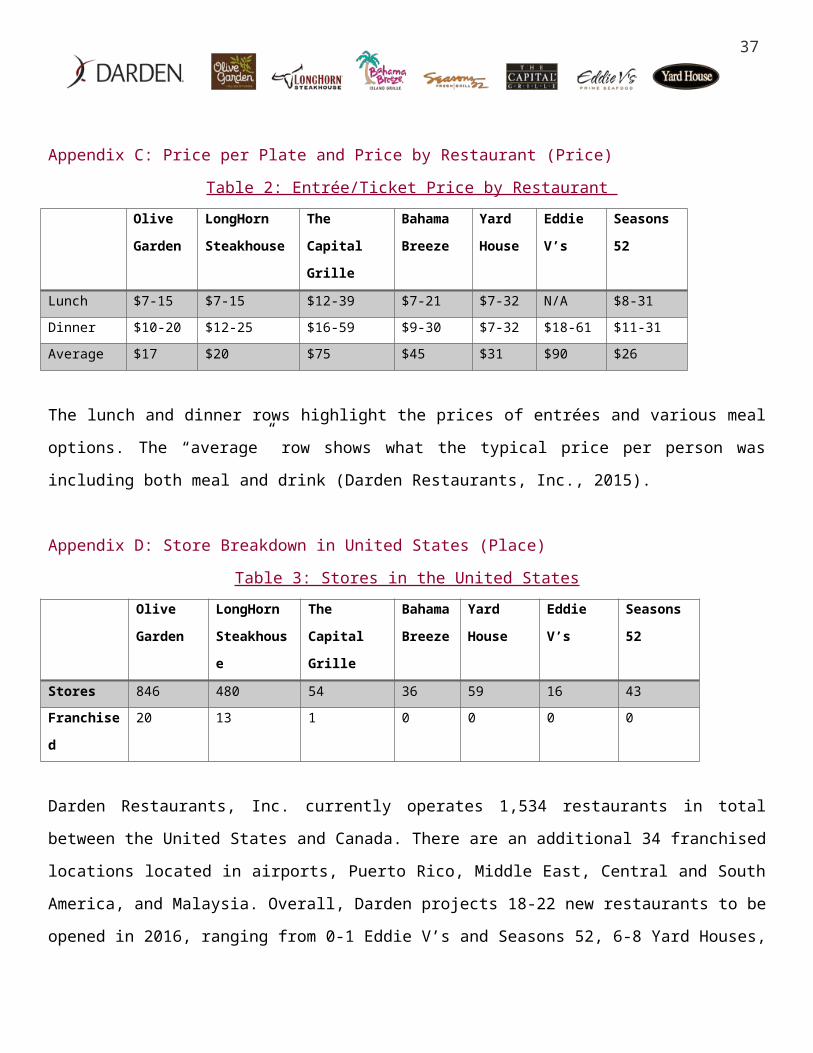
Appendix Y: Social Media Plan
Appendix Z: Yard House Target Persona
38

Appendix AA: Yard House Marketing Plan Pro Forma
Appendix AB: Inventory Optimization Key Assumptions
Percentage Allocation: Food 87.49% Darden 10-K; Proportion of Breakdown of BeveragesPercentage Allocation: Beverage
12.51% Darden 10-K; Cost Breakdown of Beverages
Syrus Consulting Cost $500,000 Syrus Industry Professional# of Employees to Train 140,000 Darden 10-KMinimum Wage $7.95 Average of 50 StatesHours of Training 2 Consultation with Syrus Industry ProfessionalAnnual Software Cost Per Store $18,000 Consultation with Syrus Industry ProfessionalAnnual Store Increase 20 Darden 10-K; Historic Growth TrendsFood Cost Decrease 2%-4% Consultation with Syrus Industry Professional
Initial Investment $5,487,200CF1 $39,390,000CF2 $32,270,000CF3 $66,250,000CF4 $81,290,000CF5 $97,250,000WACC 3.08%NPV $297,970,804
39

Appendix AC: Inventory Optimizations
Appendix AD: Rejecting Strategies – International Expansion
Darden’s International locations have been performing badly in the last three years. There have been negative earnings for international locations. At some point in Darden’s future, they should consider expanding internationally; however, they need to focus attention on other issues before expanding abroad.
Appendix AE: Rejecting Strategies – Brand Restructuring
While the original plan was to turn Bahama Breeze locations into new Yard House locations, there is a large difference in the square footage needed for a Yard House. Therefore, the Bahama Breeze locations cannot fit or handle the Yard House restaurants.
40

Appendix AF: Darden Restaurants Current Media Spending
41

Appendix AG: Los Angeles Angels Corporate Sponsorship
Appendix AH: Social Media Mock Posts
42
Appendix AI: Outdoor Advertisements: Billboard
43

Appendix AJ: Mintel Craft Beer Trends and Buzz Words
44

REFERENCES
“Advertise on ESPN.com Your Way”. (2016). ESPNCMS. Retrieved from
http://espncms.com/advertise-on-espn.html
“Billboard Advertising” (2016). Retrieved from http://www.bluelinemedia.com/billboard-advertising
Bloomin’ Brands, Inc. (2015). Form 10K 2015. Retrieved from
http://investors.bloominbrands.com/financials.cfm
Bloom, Beth. (2015, October). Craft Beer-US. Retrieved from Mintel Reports Database.
"Canada." MarketLine. MarketLine, Nov. 2014. Web. 24 Mar. 2015.
Childe, Helena. (2014, December). Craft Beer Opportunities for Restaurants. Retrieved from Mintel
Reports Database.
Citizenship (n.d.). Retrieved March 20, 2016, from https://www.darden.com/citizenship
Darden Annual Report. (2015). Retrieved from
https://investor.darden.com/investors/investor-relations/default.aspx
Darden's Mission. (n.d.). Retrieved January 31, 2016, from
https://investor.darden.com/investors/investor-relations/default.aspx
"Darden Restaurants Inc in Consumer Foodservice (World)." Euromonitor, 16 Mar. 2011. Web.
<http://www.portal.euromonitor.com.ezproxy.sju.edu/portal/analysis/tab>.
“Darden Restaurant Profile”. Marketline Advantage. Marketline Advantage, n.d. Web.
http://advantage.marketline.com.ezproxy.sju.edu/Product?pid=18D939E7-B036-42A9-86BF-
16CF2EA899C2&view=SWOTAnalysis
Darden Restaurants, Inc. (2015) Form 10-K. Retrieved from
https://investor.darden.com/investors/investor-relations/default.aspx
Dover, Jeff. " Eleven trends and factors affecting Canada’s foodservice industry." Restaurant Central.
Executive Leadership. (2015) Darden Restaurants. Retrieved from
https://www.darden.com/our-company/executive-leadership
“Facebook for Businesses”. (2016, April). Retrieved from
https://www.facebook.com/business/?campaign_id=838271292900675&placement=exact&creat
ive=86514484749&keyword=facebook+advertising&extra_1=25149018-e4de-426b-9297-
736707b50a4f
45

Gallo-Torres, Juia. (2015, April). Full Service Restaurants-Casual, Family and Fine Dining- US. Retrieved
from Mintel Reports Database.
History of Darden Restaurants, Inc. (2016). Retrieved February 13, 2016, from
http://www.referenceforbusiness.com/history2/73/Darden-Restaurants-Inc.html
How Twitter Ads Work. (2016, April). Retrieved from
https://ads.twitter.com/accounts/18ce54b4rna/campaigns/new/tweet_engagements?
source=objective_picker
Hulu Advertising. (2016). Retrieved from http://www.hulu.com/advertising
Jones, Adam. "Welcome to Market Realist." Restaurant Indicator: Savings Rate And Disposable Income
Increase. Market Realist, Inc., 26 Feb. 2015. Web. 11 Feb. 2016.
"Malaysia." MarketLine. MarketLine, Dec. 2014. Web. 24 Mar. 2015.
“The Metro Areas that are Magnets for Millenials”. (2016). Forbes. Retrieved from
http://www.forbes.com/pictures/edgl45ghjk/introduction-13/#d1111182ea7a
Porth, Stephen J. (2011) Strategic Management: A Cross-functional Approach. Boston:
Pearson.
Redbooks. “Darden Restaurants, Inc.”, Media Spending.
Restaurant Central, 1 May 2014. Web. 25 Mar. 2016.
“TV Ad Prices: Football, ‘Empire,’ ‘Walking Dead,’ ‘Big Bang Theory’ Top The List”. Steinberg, Brian. (2015, September).
Retrieved from http://variety.com/2015/tv/news/tv-advertising-prices-football-empire-walking-dead-big-bang-
theory-1201603800/
YUM! Brands, Inc. (2014) Form 10K 2014. Retrieved from
https://www.sec.gov/Archives/edgar/data/1041061/000104106115000007/
yum10k12272014.htm
Wall, Bethany. (2014, April). Full Service Restaurants- US. Retrieved from Mintel Reports Database.
Wisson, Chris. (2015, June). The Market for Craft Beer-UK & US. Retrieved from Mintel Reports Database.
“Workplace Standards.” Government of Canada. N.p., N.d. Web. 21 Mar. 2015.
46