dars.tamu.edudars.tamu.edu/dars/files/b9/b98e53e8-63b7-45ae-ad3… · web viewdars.tamu.edu
TRANSCRIPT
Fall 2012 Graduating Seniors College of Science
Last Modified: 01/31/2013
Filter By: Report Subgroup
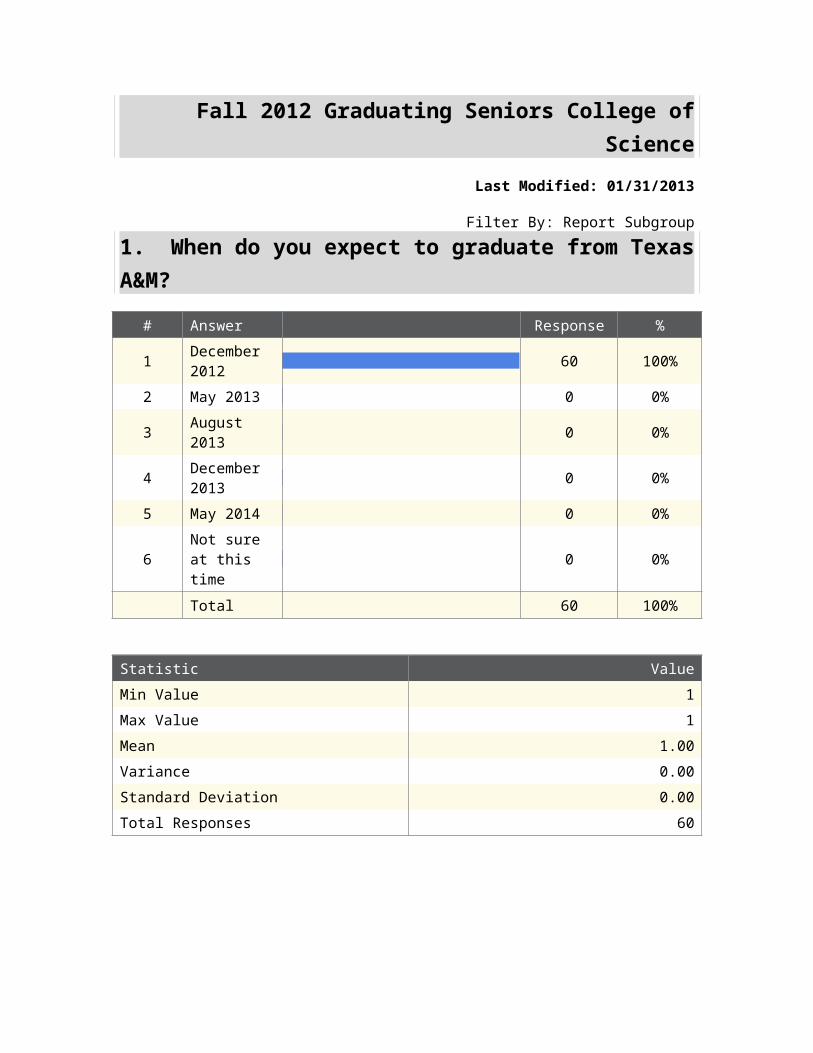
1. When do you expect to graduate from Texas A&M?
# Answer Response %
1 December 2012 60 100%
2 May 2013 0 0%
3 August 2013 0 0%
4 December 2013 0 0%
5 May 2014 0 0%
6 Not sure at this time 0 0%
Total 60 100%
Statistic Value
Min Value 1
Max Value 1
Mean 1.00
Variance 0.00
Standard Deviation 0.00
Total Responses 60
2. What degree will you receive?
# Answer Response %
1 BA 13 22%
2 BS 47 78%
3 B.B.A. 0 0%
4 B.Ed 0 0%
5 B.L.A. 0 0%
Total 60 100%

Statistic Value
Min Value 1
Max Value 2
Mean 1.78
Variance 0.17
Standard Deviation 0.42
Total Responses 60
3. From what college are you graduating?
# Answer Response %
1 AG 0 0%
2 AR 0 0%
3 BA 0 0%
4 ED 0 0%
5 EN 0 0%
6 GE 0 0%
7 LA 0 0%
8 SC 60 100%
9 VM 0 0%
10 GV 0 0%
Total 60 100%
Statistic Value
Min Value 8
Max Value 8
Mean 8.00
Variance 0.00
Standard Deviation 0.00
Total Responses 60

4. Did you
# Answer Response %
1enter TAMU as a freshman?
48 80%
2transfer from another school?
12 20%
Total 60 100%
Statistic Value
Min Value 1
Max Value 2
Mean 1.20
Variance 0.16
Standard Deviation 0.40
Total Responses 60
5. Did you change major while at TAMU?
# Answer Response %
1 Yes 17 28%
2 No 43 72%
Total 60 100%
Statistic Value
Min Value 1
Max Value 2
Mean 1.72
Variance 0.21
Standard Deviation 0.45
Total Responses 60
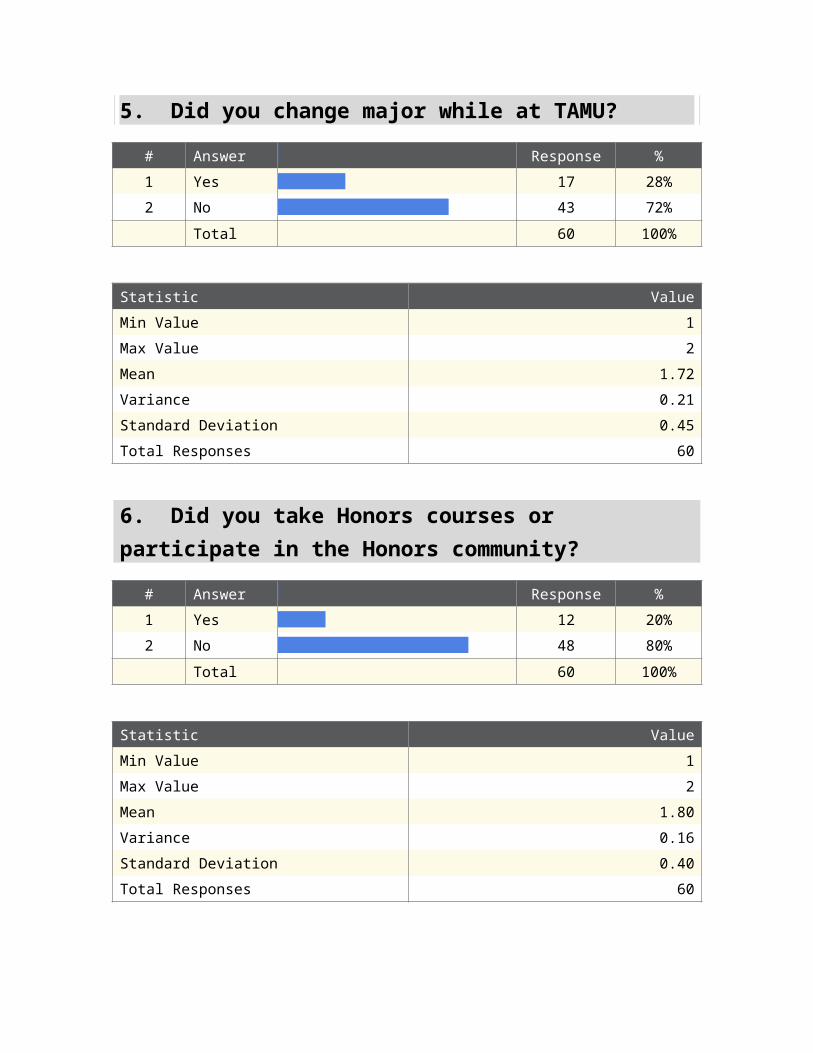
6. Did you take Honors courses or participate in the Honors community?
# Answer Response %
1 Yes 12 20%
2 No 48 80%
Total 60 100%
Statistic Value
Min Value 1
Max Value 2
Mean 1.80
Variance 0.16
Standard Deviation 0.40
Total Responses 60
7. How many hours of Honors courses did you take while at Texas A&M?
# Answer Response %
1 3 or less 3 25%
2 4 to 8 5 42%
3 9 or more 4 33%
Total 12 100%
Statistic Value
Min Value 1
Max Value 3
Mean 2.08
Variance 0.63
Standard Deviation 0.79
Total Responses 12
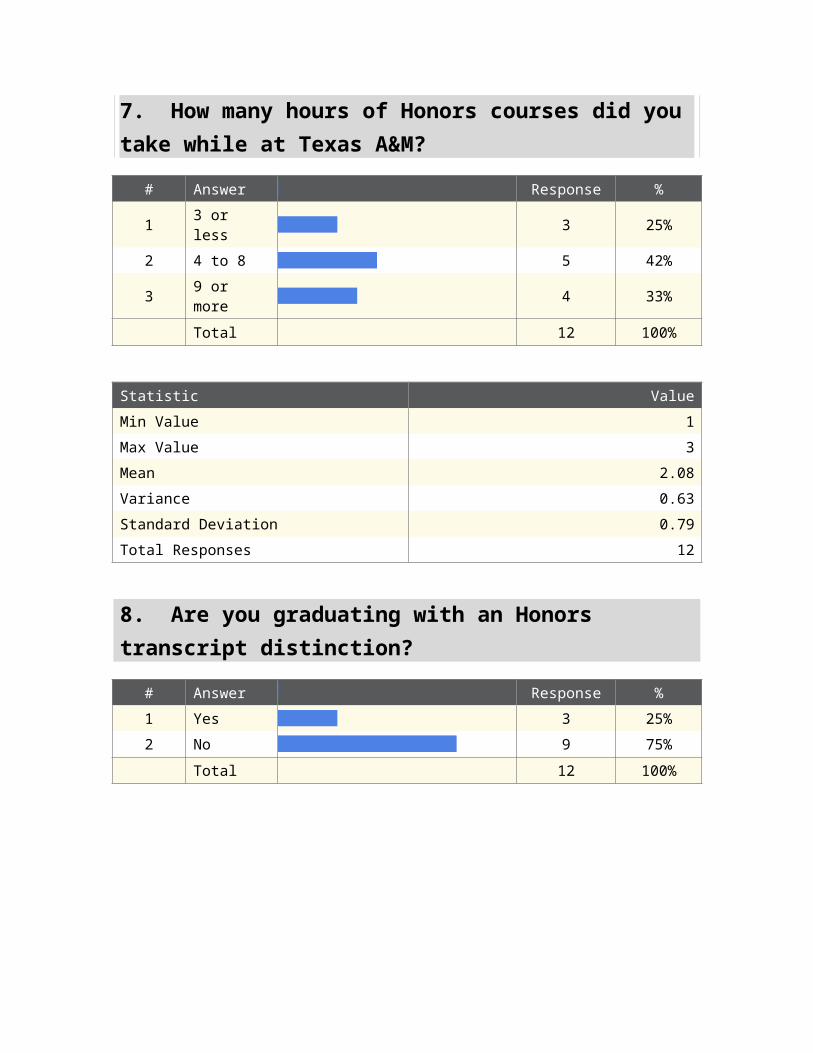
8. Are you graduating with an Honors transcript distinction?
# Answer Response %
1 Yes 3 25%
2 No 9 75%
Total 12 100%
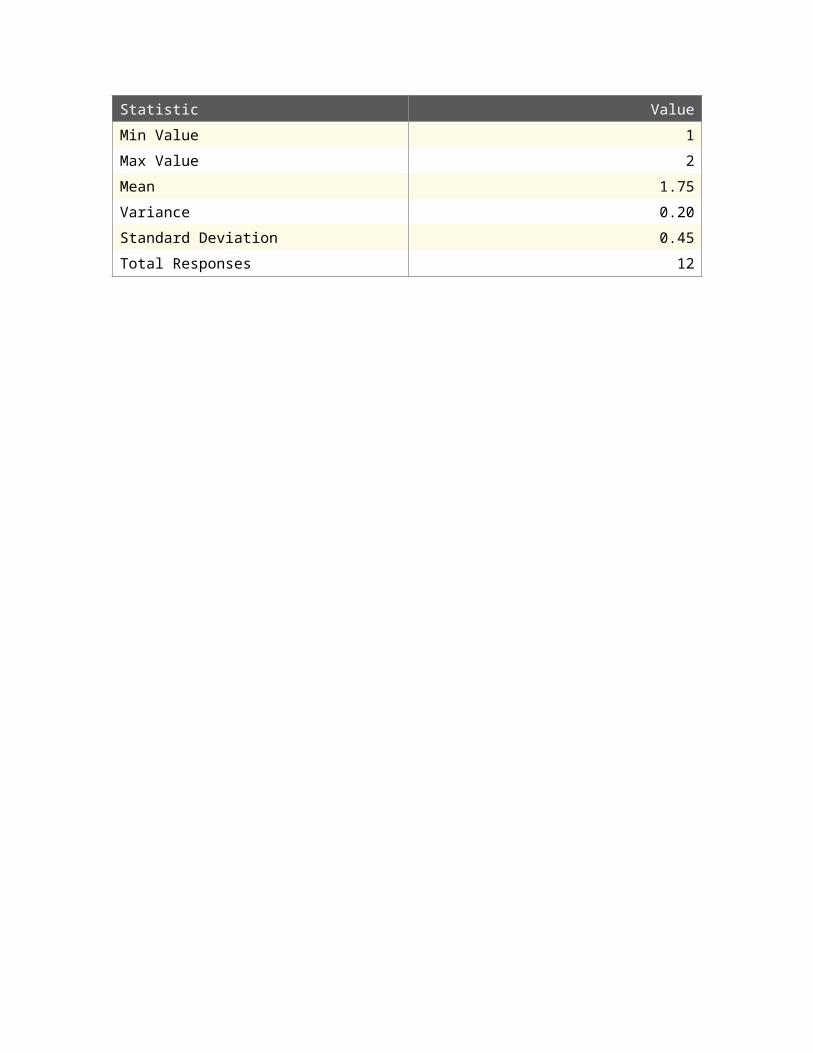
Statistic Value
Min Value 1
Max Value 2
Mean 1.75
Variance 0.20
Standard Deviation 0.45
Total Responses 12
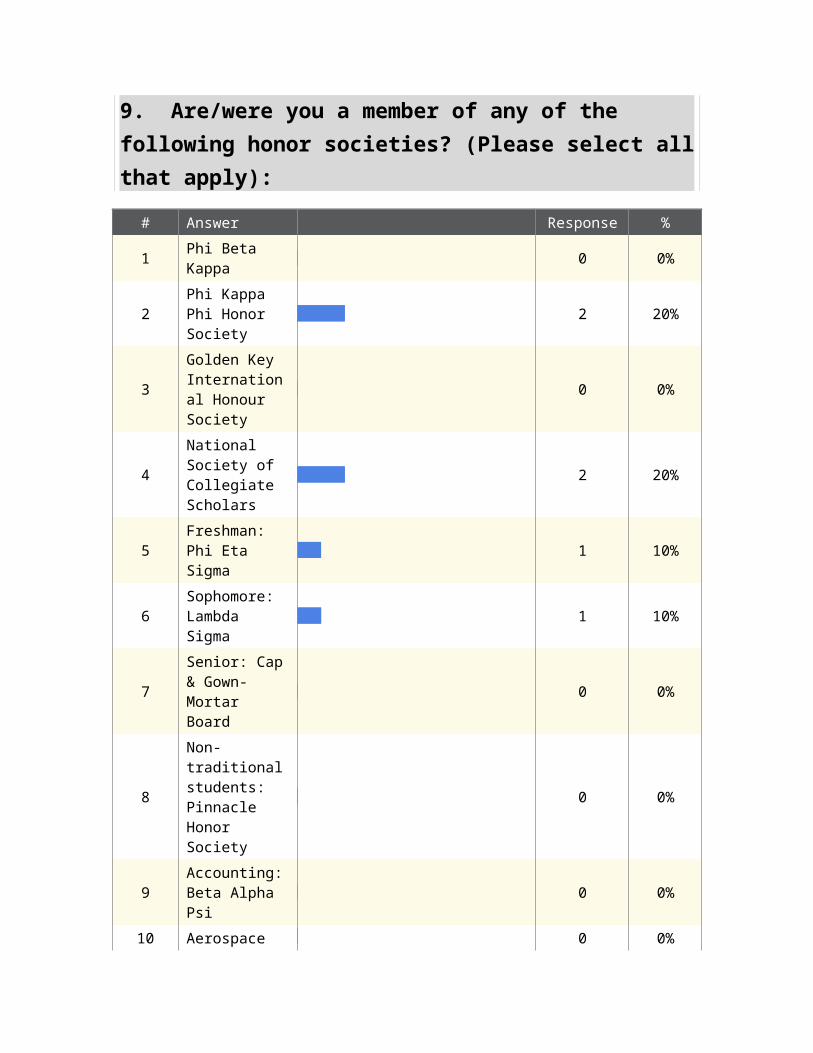
9. Are/were you a member of any of the following honor societies? (Please select all that apply):
# Answer Response %
1 Phi Beta Kappa 0 0%
2 Phi Kappa Phi Honor Society 2 20%
3Golden Key International Honour Society
0 0%
4National Society of Collegiate Scholars
2 20%
5 Freshman: Phi Eta Sigma 1 10%
6 Sophomore: Lambda Sigma 1 10%
7Senior: Cap & Gown-Mortar Board
0 0%
8
Non-traditional students: Pinnacle Honor Society
0 0%
9 Accounting: Beta Alpha Psi 0 0%
10
Aerospace Engineering: Sigma Gamma Tau
0 0%
11Agriculture: Gamma Sigma Delta
0 0%
12
Agriculture & Biomedical Sciences: Alpha Zeta
0 0%
13 Architecture: Tau Sigma Delta 0 0%
14 Biology: Beta Beta Beta 0 0%
15
Biomedical Engineering: Alpha Eta Mu Beta
0 0%
16
Business Administration: Beta Gamma Sigma
0 0%
17
Business Management: Sigma Iota Epsilon
0 0%
18
Chemical Engineering: Omega Chi Epsilon
0 0%
19 Civil Engineering: Chi Epsilon 0 0%
20 Communication: Lambda Pi Eta 0 0%
21Computer Science: Upsilon Pi Epsilon
0 0%
22Construction Science: Sigma Lambda Chi
0 0%
23 Dance: Nu Alpha Delta 0 0%
24 Education: Kappa Delta Pi 0 0%
25Electrical Engineering: Eta Kappa Nu
0 0%
26 Engineering: Tau Beta Pi 0 0%
27Engineering Technology: Tau Alpha Pi
0 0%
28 English: Sigma Tau Delta 0 0%
29 Floriculture: Pi Alpha Xi 0 0%
30 Geography: 0 0%

Gamma Theta Upsilon

31 Health: Eta Sigma Gamma 0 0%
32 Hispanic Studies: Sigma Delta Pi 0 0%
33History (international): Phi Alpha Theta
0 0%
34Industrial Distribution: Sigma Delta
0 0%
35Industrial Engineering: Alpha Pi Mu
0 0%
36International Education: Phi Beta Delta
0 0%
37 Mathematics: Pi Mu Epsilon 3 30%
38Mechanical Engineering: Pi Tau Sigma
0 0%
39Ocean Engineering: Omega Epsilon
0 0%
40Petroleum Engineering: Pi Epsilon Tau
0 0%
41 Philosophy: Phi Sigma Tau 0 0%
42 Political Science: Pi Sigma Alpha 0 0%
43Pre-Medicine: Alpha Epsilon Delta
0 0%
44 Psychology: Psi Chi 0 0%
45 Social Sciences: Pi Gamma Mu 0 0%
46 Sociology: Alpha Kappa Delta 0 0%
47 None 5 50%

Statistic Value
Min Value 2
Max Value 47
Total Responses 10
10. Did you receive any scholarships or fellowships while you were an undergraduate at Texas A&M?
# Answer Response %
1 Yes 27 45%
2 No 33 55%
Total 60 100%
Statistic Value
Min Value 1
Max Value 2
Mean 1.55
Variance 0.25
Standard Deviation 0.50
Total Responses 60

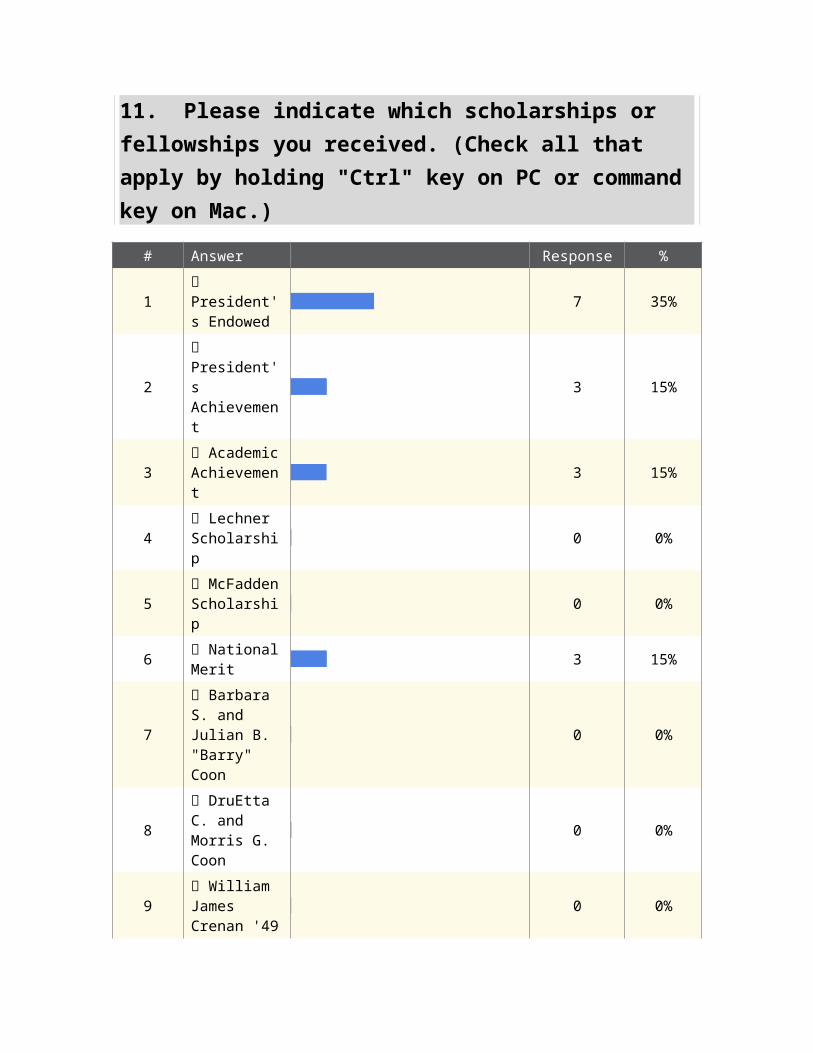
11. Please indicate which scholarships or fellowships you received. (Check all that apply by holding "Ctrl" key on PC or command key on Mac.)
# Answer Response %
1 President's Endowed 7 35%
2 President's Achievement 3 15%
3 Academic Achievement 3 15%
4 Lechner Scholarship 0 0%
5 McFadden Scholarship 0 0%
6 National Merit 3 15%
7 Barbara S. and Julian B. "Barry" Coon
0 0%
8 DruEtta C. and Morris G. Coon
0 0%
9 William James Crenan '49
0 0%
10 Lucille Dougherty 0 0%
11 Joseph H. Emmert, Jr. '69 0 0%
12 Melvin Hamilton '71 0 0%
13 Crawford and Hattie Jackson Foundation
0 0%
14
Katherine Ann Keller Memorial Scholarship
0 0%
15 Lola Mae & Charles
0 0%

LaMotte Memorial Scholarship

16 Annie Lee and Robert H. Schultz
0 0%
17
William A. Triche and Homer A. Triche
1 5%
18 Emily & Robert Walker '45
0 0%
19 John Todd Willis '44 0 0%
20 Randall C. Shepard '71 0 0%
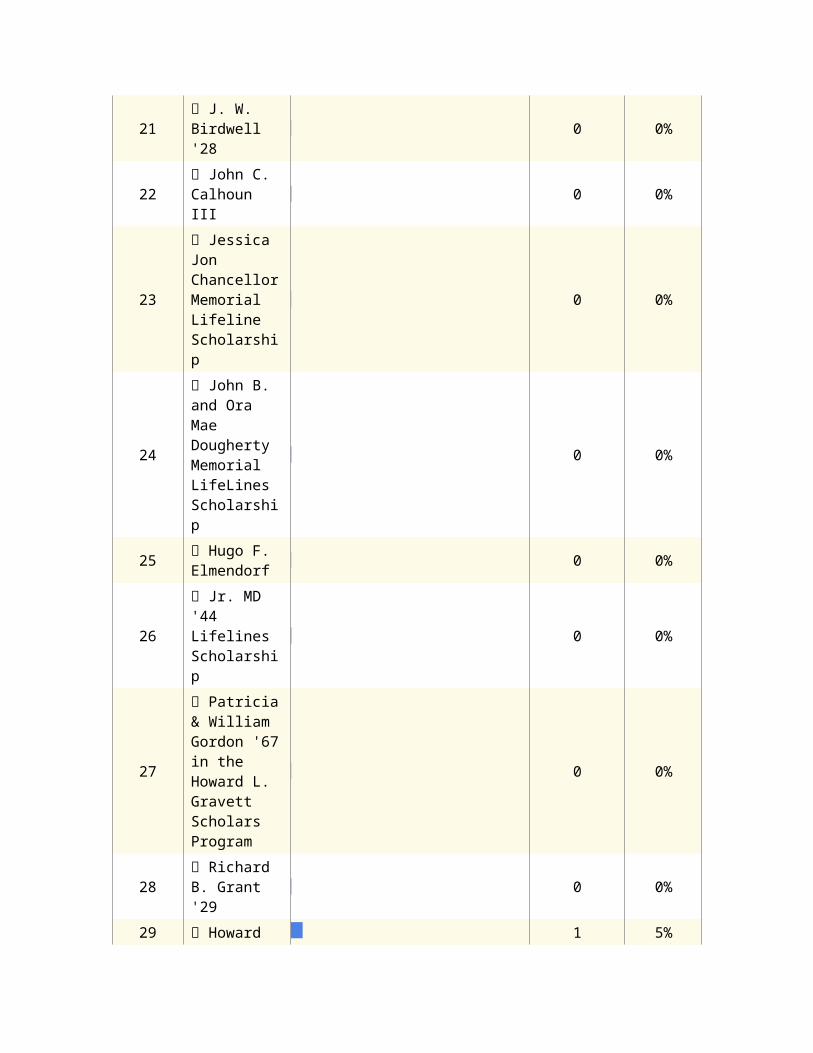
21 J. W. Birdwell '28 0 0%
22 John C. Calhoun III 0 0%
23
Jessica Jon Chancellor Memorial Lifeline Scholarship
0 0%
24
John B. and Ora Mae Dougherty Memorial LifeLines Scholarship
0 0%
25 Hugo F. Elmendorf 0 0%
26 Jr. MD '44 Lifelines Scholarship
0 0%
27
Patricia & William Gordon '67 in the Howard L. Gravett Scholars Program
0 0%
28 Richard B. Grant '29 0 0%
29 Howard Gravett 1 5%
30 Juilia Ball Lee 2 10%
31 HR Lewis 0 0%
32
Lifelines Endowed Scholarship Program
0 0%
33
Susan Luehr '84 Endowed Lifelines Scholarship
0 0%
34
Walter S. McGregor '38 Lifelines Memorial Scholarship
0 0%
35
Woodie Bennett Mike Scholarship in the Howard L. Gravett Scholars Program
0 0%
36 Jerry R. Jones 0 0%
37 William E. Wheeler '46 Lifelines
0 0%
38
Southeast Texas Health Professionals Lifelines
0 0%
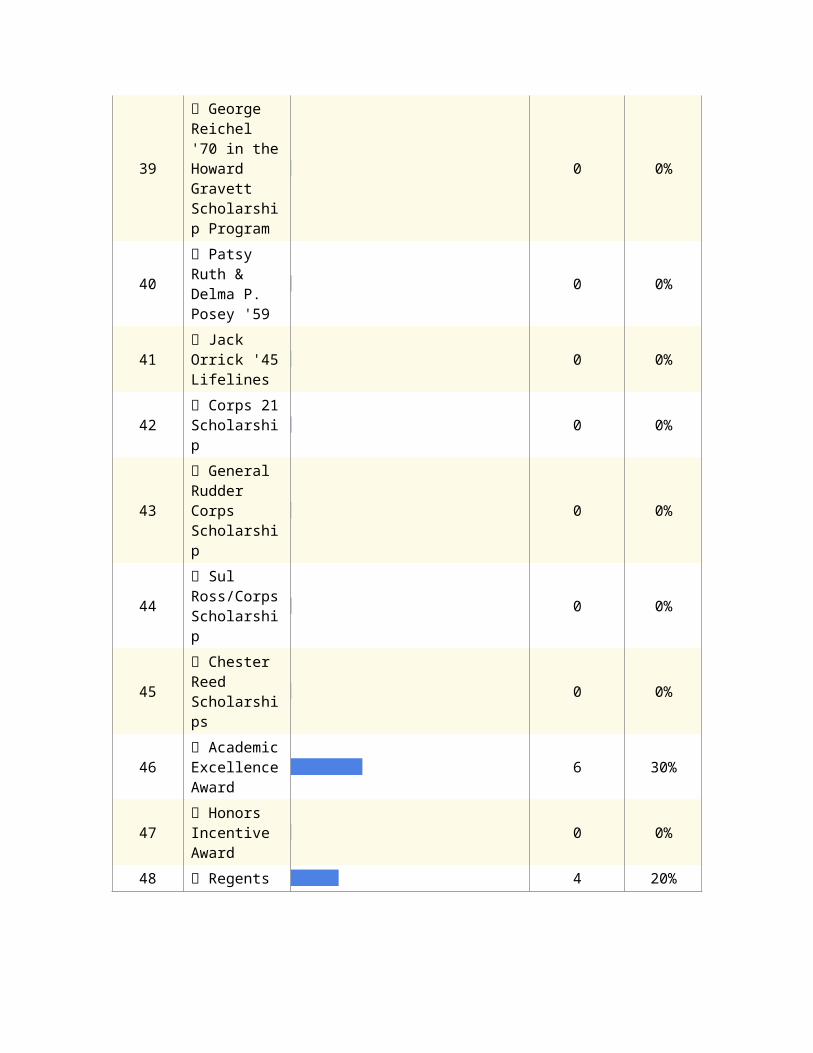
39
George Reichel '70 in the Howard Gravett Scholarship Program
0 0%
40 Patsy Ruth & Delma P. Posey '59
0 0%
41 Jack Orrick '45 Lifelines 0 0%

42 Corps 21 Scholarship 0 0%
43 General Rudder Corps Scholarship
0 0%
44 Sul Ross/Corps Scholarship
0 0%
45 Chester Reed Scholarships 0 0%
46 Academic Excellence Award
6 30%
47 Honors Incentive Award
0 0%
48 Regents 4 20%
Statistic Value
Min Value 1
Max Value 48
Total Responses 20

12. If you received other honors or awards while an undergraduate at Texas A&M, please list them here:
Award 1 Award 2 Award 3 Award 4
David Kipp Award Missy Holloway Award
John Beckham College of Science Award Dean's List
Dean's List
Robert C. Bryd Scholorship
Bolner Endowed Scholarship
Dean's List for two years
Bruce Clements Post-Secondary Education Scholarship
Dean's List
Community service Linda and Ralph Schumitt
Dean's Honor Role
Simple scholarships from Aggie moms club
Robert Noyce Scholarship
FWTC A&M Club Scholarship
Aggieland Bound Scholar CB Recognition Award CB Plus Award CD Holland
Scholarship
Top 10% Scholarship Early High School Scholarship
Statistic Value
Total Responses 13
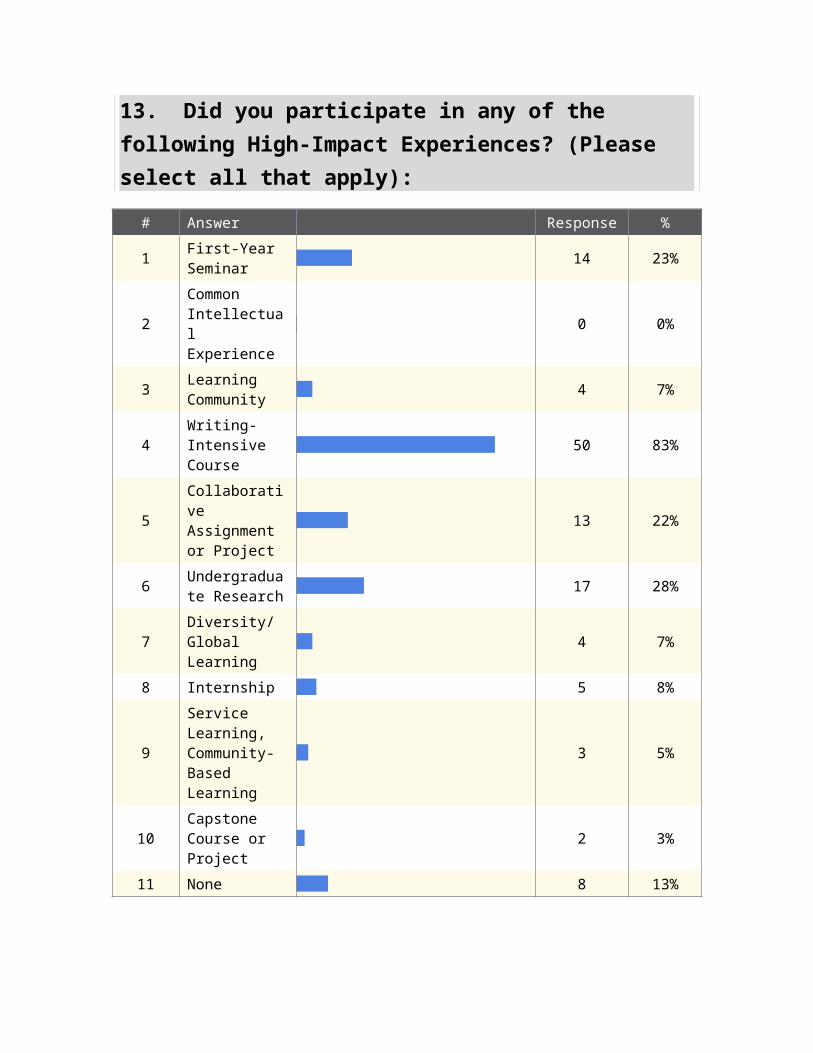
13. Did you participate in any of the following High-Impact Experiences? (Please select all that apply):
# Answer Response %
1 First-Year Seminar 14 23%
2Common Intellectual Experience
0 0%
3 Learning Community 4 7%
4 Writing-Intensive Course 50 83%
5Collaborative Assignment or Project
13 22%
6 Undergraduate Research 17 28%
7 Diversity/Global Learning 4 7%
8 Internship 5 8%
9Service Learning, Community-Based Learning
3 5%
10 Capstone Course or Project 2 3%
11 None 8 13%
Statistic Value
Min Value 1
Max Value 11
Total Responses 60

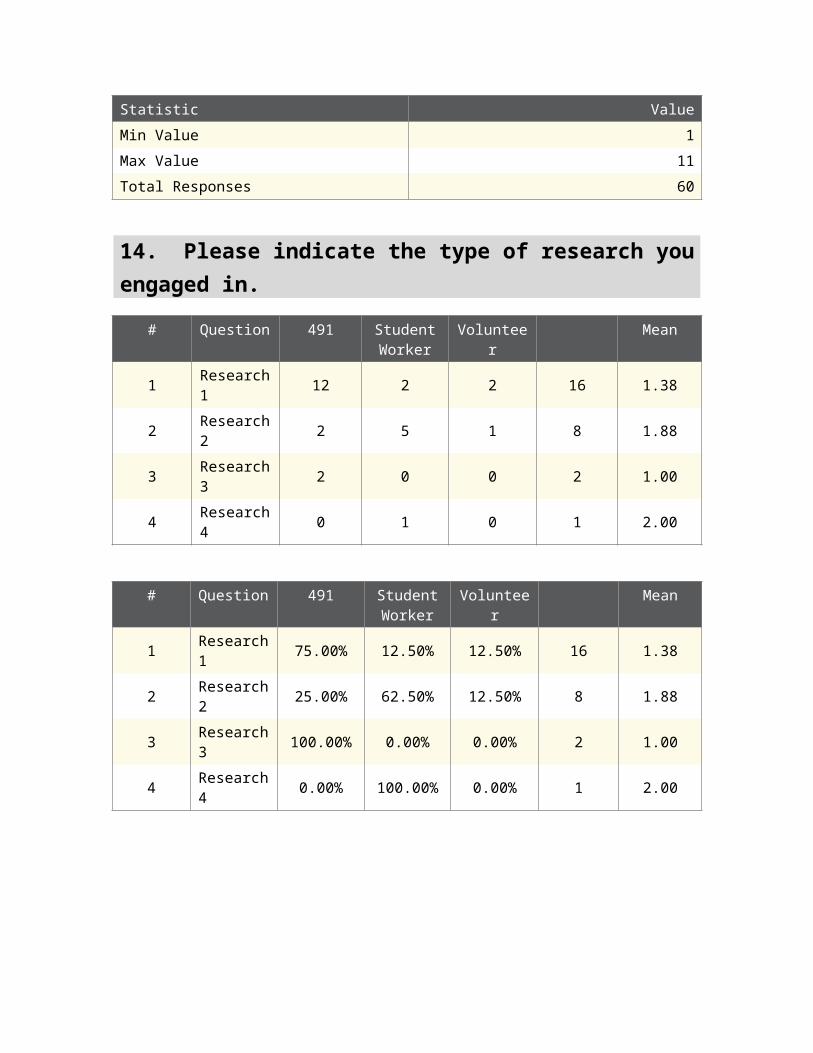
14. Please indicate the type of research you engaged in.
# Question 491 Student Worker
Volunteer Mean
1 Research 1 12 2 2 16 1.38
2 Research 2 2 5 1 8 1.88
3 Research 3 2 0 0 2 1.00
4 Research 4 0 1 0 1 2.00
# Question 491 Student Worker
Volunteer Mean
1 Research 1 75.00% 12.50% 12.50% 16 1.38
2 Research 2 25.00% 62.50% 12.50% 8 1.88
3 Research 3 100.00% 0.00% 0.00% 2 1.00
4 Research 4 0.00% 100.00% 0.00% 1 2.00
Statistic Research 1 Research 2 Research 3 Research 4
Min Value 1 1 1 2
Max Value 3 3 1 2
Mean 1.38 1.88 1.00 2.00
Variance 0.52 0.41 0.00 0.00
Standard Deviation 0.72 0.64 0.00 0.00
Total Responses 16 8 2 1
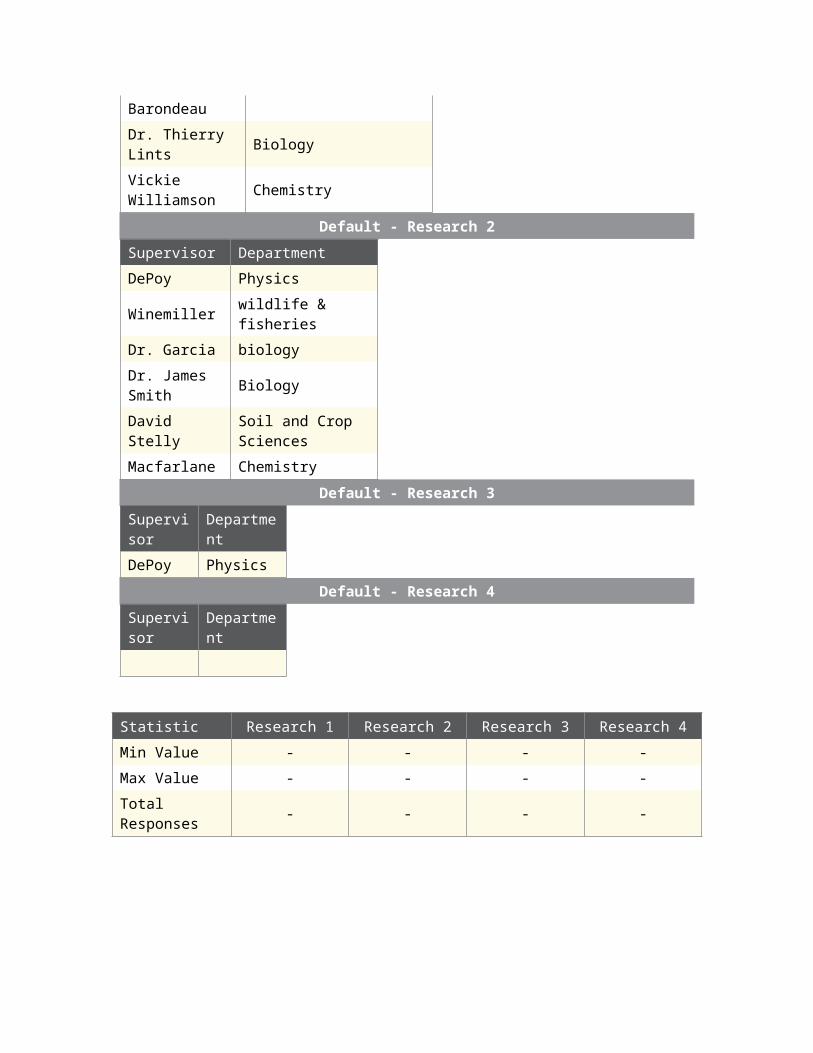
15. Research Supervior and Department
Default - Research 1
Supervisor Department
Lanigan London Physics
Dr. Wayne Versaw Biology
Mary Wicksten Biology
Dr. de Figueiredo Plant Pathology
Rosenthal BIology
Dr. Lints Biology

Dr.Erickson biology
Ryland Young Center for Phage Technology
Dr. James Smith Biology
Dr. Wellman Neuroscience
Lawrence Griffing Biology
Dr. Sorg Biology
Dr. Jason Gill BICH
Prof. Barondeau Biochemistry
Dr. Thierry Lints Biology
Vickie Williamson Chemistry
Default - Research 2
Supervisor Department
DePoy Physics
Winemiller wildlife & fisheries
Dr. Garcia biology
Dr. James Smith Biology
David Stelly Soil and Crop Sciences
Macfarlane Chemistry
Default - Research 3
Supervisor Department
DePoy Physics
Default - Research 4
Supervisor Department
Statistic Research 1 Research 2 Research 3 Research 4
Min Value - - - -
Max Value - - - -
Total Responses - - - -

16. Did you make any presentations or publications as an undergraduate?
# Answer Response %
1 Yes 6 35%
2 No 11 65%
Total 17 100%
Statistic Value
Min Value 1
Max Value 2
Mean 1.65
Variance 0.24
Standard Deviation 0.49
Total Responses 17
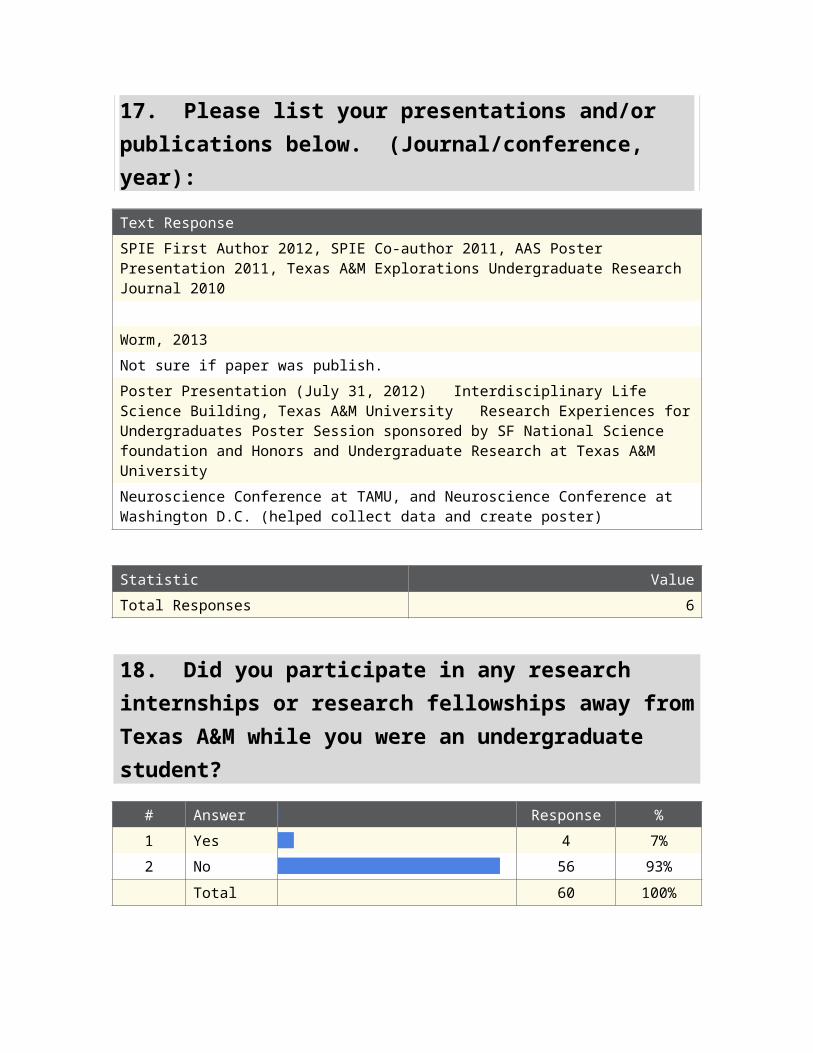
17. Please list your presentations and/or publications below. (Journal/conference, year):
Text Response
SPIE First Author 2012, SPIE Co-author 2011, AAS Poster Presentation 2011, Texas A&M Explorations Undergraduate Research Journal 2010
Worm, 2013
Not sure if paper was publish.
Poster Presentation (July 31, 2012) Interdisciplinary Life Science Building, Texas A&M University Research Experiences for Undergraduates Poster Session sponsored by SF National Science foundation and Honors and Undergraduate Research at Texas A&M University
Neuroscience Conference at TAMU, and Neuroscience Conference at Washington D.C. (helped collect data and create poster)
Statistic Value
Total Responses 6
18. Did you participate in any research internships or research fellowships away from Texas A&M while you were an undergraduate student?
# Answer Response %
1 Yes 4 7%
2 No 56 93%
Total 60 100%
Statistic Value
Min Value 1
Max Value 2
Mean 1.93
Variance 0.06
Standard Deviation 0.25
Total Responses 60
19. Please list the names of Programs, Locations, and Source of Support.
Default - 2011/2012
Program Location Source of Support
Acher the Well Company Odessa, TX
Research Internship Rice University
Default - 2010/2011
Program Location Source of Support
Research Internship Rice University
Default - 2009/2010
Program Location Source of Support
Study Abroad London None
Research Internship Rice University
Default - 2008/2009
Program Location Source of Support

Default - Pre 2008
Program Location Source of Support
Statistic 2011/2012 2010/2011 2009/2010 2008/2009 Pre 2008
Min Value - - - - -
Max Value - - - - -
Total Responses - - - - -
20. Please choose the duration for each internship.
# Question Less than 1 month
1 to 3 months
4 to 6 months
7 to 9 months
10 to 12 months
Mean
1 2011/2012 0 2 0 0 0 2 2.00
2 2010/2011 0 1 0 0 0 1 2.00
3 2009/2010 1 0 1 0 0 2 2.00
4 2008/2009 0 0 0 0 0 0 0.00
5 Pre 2008 0 0 0 0 0 0 0.00
# Question Less than 1 month
1 to 3 months
4 to 6 months
7 to 9 months
10 to 12 months
Mean
1 2011/2012 0.00% 100.00% 0.00% 0.00% 0.00% 2 2.00
2 2010/2011 0.00% 100.00% 0.00% 0.00% 0.00% 1 2.00
3 2009/2010 50.00% 0.00% 50.00% 0.00% 0.00% 2 2.00
4 2008/2009 0.00% 0.00% 0.00% 0.00% 0.00% 0 0.00
5 Pre 2008 0.00% 0.00% 0.00% 0.00% 0.00% 0 0.00

Statistic 2011/2012 2010/2011 2009/2010 2008/2009 Pre 2008
Min Value 2 2 1 - -
Max Value 2 2 3 - -
Mean 2.00 2.00 2.00 0.00 0.00
Variance 0.00 0.00 2.00 0.00 0.00
Standard Deviation 0.00 0.00 1.41 0.00 0.00
Total Responses 2 1 2 0 0
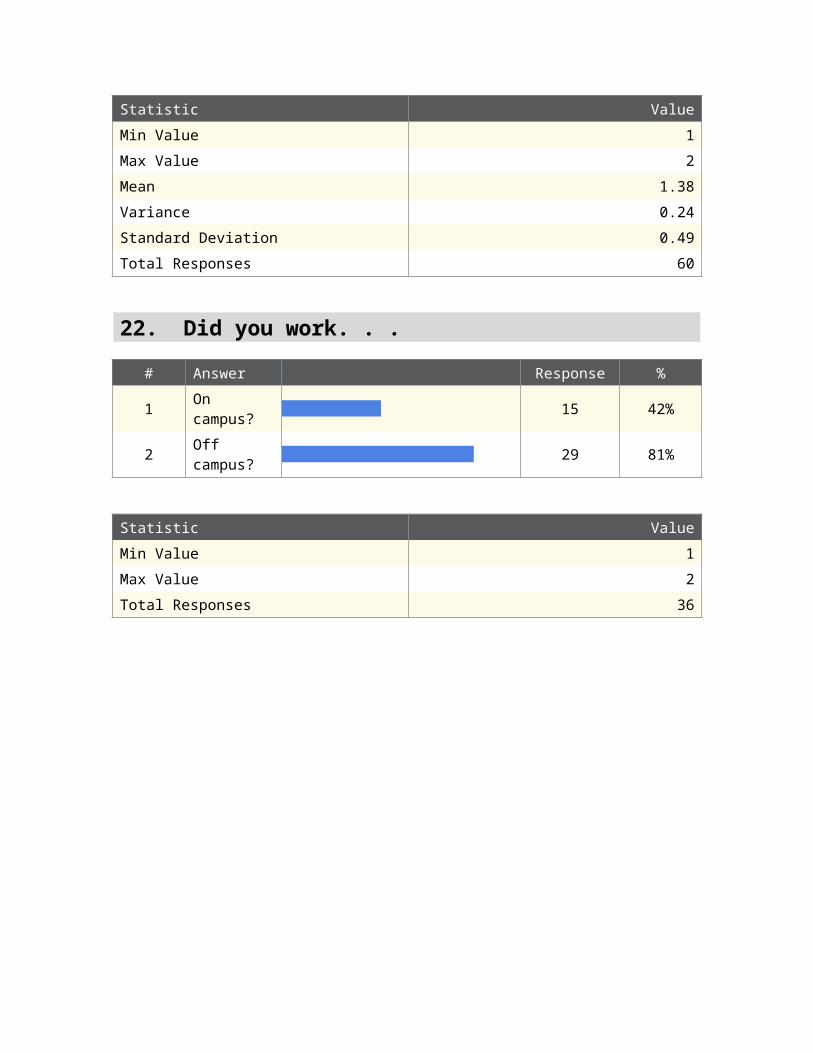
21. While a student at Texas A&M, did you work at a part-time or full-time job?
# Answer Response %
1 Yes 37 62%
2 No 23 38%
Total 60 100%
Statistic Value
Min Value 1
Max Value 2
Mean 1.38
Variance 0.24
Standard Deviation 0.49
Total Responses 60
22. Did you work. . .
# Answer Response %
1 On campus? 15 42%
2 Off campus? 29 81%

Statistic Value
Min Value 1
Max Value 2
Total Responses 36
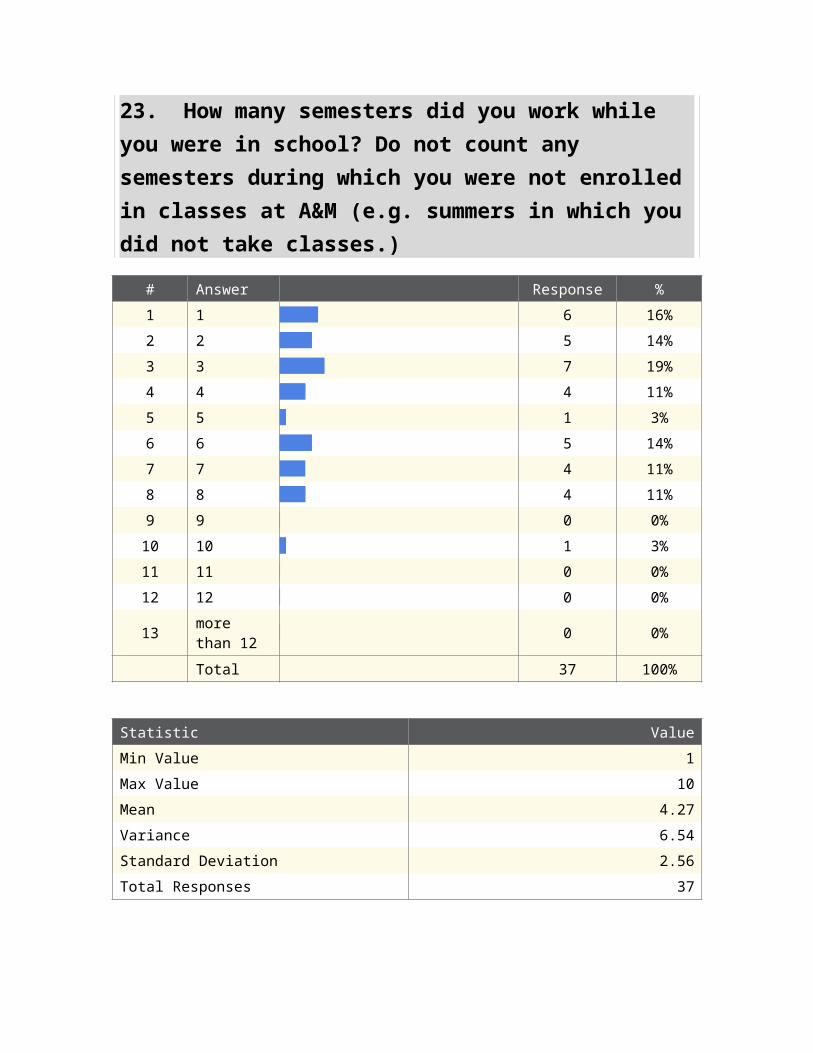
23. How many semesters did you work while you were in school? Do not count any semesters during which you were not enrolled in classes at A&M (e.g. summers in which you did not take classes.)
# Answer Response %
1 1 6 16%
2 2 5 14%
3 3 7 19%
4 4 4 11%
5 5 1 3%
6 6 5 14%
7 7 4 11%
8 8 4 11%
9 9 0 0%
10 10 1 3%
11 11 0 0%
12 12 0 0%
13 more than 12 0 0%
Total 37 100%
Statistic Value
Min Value 1
Max Value 10
Mean 4.27
Variance 6.54
Standard Deviation 2.56
Total Responses 37
24. On average, how many hours a week did you work? (If you worked in more than one semester, please give the average of the semester in which you worked the most.)
# Answer Response %
1 1 to 7 1 3%
2 8 to 14 13 35%
3 15 to 21 18 49%
4 22 to 28 3 8%
5 29 or more 2 5%
Total 37 100%
Statistic Value
Min Value 1
Max Value 5
Mean 2.78
Variance 0.73
Standard Deviation 0.85
Total Responses 37
25. We would like to know what kind of work you performed and if it was related in any way to what you studied at A&M. Please check all that apply.
# Question type of work related to my studies
1 - Advertising/publishing 1 0 1
2 - Academic support 5 2 7
3 - Agricultural 2 0 2
4 - Animal care 1 0 1
5- Clerical/ administrative support
2 0 2
6 - Child care 4 0 4
7 - Financial 0 0 0
8- Information technology/technical support
1 0 1
9 - Laboratory/research work 8 8 16
10 - Manual/physical labor 5 0 5
11 - Medical/medical support 3 1 4
12 - Retail 8 0 8
13 - Restaurant 8 0 8
14 - Writing/editing 1 0 1
15 - Sports/fitness 2 0 2
16 - Recreation 1 1 2
17 - Other (please specify) 4 2 6

- Other (please specify)
Business- travel
Research
Teaching/Subbing
Tutor
bartender
Statistic
- Advertising/publishing
- Academic support
- Agricultural
- Animal care
- Clerical/ administrative support
- Child care
- Financial
- Information
technology/technical
support
- Laboratory/research wor
k
- Manual/physical labor
- Medical/medical
suppor
t
- Retail
- Restaurant
- Writing/editing
- Sports/fitness
- Recreation
- Other (please specify)
Min Value
1 1 1 1 1 1 - 1 1 1 1 1 1 1 1 1 1
Max Value
1 2 1 1 1 1 - 1 2 1 2 1 1 1 1 2 2
Total Responses
1 6 2 1 2 4 0 1 8 5 3 8 8 1 2 1 5

26. What were the primary factors for your working while in school? (select the best three.)
# Answer Response %
1 - Career exploration 5 14%
2 - Earn money to support myself 20 54%
3 - Earn extra spending money 26 70%
4 - Job experience 17 46%
5- Help me with time management
5 14%
6
- An advisor/faculty member/mentor suggested that I work
1 3%
7- My family expected me to work
6 16%
8 - I enjoy working 4 11%
Statistic Value
Min Value 1
Max Value 8
Total Responses 37
27. Based on your experience, would you recommend that students work part-time while in school?
# Answer Response %
1 Yes 31 84%
2 No 6 16%
Total 37 100%
Statistic Value
Min Value 1
Max Value 2
Mean 1.16
Variance 0.14
Standard Deviation 0.37
Total Responses 37

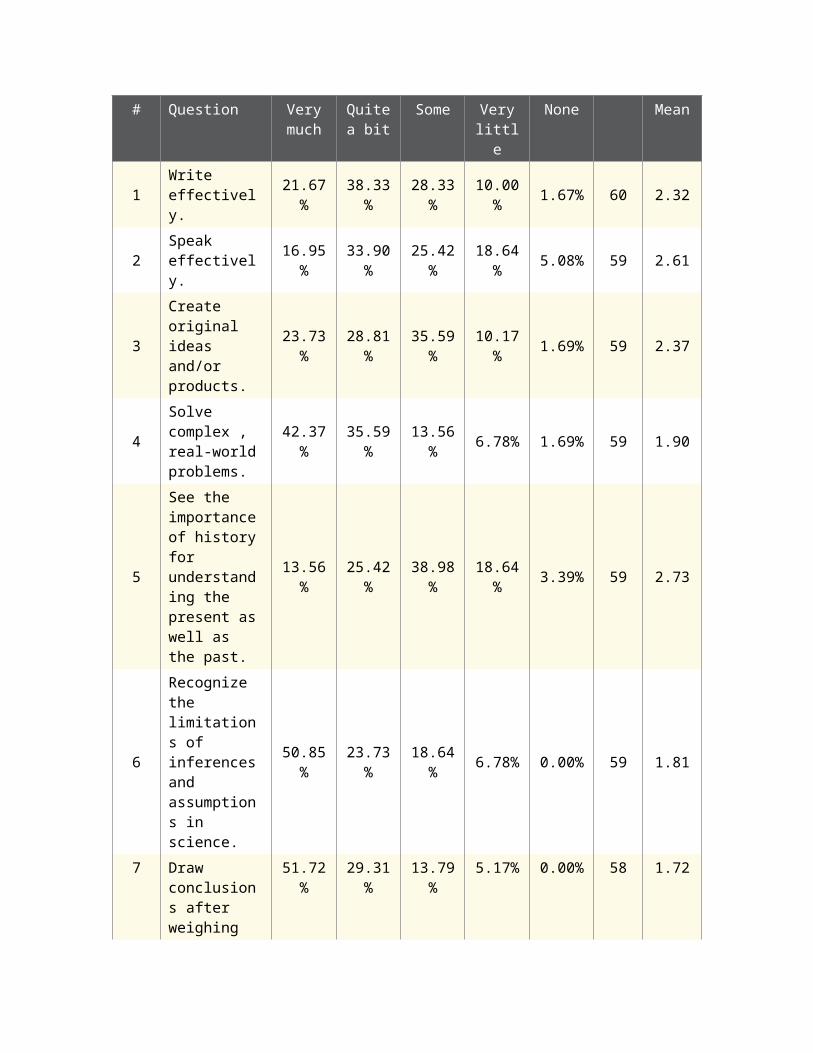
28. A&M's Contribution to your ability
# Question Very much
Quite a bit
Some Very little
None Mean
1 Write effectively. 13 23 17 6 1 60 2.32
2 Speak effectively. 10 20 15 11 3 59 2.61
3Create original ideas and/or products.
14 17 21 6 1 59 2.37
4Solve complex , real-world problems.
25 21 8 4 1 59 1.90
5
See the importance of history for understanding the present as well as the past.
8 15 23 11 2 59 2.73
6
Recognize the limitations of inferences and assumptions in science.
30 14 11 4 0 59 1.81
7
Draw conclusions after weighing evidence, facts and ideas.
30 17 8 3 0 58 1.72
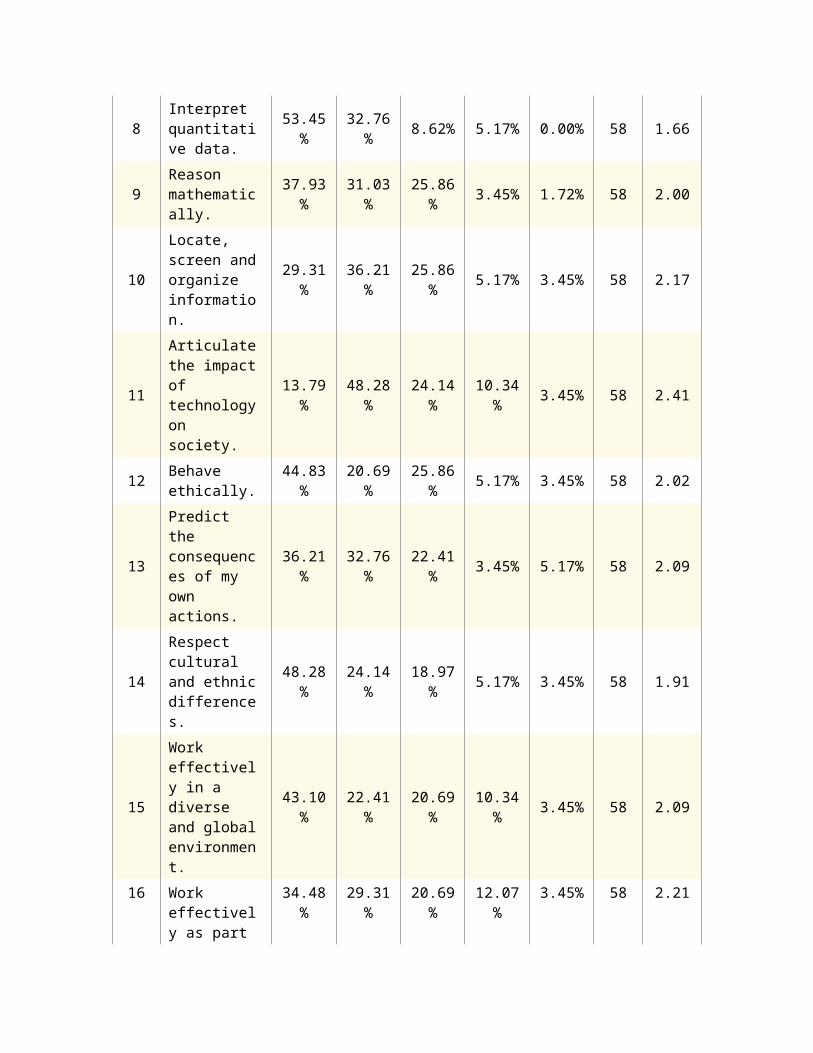
8Interpret quantitative data.
31 19 5 3 0 58 1.66
9 Reason mathematically. 22 18 15 2 1 58 2.00
10Locate, screen and organize information.
17 21 15 3 2 58 2.17
11
Articulate the impact of technology on society.
8 28 14 6 2 58 2.41

12 Behave ethically. 26 12 15 3 2 58 2.02
13
Predict the consequences of my own actions.
21 19 13 2 3 58 2.09
14Respect cultural and ethnic differences.
28 14 11 3 2 58 1.91
15
Work effectively in a diverse and global environment.
25 13 12 6 2 58 2.09
16Work effectively as part of a team.
20 17 12 7 2 58 2.21
17
Articulate the current research and problems in my field of study.
12 25 14 4 3 58 2.33
18
Apply the appropriate methodology to the problems in my field.
18 22 16 2 0 58 2.03
19
Integrate knowledge from outside my field of study.
19 18 14 6 1 58 2.17
20Appreciate fine arts, music and literature.
9 10 20 12 7 58 2.97
21
Discuss scientific principles and methods.
27 26 3 2 0 58 1.66
22
Lead a team of individuals with backgrounds different from my own.
14 19 17 4 3 57 2.35

# Question Very much
Quite a bit
Some Very little
None Mean
1 Write effectively. 21.67% 38.33% 28.33% 10.00% 1.67% 60 2.32
2 Speak effectively. 16.95% 33.90% 25.42% 18.64% 5.08% 59 2.61
3Create original ideas and/or products.
23.73% 28.81% 35.59% 10.17% 1.69% 59 2.37
4Solve complex , real-world problems.
42.37% 35.59% 13.56% 6.78% 1.69% 59 1.90
5
See the importance of history for understanding the present as well as the past.
13.56% 25.42% 38.98% 18.64% 3.39% 59 2.73
6
Recognize the limitations of inferences and assumptions in science.
50.85% 23.73% 18.64% 6.78% 0.00% 59 1.81
7
Draw conclusions after weighing evidence, facts and ideas.
51.72% 29.31% 13.79% 5.17% 0.00% 58 1.72
8Interpret quantitative data.
53.45% 32.76% 8.62% 5.17% 0.00% 58 1.66
9 Reason mathematically. 37.93% 31.03% 25.86% 3.45% 1.72% 58 2.00
10Locate, screen and organize information.
29.31% 36.21% 25.86% 5.17% 3.45% 58 2.17
11
Articulate the impact of technology on society.
13.79% 48.28% 24.14% 10.34% 3.45% 58 2.41
12 Behave ethically. 44.83% 20.69% 25.86% 5.17% 3.45% 58 2.02
13
Predict the consequences of my own actions.
36.21% 32.76% 22.41% 3.45% 5.17% 58 2.09
14Respect cultural and ethnic differences.
48.28% 24.14% 18.97% 5.17% 3.45% 58 1.91
15
Work effectively in a diverse and global environment.
43.10% 22.41% 20.69% 10.34% 3.45% 58 2.09
16Work effectively as part of a team.
34.48% 29.31% 20.69% 12.07% 3.45% 58 2.21
17
Articulate the current research and problems in my field of study.
20.69% 43.10% 24.14% 6.90% 5.17% 58 2.33
18
Apply the appropriate methodology to the problems in my field.
31.03% 37.93% 27.59% 3.45% 0.00% 58 2.03
19
Integrate knowledge from outside my field of study.
32.76% 31.03% 24.14% 10.34% 1.72% 58 2.17
20Appreciate fine arts, music and literature.
15.52% 17.24% 34.48% 20.69% 12.07% 58 2.97
21
Discuss scientific principles and methods.
46.55% 44.83% 5.17% 3.45% 0.00% 58 1.66
22
Lead a team of individuals with backgrounds different from my own.
24.56% 33.33% 29.82% 7.02% 5.26% 57 2.35

Statistic
Write effectively.
Speak effectively.
Create original ideas and/or products.
Solve complex , real-world problems.
See the i
mportance of history for understanding the present as well
as the past.
Recognize the limitations of
inferences and assumptions in scie
Draw conclusions after weighing evidence, facts and ideas.
Interpret quantitative data.
Reason mathematically.
Locate, screen and organize information.
Articulate the i
mpact of technology on society.
Behave ethically.
Predict the consequences
of my own actions.
Respect cultural and ethnic differences.
Work effectively in a diverse and global environment.
Work effectively as part of a team.
Articulate the current research and problems in my field o
Apply the appropriate methodology to the problems in my field.
Integrate knowledge from outside my field of study.
Appreciate fine arts, music and literature.
Discuss scientific principles and methods.
Lead a team of
individuals with backgrounds different from
my ow

nce.
f study.
n.

Min Value
1 1 1 1 1 1 1 1 1 1 1 1 1 1 1 1 1 1 1 1 1 1
Max Value
5 5 5 5 5 4 4 4 5 5 5 5 5 5 5 5 5 4 5 5 4 5
Mean
2.32
2.61
2.37
1.90
2.73
1.81
1.72
1.66
2.00
2.17
2.41
2.02
2.09
1.91
2.09
2.21
2.33
2.03
2.17
2.97
1.66
2.35
Variance
0.97
1.28
1.03
0.99
1.06
0.95
0.80
0.72
0.95
1.06
0.95
1.25
1.20
1.20
1.38
1.32
1.10
0.74
1.13
1.51
0.55
1.20
Standard Deviation
0.98
1.13
1.02
0.99
1.03
0.97
0.89
0.85
0.97
1.03
0.97
1.12
1.10
1.10
1.17
1.15
1.05
0.86
1.06
1.23
0.74
1.09
Tot
60
59
59
59
59
59
58
58
58
58
58
58
58
58
58
58
58
58
58
58
58
57

al Responses

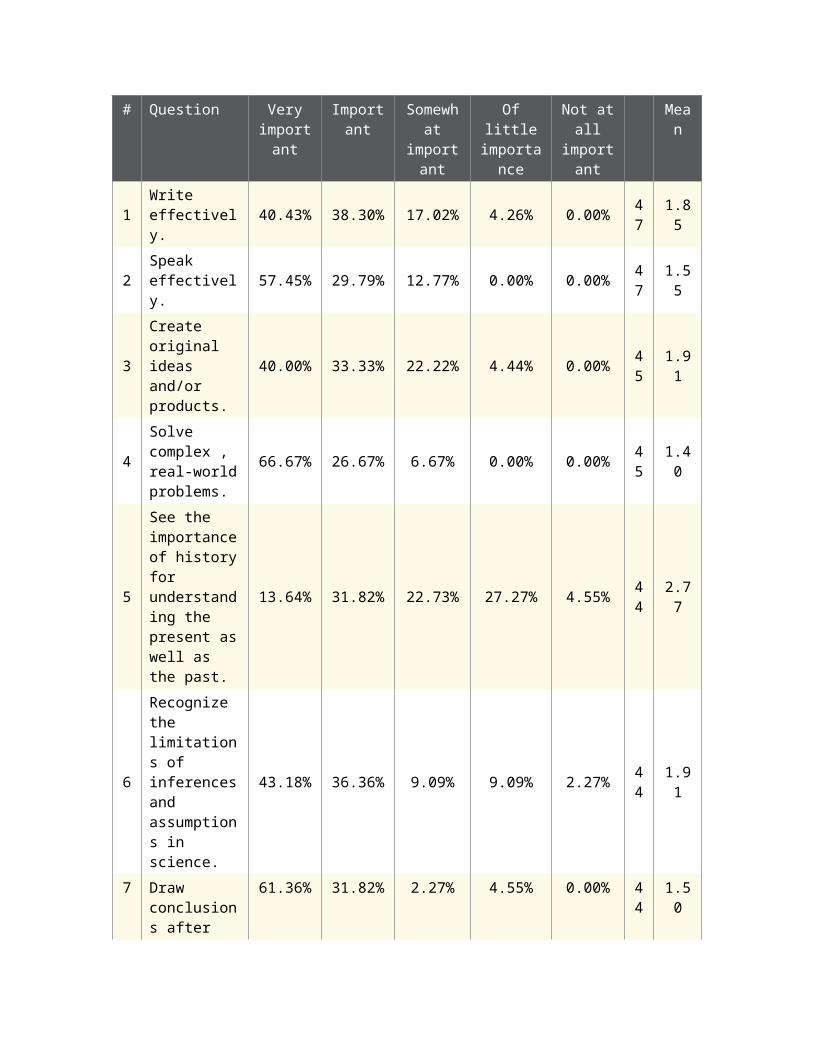
29. Importance for your future success
# Question Very importan
t
Important
Somewhat
important
Of little importanc
e
Not at all importan
t
Mean
1 Write effectively. 19 18 8 2 0 4
7 1.85
2 Speak effectively. 27 14 6 0 0 4
7 1.55
3Create original ideas and/or products.
18 15 10 2 0 45 1.91
4
Solve complex , real-world problems.
30 12 3 0 0 45 1.40
5
See the importance of history for understanding the present as well as the past.
6 14 10 12 2 44 2.77
6
Recognize the limitations of inferences and assumptions in science.
19 16 4 4 1 44 1.91
7
Draw conclusions after weighing evidence, facts and ideas.
27 14 1 2 0 44 1.50
8Interpret quantitative data.
25 12 4 2 0 43 1.60
9Reason mathematically.
14 8 15 4 0 41 2.22
10
Locate, screen and organize information.
16 19 3 3 0 41 1.83
1 Articulate the 9 20 7 5 0 4 2.20

1impact of technology on society.
1
12
Behave ethically. 29 6 5 1 0 4
1 1.46
13
Predict the consequences of my own actions.
27 10 4 0 0 41 1.44
14
Respect cultural and ethnic differences.
24 11 5 2 0 42 1.64
15
Work effectively in a diverse and global environment.
25 14 1 2 0 42 1.52
16
Work effectively as part of a team.
25 14 3 0 0 42 1.48
17
Articulate the current research and problems in my field of study.
18 18 3 1 1 41 1.76
18
Apply the appropriate methodology to the problems in my field.
20 20 1 0 0 41 1.54
19
Integrate knowledge from outside my field of study.
17 16 7 1 0 41 1.80
20
Appreciate fine arts, music and literature.
4 7 11 13 6 41 3.24
21
Discuss scientific principles and
18 18 4 2 0 42
1.76

methods.
22
Lead a team of individuals with backgrounds different from my own.
18 19 5 0 0 42 1.69

# Question Very importan
t
Important
Somewhat
important
Of little importanc
e
Not at all importan
t
Mean
1 Write effectively. 40.43% 38.30% 17.02% 4.26% 0.00% 4
7 1.85
2 Speak effectively. 57.45% 29.79% 12.77% 0.00% 0.00% 4
7 1.55
3Create original ideas and/or products.
40.00% 33.33% 22.22% 4.44% 0.00% 45 1.91
4
Solve complex , real-world problems.
66.67% 26.67% 6.67% 0.00% 0.00% 45 1.40
5
See the importance of history for understanding the present as well as the past.
13.64% 31.82% 22.73% 27.27% 4.55% 44 2.77
6
Recognize the limitations of inferences and assumptions in science.
43.18% 36.36% 9.09% 9.09% 2.27% 44 1.91
7
Draw conclusions after weighing evidence, facts and ideas.
61.36% 31.82% 2.27% 4.55% 0.00% 44 1.50
8Interpret quantitative data.
58.14% 27.91% 9.30% 4.65% 0.00% 43 1.60
9Reason mathematically.
34.15% 19.51% 36.59% 9.76% 0.00% 41 2.22
10
Locate, screen and organize information.
39.02% 46.34% 7.32% 7.32% 0.00% 41 1.83
11
Articulate the impact of technology on society.
21.95% 48.78% 17.07% 12.20% 0.00% 41 2.20
12
Behave ethically. 70.73% 14.63% 12.20% 2.44% 0.00% 4
1 1.46
13
Predict the consequences of my own actions.
65.85% 24.39% 9.76% 0.00% 0.00% 41 1.44
14
Respect cultural and ethnic differences.
57.14% 26.19% 11.90% 4.76% 0.00% 42 1.64
15
Work effectively in a diverse and global environment.
59.52% 33.33% 2.38% 4.76% 0.00% 42 1.52
16
Work effectively as part of a team.
59.52% 33.33% 7.14% 0.00% 0.00% 42 1.48
17
Articulate the current research and problems in my field of study.
43.90% 43.90% 7.32% 2.44% 2.44% 41 1.76
18
Apply the appropriate methodology to the problems in my field.
48.78% 48.78% 2.44% 0.00% 0.00% 41 1.54
19
Integrate knowledge from outside my field of study.
41.46% 39.02% 17.07% 2.44% 0.00% 41 1.80
20
Appreciate fine arts, music and literature.
9.76% 17.07% 26.83% 31.71% 14.63% 41 3.24
21
Discuss scientific principles and methods.
42.86% 42.86% 9.52% 4.76% 0.00% 42 1.76
22
Lead a team of individuals
42.86% 45.24% 11.90% 0.00% 0.00% 42
1.69

with backgrounds different from my own.

Statistic
Write effectively.
Speak effectively.
Create original ideas and/or products.
Solve complex , real-world problems.
See the i
mportance of history for understanding the present as well
as the past.
Recognize the limitations of
inferences and assumptions in scie
Draw conclusions after weighing evidence, facts and ideas.
Interpret quantitative data.
Reason mathematically.
Locate, screen and organize information.
Articulate the i
mpact of technology on society.
Behave ethically.
Predict the consequences
of my own actions.
Respect cultural and ethnic differences.
Work effectively in a diverse and global environment.
Work effectively as part of a team.
Articulate the current research and problems in my field o
Apply the appropriate methodology to the problems in my field.
Integrate knowledge from outside my field of study.
Appreciate fine arts, music and literature.
Discuss scientific principles and methods.
Lead a team of
individuals with backgrounds different from
my ow

nce.
f study.
n.

Min Value
1 1 1 1 1 1 1 1 1 1 1 1 1 1 1 1 1 1 1 1 1 1
Max Value
4 3 4 3 5 5 4 4 4 4 4 4 3 4 4 3 5 3 4 5 4 3
Mean
1.85
1.55
1.91
1.40
2.77
1.91
1.50
1.60
2.22
1.83
2.20
1.46
1.44
1.64
1.52
1.48
1.76
1.54
1.80
3.24
1.76
1.69
Variance
0.74
0.51
0.81
0.38
1.30
1.11
0.58
0.72
1.08
0.75
0.86
0.65
0.45
0.77
0.60
0.40
0.79
0.30
0.66
1.44
0.67
0.46
Standard Deviation
0.86
0.72
0.90
0.62
1.14
1.05
0.76
0.85
1.04
0.86
0.93
0.81
0.67
0.88
0.77
0.63
0.89
0.55
0.81
1.20
0.82
0.68
Tot
47
47
45
45
44
44
44
43
41
41
41
41
41
42
42
42
41
41
41
41
42
42
al Responses
30. What plans do you have for further education after graduation?
# Answer Response %
1
Graduate or professional school full time
28 47%
2
Graduate or professional school part time
5 8%
3
Pursue another Bachelor's degree
2 3%
4Specialized job training or certification
10 17%
5
No educational plans for the immediate future
15 25%
Total 60 100%

Statistic Value
Min Value 1
Max Value 5
Mean 2.65
Variance 3.04
Standard Deviation 1.74
Total Responses 60
31. What are your plans for graduate or professional school?
# Question I have been accepted
and plan to attend.
I have applied
and am still waiting for
a final decision.
I intend to apply in
the future.
Mean
1
Professional school (e.g., law, business,library, medicine, veterinary medicine, pharmacy, dentistry, etc.)
3 9 5 17 2.12
2
Allied health professions school (e.g.,nursing, medical technology, physicians assistant, etc.)
1 1 5 7 2.57
3
Graduate school (M.S., M.A., Ph.D, Ed.D.)
2 5 8 15 2.40
# Question I have been accepted
and plan to attend.
I have applied
and am still waiting for
a final decision.
I intend to apply in
the future.
Mean
1
Professional school (e.g., law, business,library, medicine, veterinary medicine, pharmacy, dentistry, etc.)
17.65% 52.94% 29.41% 17 2.12
2
Allied health professions school (e.g.,nursing, medical technology, physicians assistant, etc.)
14.29% 14.29% 71.43% 7 2.57
3
Graduate school (M.S., M.A., Ph.D, Ed.D.)
13.33% 33.33% 53.33% 15 2.40
Statistic Professional school (e.g., law,
business,library, medicine, veterinary medicine, pharmacy,
dentistry, etc.)
Allied health professions school
(e.g.,nursing, medical technology,
physicians assistant, etc.)
Graduate school (M.S., M.A., Ph.D,
Ed.D.)
Min Value 1 1 1
Max Value 3 3 3
Mean 2.12 2.57 2.40
Variance 0.49 0.62 0.54
Standard Deviation 0.70 0.79 0.74
Total Responses 17 7 15

32. What type of professional school will you be attending?
# Answer Response %
1 Business school 0 0%
2 Dental school 2 17%
3 Journalism school 0 0%
4 Law school 1 8%
5 Library school 0 0%
6 Medical school 6 50%
7 Optometry school 1 8%
8 Pharmacy school 1 8%
9 Psychology school 0 0%
10 Public health school 0 0%
11 Public policy school 0 0%
12 Veterinary school 1 8%
13 Other (please specify) 0 0%
Total 12 100%
Other (please specify)
Statistic Value
Min Value 2
Max Value 12
Mean 5.92
Variance 6.99
Standard Deviation 2.64
Total Responses 12

33. What type of allied health professional school will you be attending?
# Answer Response %
1 Athletic training 0 0%
2Cardiovascular perfusion technology
0 0%
3 Cytotechnology 0 0%
4 Dental hygiene 0 0%
5Diagnostic medical sonography
0 0%
6 Dietetics 0 0%
7 Emergency medical sciences 0 0%
8 Health administration 0 0%
9Health information management
0 0%
10 Medical technology 0 0%
11Nuclear medicine technology
0 0%
12 Nursing 0 0%
13 Occupational therapy 0 0%
14 Physical therapy 0 0%
15 Physician assistant 2 100%
16Radiation therapy technology
0 0%
17 Radiography 0 0%
18 Rehabilitation counseling 0 0%
19 Respiratory therapy 0 0%

20Respiratory therapy technology
0 0%
21
Speech-language pathology and audiology
0 0%
22 Other (please specify) 0 0%
Total 2 100%
Other (please specify)
Statistic Value
Min Value 15
Max Value 15
Mean 15.00
Variance 0.00
Standard Deviation 0.00
Total Responses 2

34. In which field(s) do you plan to pursue a Master's Degree or Doctorate degree? Check all that apply.
# Question Master's Degree Doctorate Degree
1 Agriculture (01) 0 0 0
2 Agricultural Sciences (02) 0 0 0
3 Natural Resources (03) 0 0 0
4 Architecture (04) 0 0 0
5Area, Ethnic and Cultural Studies (05)
0 0 0
6 Marketing Operations (08) 0 0 0
7
Communication, Journalism and Related Programs (09)
0 0 0
8 Communications Technologies (10) 0 0 0
9Computer and Information Sciences (11)
0 0 0
10Personal and Culinary Services (12)
0 0 0
11 Education (13) 1 0 1
12 Engineering (14) 0 0 0
13Foreign Languages and Literatures (16)
0 0 0
14Family and Consumer Sciences (19)
0 1 1
15 Home Economics (20) 0 0 0
16 Legal Studies (22) 0 0 0
17 English and Literature (23) 0 0 0

18Liberal Arts General Studies (24)
0 0 0
19 Library Science (25) 0 0 0
20Biological and Biomedical Sciences (26)
1 4 5
21 Mathematics and Statistics (27) 0 0 0
22 Military Technologies (29) 0 0 0
23 Interdisciplinary Studies (30) 0 0 0
24
Parks, Recreation, Leisure and Fitness Studies (31)
0 0 0
25Philosophy and Religious Studies (38)
0 0 0
26Theology and Religious Studies (39)
0 0 0
27 Physical Sciences (40) 1 1 2
28 Science Technologies (41) 0 0 0
29 Psychology (42) 0 0 0
30 Security Services (43) 0 0 0
31Public Administration (44)
0 0 0
32
Social Sciences (Anthropology, Economics, International Relations, Political Science, Sociology, Urban Studies) (45)
0 0 0
33 Construction 0 0 0

Trades (46)
34Mechanical and Repair Technologies (47)
0 0 0
35 Precision Production (48) 0 0 0
36 Transportation (49) 0 0 0
37Visual and Performing Arts (50)
0 0 0
38
Health Professions and Related Clinical Sciences (Medicine, Dentistry, Health Services, Allied Health, Nursing, Public Health, etc.) (51)
0 1 1
39 Business Management (52) 0 0 0
40 History (54) 0 0 0
41 Atmospheric Sciences (55) 0 0 0
42 Geography (56) 0 0 0
43 Oceanography (57) 0 0 0
44 Geosciences (58) 0 0 0
45 Geology (59) 0 0 0
46 Geophysics (60) 0 0 0
47 Envioronmental Science (61) 0 0 0

S Agriculture (01)
N Architecture (04)
M Communication, Journalism and Related Programs
C Personal and Culinary Services (12)
E Foreign Languages and Literatures (16)
H Legal Studies (22)
L Library Science (25)
M Military Technologies (29)
P Philosophy and Religious Studies (38)
P Science Technologies (41)
S Public Administration (44)
C Mechanical and Repair Technologies (47)
T Visual and Performing Arts (50)
B History (54)
G Oceanography (57)
G

(09)
M - - - - - - - - - - - - - - - - - 1 - - - - - - - - - - - -
M - - - - - - - - - - - - - - - - - 2 - - - - - - - - - - - -
T 0 0 0 0 0 0 0 0 0 0 0 0 0 0 0 0 0 1 0 0 0 0 0 0 0 0 0 0 0 0
35. Is this field related to your undergraduate major?
# Answer Response %
1Yes, same field as major
3 43%
2 Yes, related to major 3 43%
3 No, not related 1 14%
Total 7 100%
Statistic Value
Min Value 1
Max Value 3
Mean 1.71
Variance 0.57
Standard Deviation 0.76
Total Responses 7

36. Which institution will you be attending?
Name Location Department Field
UT Houston School of Nursing Houston, TX Nursing
University of Hawaii Hawaii Astronomy
Texas A&M college of veterinary medicine College Station, TX
University of Houston College of Optometry Houston Texas
UTMB Galveston
University of Texas Health Science Center Houston Nursing
Texas A&M College Station, Tx TLAC
UofH Houston
Baylor College of Dentistry Dallas, TX
Texas Tech Paul L. Foster SOM El Paso, TX
STCL Houston
Texas A&M College of Medicine Temple, Texas
not sure yet
Statistic Value
Total Responses 13

37. Do you plan to work full or part time while pursuing your degree?
# Answer Response %
1
Yes, I expect to work as a teaching or research assistant in my graduate program
4 57%
2
Yes, I expect to find a job at the institution
0 0%
3
Yes, I expect to work full time outside the institution
0 0%
4
Yes, I expect to work part time outside the institution
2 29%
5
No, I do not plan to work while in graduate school
1 14%
Total 7 100%
Statistic Value
Min Value 1
Max Value 5
Mean 2.43
Variance 3.29
Standard Deviation 1.81
Total Responses 7

38. What are your employment plans after graduation?
# Answer Response %
1 Nothing definite at this point 27 49%
2Private for-profit corporation/company/group-practice
14 25%
3Self-employed, own business, or professional practice (non-group)
1 2%
4Government (non-military) or other public institution or agency
2 4%
5 Teaching, library or educational administration 9 16%
6 Active military 1 2%
7
Volunteer with a government (Peace Corps, Americorps), faith-based, or international organization
1 2%
8 Other (Please specify) 0 0%
Total 55 100%
Other (Please specify)
Statistic Value
Min Value 1
Max Value 7
Mean 2.25
Variance 2.86
Standard Deviation 1.69
Total Responses 55

39. Which business/industry sector will you most likely be employed in?
# Answer Response %
1 Architecture and engineering 0 0%
2Arts, design, entertainment, sports and media
0 0%
3Building and grounds cleaning and maintenance
0 0%
4 Business and financial/accounting 1 7%
5 Community and social services 0 0%
6 Computer and mathematical 2 13%
7 Construction and extraction 0 0%
8 Energy 2 13%
9 Environmental 1 7%
10 Farming, fishing and forestry 0 0%
11 Food preparation and serving related 0 0%
12 Healthcare/medical 6 40%
13 Homemaker 0 0%
14 Law enforcement 0 0%
15 Legal 1 7%
16 Life, physical, and social sciences 0 0%
17 Management 0 0%
18 Marketing and sales 0 0%
19Office and administrative support
0 0%
20 Personal care and service 0 0%

21 Training and personnel 0 0%
22 Transportation 0 0%
23 Other (Please specify) 2 13%
Total 15 100%
Other (Please specify)
Veterinary medicine
Chemistry field
Statistic Value
Min Value 4
Max Value 23
Mean 11.60
Variance 30.40
Standard Deviation 5.51
Total Responses 15
40. What branch of government/service?
# Answer Response %
1 U.S. Federal 1 50%
2 U.S. State 1 50%
3 U.S. Local 0 0%
4
Foreign (non-U.S.) government entity
0 0%
5
Non-governmental organization (NGO)
0 0%
Total 2 100%
Statistic Value
Min Value 1
Max Value 2
Mean 1.50
Variance 0.50
Standard Deviation 0.71
Total Responses 2
41. At what level do you plan to teach/work? (check all that apply)
# Answer Response %
1 Pre-school/Day care 0 0%
2 Private elementary/intermediate 0 0%
3 Public elementary/intermediate 0 0%
4 Private junior high/high school 2 22%
5 Public junior high/high school 9 100%
6 Vocational/technical 1 11%
7 College/university 1 11%
8 Adult education/training 0 0%
Statistic Value
Min Value 4
Max Value 7
Total Responses 9

42. What branch of military service?
# Answer Response %
1 U.S. Army 0 0%
2U.S. Navy/Marine Corps
0 0%
3 U.S. Air Force 1 100%
4 U.S. Coast Guard 0 0%
5
Other National Military (please specify country and service)
0 0%
Total 1 100%
Other National Military (please specify country and service)
Statistic Value
Min Value 3
Max Value 3
Mean 3.00
Variance 0.00
Standard Deviation 0.00
Total Responses 1

43. How well do you think your academic program prepared you for the job market?
# Answer Response %
1 Very well 10 36%
2 Generally well 14 50%
3 Ambivalent 4 14%
4 Inadequate 0 0%
5 Very inadequate 0 0%
Total 28 100%
Statistic Value
Min Value 1
Max Value 3
Mean 1.79
Variance 0.47
Standard Deviation 0.69
Total Responses 28
44. Have you received any offers of employment after graduation?
# Answer Response %
1 Yes 9 32%
2 No 19 68%
Total 28 100%

Statistic Value
Min Value 1
Max Value 2
Mean 1.68
Variance 0.23
Standard Deviation 0.48
Total Responses 28
45. How many offers did you receive?
# Offers Count % 1 6 54.545 2 3 27.273 3 or more 2 18.182
46. What was the salary range of the highest offer you received?
# Answer Response %
1 $30,000/year or less 2 22%
2 $30,001 to $40,000/year 2 22%
3 $40,001 to $50,000/year 1 11%
4 $50,001 to $60,000/year 1 11%
5 more than $60,000/year 3 33%
Total 9 100%
Statistic Value
Min Value 1
Max Value 5
Mean 3.11
Variance 2.86
Standard Deviation 1.69
Total Responses 9

47. In what state will you be employed?
All respondents indicated they would be employed in Texas.
Statistic Please select the state
Min Value 44
Max Value 44
Mean 44.00
Variance 0.00
Standard Deviation 0.00
Total Responses 9
48. How likely is it that your job will require travel or relocation outside the United States in the next five years?
# Answer Response %
1 Very likely 0 0%
2 Likely 1 11%
3 Unlikely 2 22%
4 Definitely not 6 67%
Total 9 100%
Statistic Value
Min Value 2
Max Value 4
Mean 3.56
Variance 0.53
Standard Deviation 0.73
Total Responses 9

49. Is your prospective position related to your undergraduate field(s) of study?
# Answer Response %
1 Yes, same field as major 3 33%
2 Yes, related to major 5 56%
3 No, not related 1 11%
4Not applicable (unemployed, etc.)
0 0%
Total 9 100%
Statistic Value
Min Value 1
Max Value 3
Mean 1.78
Variance 0.44
Standard Deviation 0.67
Total Responses 9
50. Have you lived, studied, or worked outside of the United States since leaving high school?
# Answer Response %
1 Yes 10 17%
2 No 50 83%
Total 60 100%
Statistic Value
Min Value 1
Max Value 2
Mean 1.83
Variance 0.14
Standard Deviation 0.38
Total Responses 60
51. Which of the following describe your foreign experience? Please indicate all that apply.
# Answer Response %
1 Internship or co-op 0 0%
2 Reciprocal exchange 0 0%
3 Study abroad 5 50%
4 Field trip 2 20%
5
Employment not affiliated with an academic institution
1 10%
6 Non-academic program 4 40%
7 Other (please specify) 0 0%
Other (please specify)
Statistic Value
Min Value 3
Max Value 6
Total Responses 10

52. How well do you think your international experience has prepared you for the next step in either starting a career or furthering your education?
# Answer Response %
1 Very well 6 60%
2 Generally well 1 10%
3
Neither well nor inadequately (neutral)
3 30%
4 Inadequate 0 0%
5 Very inadequate 0 0%
Total 10 100%
Statistic Value
Min Value 1
Max Value 3
Mean 1.70
Variance 0.90
Standard Deviation 0.95
Total Responses 10

53. Which of these are reasons why you have not gone abroad? Please indicate all that apply.
# Answer Response %
1No one encouraged me to do it
6 12%
2 It would delay my graduation 23 47%
3 Did not fit my degree plan 20 41%
4 Not beneficial to my career 8 16%
5 Too expensive 39 80%
6My financial aid didn't cover costs
12 24%
7 Needed to work instead 7 14%
8Family worried about my leaving the U.S.
7 14%
9Political tensions/fear of terrorism
1 2%
10I don't speak any language but English
12 24%
11Don't want to leave Texas or the U.S.
6 12%
12 Other (please specify) 2 4%
Other (please specify)
No desire
I grew up Ghana till after high school
Statistic Value
Min Value 1
Max Value 12
Total Responses 49
54. At the time you graduate, approximately what will be the total amount borrowed to finance your undergraduate education that you are personally responsible for repaying?
# Answer Response %
1 none 27 45%
2 $1 to 9,999 7 12%
3 $10,000 to 19,999 8 13%
4 $20,000 to 29,999 9 15%
5 $30,000 to 39,999 5 8%
6 $40,000 to 49,999 0 0%
7 $50,000 or more 2 3%
8 Unable to estimate 2 3%
Total 60 100%
Statistic Value
Min Value 1
Max Value 8
Mean 2.60
Variance 3.67
Standard Deviation 1.92
Total Responses 60

55. Reflecting back, do you now think that the benefits you have received from attending Texas A&M were worth the financial costs to you and your family?
# Answer Response %
1 Yes, definitely 42 70%
2 Maybe, but not sure 15 25%
3 No, definitely not 3 5%
Total 60 100%
Statistic Value
Min Value 1
Max Value 3
Mean 1.35
Variance 0.33
Standard Deviation 0.58
Total Responses 60
56. How confident are you of success in your future?
# Answer Response %
1 Bring it on! 33 55%
2 I think I'll do well. 23 38%
3 Uncertain 3 5%
4 Not quite ready 0 0%
5 Not ready at all 1 2%
Total 60 100%

Statistic Value
Min Value 1
Max Value 5
Mean 1.55
Variance 0.56
Standard Deviation 0.75
Total Responses 60
57. Please give us your thoughts on how well Texas A&M prepared you for the future.
Responses are available on request from Mark Troy.
Statistic Value
Total Responses 26
58. Please provide an e-mail address that will be valid after graduation. This will be used by your college and department to keep you up to date on what's happening to your teachers and fellow students in you major department. Your address will not be sold or used for any other commercial purposes. Texas A&M respects your privacy.
Email addresses are available on request from Mark Troy.
Statistic Value
Total Responses 50
59. gender
Value Total
M 27
F 33

60. primaryMajor
Value Total
BIOL 33
PHYS 1
ZOOL 2
APMS 8
MATH 7
MBIO 4
CHEM 4
BMCB 1
61. primaryMajorDept
Value Total
BIOL 40
PHYS 1
MATH 15
CHEM 4
62. primaryMajorCollege
Value Total
SC 60
63. visaType
Value Total
OT 1
PR 4
[No Value] 55