data about university of florida students from the 2013 seru survey dr. jeanna mastrodicasa...
TRANSCRIPT

Data about University of Florida Students from the 2013 SERU Survey
Dr. Jeanna MastrodicasaAssistant Vice President for Student Affairs Division of Student [email protected]

What is SERU?Student survey began in the University of California system: Student Experience in Research Universities
Developed by UC Berkeley Center for Studies in Higher Education
Tailored to research universities and opened to AAU members outside California in 2009
Surveyed all undergraduate students – not a sample! UF had a 58% response rate in 2013
Other 2013 universities: Indiana, Purdue, Texas A&M, Iowa, Minnesota, Rutgers, Michigan, Oregon, Texas, Virginia, North Carolina, Pittsburgh

2013 Time Usage of UF Students compared to AAU peers • More:• Participating in student organizations• Exercising • Partying
• Less: • Attending class, discussion sections, labs• Preparing for studying and other academic
activities outside of class • Working

Hours Participating in Student Organizations Per Week
0 hours
1-5 6-10 11-15 16-20 21-25 26-30 More than 30
UF: Number of Hours
0.24 0.39 0.17 0.1 0.05 0.02 0.01 0.02
Other: Number of Hours
0.32 0.39 0.16 0.07 0.03 0.02 0.008 0.01
3%
8%13%
18%
23%
28%
33%38%
43%
PE
RC
EN
TA
GE
OF
ST
UD
EN
TS

Hours Exercising/ Recreational Sports Per Week
0 hours 1-5 6-10 11-15 16-20 21-25 26-30 More than 30
UF: Num-ber of Hours
0.08 0.4 0.28 0.12 0.06 0.02 0.01 0.02
Other: Number of Hours
0.12 0.47 0.26 0.09 0.04 0.02 0.008 0.009
3%13%23%33%43%
PERC
ENTA
GE
OF
STU
DEN
TS

Hours Partying Per Week
0 hours 1-5 6-10 11-15 16-20 21-25 26-30 More than 30
UF: Num-ber of Hours
0.32 0.39 0.15 0.07 0.04 0.02 0.009 0.01
Other: Number of Hours
0.37 0.39 0.15 0.05 0.02 0.01 0.006 0.005
3%
13%
23%
33%
43%PE
RCEN
TAG
E O
F ST
UD
ENTS

Hours Attending Classes, Discussion Sections, or Labs Per Week
0 hours 1-5 6-10 11-15 16-20 21-25 25-30 more than 30
UF: Number of Hours
0.007 0.07 0.19 0.39 0.22 0.07 0.03 0.03
Other: Number of Hours
0.003 0.03 0.11 0.35 0.33 0.11 0.04 0.03
2.50%12.50%22.50%32.50%42.50%
PERC
ENTA
GE
OF
STU
DEN
TS

Hours Studying and Other Academic Activities Outside of Class Per Week
0 hours 1-5 6-10 11-15 16-20 21-25 26-30 More than 30
UF: Num-ber of Hours
0.006 0.14 0.27 0.23 0.16 0.09 0.05 0.06
Other: Number of Hours
0.005 0.12 0.25 0.22 0.17 0.1 0.06 0.06
2.50%
7.50%
12.50%
17.50%
22.50%
27.50%
PE
RC
EN
TA
GE
OF
STU
DE
NT
S

Hours Working Per Week
0 hours 1-5 6-10 11-15 16-20 21-25 26-30 More than 30
UF: Num-ber of Hours
0.56 0.06 0.08 0.09 0.09 0.05 0.03 0.05
Other: Number of Hours
0.47 0.07 0.13 0.12 0.1 0.05 0.03 0.04
5%15%25%35%45%55%
PERC
ENTA
GE
OF
STU
DEN
TS

Student satisfaction, use of services, and helpfulness of services

2013 Results: UF compared to Peers
Satisfaction with (satisfied or very satisfied) UF Peers
Academic experience 65% 65%
Social experience 69% 64%
Value of your education for the price 63% 53%
Faculty quality 58% 65%
Advising by school/college staff 52% 51%
Access to small classes 41% 43%
Availability of courses for graduation 56% 52%

2013 Results: UF compared to Peers
Experiences (have done or now doing) UF Peers
Research project, creative activity/paper in course 74% 79%
Course with international or global focus 42% 39%
Know at least one faculty well enough for reference 59% 70%
Study 16 or more hours per week 36% 39%

2013 Results: UF compared to Peers
Agreement with… UF Peers
Would still choose to enroll again (agree or strongly agree) 79% 74%
Feel that you belong at your institution (agree or strongly
agree) 76% 72%
Important to graduate in four years (very important or essential) 50% 65%
Intend to go to graduate or professional school after
graduation (agree or strongly agree)
52% 38%
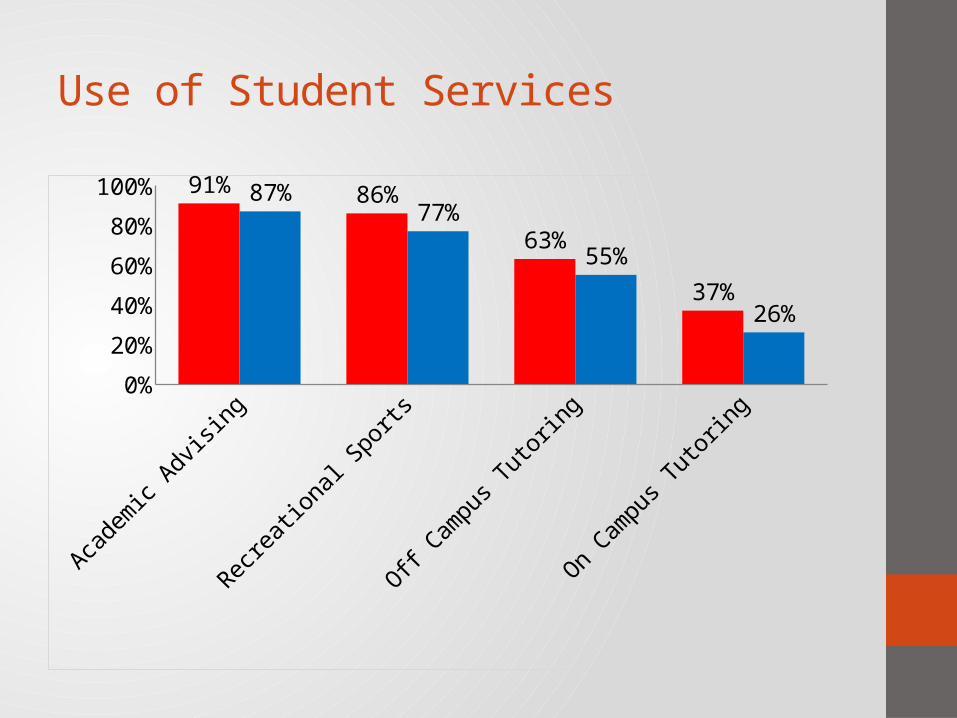
Use of Student Services
Academic Advis-ing
Recreational Sports
Off Campus Tutoring
On Campus Tutoring
0%
10%
20%
30%
40%
50%
60%
70%
80%
90%
100%91%
86%
63%
37%
87%
77%
55%
26%
2013 Use 2011 Use

Helpfulness of Student Services (1-5 scale)
Academic Advis-ing
Recreational Sports
Off Campus Tutoring
On Campus Tutoring
0.00
0.50
1.00
1.50
2.00
2.50
3.00
3.50
4.00
4.50
5.00
3.59
4.29 4.25
3.403.43
4.23 4.24
3.26
2013 Helpfulness2011 Helpfulness

Differences in Sub-Populations of UF
Students

Students of My Race/ Ethnicity Are Respected on Campus
Percentage of UF students who agree or strongly agree
White Hispanic Black Asian
81%
66%
41%
52%
81%
66%
42%
53%
83%
64%
32%
53%
2013 2011 2009

Students of My Sexual Orientation Are Respected on This Campus
Percentage of students who agree or strongly agree
Gay/Lesbian Heterosexual
52%
90%
38%
83%
44%
88%
2013 2011 2009

Strongly Disagree
Disagree Somewhat disagree
Somewhat agree
Agree Strongly Agree
0%
5%
10%
15%
20%
25%
30%
35%
40%
45%
50%
1%3%
6%
23%
44%
23%
2%5%
11%
24%
40%
18%
2% 3%
9%
28%
36%
21%
Non-FOS FOS FOS Eligible
Florida Opportunity Scholar (FOS), Non-FOS, and FOS eligible student opinions about the following statement: “Students are respected here regardless of their economic or social class”

Sorority and Fraternity Members Satisfaction with the Overall Social Experience at UF
Very Dissatisfi
ed
Dissatisfi
ed
Somewhat Diss
atisfied
Somewhat Satisfi
ed
Satisfied
Very Satisfied
0.00%
5.00%
10.00%
15.00%
20.00%
25.00%
30.00%
35.00%
40.00%
45.00%
50.00%
0.50% 0.80% 2.00%
11.00%
40.00%
45.00%
1%3%
8%
23%
41%
23%
Greek Non-greek
Greek mean score: 5.24Non-Greek mean score: 4.76

Sorority and Fraternity Members at UF (1-6 scale)
Level of Agreement with… Greek students Non-Greek students
I feel I belong at this campus 5.25 4.89
Knowing what I know now, I would still choose to enroll at this campus
5.21 5.02
UF has a strong commitment to undergraduate education
4.66 4.62
The emphasis on research detracts from the quality of teaching on this campus
3.48 3.42

Additional study space/center
Additional lounge space/center
Additional campus pool or enhanced pool features like a lazy river
Recreational space on east campus
Expansion of indoor recreational facilities
Lodging at Lake Wauburg for overnight leadership development programs/retreats
Additional career resource center space
Additional space for personal counseling
Expansion of outdoor recreation fields
3.67
3.42
3.29
3.24
3.01
2.98
2.92
2.84
2.71
To help inform our future discussions at UF regarding student facility needs, please rate, on a scale of 1 to
5, the needs for the following facilities:

Class size
Accessibility of faculty
Multidisciplinary courses
Student population
Campus size
Quality of instruction
Alumni connections
Diverse student body
Number of student organizations
Athletic program
2.85
3.51
3.53
3.54
3.6
3.71
3.88
3.89
4.13
4.19
On a scale of 1 (weakness) to 5 (asset), please rate each of fol-lowing as the university's biggest weakness or greatest asset.

For more information…
• Student Experience in Research University (SERU) results: ir.ufl.edu (sortable by college and major)• Graduation Exit Survey: ir.ufl.edu• Student Affairs: ufsa.ufl.edu • Contact Dr. Jeanna Mastrodicasa,
[email protected], 392-1265, 155 Tigert Hall