data-driven planning and budgeting for net tuition revenue
TRANSCRIPT

Data-Driven Planning and Budgeting
for Net Tuition Revenue
Presenters:
Kathy Kurz, Vice President, Scannell & Kurz
Mike Frandsen, Vice President for Finance and
Administration at Oberlin College (formerly VP for Finance
at Albion College)

• Today’s Climate
• Analytical techniques for targeting aid to
increase NTR
• Trend-based financial aid budgeting
• Albion case study
Overview

The Demographic Climate
Source: WICHE
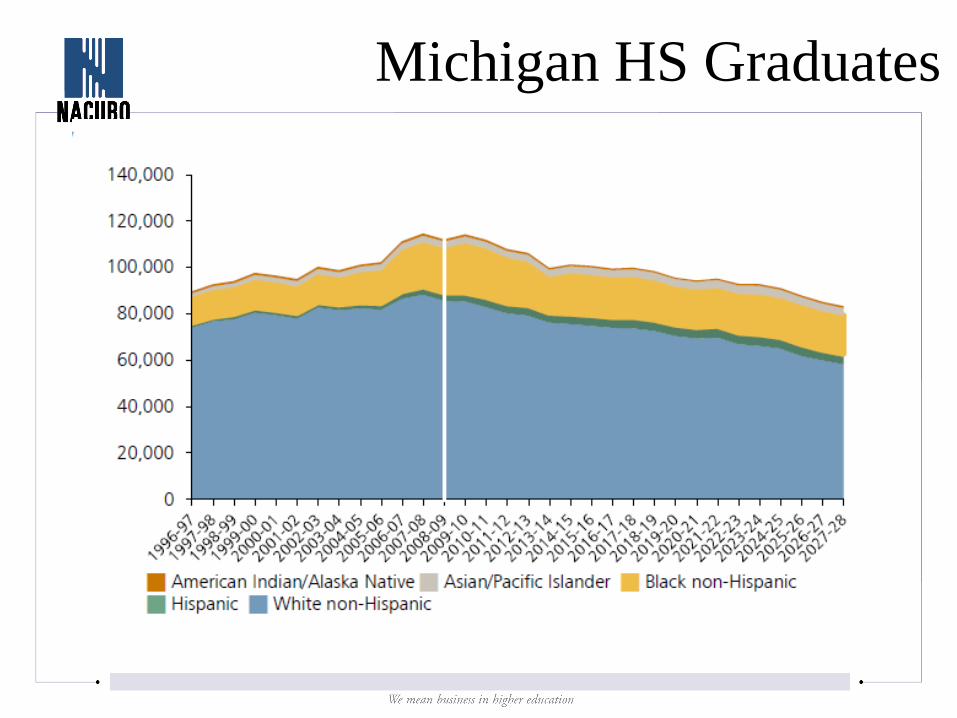
Michigan HS Graduates
• Students are applying to more schools and
competition for them is increasing.
• The number of students applying for aid has
increased.
• More families are appealing their first aid
offer.
• State aid programs are being reduced or
eliminated.
Today’s Climate
Today’s Climate
• Negative press is creating inaccurate
perceptions about educational costs and
financial aid. – Merit awards are seen as reducing need-based aid
when actually the vast majority of merit money also
meets need.
– Borrowing for educational expenses is increasingly
seen as a bad thing, making students loan averse.
– The ROI of a college education is increasingly being
called into question.
6
Today’s Climate
• Families are increasingly price sensitive
– Average family spent less on college in 2012-13 than in 2009-10. (Sallie Mae’s ―How America Pays for College‖ survey)
– In 2013 only 57% of students admitted to first choice institution chose to attend it. Cost and aid were significant influencers of that decision. (The American Freshman—
National Norms for 2013.)
• Many private institutions have seen their discount rates increase without corresponding increases in enrollment. – This has contributed to both Moody’s and S&P releasing negative outlooks
for higher education

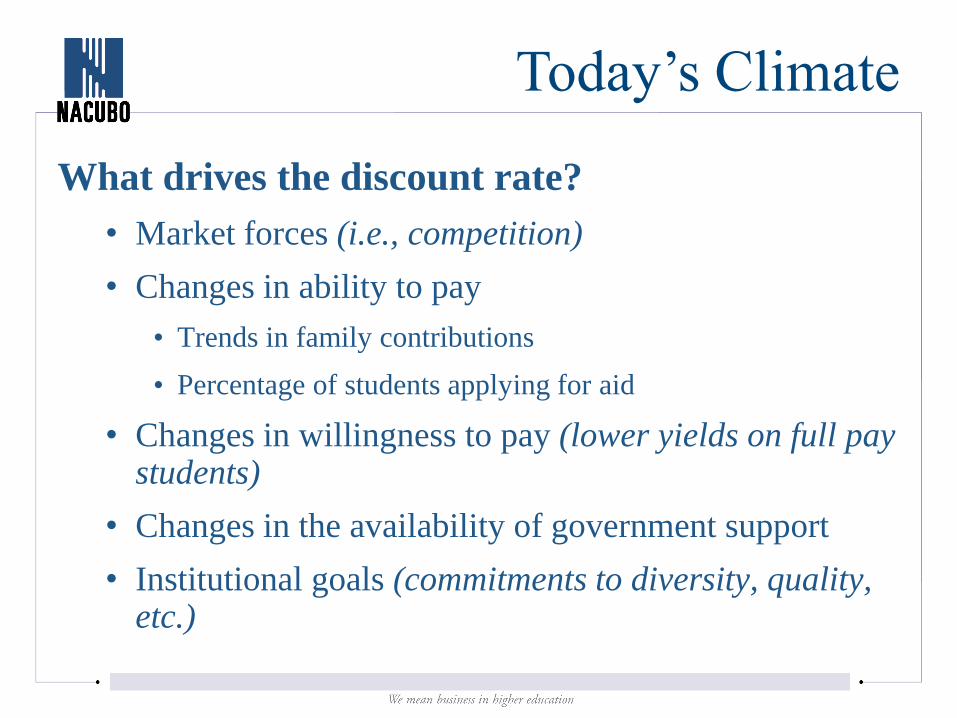
What drives the discount rate?
• Market forces (i.e., competition)
• Changes in ability to pay
• Trends in family contributions
• Percentage of students applying for aid
• Changes in willingness to pay (lower yields on full pay students)
• Changes in the availability of government support
• Institutional goals (commitments to diversity, quality, etc.)
Today’s Climate

• Institutions are struggling to understand how to
adjust their aid policies in this environment.
• From NACUBO Tuition Discounting Survey:
• “We made an attempt to decrease our discount
rate through targeted enrollment strategies meant
to increase the yield of full-pay students. And no,
the strategies were not all that successful.”
• When another college tried to reduce its discount
rate: “Enrollment plunged”.
Today’s Climate

• Successful institutions:
• Focus on improving the value proposition and differentiating offerings, not just winning on affordability.
• Recognize that new strategies may be needed.
• Get the right people involved in understanding the trends and setting realistic budget targets.
• Focus on NTR not just class size or discount rate.
• Use data to understand price sensitivity and drive awarding strategies.
Today’s Climate

• Competitor Benchmarking
• Yield Analysis
• Predictive Modeling and Simulations
Analytical Techniques for
Targeting Aid to Increase NTR
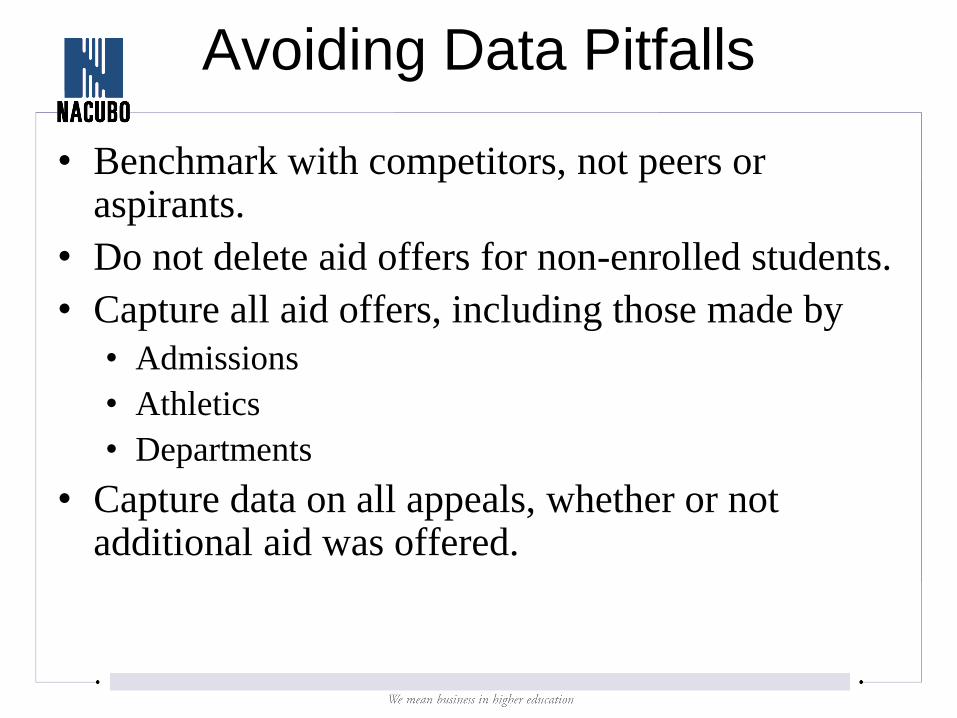
• Benchmark with competitors, not peers or aspirants.
• Do not delete aid offers for non-enrolled students.
• Capture all aid offers, including those made by
• Admissions
• Athletics
• Departments
• Capture data on all appeals, whether or not additional aid was offered.
Avoiding Data Pitfalls

Competitor Benchmarking
College/University
Tuition
&
Fees
2014-15
Estimated
Net Tuition
& Fees
Freshman
Discount
Rate
2012-13*
Fall
2012
Accept
Rate
Fall
2012
SAT
25-75%
U.S. News
Ranking 2014
(America's Best
Colleges)
Institution A $32,776 $13,897 57.6% 69.5% 950 - 1170 NLAC below 150
Institution B $34,484 $19,449 43.6% 79.7% 950 - 1170 NLAC #100-150
Institution C $41,510 $27,231 34.4% 43.3% 1120 - 1340 NLAC #51-99
Institution D $43,270 $18,520 57.2% 70.2% 1065 - 1320 NLAC #51-99
Institution E $44,210 $27,101 38.7% 39.9% 1220 - 1370 NLAC top 50
Institution F $44,360 $29,588 33.3% 38.5% 1240 - 1390 NLAC top 50
Institution G $44,551 $25,439 42.9% 41.9% 1190 - 1370 NLAC top 50
Sources - College/University website, U.S. News & World Report and IPEDS
* Discount rate has been calculated using IPEDS data which, on occasion, have been found to be inaccurate.

• In general, when grants to a group of
admits are increased, yield increases but
the average NTR generated declines.
• Depending on how much yield increases,
increasing grant can either raise or lower
the total net tuition revenue generated by
that group of students.
Yield Analysis
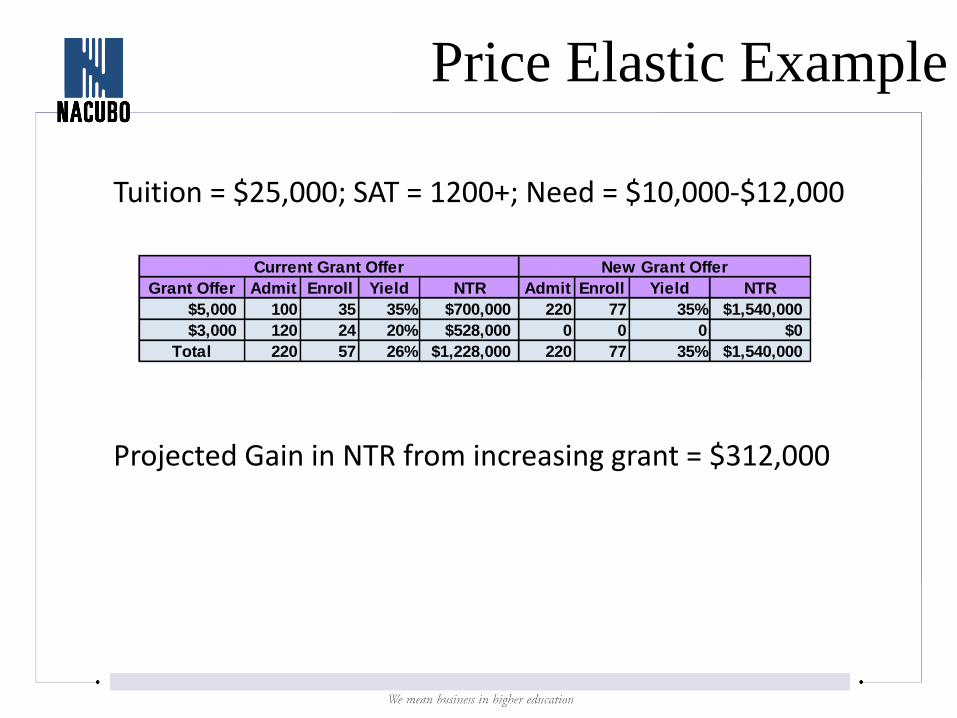
Price Elastic Example
Grant Offer Admit Enroll Yield NTR Admit Enroll Yield NTR
$5,000 100 35 35% $700,000 220 77 35% $1,540,000
$3,000 120 24 20% $528,000 0 0 0 $0
Total 220 57 26% $1,228,000 220 77 35% $1,540,000
Current Grant Offer New Grant Offer
Tuition = $25,000; SAT = 1200+; Need = $10,000-$12,000
Projected Gain in NTR from increasing grant = $312,000
• Considers multiple variables at once
• Supports simulations of alternative
approaches
• Provides powerful tradeoff analysis
Predictive Modeling

Sample Model Factors

Price Elasticity
0
1
2
3
4
5
6
1 2 3 4 5 6 7 8 9 10 11 12 13 14 15 16 17 18 19 20 21 22 23
Ex
pec
ted
Net
Tu
itio
n R
even
ue
Grant
Inelastic Elastic
Elasticity Tells You Which Side Of The Peak You Are
On.

Simulation of Alternative
Strategies
• Does the new policy really increase net
tuition revenue?
• What is the impact on total class size?
• What is its impact on geographic or ethnic
diversity?
• On the student quality profile?

Sample Simulation Summary Table:
Predicted
Class
(Baseline)
Add Need-
based Aid
Lower aid
for Lower Q
Larger Cuts
for Lower Q
Enrollment 572 595 558 524
Institutional Grant $10,247,214 $11,498,219 $9,355,848 $7,637,731
NTR $9,144,787 $8,687,059 $9,565,578 $10,139,259
Discount 52.8% 57.0% 49.4% 43.0%
High School GPA 3.40 3.40 3.40 3.42
Avg. SAT 1086 1086 1090 1098
Applied for Aid 84.5% 85.1% 83.0% 82.4%
% Female 64.4% 64.6% 64.2% 64.2%
% Catholic 56.2% 56.1% 55.9% 56.1%
% Honors 13.1% 12.8% 12.3% 13.1%
% Minority 51.1% 51.8% 50.4% 48.4%
% Pell Grant Recipients 35.9% 36.8% 33.1% 30.9%
% First Generation 42.0% 42.5% 40.3% 38.5%
% In-State 82.3% 82.0% 81.5% 81.1%
Data-Driven Budget Planning
• The simulations provide a basis for
discussions about tradeoffs and, ultimately,
for setting budget targets for incoming
students (NTR, discount rate, class size).
• To budget for returning students, use a by-
class year, trend-based approach.
22

Students Avg. Grant Students Avg. Grant Students Avg. Grant Students Avg. Grant
Freshmen 500 $13,700 500 $13,700 500 $13,700 500 $13,700
Sophomores 450 $10,000 375 $13,700 375 $13,700 375 $13,700
Juniors 425 $9,500 401 $10,000 334 $13,700 334 $13,700
Seniors 400 $9,300 404 $9,500 380 $10,000 317 $13,700
Total 1775 $10,765 1679 $11,808 1589 $12,814 1526 $13,700
Tuition $28,000 $28,840 $29,705 $30,596
FR Discount Rate 48.93% 47.50% 46.12% 44.78%
Total DR 38.45% 40.94% 43.14% 44.78%
Retention Assumptions
FR to So 0.75
So to JR 0.89
JR to SR 0.95
Tuition Incr. 1.03
2013 (Actual) 2014 (Actual) 2015 (Projected) 2016 (Projected)
Sample Cohort-Based Budget Model

Albion Case Study
24

• Kathy, thanks for reminding me…
– MI among the states with greatest projected
decline in HS graduates
– Albion enrollment ~90% Michiganders
– Local challenges along with the broader
challenges we all face
25

• Fall 2009 cohort
– 50 student drop from prior year
– 70+ drop from prior four year average
– Time to reassess
• Stamats
26

• Stamats recommended that Albion engage a
partner for predictive modeling of total
revenue based on financial aid strategies
and elasticity.
27

• Institutional tradeoffs
– Size of entering class
– Quality of entering class
– Revenue from entering class
– Retention of entering class
28
• Maximize total net revenue
• Maintain quality
29
• Year #1 – Late start with S&K, many decisions already made
– Partial implementation of recommendations
– RESULTS
• Increase in net revenue per first-year student for the first time
in 5 years
• One more first-year student
• BUT, terrible retention
30

• Year #2 – More timely information from Albion to S&K and from
S&K back to Albion
• Still some information we did not have
– Implemented the majority of S&K’s recommendations
– RESULT
• Net revenue per first-year student up double digits
• Smaller class, more revenue
• Retention improved by 10%
31

• Year #3 – New Enrollment Management leadership
– Implemented some of S&K’s recommendations
– RESULT
• Net revenue per first-year student down slightly (but still up by
double digits from two years prior)
• Smaller class
• Retention up again
32

• So What?
– Using data, and trusting data, led to better
results
– The more we trusted the data, the better our
results
33

• So What?
– Having data led to:
• More discussions about tradeoffs
• Better understanding of issues by the Board
• Better planning for returning student revenue
• Better thinking about our value proposition and how
it was being communicated
34
• So What?
– But did not lead to:
• Data-based planning for new student revenue; still
planned for what we hoped
35
• A Caution
– The market is changing so fast that one needs to
be careful with too much reliance on the past
36