data flow diagrams preliminary design client: dr. …data flow diagrams – preliminary design...
TRANSCRIPT

Data Flow Diagrams – Preliminary Design
Client: Dr. Darren Lim, Assistant Professor
Proposed Project: Java Online Learning Toolkit (J.O.L.T.)
Delivered by: 518 Interactive Team Members:
Lawrence Gregory
Christopher Hughto
Erik Stegmann
Connor Vander Bogart
Jedidiah Turnbull
Revision: 1.0
Date: 12/08/09
Siena College Java Online Learning Toolkit (JOLT)
Data Flow Diagrams ii 518 Interactive
Contents
1 Data Flow Diagrams ................................................................................................... 1
2 Data Flow Diagram: Context ...................................................................................... 2
3 Data Flow Diagram: Level 0....................................................................................... 3
3.1 Process 1, Level 1: Answer Problem ................................................................... 4
3.2 Process 2, Level 1 View Gradebook .................................................................... 5
3.3 Process 3, Level 1Manage Problems and Problem Sets....................................... 6
3.3.1 Process 3.1 Level 2 Create Problem ............................................................. 7
3.3.2 Process 3.2 Level 2 Edit Problem ................................................................. 8
3.3.3 Process 3.3 Level 2 Create Problem Set ....................................................... 9
3.3.4 Process 3.4 Level 2 Edit Problem Set ......................................................... 10
3.4 Process 4 Level 1 Manage Courses .................................................................... 11
3.4.1 Process 4.1 Level 2 Create Course ............................................................. 12
3.4.2 Process 4.2 Level 2 Edit Course ................................................................. 13
3.4.3 Process 4.3 Level 2 Create Section ............................................................. 14
3.4.4 Process 4.4 Level 2 Edit Section................................................................. 15
3.5 Process 5 Level 1 Registration ........................................................................... 16
3.6 Process 6 Level 1 Authentication ....................................................................... 17
3.7 Process 7 Level 1 Manage Pools ........................................................................ 18
3.7.1 Process 7.1 Level 2 Manage Private Pool ................................................... 19
3.7.2 Process 7.2 Level 2 Manage Course Pool ................................................... 20
3.7.3 Process 7.3 Level 2 Manage Sandbox ........................................................ 21
3.7.4 Process 7.4 Level 2 Manage Global Pool ................................................... 22
3.8 Process 8 Level 1 Manage Users........................................................................ 23
3.8.1 Process 8.1 Level 2 Create Faculty Account .............................................. 24
3.8.2 Process 8.2 Level 2 Create Course Coordinator Account........................... 25
3.8.3 Process 8.3 Level 2 Edit User Account Information .................................. 26
3.8.4 Process 8.3.1 Level 3 Edit Student Account ............................................... 27
3.8.5 Process 8.3.2 Level 3 Edit Faculty Account ............................................... 28
3.8.6 Process 8.3.3 Level 3 Edit Course Coordinator Account ........................... 29

1 Data Flow Diagrams The Data Flow Diagrams (DFDs) are used for structure analysis and design. DFDs show the flow of data
from external entities into the system. DFDs also show how the data moves and is transformed from one
process to another, as well as its logical storage. The following symbols are used within DFDs. For
clarity, a key has been provided at the bottom of this page.
At the request of our client, Dr. Lim, some of our diagrams have been done in the UML Activity Diagram
format. These documents are contained in the “Activity Diagram” Document, which is found on the 518
Interactive website. The processes that break down to activity diagrams are indicated with a “AN” Label
at the bottom of the process bubble, where N is an integer.
Source/Sink: Represented by rectangles in the diagram. Sources and Sinks are external entities which
are sources or destinations of data, respectively.
Process: Represented by circles in the diagram. Processes are responsible for manipulating the data.
They take data as input and output an altered version of the data.
Data Store: Represented by a segmented rectangle with an open end on the right. Data Stores are both
electronic and physical locations of data. Examples include databases, directories, files, and even filing
cabinets and stacks of paper.
Data Flow: Represented by a unidirectional arrow. Data Flows show how data is moved through the
System. Data Flows are labeled with a description of the data that is being passed through it.

Siena College Java Online Learning Toolkit (JOLT)
Data Flow Diagrams 2 518 Interactive
2 Data Flow Diagram: Context A context diagram is a top level data flow diagram. It only contains one process node (Process 0) that
generalizes the function of the entire system in relationship to external entities.

Siena College Java Online Learning Toolkit (JOLT)
Data Flow Diagrams 3 518 Interactive
3 Data Flow Diagram: Level 0 The Level 0 Data Flow Diagram shows all of the main, high-level functions of JOLT. Note that each
process uses one or more data stores. For clarity, the data stores have been omitted from this diagram.
Further detail is provided in subsequent diagrams.

Siena College Java Online Learning Toolkit (JOLT)
Data Flow Diagrams 4 518 Interactive
3.1 Process 1, Level 1: Answer Problem
This diagram represents the high-level functions involved in answering a problem from a student’s
perspective. Note the absence of process numbers: These processes represent UML Activity
diagrams, which are contained in the Activity Diagrams Document.
Siena College Java Online Learning Toolkit (JOLT)
Data Flow Diagrams 5 518 Interactive
3.2 Process 2, Level 1 View Gradebook
This process is represented as an Activity Diagram, per request of the client. Please reference Diagram
“A4” for the Faculty, Course Coordinator, and Administrator users, and Diagram “A5” for the Student
user.

Siena College Java Online Learning Toolkit (JOLT)
Data Flow Diagrams 6 518 Interactive
3.3 Process 3, Level 1Manage Problems and Problem Sets
This diagram represents the high level functions involved in managing problems and
problem sets.

Siena College Java Online Learning Toolkit (JOLT)
Data Flow Diagrams 7 518 Interactive
3.3.1 Process 3.1 Level 2 Create Problem
This diagram represents a breakdown of how a problem is created by a Faculty, Course
Coordinator, or Administrator user.

Siena College Java Online Learning Toolkit (JOLT)
Data Flow Diagrams 8 518 Interactive
3.3.2 Process 3.2 Level 2 Edit Problem
This diagram represents a breakdown of how a problem is edited by a Faculty, Course
Coordinator, or Administrator user.

Siena College Java Online Learning Toolkit (JOLT)
Data Flow Diagrams 9 518 Interactive
3.3.3 Process 3.3 Level 2 Create Problem Set
This diagram represents a breakdown of how a problem set is created by a Faculty,
Course Coordinator, or Administrator user.

Siena College Java Online Learning Toolkit (JOLT)
Data Flow Diagrams 10 518 Interactive
3.3.4 Process 3.4 Level 2 Edit Problem Set
This diagram represents a breakdown of how a problem set is edited by a Faculty,
Course Coordinator, or Administrator user.

Siena College Java Online Learning Toolkit (JOLT)
Data Flow Diagrams 11 518 Interactive
3.4 Process 4 Level 1 Manage Courses
This diagram represents a breakdown of how courses are managed by Faculty, Course
Coordinator, or Administrator users.
.

Siena College Java Online Learning Toolkit (JOLT)
Data Flow Diagrams 12 518 Interactive
3.4.1 Process 4.1 Level 2 Create Course
This diagram represents a breakdown of how course is by an Administrator user.

Siena College Java Online Learning Toolkit (JOLT)
Data Flow Diagrams 13 518 Interactive
3.4.2 Process 4.2 Level 2 Edit Course
This diagram represents a breakdown of how a course is edited by an Administrator
user.

Siena College Java Online Learning Toolkit (JOLT)
Data Flow Diagrams 14 518 Interactive
3.4.3 Process 4.3 Level 2 Create Section
This diagram represents a breakdown of how a section is created by an Administrator
and Course Coordinator user.

Siena College Java Online Learning Toolkit (JOLT)
Data Flow Diagrams 15 518 Interactive
3.4.4 Process 4.4 Level 2 Edit Section
This diagram represents a breakdown of how a section is edited by an Administrator
and Course Coordinator user.

Siena College Java Online Learning Toolkit (JOLT)
Data Flow Diagrams 16 518 Interactive
3.5 Process 5 Level 1 Registration
This diagram represents a breakdown of how students register with the system.
The containing processes are represented as Activity Diagrams, per request of the client. Please reference
Diagrams “A6” and “A7” in the Activity Diagram Document.

Siena College Java Online Learning Toolkit (JOLT)
Data Flow Diagrams 17 518 Interactive
3.6 Process 6 Level 1 Authentication
This diagram represents a breakdown of how authentication is handled within JOLT.
This process is represented as an Activity Diagram, per request of the client. Please reference Diagram
“A8” in the Activity Diagram Document.

Siena College Java Online Learning Toolkit (JOLT)
Data Flow Diagrams 18 518 Interactive
3.7 Process 7 Level 1 Manage Pools
This diagram represents a breakdown of how pools are managed with JOLT for Faculty,
Course Coordinators, and the Administrator.

Siena College Java Online Learning Toolkit (JOLT)
Data Flow Diagrams 19 518 Interactive
3.7.1 Process 7.1 Level 2 Manage Private Pool
This diagram represents a breakdown of how a private pool is managed by a Faculty,
Course Coordinator, or Administrator user.

Siena College Java Online Learning Toolkit (JOLT)
Data Flow Diagrams 20 518 Interactive
3.7.2 Process 7.2 Level 2 Manage Course Pool
This diagram represents a breakdown of how a course pool is managed by a Course
Coordinator, or Administrator user.

Siena College Java Online Learning Toolkit (JOLT)
Data Flow Diagrams 21 518 Interactive
3.7.3 Process 7.3 Level 2 Manage Sandbox
This diagram represents a breakdown of how a sandbox is managed by a Faculty,
Course Coordinator, or Administrator user.

Siena College Java Online Learning Toolkit (JOLT)
Data Flow Diagrams 22 518 Interactive
3.7.4 Process 7.4 Level 2 Manage Global Pool
This diagram represents a breakdown of how the Global Pool is managed by the
Administrator user.

Siena College Java Online Learning Toolkit (JOLT)
Data Flow Diagrams 23 518 Interactive
3.8 Process 8 Level 1 Manage Users
This diagram represents a breakdown of how users are managed by Course
Coordinator, or Administrator users.
Please note that the details for Unlocking, enabling, and disabling accounts have not
been established, so those processes (8.4, 8.5, 8.6, respectively) have not been broken
down.

Siena College Java Online Learning Toolkit (JOLT)
Data Flow Diagrams 24 518 Interactive
3.8.1 Process 8.1 Level 2 Create Faculty Account
This diagram represents a breakdown of how the Faculty Accounts are created.

Siena College Java Online Learning Toolkit (JOLT)
Data Flow Diagrams 25 518 Interactive
3.8.2 Process 8.2 Level 2 Create Course Coordinator Account
This diagram represents a breakdown of how the Course Coordinator accounts are
created.

Siena College Java Online Learning Toolkit (JOLT)
Data Flow Diagrams 26 518 Interactive
3.8.3 Process 8.3 Level 2 Edit User Account Information
This diagram represents a breakdown of how user accounts are edited.

Siena College Java Online Learning Toolkit (JOLT)
Data Flow Diagrams 27 518 Interactive
3.8.4 Process 8.3.1 Level 3 Edit Student Account
This diagram represents a breakdown of how student accounts are edited.

Siena College Java Online Learning Toolkit (JOLT)
Data Flow Diagrams 28 518 Interactive
3.8.5 Process 8.3.2 Level 3 Edit Faculty Account
This diagram represents a breakdown of how faculty accounts are edited.
Siena College Java Online Learning Toolkit (JOLT)
Data Flow Diagrams 29 518 Interactive
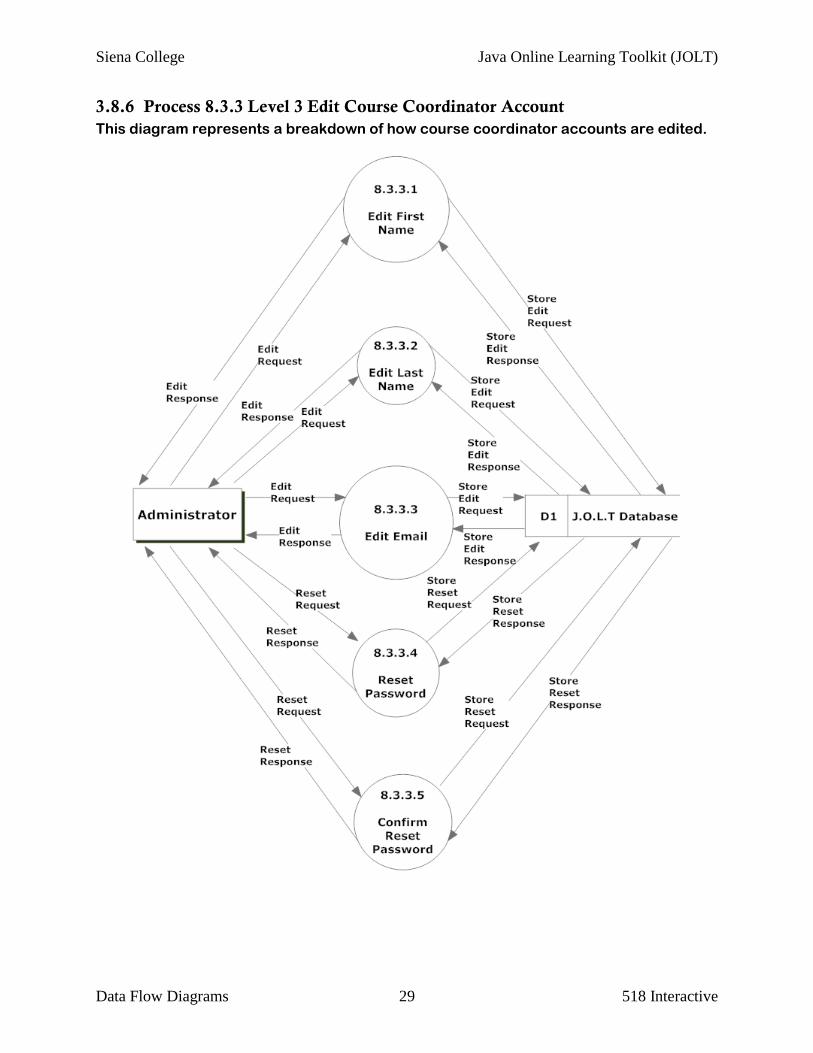
3.8.6 Process 8.3.3 Level 3 Edit Course Coordinator Account
This diagram represents a breakdown of how course coordinator accounts are edited.