whakarire ave breakwater: preliminary engineering · report whakarire ave breakwater: preliminary...
TRANSCRIPT

Report
Whakarire Ave Breakwater:Preliminary Engineering
April 2008
Prepared for
Napier City Council

report
Whakarire Ave Breakwater: Preliminary Engineering Prepared for Napier City Council (Client)
By Beca Infrastructure Ltd (Beca)
April 2008 © Beca 2008 (unless Beca has expressly agreed otherwise with the Client in writing). This report has been prepared by Beca on the specific instructions of our Client. It is solely for our Client’s use for the purpose for which it is intended in accordance with the agreed scope of work. Any use or reliance by any person contrary to the above, to which Beca has not given its prior written consent, is at that person's own risk.


Table of Contents
1 Introduction.......................................................................................................................... 1 1.1 Purpose ........................................................................................................................................1
2 Coastal Processes............................................................................................................... 1 2.1 History ..........................................................................................................................................1 2.2 Wave Climate ...............................................................................................................................2 2.3 Currents........................................................................................................................................3 2.4 Sediment Transport ......................................................................................................................4 2.5 Causes of Erosion ........................................................................................................................5
3 Option Selection .................................................................................................................. 6 3.1 Previous Investigations.................................................................................................................6 3.2 Layout of Preferred Option. ..........................................................................................................6 3.3 Refinement of Preferred Layout ...................................................................................................7
4 Preliminary Engineering Design ........................................................................................ 9 4.1 Available Data ..............................................................................................................................9 4.2 Design Considerations ...............................................................................................................10
5 Assessment of Environmental Effects. ........................................................................... 15 5.1 Construction ...............................................................................................................................15 5.2 Coastal Processes .....................................................................................................................16 5.3 Surfing Conditions ......................................................................................................................16 5.4 Other Factors .............................................................................................................................16
6 Conclusions ....................................................................................................................... 17 7 References.......................................................................................................................... 18
Beca // 16 April 2008 // Page i
3120511/100 // L3:21258-SLP84R03.DOC Rev B

Whakarire Ave Breakwater
1 Introduction
1.1 Purpose
The purpose of this report is to investigate and make recommendations on the preliminary engineering aspects of the proposed Whakarire Ave breakwater in sufficient detail for a resource consent application.
The coastal processes are also discussed in some detail in this report because the requirements for the breakwater are strongly influenced by these processes. Another aspect which has influenced the shape of the breakwater is its effects on surfing conditions. This was investigated by MetOcean Solutions (2008) and the results of that investigation are discussed in this report.
2 Coastal Processes
The coastal processes at Westshore Beach are discussed in Beca (2003) and Beca (2007). A comprehensive description of the coastal processes is given in Komar (2005). Following is a summary of the coastal processes based on these references.
2.1 History
Much has been written about the natural and anthropogenic changes to the Westshore coastline since Maori occupation of the area. Gibb (1996) provides a succinct history of the area. In relation to the Whakarire Avenue area the following events are highlighted:
Prior to harbour works and the 1931 earthquake the Ahuriri Harbour was significantly larger and subject to natural fluctuations in width from about 115 to 275 metres and tidal currents of up to 6 to 7 knots, causing changes to the nearshore and foreshore areas adjacent to the entrance.
Between 1855 and 1875 limestone boulders were removed from the Ahuriri entrance area for ships ballast which destabilised the entrance resulting in an increase in width and a corresponding decrease in depths.
Between 1876 and 1879 the entrance was confined to a width of 122 metres between 2 training moles resulting in the trapping of the net northerly drift of gravel against the east mole and starving Westshore Beach of its natural supply of gravel and sand.
Between 1879 and 1887 gravel and sand commenced bypassing the entrance in the form of an elongated bank. That is, an ebb delta and a scoured basin formed on the nearshore seabed adjacent to the entrance in response to the ebb tide jet with velocities up to 7 knots.
Between 1882 and 1888 gravels were dredged from the entrance and used to reclaim the western spit by Whakarire Avenue, thereby stabilising the shoreline. A freezing company was located in this area. In 1888 the deposition of dredgings behind the western mole was discontinued and the outer beach rapidly began to diminish to the extent that the freezing company needed to protect their works by building groynes.
Between 1887 and 1890 the weather breakwater for Napier Harbour was constructed, which totally blocked the northerly drift of gravel and deflected the northerly transport of
3120511/100 Beca Page 1 L3:20249-SLP84R03.DOC Rev B 16 April 2008

Whakarire Ave Breakwater
sand. This resulted in the Ahuriri entrance deepening and bypassing of sediments northwards pass the entrance ceased.
Between 1909 and 1923 protection works were constructed around the Whakarire Avenue reclamation to combat sea erosion.
On 3 February 1931 the Hawkes Bay earthquake produced an instantaneous 20 to 65 metre shoreline advance and a 1.8 to 2.1 metre uplift of the gravel barrier and nearshore seabed. Another dramatic effect of the earthquake was the disappearance of most of the shallow Ahuriri Estuary, significantly diminishing the tidal prism, the tidal jet and any nearshore bar system. Some 2,230ha of the 3,845ha estuary was uplifted. As the earthquake reduced river gradients, the Tutaekuri River was redirected from its discharge into the harbour to the south near Awatoto where it remains today.
From 1931 to the mid 1960’s the uplifted beach profile was gradually eroded in the nearshore and formed a well maintained beach system which either advanced or remained in dynamic equilibrium. Frequently during this period Westshore Beach appeared as a sandy beach. By the mid 1960’s the benefits of the uplifted foreshore area had diminished and the Westshore Beach system started to noticeably erode.
Between 1987 and 2002, 155,000 cubic metres of gravel and sand were placed on the nearshore of Westshore Beach and an additional 79,000 cubic metres was placed in the back barrier to renourish the beach system. In general this material has been placed within the beach system north of Whakarire Avenue although in 1995, some 4,500 cubic metres of fine gravel and 10,000 m3 of fine sand were placed immediately in front of Whakarire Avenue. This material was observed to have moved rapidly to the north. Artificial nourishment of Westshore Beach has continued since 2002.
2.2 Wave Climate
Waves are the predominant mechanism for gravel and sand transport within the Westshore Beach system. There is a natural tendency for a shoreline to be in balance with the incoming wave environment and the natural net supply of sediment to the system. The entire bay is subject to a number of headland constraints. At the southern end of Westshore, Whakarire Avenue is located in the lee of the eastern mole, the Port of Napier breakwater and Portland Island, resulting in a sheltered wave environment subject to diffraction from these headlands and local refraction due to the shoaling reef immediately seaward.
The offshore wave climate has to a degree been quantified by Gorman et al (2003) using hindcasting techniques for deepwater waves (in 200m CD) over the period 1979-1998, and by Port of Napier deploying a wave rider buoy over 4 years in 16m CD depth of water seaward of their breakwater. Direct comparison of the results is difficult because of the different record periods and base locations. Tonkin and Taylor (2004) used a nearshore wave model to transform the deepwater waves (1979-1998) into 10m CD of water. MetOcean Solution (2008) performed a similar study for a hindcast period of 1997 to 2007 with a deepwater site offshore of the Port of Napier breakwater. Comparison of results indicated that the Port of Napier data gave a mean significant wave height of 0.86m with a mean wave period of 11.4 s, the Tonkin and Taylor analysis a mean significant wave height of 0.70m with a mean wave period of 10.8s (and a mean approach angle of 116º true north) and the Met Ocean Solution’s analysis a mean significant wave height of 1.08m. A summary of the wave statistics for the Port of Napier buoy is presented in Table 2.1.
3120511/100 Beca Page 2 L3:20249-SLP84R03.DOC Rev B 16 April 2008
Whakarire Ave Breakwater
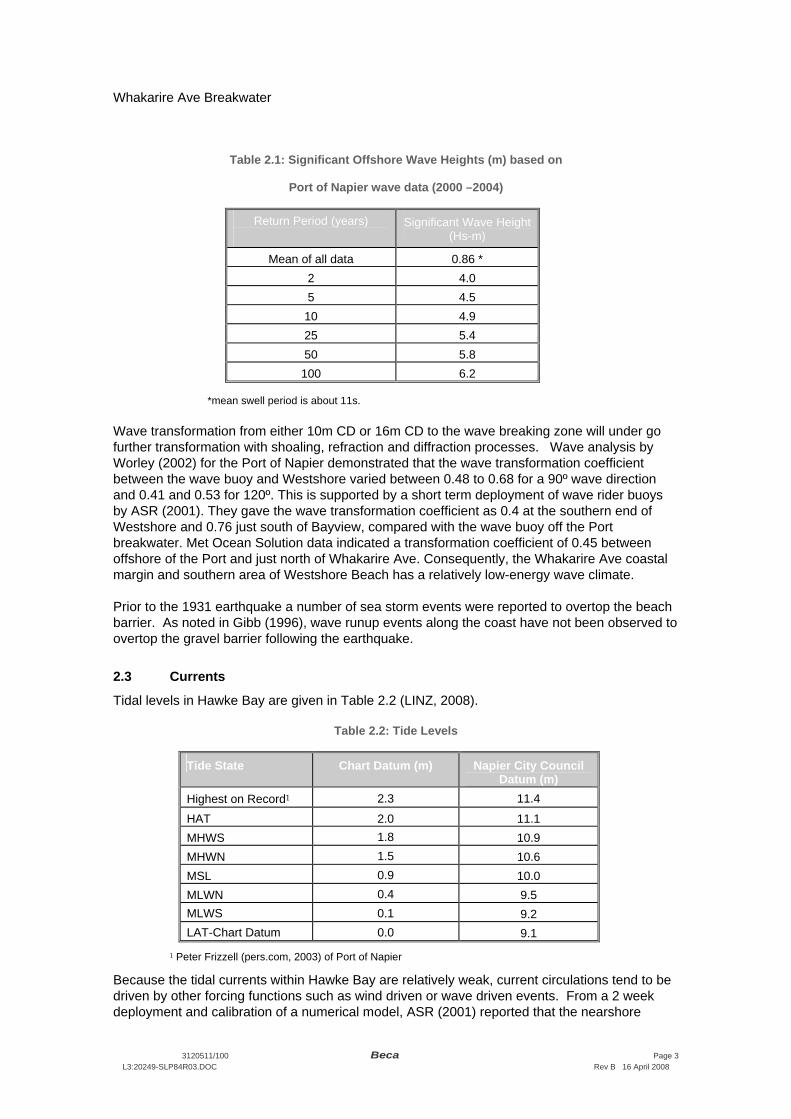
Table 2.1: Significant Offshore Wave Heights (m) based on
Port of Napier wave data (2000 –2004)
Return Period (years)
Significant Wave Height(Hs-m)
Mean of all data 0.86 * 2 4.0 5 4.5
10 4.9 25 5.4 50 5.8 100 6.2
*mean swell period is about 11s.
Wave transformation from either 10m CD or 16m CD to the wave breaking zone will under go further transformation with shoaling, refraction and diffraction processes. Wave analysis by Worley (2002) for the Port of Napier demonstrated that the wave transformation coefficient between the wave buoy and Westshore varied between 0.48 to 0.68 for a 90º wave direction and 0.41 and 0.53 for 120º. This is supported by a short term deployment of wave rider buoys by ASR (2001). They gave the wave transformation coefficient as 0.4 at the southern end of Westshore and 0.76 just south of Bayview, compared with the wave buoy off the Port breakwater. Met Ocean Solution data indicated a transformation coefficient of 0.45 between offshore of the Port and just north of Whakarire Ave. Consequently, the Whakarire Ave coastal margin and southern area of Westshore Beach has a relatively low-energy wave climate.
Prior to the 1931 earthquake a number of sea storm events were reported to overtop the beach barrier. As noted in Gibb (1996), wave runup events along the coast have not been observed to overtop the gravel barrier following the earthquake.
2.3 Currents
Tidal levels in Hawke Bay are given in Table 2.2 (LINZ, 2008).
Table 2.2: Tide Levels
Tide State Chart Datum (m) Napier City Council Datum (m)
Highest on Record1 2.3 11.4
HAT 2.0 11.1 MHWS 1.8 10.9 MHWN 1.5 10.6 MSL 0.9 10.0 MLWN 0.4 9.5 MLWS 0.1 9.2 LAT-Chart Datum 0.0 9.1
1 Peter Frizzell (pers.com, 2003) of Port of Napier
Because the tidal currents within Hawke Bay are relatively weak, current circulations tend to be driven by other forcing functions such as wind driven or wave driven events. From a 2 week deployment and calibration of a numerical model, ASR (2001) reported that the nearshore
3120511/100 Beca Page 3 L3:20249-SLP84R03.DOC Rev B 16 April 2008

Whakarire Ave Breakwater
currents move in a southerly direction from the Bayview area with a strong anticlockwise rotation over the deeper parts of the bay and a weaker clockwise rotation closer to shore nearer the Ahuriri Entrance. In general the currents are relatively weak and less than 0.1m/s.
2.4 Sediment Transport
The Westshore Beach and barrier system is generally covered in gravel although during periods of finer weather some sand has been observed to build up within the intertidal area. The nearshore comprises fine sands, generally less than 0.2mm in size. The nearshore sands can be thought of as a foundation for the beach, allowing the incident waves to be refracted and shoaled as they move towards the coastline. Loss of nearshore sand material allows the waves to propagate further inshore and be more energetic on the beach system. The gravels tend to have a relatively steep beach profile, a berm and an erosion scarp beyond which a natural beach barrier has formed. They are highly permeable, but generally result in a reflective beach system.
When in dynamic equilibrium the orientation of a beach will be in balance with the predominant wave climate and the sediment being introduced into the beach system. If there were no external sources of sediment in the beach system then it would be orientated perpendicular to the net wave energy direction allowing for the diffraction, refraction and shoaling of waves. If there was sediment being introduced to the system, for example in a northerly direction, then the beach would be slightly orientated from the normal of the net wave energy direction in an anti clockwise direction so as to promote the transport of sediment along the beach system. This rate of sediment transport would be equivalent to the input of sediment to the system.
A number of studies have been undertaken to establish a sediment budget for both the gravel and sand system operating in the area. Figure 2.1 illustrates the sediment budget for the coarse gravel material above mean sea level as given in Gibb (2003). This also includes the benefits of the beach nourishment system for which an allowance of 16,500 m3 a year has been made. (This number varies amongst the various reports ranging from 9,000 cubic metres per year as given by Koutsos (1999) to 16,500 as given by Gibb (2003)). In general terms the budget indicates that the beach nourishment scheme has more or less stabilised the beach south of Bayview. At its present levels of nourishment, the beach has also been assisted by the placement of sand in the nearshore area, by the Port of Napier opposite the Esplanade. Losses are experienced primarily due to the lack of sediment inputs to the system and abrasion of the gravels.
ASR (2001) has attempted to provide a sediment budget for the sand system, as illustrated in Figure 2.2. Approximately 123,000 m3 per year bypasses the port breakwater. Some of this sediment completely bypasses the shipping channels and the remainder is trapped within the dredged channels. Some of this trapped material is dredged and placed back into the sediment system. From a comparison of bathymetric records (1954, 1981) it would appear that there is a general loss of material in the Westshore nearshore system (ASR, 2001). This process would indicate a net northerly or offshore drift of sand. It is noted that the sediment budget as given in Figure 2.2 is not necessarily supported by other data. For example, Gibb (2003) has calculated from high resolution bathymetric data in Dump Area “R” (see Figure 2.3) that material is accumulating and that the material is being transported towards the shore rather than back into the port area as implied by the work of ASR (2001). Port of Napier also supports the claim that fine sand is being transported towards Westshore Beach. (Discussion with ASR (Shaw Mead, pers.com, 2003) revealed they consider that the coarser fraction of sand is directed from the end of the port breakwater to Bayview. The finer fraction is directed to the port channels and Westshore Bay.)
3120511/100 Beca Page 4 L3:20249-SLP84R03.DOC Rev B 16 April 2008

3120511
Figure 2.1 Sediment Budget ( for coarse material above MSL)
Source Figure 9 Gibb (2003)

3120511
Figure 2.2 Sediment Budget in Westshore Bay ( for all sediments)
Source Figure 7.1 ASR (2000)

3120511
Figure 2.3 Beach Profile Locations
Source Figure 3 Gibb (2030)
for port “sand”dredgings

Whakarire Ave Breakwater
Inspection of Nautical Chart NZ 5712 shows a narrowing of the nearshore area at Bayview, between contours 5 to 10 m CD, compared to the Westshore Bay area. That is, the nearshore profile is steeper in the Bayview area. Coarser material would assist in stabilising a steeper profile.
At Westshore, significant ranges in the proportions of sand versus gravel occur where the sand tends to accumulate at the ends of each littoral cell largely owing to the changing directions of waves that reach the shore. When waves arrive from the southeast, beach sediment is transported northwards along the shore with sand accumulating at Tangoio, with transport interrupted by the headland. Sand is transported to the south, when waves arrive from the northeast, and it accumulates at Westshore. Sand can remain at these beaches for a lengthy period as they are sheltered by the headlands and also by the Port breakwater. There is a continuous gradation from the gravel upper beach, to an intertidal sand and gravel beach, which appears to continue into nearshore sand deposits. The amount of sand accumulation is significant enough that it can be classed as a composite beach. Processes of grain sorting and beach shape variability, when at their most extreme, can cause this change in classification.
The origin of the gravel particles is greywacke, a relatively soft rock. Transport of the gravel within the littoral system causes the particles to abrade, resulting in a further loss of sediment from the system. This process can often be seen from the air causing discolouration of the nearshore zone.
With little sediment input into the reach between Westshore and Tangoio the shoreline attempts to reach an equilibrium condition with the net incident wave environment. Worley (2002), assuming a net overall wave direction of 116º true north, estimated that the long-term equilibrium shoreline shape to have a crenulated form (Silvester & Hsu, 1991). Based on the existing planform shape, some further erosion would be expected to occur at the southern end of Westshore as shown on Figure 2.4. The existing beach shape is east of this location indicating that the beach will remain in an erosional phase. This erosion is currently countered by the beach nourishment system which has largely been successful in alleviating erosion and which nourishes the beach with about 15,000 m3 per year from Pacific Beach. The southern end of Westshore beach acts as a feeder for the nourishment process. Sediment from the system travels north and accumulates along the Esplanade and northwards, reducing storm erosion and flooding problems there. Further work in stabilising the southern end of Westshore beach is warranted as it continues to act as a feeder to the nourishment programme, but is narrow and is often exposed to erosion.
2.5 Causes of Erosion
The potential for coastal erosion seaward of Whakarire Avenue is primarily due to a lack of sediment supply. Since the construction of the training moles, the reduction in the tidal prism of the Ahuriri Estuary, the loss of direct sediment input from the Tutaekuri River, and the introduction of the Port of Napier breakwater system, natural inputs of sediment into the southern end of the Westshore Beach system have ceased.
The area has also been reclaimed and the orientation of the coastline in this location is not in equilibrium with the incident wave climate. This means that any sand or gravel that is introduced into the local beach system cannot hold its position because the waves drive the sediment northwards.
3120511/100 Beca Page 5 L3:20249-SLP84R03.DOC Rev B 16 April 2008

3120511
Figure 2.4 Equilibrium Shape of Westshore Beach
Source Figure 3 Gibb (2003)
Ref:
(116
o )
Tangoio
Port breakwater
Port beaches
Whakarire Ave
Pacific Beach

Whakarire Ave Breakwater
3 Option Selection
3.1 Previous Investigations
In an attempt to arrest erosion, a rock bund seawall was constructed in 1994 to protect existing properties in Whakarire Avenue. Whilst providing some level of protection to the existing coastline, it is not considered to be robust enough as a long-term structure for coastal protection. With the assistance of an offshore reef, the existing seawall funnels waves into the southern corner of Westshore beach and causes rapid transport of sediment both offshore and along shore. It does not enable a stable control point or feeder area for the current nourishment scheme which delivers on average 15,000m3 of beach material each year.
Beca (2003) examined five coastal protection options in addition to the do nothing option. These were an enhanced seawall, an enhanced seawall and infilling of backshore, a groyne to limit wave focussing, a wave spending beach and an attached breakwater with beach creation. See Figures 3.1 to 3.5.
The do nothing option found that Whakarire Avenue would be eroded without protection works and that the existing seawall was likely to fail in a significant storm event with elevated sea levels. If the existing seawall were ineffective in the long term there was the potential for the coastline to retreat and the houses located on the northern side of Whakarire Avenue could be lost. The location of the control point on the beach dictated the extent of loss of property. See Figure 3.6. In the event that the existing seawall remained intact the coastline would not retreat into the houses on Whakarire Avenue, provided the existing nourishment scheme continued. Costs associated with the do nothing option would be the clean up of the existing seawall after failure occurred and the loss of private and public property. Given historical rates of erosion, it would take many decades for the shoreline to become stable.
The coastal protection options were originally investigated as a counter erosion measure for the protection of property along Whakarire Avenue. Westshore Beach at its most southern end is close to Charles Street and offers little space for the nourishment bund or beach retreat in this area. Beca (2007) revisited these options with a view to enhancing the Westshore beach nourishment programme and providing for a better feeder system for the beach.
3.2 Layout of Preferred Option.
The coastal protection options (Beca,2003) focussed on land protection and enhancement of coastal processes. The effects of reef ecology, surfing conditions, landscape and heritage values were not considered. The existing nourishment scheme was assumed to continue and Westshore Beach planform was assumed to remain unchanged.
Based on existing information, the assessment of the coastal processes, consultation with and feedback from Napier City Council and local residents, Option W5 -Attached Breakwater with Beach Creation - was recommended. This option proposed to enhance the existing seawall parallel to the coastline, extending it out a further 100 metres. See Figure 3.5. This option offered the benefit of allowing incident wave energy to be dissipated and reflected off the seawall which would encourage a sheltered area to be formed in lee of the seawall. It should form a crenulated shaped beach which would marry in with the existing beach. Depending on the grain size characteristics, the new beach could be created from sand that is infrequently dredged from the Ahuriri entrance channel and it is likely that any sand beach created immediately in the lee of the seawall would transition into the mixed sand and gravel beach. There is also the opportunity to create a higher backshore area by filling in the existing lagoon which may have wider benefits to the community.
3120511/100 Beca Page 6 L3:20249-SLP84R03.DOC Rev B 16 April 2008

3120511
Figure 3.1 Whakarire Ave: Enhanced Seawall

3120511
Figure 3.2 Whakarire Ave:Enhanced Seawall & Infilling of Backshore

3120511
Figure 3.3 Whakarire Ave: Groyne to Limit Wave Focussing

3120511
Figure 3.4 Whakarire Ave: Wave Spending Beach

3120511
Figure 3.5 Whakarire Ave: Attached Breakwater with Beach Creation

3120511
Figure 3.6 Whakarire Ave: Do Nothing Option

Whakarire Ave Breakwater
If Westshore Beach were to retreat to Charles Street, the new sand beach and the properties on Whakarire Avenue would be protected although some public reserve would be lost. It therefore provides a robust solution for property protection.
An enhancement to this option would be to construct an offshore island. This would provide greater flexibility as a feeder system for the nourishment system and further stabilise the southern end of Westshore Beach. This feature would encourage a salient to form on the beach and hold the position of Westshore Beach 100m north of the intersection of Charles and James Streets. The island would be about 25m long and 100m offshore, as shown in Figure 3.7.
This report looks in further detail at the preferred breakwater option (Option W5 -Attached Breakwater with Beach Creation) and the offshore layout.
3.3 Refinement of Preferred Layout
It was recognised that when the original options were investigated that only coastal processes and engineering issues were addressed. The main driver was to reduce the land erosion potential for the properties along Whakarire Ave and Option W5 was selected because it offered the opportunity to create a recreational beach on the leeward side and to potentially protect the feeder area at the southern end of Westshore Beach. Another important effect of the breakwater is on surfing conditions. This has now been addressed in some detail and is covered in a separate report (MetOcean Solutions, 2008). Outcomes from that report are summarised below.
3.3.1 Effect of Breakwater on Surfing Conditions
It was found that the originally proposed breakwater did have an adverse effect on surfing conditions even if the reflectivity of the breakwater were to be reduced (from a reflection co-efficient of 0.6 to 0.4). A range of altered layouts were then investigated in an attempt to reduce the effect on surfing conditions. These altered layouts are shown in Figure 3.8.
The most representative effect is best illustrated in Figure 3.9 which traces a surfer’s ride from 500m offshore of the beach to the inshore. It can be seen that for each of the layouts:
The original proposed breakwater (with a reflection coefficient of 0.4) produced the lumpiest ride with an increase in local amplitude of 0.4m (for a 1.0m wave).
The rotated breakwater (with a reflection coefficient of 0.4) slightly improved the ride but still had an increase in local amplitude of 0.4m.
The V-shaped breakwater (with a reflection coefficient of 0.4) improved the ride considerably and had an increase in local amplitude of less than 0.2m.
The V-shaped alternative breakwater (with a reflection coefficient of 0.4) improved the ride the most and had an increase in local amplitude of less than 0.1m. It best replicated the existing ride both to seaward and leeward of the breakwater.
A similar result was found for an actual event on 19 June 2007 for a 1.4 m wave as illustrated on Figure 3.10. The V-shaped alternative breakwater replicated the existing condition the best, both seaward and leeward of the breakwater.
3.3.2 Effect of Breakwater on Westshore Beach.
The MetOcean Solution’s report reinforced the benefits offered by the breakwater scheme on Westshore Beach. The natural offshore reef which promotes good local surfing conditions focuses the wave energy on to the southern end of Westshore Beach. Because the energy is
3120511/100 Beca Page 7 L3:20249-SLP84R03.DOC Rev B 16 April 2008

3120511
Figure 3.7 Whakarire Ave: Attached Breakwater & Offshore Island
Stab
le b
each
form
-20o
wav
e at
tack
Rel
ocat
e co
ncre
te b
lock
s
25m
long
off-
shor
e is
land
Salie
nt

3120511
Figure 3.8 Breakwater Alignments
V-shaped breakwater
Original proposed breakwater
Rotated breakwater
V-shaped alternative breakwater
Existing breakwater
N
Scale 1:1000
0 10 20 30 40 50

3120511
Figure 3.9 Modelled wave heights along the approximate surfer’s path at mid-tide level
Key Plan
Surfer’s path

3120511
Figure 3.10 Wave height transects along the surfer’s path for conditions on 19th June 2007
Key Plan
Surfer’s path

Whakarire Ave Breakwater
focussed in one section, the adjoining section of the coastline is in a wave shadow. This is best illustrated in Figure 3.11 which shows the wave height (of an incident 1m wave beyond the reef) just before reaching the beach (about 50m offshore). It clearly demonstrates that for the existing situation wave heights are close to the incident wave height over 50m of the southern section, then rapidly reduce to 50% of the incident wave over the next 100m, and then stabilising at about 70 to 80% of the incident wave height along the main part of Westshore Beach. This rapid change in wave height (and wave energy) along the beach is one of the main reasons that the southern end of the beach is narrow and acts as a poor feeder area for the beach nourishment scheme. This is a very important outcome from the wave study.
Figure 3.11 also shows the effect of the different breakwater layouts on the beach wave heights. All the layouts, except the V-shaped alternative breakwater exhibit a similar “evening out” of the wave energy which will assist in the coastal processes and the beach nourishment scheme. The V-shaped alternative breakwater only partially reduces the wave energy and the area of wave focussing and wave shadowing is still obvious. This is because the V-shaped alternative breakwater is further inshore and affords a lesser amount of wave sheltering to the beach.
3.3.3 Offshore Island
Beca (2007) suggested that an offshore island could assist in stabilising the southern end of Westshore Beach so it could act as a better feeder area for the beach nourishment scheme. This feature (25m long and 100m offshore) was modelled in the MetOcean Solution’s report and Figure 3.11 shows the effect of the breakwater layouts and offshore island on the beach wave heights. The offshore island and breakwater offers about 220m of sheltering to the beach but there would also be a small amount of wave focussing between the island and the breakwater at 100m along the beach. To stabilise a beach the sheltering effect is important but the change of wave energy along the beach is probably more important. A gradual change is preferred as rapid changes (as with the existing beach) can cause rapid transport of beach sediment both longshore and cross shore, as often rip currents are developed.
The offshore island would be beneficial in sheltering the beach and creating a wider beach opposite James St. However the breakwater schemes provide a more gradual spread of wave energy along the beach, which will assist in stabilising the beach and improving its function as a feeder beach. It is concluded that, on balance, the creation of another structure within the beach environment is not warranted when compared with the benefits offered by the breakwater layouts.
3.3.4 Preferred Option
From the above discussion of the breakwater and offshore island layouts the following is a summary of outcomes:
The V-shaped alternative breakwater has the least effect on surfing conditions both seaward and leeward of the breakwater
All options offer the opportunity for a recreational beach to be developed on the leeward side of the breakwater. The V-shaped alternative breakwater has the least footprint on the CMA if a beach were to be created behind it.
The V-shaped alternative breakwater provides the least amount of sheltering of the beach, and does not have the same gradual spread in wave energy along the beach as the other layouts.
3120511/100 Beca Page 8 L3:20249-SLP84R03.DOC Rev B 16 April 2008

3120511
Figure 3.11 Wave heights along a transect 50m off shore and parallel to the shore
Key Plan
Inshore transect

Whakarire Ave Breakwater
Although an offshore breakwater offers an increase in the level of sheltering of Westshore Beach at the southern end, it is not recommended to pursue it as the other layouts should sufficiently shelter the beach and improve its performance as a feeder area for the nourishment scheme.
Based on the above conclusions the V-shaped alternative breakwater is recommended but with the following variations, as shown in Figure 3.12:
The eastern arm of the breakwater is extended by 20m to a total of 60m. It then follows the same alignment as the northern arm of the V-shaped breakwater, except than it continues for another 25m to the west.
All the seaward faces of the breakwater will be at a slope of 1:3 (V:H) to promote a relatively low reflection coefficient of 0.4.
It is considered that, on balance, the above refinements of the V-shaped alternative breakwater will have the following benefits:
The least effect on the surfing conditions seaward of the breakwater which is the main surfing area.
By moving the northern arm seaward to the location of the V-shaped breakwater it offers a higher degree of sheltering of the southern end of Westshore Beach.
The additional 25m of breakwater length should provide a more gradual transition of wave energy and higher level of sheltering along Westshore beach which will then act as a better feeder area for the nourishment scheme and provide an optimal layout for the recreational beach. It is accepted that the surfing conditions on the leeward side of the breakwater will not be as good as the “V-shaped alternative” breakwater but this is considered to be a good compromise.
4 Preliminary Engineering Design
The following appraisal of the engineering design is based on the layout as shown in Figure 3.12. This is henceforth referred to as the preferred layout.
4.1 Available Data
4.1.1 Land Survey and Bathymetry
Land survey has been taken from Napier City Council’s LIDAR data base and immediate seabed bathymetry is taken from a hydrographic survey conducted by Peter Frizell (Sept, 2007). All information is presented in terms of Chart Datum (CD) for which MSL is 0.9m above CD. This is the same level as Napier City Council’s local datum of 10.0m.
4.1.2 Coastal Data
Information on waves, tide level, currents and beach profiles is given in Section 2.0, Beca (2007) and MetOcean Solutions (2008).
3120511/100 Beca Page 9 L3:20249-SLP84R03.DOC Rev B 16 April 2008

3120511
Figure 3.12 Preferred Breakwater Alignment
V-shaped breakwater
V-shaped alternative breakwater
Existing breakwater
N
Scale 1:1000
0 10 20 30 40 50m
Preferred option

Whakarire Ave Breakwater
In addition, data on local beaches has been obtained as part of this study. The beaches to the south of the port have been ‘recreated’ naturally over the past 20 years. It was found that the east beach has a foreshore gradient of 1:23 and a median grain size of 0.17mm. The west beach has a foreshore gradient of 1:16 and a median grain size of 0.22mm. The grading curves are included in Appendix A.
Data has been obtained on median grain sizes in the nearshore area of Westshore Beach (ASR, 2001). The median size of sediment in the ebb shoal entrance was 0.15mm and the nearshore sands up to Bayview generally range in median size between 0.13-0.18mm. All of the above sediments would be described as fine sand.
4.1.3 Geotechnical Data
No specific data has been collected for the site but it is known that the alignment of the preferred layout is located on soft rock at seabed level.
4.2 Design Considerations
4.2.1 Design Assumptions and Criteria
The following section sets out a range of design assumptions and criteria as summarised below:
Design life of 50 to 100years
Allow for sea level rise of 0.5m over next 100 years (MfE, 2004)
Design water level of 2.3m above CD.
Design significant wave of 2.0m and maximum wave of 2.5m
Design incident wave direction of 22.5o.
Design breakwater crest level of 3.5m above CD.
Breakwater seaward face slope of 1:3, leeward face of 1:2 and crest width of 4m.
Imported rock for seaward slope and local rock for crest and leeward slope.
Beach foreshore slope of 1:25 and berm level at 2.3m above CD.
4.2.2 Breakwater Height
It is important to have a constant full height breakwater along its alignment in order to shelter the southern end of Westshore Beach and to encourage the maximum level of diffraction for the new recreational beach.
The average seabed level along the eastern arm of the preferred breakwater is -0.6m CD and along the western arm is -0.5m CD.
The height of the wall is a balance between limiting the amount of wave overtopping and not creating a visual barrier from the new beach or Westshore Beach. As is discussed in Section 4.2.5, the berm height (i.e. flat dry area of the beach) of the new beach will be set 0.5m above MHWS. In order to not obstruct views from the beach (while standing up) the wall height would need to be limited to about 1.2-1.5m above the beach berm. This approximately corresponds to a level of 3.5m above CD compared to 2.8m above CD for the existing wall and 4.0 m above CD for the carpark adjacent to the western side of Ahuriri entrance (also known as the Western Mole). To understand the sensitivity of the level of overtopping for the various stages of the tide,
3120511/100 Beca Page 10 L3:20249-SLP84R03.DOC Rev B 16 April 2008

Whakarire Ave Breakwater
a wall crest level of 3.5m CD and a wall crest level of 4.0m CD have been investigated. The results are given in Tables 4.1 and 4.2 based on UK Environment Agency (1999).
The level of overtopping for both crest heights is not sufficient to cause damage to the structure provided the crest is protected with armour. However the level of overtopping is sufficient to potentially be dangerous for pedestrians. This danger would arise if there were 1 m significant waves and the water level was above MSL for a crest level of 3.5m CD and 1.2m CD for a crest level of 4.0m CD.
This potential danger to pedestrians could be overcome by building the crest level higher which would be imposing visually on the coastal environment. Installing a wave return wall along the crest would also reduce overtopping levels but this would increase the wave reflection and affect surfing conditions. It is considered that the better option is to build the wall to a sufficient height for amenity purposes such that sea views are not obstructed from the beach. This crest height, on balance, is about 3.5m CD which would be 1.2m above the new beach berm level. It is strongly recommended, however, that good signage is provided which warns the public of using the breakwater in adverse weather conditions.
Table 4.1: Wave Overtopping for Crest Level of 3.5mCD
Sea level Wave Height (Hs-m)
Frequency of wave event (RP-years)
Overtopping rate (m3/s/m)
MSL (0.9m CD) 1.0 <1 0.007 MHWS (1.8mCD) 1.0 <1 0.04 MHWS +0.5m (2.3mCD)
1.0 <1 0.10
MSL (0.9m CD) 1.5* 1-2 0.007 MHWS (1.8mCD) 1.5 1-2 0.10 MHWS +0.5m (2.3mCD)
1.5 1-2 0.23
MSL (0.9m CD) 2.0* 5 0.007 MHWS (1.8mCD) 2.0* 5 0.10 MHWS +0.5m (2.3mCD)
2.0* 5 0.31
MSL (0.9m CD) 2.5* 25 0.007 MHWS (1.8mCD) 2.5* 25 0.10 MHWS +0.5m (2.3mCD)
2.5* 25 0.31
Note: 1. seabed at -0.6m CD 2. wave period tp of 10 to 12s. 3. * denotes wave breaking conditions at wall
3120511/100 Beca Page 11 L3:20249-SLP84R03.DOC Rev B 16 April 2008

Whakarire Ave Breakwater
Table 4.2: Wave Overtopping for Crest Level of 4.0m CD
Sea level Wave Height (Hs-m)
Frequency of wave event (RP-years)
Overtopping rate (m3/s/m)
MSL (0.9m CD) 1.0 <1 0.003 MHWS (1.8mCD) 1.0 <1 0.01 MHWS +0.5m (2.3mCD)
1.0 <1 0.04
MSL (0.9m CD) 1.5* 1-2 0.003 MHWS (1.8mCD) 1.5 1-2 0.05 MHWS +0.5m (2.3mCD)
1.5 1-2 0.10
MSL (0.9m CD) 2.0* 5 0.003 MHWS (1.8mCD) 2.0* 5 0.05 MHWS +0.5m (2.3mCD)
2.0* 5 0.15
MSL (0.9m CD) 2.5* 25 0.003 MHWS (1.8mCD) 2.5* 25 0.05 MHWS +0.5m (2.3mCD)
2.5* 25 0.15
Note: 1. seabed at -0.6m CD 2. wave period tp of 10 to 12s. 3. * denotes wave breaking conditions at wall
4.2.3 Design Water Level
As indicated in Tables 4.1 and 4.2, under the more extreme wave events the wave height at the breakwater is depth limited. Under these conditions the wave height is more dependent on water depth and nearshore seabed gradients than the offshore incident wave climate. The approach seabed gradient is at 1:75 and the wave height where it breaks near the breakwater will be between 0.5 to 0.7 of the water depth. Therefore the selection of the design water depth is critical for estimating the design wave (which in turn affects the design of the breakwater). The design water level needs to take into account the tide level, surge, and an allowance for sea level rise. A good indication of the maximum tide and surge level is the maximum water level on record. Assuming the worst of all conditions, however, produces a very conservative wave height. This is because, although the breaker wave height is less dependent on offshore wave conditions, an extreme wave event still needs to coincide with the design water level for extreme wave breaking conditions to develop. Design wave heights for various water depths and incident wave events are given in Table 4.3 based on Goda (1985).
The design wave heights given in Table 4.3 are for irregular waves and the results are generally more conservative than other estimation methods. (e.g. CUR,1991; Owen (1980)). It is considered that the design water level should be taken as 2.3m CD which corresponds to both the highest tide on record and also MHWS plus an allowance for sea level rise. For the purpose of design, a design significant wave of 2.0m and a maximum wave of 2.5m at the breakwater will be adopted.
3120511/100 Beca Page 12 L3:20249-SLP84R03.DOC Rev B 16 April 2008
Whakarire Ave Breakwater
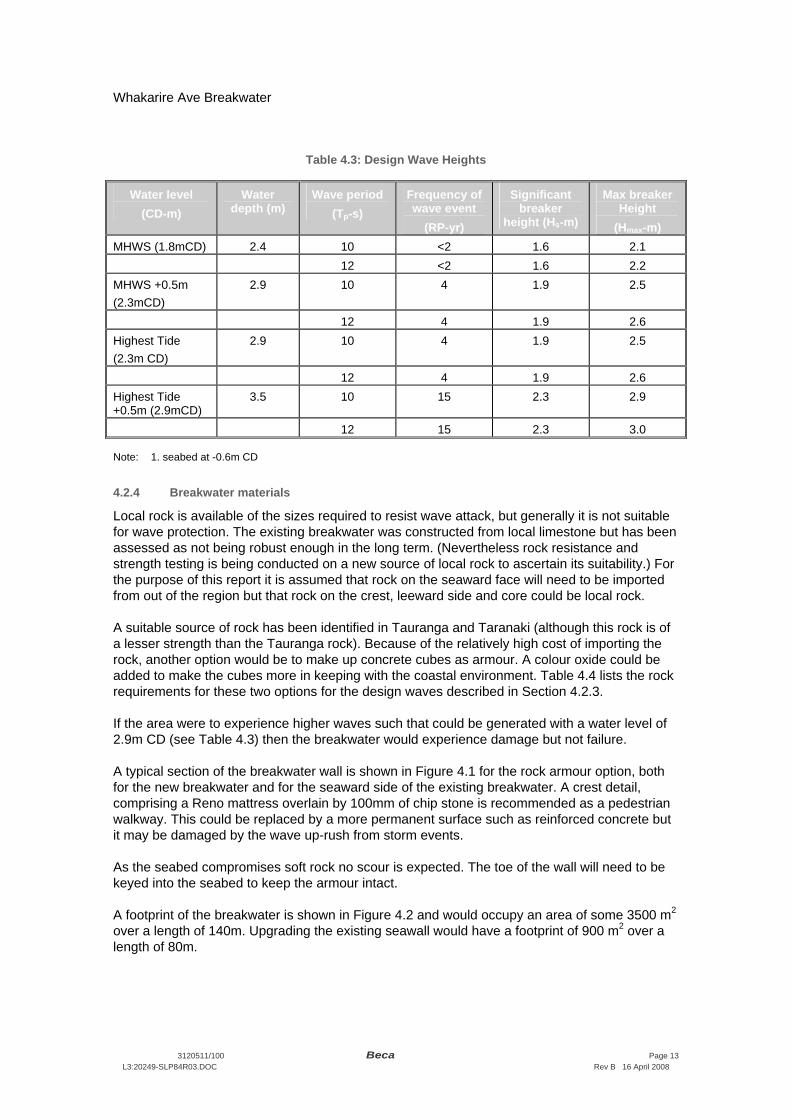
Table 4.3: Design Wave Heights
Water level (CD-m)
Water depth (m)
Wave period (Tp-s)
Frequency of wave event
(RP-yr)
Significant breaker
height (Hs-m)
Max breaker Height
(Hmax-m) MHWS (1.8mCD) 2.4 10 <2 1.6 2.1 12 <2 1.6 2.2 MHWS +0.5m (2.3mCD)
2.9 10 4 1.9 2.5
12 4 1.9 2.6 Highest Tide (2.3m CD)
2.9 10 4 1.9 2.5
12 4 1.9 2.6 Highest Tide +0.5m (2.9mCD)
3.5 10 15 2.3 2.9
12 15 2.3 3.0 Note: 1. seabed at -0.6m CD
4.2.4 Breakwater materials
Local rock is available of the sizes required to resist wave attack, but generally it is not suitable for wave protection. The existing breakwater was constructed from local limestone but has been assessed as not being robust enough in the long term. (Nevertheless rock resistance and strength testing is being conducted on a new source of local rock to ascertain its suitability.) For the purpose of this report it is assumed that rock on the seaward face will need to be imported from out of the region but that rock on the crest, leeward side and core could be local rock.
A suitable source of rock has been identified in Tauranga and Taranaki (although this rock is of a lesser strength than the Tauranga rock). Because of the relatively high cost of importing the rock, another option would be to make up concrete cubes as armour. A colour oxide could be added to make the cubes more in keeping with the coastal environment. Table 4.4 lists the rock requirements for these two options for the design waves described in Section 4.2.3.
If the area were to experience higher waves such that could be generated with a water level of 2.9m CD (see Table 4.3) then the breakwater would experience damage but not failure.
A typical section of the breakwater wall is shown in Figure 4.1 for the rock armour option, both for the new breakwater and for the seaward side of the existing breakwater. A crest detail, comprising a Reno mattress overlain by 100mm of chip stone is recommended as a pedestrian walkway. This could be replaced by a more permanent surface such as reinforced concrete but it may be damaged by the wave up-rush from storm events.
As the seabed compromises soft rock no scour is expected. The toe of the wall will need to be keyed into the seabed to keep the armour intact.
A footprint of the breakwater is shown in Figure 4.2 and would occupy an area of some 3500 m2 over a length of 140m. Upgrading the existing seawall would have a footprint of 900 m2 over a length of 80m.
3120511/100 Beca Page 13 L3:20249-SLP84R03.DOC Rev B 16 April 2008

3120511
Figure 4.1 Breakwater Cross Sections
4.0m
crest width
Reno mattress with surface chip
Seaward armour 1.0m dia – 1.9m thick layer
Key detail Existing concrete rubble
Existing limestone boulders
3.5m CD
3
1
2.8m CD
~0.4m CD
Section through existing Seawall
3
1
MHWS 1.8m
4.0m
crest width
Crest 3.5m CD
Reno mattress with surface chip
Seaward armour 1.1m dia – 2.0m thick layer
Leeward armour 1.25m dia – 2.3m thick layer
21
Section through new Breakwater
~ -0.6m CD
Key detail
Core 0.450m dia
2.3m CD New beach

3120511
Figure 4.2 Breakwater Layout
Seaw
ard
arm
our
Publ
ic w
alkw
ay
Exi
stin
g se
awal
l
Leew
ard
arm
our
N
Scal
e 1:
1000
0
10
20
3
0
40
5
0

Whakarire Ave Breakwater
Table 4.4: Armour Sizes
Armour Type Location Weight (tonne) Dia. (m) Thickness (m) Imported Rock Seaward face 1.8 1.1 2.0 Local Rock Leeward face 1.9 1.25 2.3 Concrete Cubes Seaward face 1.0 0.75 1.6 Note: 1. Seabed at -0.6m CD 2. Design significant wave height of 2m 3. Imported armour has SG of 2.65, local armour 2.25, concrete 2.4. 4. Two layers of armour required. 5. Head structure rock size to increase by 10%.
4.2.5 Beach Creation
The main factors which dictate the design of a sheltered embayment beach are:
Predominate incident wave directions
Structural controls on embayment at either end
Composition of the imported sand
With the proposed beach, the incident waves will be relatively unidirectional because of the sheltering effects of the Port of Napier and the offshore reef which strongly refracts waves. From the wave studies conducted by MetOcean Solution, the incident wave will approach the proposed breakwater at 20 to 25o true north. For design purposes an incident wave with a direction of 22.5o will be assumed.
The structural controls will comprise the head of the breakwater and the southern end of Westshore Beach. Because of its full height, relative to all water levels, the breakwater will diffract waves strongly into the sheltered area. The creation of a beach will refract waves into this area as well. This results in waves approaching the beach in such a way to create a half moon bay. A control at Westshore Beach has to be assumed and will rely on the continued nourishment of this area. There is however a relative strong structural control created by a number of large concrete blocks located on the foreshore about 100m from the start of the beach.
The composition of the imported sand will dictate the slope of the foreshore which in turn affects the beach’s ability to ‘fit within’ the sheltered area. As discussed in Section 4.1.2 other local beaches in sheltered areas have foreshore gradients in the order of 1:20. This gradient is generally steeper than other foreshore slopes for the same sediment grain size which probably reflects the sheltered nature of the nearby beaches. Therefore based on the data from these local beaches, for a median grain size of 0.15 to 0.17mm, the design foreshore slope of 1:25 will be adopted. The surface sediments on the beach should be the coarsest sand available. A recreational beach needs a dry beach berm. This enables an area of ‘reserve’ for the beach to combat storms but also for people to be able to use the beach for active and passive recreation. It is recommended that the beach berm be 0.5m above MHWS (i.e. 2.3m above CD) to be effective.
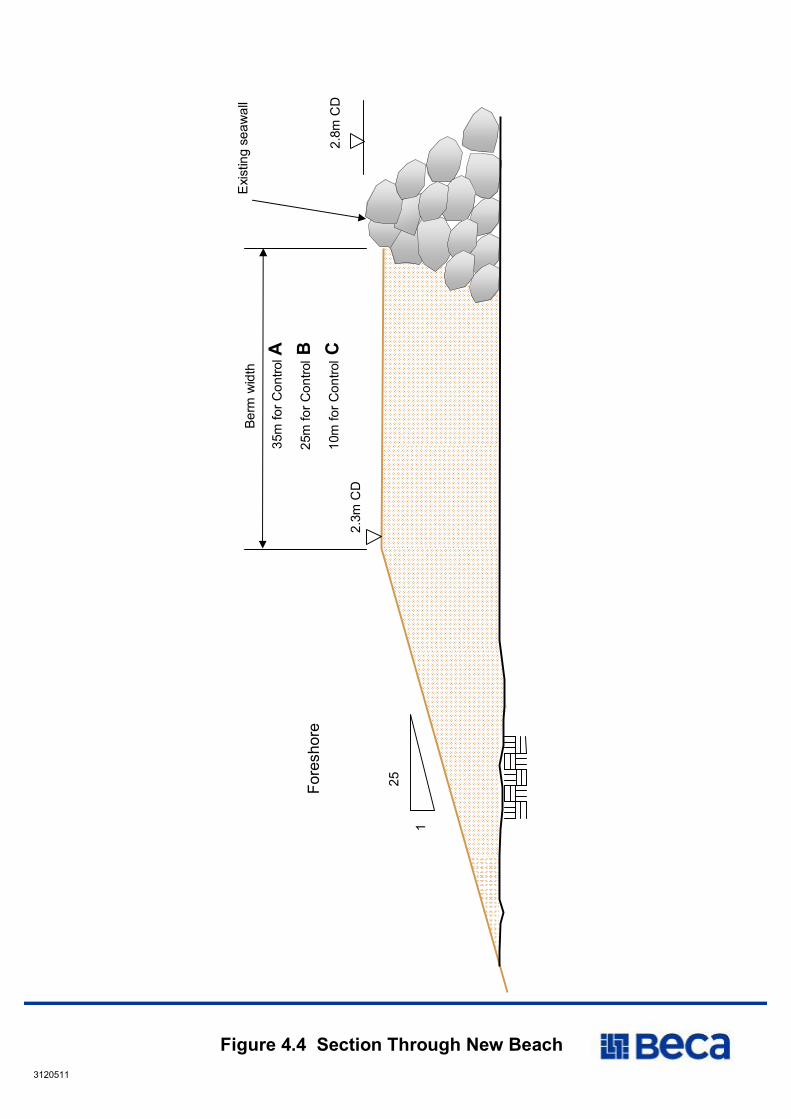
Based on the approach of Silvester and Hsu (1991), for crenulated shaped bays, a beach as shown in Figure 4.3 could be developed. A typical section though the beach is also shown in Figure 4.4. If the beach control point remains at the location of the existing concrete blocks a wide beach berm would be created, covering an area of 9500 m2, and requiring about 17,500m3
3120511/100 Beca Page 14 L3:20249-SLP84R03.DOC Rev B 16 April 2008

3120511
Figure 4.3 New Beach Layout
Predominant wave direction 22.5°
Wes
tsho
reB
each
B
A
C
NN
ew b
reak
wat
er
Bea
ch b
erm
with
con
trol
atA
Bea
ch b
erm
with
con
trol
atB
Bea
ch b
erm
with
con
trol
atC
Scal
e 1:
1000
0
10
20
3
0
40
5
0
3120511
Figure 4.4 Section Through New Beach
Exi
stin
g se
awal
l
25
1
Fore
shor
e
Berm
wid
th
35m
for C
ontro
l A25
m fo
r Con
trolB
10m
for C
ontro
lC2.
3m C
D2.
8m C
D

Whakarire Ave Breakwater
of sand fill. Even if, due to wave conditions on Westshore Beach, the control point moved eastwards the new beach should remain within the leeward side of the breakwater.
4.2.6 Area inside the existing Breakwater
The area inside the existing breakwater is low lying and subject to tidal inundation. Adjacent to this area is a Napier City Council reserve which has poor public access. There are 2 options available for this area:
Leave as is and allow the tide to flow in through the existing breakwater on the northern side. It is noted that this area is slowing filling and will continue to do so as overtopping waves wash into this area.
Fill the area and create land for a specific land use such as public reserve. It would require about 9000 m3 of material for this purpose. It would also need to be drained, receive any excess runoff from existing properties and reserve, and have a stormwater discharge to the coastal marine area. This reclamation would occupy an area of 4000m2.
Napier City Council will decide on the preferred option for this area.
5 Assessment of Environmental Effects.
5.1 Construction
Elements of this project include:
Refacing of existing breakwater (some 80m long) and building a new breakwater (some 140m long)
Formation of a new beach using imported sand
Either infilling of the existing area behind breakwater or leaving as is.
Refacing the existing breakwater and building the new breakwater will require the importing of 4500 m3 of hard rock from outside of the region (or concrete cubes) and 5000 m3 of local rock. All the rock would be obtained from commercial sources which already have resource consent for rock removal.
The hard rock will probably be barged to the Port of Napier or the Ahuriri Harbour and offloaded into trucks and delivered to site. When the barge is in port the offloading could be quite intense and there may be 4 truck and trailer units an hour over 1 or 2 days delivering to the site. This would probably occur for 10 barge visits but will depend on the size of the barge. The delivery and placing of local rock will be more evenly spread, probably requiring the delivery of rock by 2 truck units per hour. The contractor will probably create an access track below the crest of the seawall which will enable turning bays to be created while spreading the rock in a seaward direction. When the seawall head is completed, the contractor would then build the seawall to the final height on the return. The contractor may also stockpile rock adjacent to the intersection of the existing and new seawalls. This could form a convenient passing and turning area. On completion all extraneous material would be removed from the seabed.
The rock armour and core material should not contain much fine material and so dust production should not be a nuisance. There should be no need for the use of silt fences.
3120511/100 Beca Page 15 L3:20249-SLP84R03.DOC Rev B 16 April 2008

Whakarire Ave Breakwater
The moving and placing of rock will cause some noise but will generally be within the requirements of NZS 6803:1999 Acoustic–Construction Noise.
The sand will most likely be sourced from the outer area of the Ahuriri Entrance or the nearshore. The ideal delivery would be by cutter suction dredge although a backhoe dredge and barge could equally do the work. The material is fine and there will be some sediment runoff back to the sea. Use of silt curtains could reduce the silt runoff but would also interfere with the placement operation. It would be preferred to start off the beach creation without a silt fence, but if the silt runoff is significant to then install them.
All the construction effects are temporary and local. The construction period is likely to be in the order of 5 months. Residents who may be affected by the construction effects will be the main beneficiaries of the new breakwater and beach.
5.2 Coastal Processes
The new breakwater has been designed to improve the coastal processes and substantially reduce the risk of coastal erosion to the properties on Whakarire Ave.
At present incoming waves focus on the nearshore reef just north of Whakarire Ave. These waves then propagate along the existing seawall and concentrate wave energy on the southern end of Westshore Beach. This has created a narrow beach width (up to James Street) and has caused problems with rapid loss of sediment imported for the beach nourishment scheme.
The new breakwater will dissipate some of this wave energy and spread it to the west. It has been optimised in length to improve shelter to Westshore Beach. The sheltered area leeward of the breakwater results in a more gradual spread of wave energy from the start of Westshore Beach. The area of influence of the new breakwater will extend some 150m along Westshore Beach. This has the benefit of allowing the southern end of Westshore Beach to act as a better feeder area for the beach nourishment scheme. It also enables a new recreational beach to be formed in the lee of the breakwater which will be beneficial to the coastal processes as it acts as a buffer between the nearshore and the properties on Whakarire Ave.
The new breakwater and extension of the existing seawall will occupy an area of 4400 m2 of the CMA, the recreational beach will occupy 9500 m2 of the CMA and the area in behind the existing seawall will occupy an area of 4000 m2 of the CMA if it were filled in.
5.3 Surfing Conditions
Details of the effects on surfing are covered in MetOcean Solutions Report (2008). The breakwater has been reconfigured to minimise the effect on surfing conditions. This has resulted in the breakwater having a V-shape and a seaward slope of 1:3 to promote less wave reflection.
By attempting to replicate the existing wave conditions seaward of the breakwater and minimise wave reflection, quiescent areas should not be formed that would promote sedimentation on the seaward side.
5.4 Other Factors
Both the new breakwater and beach will have amenity value as it will allow better public access to the CMA and allow the community to use a safe sandy beach for active and passive recreation. It will also provide for better linkage along the coastal margin as at present the existing reserve is difficult to pass through.
3120511/100 Beca Page 16 L3:20249-SLP84R03.DOC Rev B 16 April 2008
Whakarire Ave Breakwater
6 Conclusions
Through a number of historical events, both natural and anthropogenic, the coastline at Whakarire Ave and the southern end of Westshore Beach is out of equilibrium due to a lack of sediment supply to it. This has resulted in an erosion potential for the properties on Whakarire Ave and for the need to have on-going nourishment of Westshore Beach.
Remedial options to address the potential coastal erosion issues at Whakarire Ave were investigated in 2003. Five options were assessed and following public feedback a new breakwater extending off the existing headland and more or less parallel to Westshore Beach was proposed. See Figure 3.5.
In 2007 a range of options were investigated to allow better access onto Westshore Beach and to improve the beach nourishment scheme. It was found that regrading the beach may only provide temporary improvement for beach access and that an offshore island may reduce the wave climate at the southern end of the beach which could then act as a better feeder area for the beach nourishment scheme.
In 2007/08 the effects of the breakwater and the offshore island on surfing conditions were investigated by MetOcean Solutions. This detailed wave study concluded that the breakwater would need to have low reflectivity and be V-shaped to minimise the effect on surfing conditions. These refinements are now incorporated into the preferred layout. See Figure 4.2.
An important outcome of the wave study was that it confirmed that the natural reef focussed the waves into the southern end of Westshore Beach, causing a rapid spread of wave energy in this location. It was found that the breakwater afforded a significant sheltered area in the lee of the breakwater and to the southern 100m of Westshore Beach, providing a more gradual spread of wave energy in this location. Based on this outcome it is concluded that the offshore island is not required as the breakwater can provide similar results and will assist in allowing the beach to act as a better feeder area for the beach nourishment scheme.
Environmental effects of the proposed breakwater are mainly beneficial:
Properties in Whakarire Ave will be protected
Westshore Beach will act as a better feeder area for the beach nourishment scheme
No littoral drift will be interrupted by the breakwater
A new recreational beach will provide amenity value to the community
Public access to and along the CMA will be improved Adverse effects are considered to be minor and manageable:
Construction activities
Surfing conditions
Footprint of structures, beach creation and potential reclamation
In making the above assessment, effects on ecology, heritage, visual and natural character, and iwi have not been considered.
3120511/100 Beca Page 17 L3:20249-SLP84R03.DOC Rev B 16 April 2008

Whakarire Ave Breakwater
7 References
ASR (2001) “Westshore Coastal Process Investigation” for Napier City Council.
Beca (2003) “Remedial Work to Counter Erosion at Westshore, Napier” for Napier City Council.
Beca (2007) “Westshore Beach Regrading” to Napier City Council.
CIRIA/CUR (1991) Manual on the use of rock in coastal and shoreline engineering, CIRIA Special Publication 83, CUR Report 154.
Gibb J (2003) “Review of the Westshore Nourishment Scheme – Napier City”, for Napier City Council by Coastal Management Consultancy, , Ref: CR 2002/6
Gibb J (2002) “Review of the 1996 Coastal Hazard zone between Ahuriri Entrance and Esk River Mouth” for Napier City Council.
Gibb J (1996) “Entrance and Esk River Mouth” for Napier City Council by Coastal Management Consultancy, Ref: C.R 96/2.
Goda Y (1985) “Random Seas and Design of Maritime Structures” University of Tokyo Press.
Gorman R M, Bryan K R, Laing A K (2003) “A wave hindcast for the New Zealand region – Deepwater wave climate”. New Zealand Journal of Marine and Freshwater Research.
Komar PD (2005) “Hawke’s Bay, New Zealand: Environmental Change, Shoreline Erosion and Management Issues” for Hawke’s Bay Regional Council.
Koutsos P T (1999) “Westshore Coastal Protection, Evaluation of Public Submissions” for Napier City Council. LINZ (2008) “Tide Tables for Standard Ports”. MfE (2004) “A Changing Climate”. Owen MW (1980) “Design of Seawalls allowing for wave overtopping” Report EX924, HR Wallingford, UK. Silvester R, Hsu (1991) “Coastal Stabilisation”
Tonkin and Taylor (2004) “Regional Coastal Hazard Assessment” for Hawke’s Bay Regional Council.
UK Environmental Agency (1999) “Overtopping of Seawalls – Design and Assessment Manual”, Technical Report W178.
Worley (2002) “Port of Napier: Shoreline Effects of Stage 1 and Ultimate Development” for Port of Napier.
Worley (2004) “Wave Data Report” for Port of Napier.
3120511/100 Beca Page 18 L3:20249-SLP84R03.DOC Rev B 16 April 2008

Beca // 16 April 2008 // Page 1
3120511/100 //L3:21258-SLP84R03.DOC Rev B
Appendix A
Sediment Gradings: Local Beaches & Ahuriri Entrance


