data management and geotechnical models
TRANSCRIPT

Deep Mining 2017: Eighth International Conference on Deep and High Stress Mining – J Wesseloo (ed.) © 2017 Australian Centre for Geomechanics, Perth, ISBN 978-0-9924810-6-3
Deep Mining 2017, Perth, Australia 461
Data management and geotechnical models
ECF Hamman AngloGold Ashanti Australia Ltd, Australia
DJ du Plooy AngloGold Ashanti Australia Ltd, Australia
JM Seery AngloGold Ashanti Australia Ltd, Australia
Abstract
Shareholder value is driven by how well we, as the mining industry, can design, plan and mine. Well established reconciliation processes and reporting standards are utilised to ensure that the actual mining activities and the different planning cycles are effective and efficient for the specific life-of-mine plan. Its success is driven by the robustness of the specifications set out in the design. From a geotechnical perspective this means that there is a good understanding on how the different identified mechanisms can be controlled in a specific design option. In order to successfully control the mechanisms, an understanding of what drives the potential failure mechanisms and what can be considered as realistic amelioration options is required. This presents the geotechnical engineers with several challenges:
How confident can they be in their knowledge of the rock mass and understanding on how it will react to the loading conditions imposed during mining?
How reliable is the data available and what assumptions will have to be made during design?
How effectively and efficiently can the available information be assessed and evaluated?
How can geotechnical engineering move from simply providing design guidance, to becoming an integral part of optimising the business through a risk-benefit approach?
The solution begins with having reliable data. Geotechnical data is not very complex, however, the availability of suitable and accurate data, and quantum of data, drives the number of assumptions within a geotechnical design and thus the complexity thereof. One of the key challenges facing geotechnical engineers is the various forms and quality of geotechnical data available at operations and projects, in particular the more mature ones. The inherent uncertainty surrounding the data impacts how it can be evaluated and assessed. Assuming that the data is reliable, the geotechnical engineer faces a further challenge to complete a repeatable and auditable design. This starts with the processes and software used to evaluate and assess the data.
This paper deals with the building blocks leading up to the actual design, discussing frameworks to obtain reliable data and to assess the data. Ultimately, the authors aim to provide the reader with an insight into the frameworks being implemented in AngloGold Ashanti’s International Operations, which allow the practitioners to:
Ensure that their data is reliable.
Formalise a repeatable and auditable process to evaluate and assess their data.
Use the reliable data and processes to assess their design options and risks.
Keywords: data management, reliability, visualisation, rock mass model
1 Introduction
The modern day mining company needs to provide banks, shareholders and insurers with guarantees that the promised return on their investment will be realised. This demands that the company identifies hazards that can impact production, assess the associated risks and introduce controls to manage the risks.
doi:10.36487/ACG_rep/1704_33.2_Hamman

Data management and geotechnical models ECF Hamman et al.
462 Deep Mining 2017, Perth, Australia
The geotechnical engineer is tasked to manage the biggest risk on the mine; that of a rock mass failure. Since a failure, or collapse, need not be large to have a significant impact on production, the challenge is to develop an optimised life-of-mine design with a risk management plan that suits the risk appetite of the mining company and investors.
In order to fully optimise a geotechnical design and mine plan that incorporates risk, the geotechnical engineer needs to follow a systematic design process, where the boundaries with management, geology and mine planning are not blurred by excessive assumptions, missing processes or unclear accountabilities. This requires a robust structure or system, and in such a system the foundation is always reliable data.
Reliable data allows the engineer to develop an understanding of how the rock mass will react when a specific excavation geometry and extraction sequence is mined. It implies a detailed understanding on what drives the potential failure mechanisms, which mechanisms need to be controlled, and how it can be controlled to optimise extraction.
This requires reliable data to describe the rock mass and controls, a comprehensive awareness of the uncertainties, a means to evaluate the data and using suitable analytical approaches to assess the rock mass response to mining. It also requires an appreciation of the cost, limitations, practicality and performance of the amelioration options to be utilised in the optimised design.
Ultimately, shareholder value is driven by the certainty of the geotechnical design, the robustness of the mine plan and the efficient and effective implementation of the plan during operations.
2 Preamble definitions
In design conversations words like uncertainty, reliability, probability, risk and confidence are used interchangeably when talking about the actual design or the data. The following definitions have been added to help the practitioner differentiate between them:
Uncertainty: In essence it is not knowing what will happen next with confidence, and not knowing what the possible distribution looks like. Lilly (2000) expanded on the types of uncertainty originally defined by McMahon (1978):
○ Type 1 – ‘unknown unknown’ – Sullivan (2006) paraphrased Stapledon on the concept: “We only see what we know”. The majority of these types of uncertainties are from geological, hydrogeological or hydrological origin. The main contributor, geological uncertainty, embraces the unpredictability associated with the identification, geometry of and relationships between the different lithologies and structures that constitute the geological and structural models (Chapter 8, Read & Stacey 2009). For example, a weak plane not observed in a drilling program.
○ Type 2 – ‘model uncertainty’ – Model uncertainty accounts for the unpredictability that surrounds the selection process of parameters and the different types of analyses used to formulate the slope design and estimate the reliability of the pit walls. Model uncertainty exists if there is a possibility of obtaining an incorrect result even if exact values are available for all the model parameters (Chapter 8, Read & Stacey 2009). The uncertainty or variability (coefficient of variation) of the output is directly dependent on the uncertainty of the inputs (Wiles 2006):
222222
NumericalPropertiesModelGeologyGeometryOutput CCCCCCC f (1)
where:
COutput = coefficient of variation of combined inputs.
CGeometry = geometry (approximation of actual mining shapes, 2D, 3D).
CGeometry = geometry (approximation of actual mining shapes, 2D, 3D).

Keynote addresses
Deep Mining 2017, Perth, Australia 463
CGeology = geology (lithology).
Cσf = pre-mining stress state (magnitude, stress ratios, orientation).
CModel = constitutive model type (elastic, plastic, fault slip).
CProperties = material properties (strength, stiffness).
CNumerical = numerical approximation (element sizes).
Each of these needs to be characterised and appropriate numerical values selected. Examples include shear strength values being over-estimated, groundwater pressures in a slope ignored or 2D model results used without cognisance of the complex 3D geometry.
○ Type 3 – ‘bias-variation’ – The unpredictability of the properties used to account for the various attributes of the geotechnical model. Typically, it includes uncertainties associated with the values adopted for rock mass and hydrogeological model parameters such as the friction angle, cohesion, deformation moduli and pore pressures (Chapter 8, Read & Stacey 2009). This leads to greater variation in the estimated design parameters. For example, the mean shear strength of a clay (e.g. friction = 10° and cohesion = 20kPa) does not account for a significant proportion of the material that has much less cohesion due to pre-existing movement on laminations.
○ Type 4 – ‘human factor’ – All aspects of the engineering design process relies on human input. This uncertainty includes issues related to training, competency, communication and staffing resources. The adoption of standardised tools and behaviours is a very effective strategy in enhancing teamwork and reducing risk. The most common human errors are related to calculations or data input. An example of this is the Aberfan disaster, which was described by the tribunal chairman Edmund Davies (1967), as “…a terrifying tale of bungling ineptitude by many men charged with tasks for which they were totally unfitted, of failure to heed clear warnings, and of total lack of direction from above.”
○ Type 5 – ‘design change’ – Each year mine designs and plans are re-assessed to cater for changes in the resources and reserves. The acceptance of a design is based on the level of reliability and all the economical, safety, environmental and social risk factors. Thus, this uncertainty relates to any change of a design without reference to geotechnical conditions and/or implications, such as the change in extraction sequence to fit financial parameters.
○ Type 6 – ‘excessive conservatism’ – In the design process, there are certain design assumptions to be defined, input parameters to be selected, and analysis interpretations to be made. All these require human intervention by the engineer. Often these decisions are made by the engineer, applying a conservative approach with each step of the process. The extent of conservatism is a function of experience.
Risk: Sullivan (2006) addresses the concept of risk in terms of both chance of occurrence (likelihood) and consequence, where:
Risk = Chance of Occurrence × Consequence (2)
Risk implies a vision of the future about the likely course of events. Hence, risk in mining means some knowledge or experience that would lead to an understanding of both the chance of occurrence and consequences of a particular result (or results). Essentially, not knowing what will happen next, but knowing what the distribution looks like.
Reliability (data): The accuracy and completeness of all collected and/or processed data, with cognisance of the intended uses. In a data confidence context (as defined in Chapter 8, Read & Stacey 2009), reliability means that data populations are complete for the geotechnical level status (or project status level), that they are accurate and properly address the uncertainties for the intended purposes, and from a data base security perspective, are not subject to inappropriate adjustments.

Data management and geotechnical models ECF Hamman et al.
464 Deep Mining 2017, Perth, Australia
Reliability (design): In engineering terms, a specific design will represent a system (overall orebody extraction) or a component (pillar or stope) thereof. Reliability is the probabilistic assessment of the likelihood of the adequate performance of a system (or its components) for a specific period of time under proposed operating conditions (Harr 1996). As such, the probability of the success of a design is its reliability:
1 fpR (3)
where:
R = reliability.
p(ƒ) = probability of failure.
Note that reliable data does not constitute a reliable design, and vice versa.
Confidence: This is usually expressed as a confidence level, which in turn is the probability value associated with a confidence interval. A confidence interval gives an estimated range of values, which is likely to include an unknown population parameter, the estimated range being calculated from a given set of sample data. For example, given a distribution of point load data (Figure 1), for a confidence level of 95%, the expected value will be within a confidence interval of 9.90<E[x]<10.10. The higher the confidence level the larger the confidence interval.
Figure 1 Confidence level and confidence interval for the expected value
3 Reliable geotechnical data in context
All data follows a process flow, starting with collection and ending with a data package used during evaluations. In order for data to be considered reliable, four key requirements have to be met:
Collected to a standard, preferably industry standards (e.g. International Society for Rock Mechanics).
Readily available and not corrupted.
All fields completed and up-to-date.
Properties and descriptors collected correctly.
These requirements are the same for any type of data, however, the actual fields and what is considered accurate for the properties and descriptors will change depending on the type of data, i.e. core logging, face mapping, laboratory testing, monitoring, ground support QA/QC to name a few.
The processes that have been implemented for AngloGold Ashanti’s International Operations to achieve these requirements, follows a process flow as illustrated in Figure 2. The detail of each step will be further expanded using an example in the following subsections.

Keynote addresses
Deep Mining 2017, Perth, Australia 465
Figure 2 Data management process flow
3.1 Data collection standards
Consider a core logging program at a project where the geologists were given training in geotechnical logging, as per their company’s logging standard, and given the task to log all the core.
The International Society for Rock Mechanics (ISRM) suggested methods (Ulusay & Hudson 2007, 2016) provides a comprehensive basis for such a standard. Consideration should be given to the physical means for how the data will be obtained, such as physical core log or Acoustic Televiewer (ATV). This will in turn dictate what data can be collected and how it can be collected. A good standard will incorporate all project requirements, equipment limitations, supplier specifications and accountabilities, and will address integration with existing company standards and systems.
The data being collected can be written down on paper, captured in some rudimentary electronic form using a mobile device, or using a networked device with a template set up for geotechnical data capture. The latter will not always be available and postponing data capture will only lead to lost information. Similarly, paper-based entry will present unique problems and errors, including misplaced logging sheets, incorrectly interpreted codes or values, and no constraints such as pre-determined codes or fence-sitting assignment of codes.
The key is to have a robust and documented standard in place and start collecting data with constraints and validation, thus capturing the majority of the problems before the erroneous data is committed to the database.
3.2 Securing data
It is costly to collect any type of data and for many geotechnical parameters there is only a single opportunity to do so. Therefore, once the data has been collected it needs to be secured to ensure that it is not lost or adjusted. Paper prints, Excel files, and even Access databases are not considered secure data repositories. It is easy to lose or inadvertently adjust data through editing and transferring from one location/person to the next. It is equally as easy to delete electronic files without record of the reasons.
There are several database products available, both proprietary and open source. Using the same database product as geologists will provide some redundancy, providing that there are skills and permissions in the company to access the back-end of the database. Remember that it is the company’s data and it needs to be readily available and transferable to the different software packages, without limitations. Based on these considerations, the authors opted for an open source solution that allowed live changes to the database framework during the development phase of the main geotechnical database.
Data can be effectively secured in a Structured Query Language (SQL) server-based database, where it is possible to set up different levels of permissions for access. Any database administrator will be able to set up data tables and queries, under guidance from the practitioner, in such a secure SQL server. In order to facilitate the transfer of information from other sources the database tables and field data collection should follow similar layouts. This will not always be the case with legacy data, which will require extra resources to transfer.
The key here is to secure the data, with a system that can log changes made to the database structure and contents.
3.3 Automated data reliability checks
Once data is secured into a SQL database it is possible to compile and run procedural queries to validate conformance (or otherwise) to data quality standards. Keep in mind that there are several areas where the
Data Collection
Data Secured
Data Reporting
Data Validation
Data Package

Data management and geotechnical models ECF Hamman et al.
466 Deep Mining 2017, Perth, Australia
practitioner can enter the wrong data, make input errors, or simply neglect to fill in the data. Typically these validation checks will automatically run in an electronic data logging template with built-in error checks at the time of data collection. For legacy data, however, a significant amount of time may have passed between data collection and use in further evaluations. The validation checks can still be undertaken, however, the remedial actions may require a lot more engineering judgement to rectify conformance issues.
In order to assess data reliability from a quality control perspective, data records are assessed for completeness and accuracy.
3.3.1 Completeness
Completeness is the extent that the relevant records are present and populated appropriately in the database, and that the data reflects the variable field conditions that will be encountered during mining. This is therefore a two-fold process.
First, it deals with the actual database and database management; the latter an aspect that needs to become more prevalent in the geotechnical environment. Here completeness refers to whether the database caters for all the data to be collected, that the records are all present and have been entered correctly.
Second, it deals with how well the data is distributed in the rock mass and how representative it is of the different geotechnical environments. For this level of completeness, spatial distribution is equally as important as the level of confidence in the data. This aspect is interpretive and dealt with later in the paper, however, there are certain automated outputs that aid in the interpretation.
3.3.2 Accuracy
Accuracy is the degree that recorded data are consistent, and reflects the actual underlying information.
There are numerous data sources, each gathered through unique methods that may rely on some degree of interpretation (e.g. field and logging data), while others are more rigorous in the process applied to obtain the data (e.g. laboratory testing).
Consider, for example, the collection of the joint roughness or orientation properties. It is unlikely that this type of data will be 100% consistent for different practitioners, even if re-obtained by the same person. Although consistency is required to acquire and use clear and well defined data that yields similar results in similar analyses, it should be recognised there will always be a degree of variability in interpretive data collection. As such, routine ground truthing and experience are essential to ensure the accuracy of interpretive data.
Now, consider the UCS test results for a batch of samples. Unless samples that failed on structure and from unreliable axial splitting are removed, the data will not reflect the true UCS of the rock type. Furthermore, the testing methods employed to obtain the data need to be as per the ISRM suggested methods (Ulusay & Hudson 2007, 2016). Even though a recognised, rigorous routine is used to obtain the data, it does not mean that the data will reflect reality. In this case the regular calibration of instruments and test equipment, and routine QA/QC are crucial processes to ensure the accuracy of laboratory data. The same applies to field data collection and stability and groundwater monitoring.
The key here is to ensure all data records are complete and all data fields are accurate.
3.4 Interpretive data reliability checks
The interpretive validation checks of data requires a good understanding of the different data collection methods, empirical relations and knowledge on data from similar rock masses. The authors find that this work is to be done by an experienced engineer, and is best explained through a few examples.

Keynote addresses
Deep Mining 2017, Perth, Australia 467
3.4.1 Validation report
The first report prepared upon commitment of geotechnical logging data to the database is the validation report. The purpose of this report is to highlight errors in the principles of the geotechnical logging data. Key checks include:
Problematic depth values (i.e. exceeding borehole total depth, non-consecutive intervals).
Missing logging data (i.e. lithology, weathering and strength).
Incorrectly logged codes.
Principles of measurement for rock quality designation (RQD) (i.e. RQD is not greater than 100%, or pieces not logged less than 10 centimetres).
The advent of advanced data entry objects has meant that the majority of these validation issues can be captured in the field at the time of logging, so this report has proven more beneficial in the processing of legacy logging information, where a quick report can be produced for the determination of actions to improve the quality of the geotechnical data.
Figure 3 presents a typical text-based output of the validation report.
Figure 3 Text-based output of the validation
3.4.2 Stereoplots
Structural information can be considered as a critical input into stability analyses for hard rock mines, as has been presented in numerous textbooks. Stereoplots are generated for each borehole, with an orientation bias zone overlain to assist in the assessment of potential missing information. This follows the overlay principles set out by Fowler (2013). Whilst that reference recommends 15°, the example below overlays a 20° blind zone (Figure 4). In this example the stereoplots have been compiled using Rocscience Dips software (RocScience Inc. 2016).
--------------------------------------------------------------------------------AGA Geotechnical Logging Validation CheckUndertaken on dataset/borehole: Dempers Logging/ACDD0001 - 260.2m depth--------------------------------------------------------------------------------Check that geotechnical logging does not exceed borehole TotalDepth.Geotechnical logging does not extend past borehole TotalDepth.--------------------------------------------------------------------------------Check for non-consecutive intervals.ACDD0001; 131.3; 134.4--------------------------------------------------------------------------------Check for intervals not logged for rock type.ACDD0001; 8; 9.5; NULLACDD0001; 12.5; 14; NULL--------------------------------------------------------------------------------Check for intervals not logged for weathering.ACDD0001; 0; 2; NULLACDD0001; 2; 2.9; NULL--------------------------------------------------------------------------------Check for weathering codes incorrectly logged.All weathering codes correctly logged.--------------------------------------------------------------------------------Check for intervals not logged for hardness.ACDD0001; 40.7; 43.6; 0--------------------------------------------------------------------------------Check for hardness codes incorrectly logged.All hardness codes correctly logged.--------------------------------------------------------------------------------Check for T1_30, T2_60 and T3_90 values incorrectly logged.T1_30, T2_60 and T3_90 values correctly logged.--------------------------------------------------------------------------------
Check RQD meets the principle of RQD measurement.ACDD0001; 46.6; 49.5; RQD percent is greater than 100%.ACDD0001; 64.7; 66.6; RQD percent is greater than 100%.--------------------------------------------------------------------------------Check sets are correctly logged.All sets are correctly logged.--------------------------------------------------------------------------------Check micro-roughness codes are correctly logged.All micro-roughness codes are correctly logged.--------------------------------------------------------------------------------Check macro-roughness codes are correctly logged.All macro-roughness codes are correctly logged.--------------------------------------------------------------------------------Check infilling codes are correctly logged.All infilling codes are correctly logged.--------------------------------------------------------------------------------Check defect alteration codes are correctly logged.All defect alteration codes are correctly logged.--------------------------------------------------------------------------------Check matrix zones (partial intervals) are logged within intervals.All matrix zones (partial intervals) are logged within intervals.--------------------------------------------------------------------------------Check matrix types (partial intervals) are correctly logged.All matrix types (partial intervals) are correctly logged.--------------------------------------------------------------------------------Check matrix types (whole intervals) are correctly logged.All matrix types (whole intervals) are correctly logged.--------------------------------------------------------------------------------Validation checks completed.--------------------------------------------------------------------------------

Data management and geotechnical models ECF Hamman et al.
468 Deep Mining 2017, Perth, Australia
Figure 4 Stereoplots to assess orientation bias

Keynote addresses
Deep Mining 2017, Perth, Australia 469
3.4.3 RQD versus spacing
The RQD spacing chart is a comparison of the as-logged, or calculated, RQD and estimated defect spacing (using logged defect quantity) for an interval. It formalises the block size component of the Rock Mass Rating system (Bieniawski 1989). A modified version of Chart D from Bieniawski (1989) is spatially registered for use in the QGIS software (QGIS, 2017) and the logging data is imported as CSV files, or directly accessed through a connection to the SQL database. The example in Figure 5 follows the principles as set out by Duran (2015), where interval data can be referenced in the context of the empirical relationship of Bieniawski (1989).
Figure 5 RQD spacing chart
3.4.4 Histograms
A histogram is still one of the most effective means to assess property distributions, identify outliers and demarcate populations. Histograms are prepared as data tables within the SQL database and then served to a Microsoft SQL Server Reporting Services web page. An example is provided in Figure 6 for the input characteristics and output calculations for RMR89 (Rock Mass Rating after Bieinawski, 1989) and GSI (Geological Strength Index).
0
50
100
10 100 2000 600 200 20 30 40 60

Data management and geotechnical models ECF Hamman et al.
470 Deep Mining 2017, Perth, Australia
Figure 6 Histograms of input characteristics and output calculations for RMR89 and GSI
3.4.5 Cai GSI graph
Cai et al. (2004) proposed a numerical methodology for the comparison of spacing and the joint condition rating. Once again this follows the principles of Duran (2016), where interval data can be referenced in the context for the graphical framework presented in Cai et al. (2004). The example (Figure 7) highlights one of the features of the QGIS software, in the presentation of a heat map as an underlay to the point data, to allow assessment of density or clustering of data points.

Keynote addresses
Deep Mining 2017, Perth, Australia 471
Figure 7 Cai GSI chart with clustering of data points
3.4.6 Q’-factor graph
In a similar manner, as highlighted in Duran (2016), whereby the axes of the GSI graphs are related to numerical equivalents of block size and joint conditions, a Q-factor graph has been graphically referenced, with block size represented by the ratio of RQD/Jn on the y-axis and the ratio of Jr/Ja on the x-axis, allowing for analysis of the distribution of Q Prime (Q’). Figure 8 presents an example of this graph. Reference should be made to Norwegian Geotechnical Institute (2015) for a description of terms used.

Data management and geotechnical models ECF Hamman et al.
472 Deep Mining 2017, Perth, Australia
Figure 8 Q’-factor analysis graph
3.4.7 Borehole log
A borehole geotechnical log is compiled to assess the distribution of as-logged input parameters to the various rock mass classification schemes, as well as the output calculated values, and can be put into the context of lithology or structural information. The primary purpose of this log is to assist in the identification of geotechnical domains and patterns of geomechanical characteristics. An example borehole log (Figure 9), created using Advanced Logic Technologies WellCAD software, is presented below for the presentation of RMR89 and GSI.

Keynote addresses
Deep Mining 2017, Perth, Australia 473
Figure 9 Example of borehole log created using WellCAD
3.4.8 Summary
The main benefits of using a combination of Microsoft SQL Server database, Reporting Services, ALT WellCAD and open source QGIS software includes:
Increasing accessibility to critical geotechnical data through standardised central geotechnical data warehousing.
Direct connection to the SQL database (alternatively connection through CSV files).
Customisable, repeatable and auditable automated and semi-automated processing.
QGIS software benefits include:
○ Categorise symbols according to field (i.e. lithology in Section 3.4.3).

Data management and geotechnical models ECF Hamman et al.
474 Deep Mining 2017, Perth, Australia
○ Labelling symbols (e.g. Section 3.4.3, symbols are labelled with depth from and depth to values for the intervals).
○ Filtering data.
○ Constructing heat maps for density and cluster analysis (i.e. GSI heat map in Section 3.4.5).
○ Reproducible template based reporting.
The key here is to ensure that the data is interpreted by an experienced engineer and that all the outliers are validated.
3.5 Availability of reliable data
All previous steps deal with collecting data and ensuring that the data is complete and accurate, and validated. It is equally important that this reliable data is readily available from the secured database. Many software packages used to visualise and evaluate data has ODBC functionality (Open Database Connectivity), however, there are a few points to consider:
Data is being collected, reviewed and corrected all the time, thus an ever-changing central database.
Access to the central database may be slow or limited by the number of licenses.
Regular users on a central database have limited data manipulation functionality, if any at all.
Engineering assessments involve data manipulation and correction, based on the current understanding.
Thus, there is a need for a snapshot of the data that will be used during an assessment. The most accepted and easily available option is to export a flat file type from a database table or query to a spreadsheet, since most engineers are familiar with its standard functionality. As such, the authors opted for having no live links to the database and instead set up a website portal where practitioners can view the status of the available data, and select what data to download. This ensures that each design has a specific data package associated with it, incorporating a date and time stamp, thereby locking in the available data and the inherent degree of reliability. Therefore it is now possible to repeat the design and audit the process.
A key feature of recent versions of Microsoft SQL Server databases is the development of spatial functions. Geotechnical logging and mapping data can be displayed in the context of other critical spatial data. The example in Figure 10 presents:
Geotechnical borehole collars and projected traces (magenta circles and black lines).
Rockfall observations (coloured stars).
Current mine design strings (grey lines).
Aerial photography (transparent image underlay).
Unmanned aerial vehicle (UAV) photography.
This data is accessible from a web page served by Open Source Boundless GeoServer software. The web-based functionality serves two purposes:
Provision of a visual status of geotechnical data for a project or operation.
Provision of access for any geotechnical professional in AngloGold Ashanti with appropriate security access to download the latest geotechnical information for an operation or project.
The key is to ensure that one version of the data is readily available anywhere in the company at any given time.

Keynote addresses
Deep Mining 2017, Perth, Australia 475
Figure 10 Spatial data presentation from a web server
3.6 Investing in data reliability
The overall data management framework currently being utilised, as discussed above, is underpinned by the central geotechnical database, the Geotechnical Aggregator (GeotAgg). From here all the automated and semi-automated validation processes are run and the reporting outputs are secured for distribution and further evaluation.
Each step of the data management process requires an investment in time and resources. Once this data management process has been set up the gain in reliable data, by correcting errors and finding missing information, can be demonstrated. The time taken for this process can be minimised when utilising a holistic framework. In certain cases the amount of reliable data was doubled, even tripled.
This was only achieved by appointing an experienced engineer solely dedicated to geotechnical data. Similarly a large investment has been made to correct the errors in the legacy data, however, in the larger scheme of realising benefits, this cost was very quickly recuperated.
The key is that companies need to invest in correcting and maintaining their geotechnical data.

Data management and geotechnical models ECF Hamman et al.
476 Deep Mining 2017, Perth, Australia
4 Integrated block models
Geotechnical engineers are often unable to provide geotechnical input into long-term mine planning, because of a lack of good quality data in a spatial sense. Once reliable, secured data is readily available, there are several approaches that can be followed to complete a design, depending on the level of the project.
The challenge is to establish a framework that can be used at different levels of design, which allows for greater flexibility to evaluate different scenarios, and consists of a streamlined workflow to allow informed decision-making based on sound geotechnical analysis. The aim is to provide a tool to engineers that can be used in association with commonly available software packages present on most mine sites and which does not require specialised software packages.
4.1 Moving towards a 3D parameter calculation
In a single parameter estimation one value, usually the mean, is selected for the rock mass. Barton’s Q classification is a good example, where a single value is used in rudimentary ground support estimations, as illustrated in Figure 11. The modified stability number (N’) is used in a similar single parameter fashion in stope design.
Figure 11 The Q-support chart to evaluate support requirements in underground openings (After Barton
1974, graphic obtained from NGI, 2013)
Statistical distributions and histograms provide a better description of the data and can be done for any geotechnical property and parameter being considered in a stability assessment. Once a statistical distribution has been defined for a property, or parameter, it becomes easier to then pick a number to use as input in mine design. The method does have limitations, because it is not always possible to obtain a representative type of distribution in a spatial context.
Data with a normal distribution are favoured and designs are then completed for a conservative case, a median case or an optimistic case. These cases typically use the P25, P50 and P75 percentiles. The issue here

Keynote addresses
Deep Mining 2017, Perth, Australia 477
is that the even though the design calculations for all these percentiles are correct, it does not provide the design engineer insight into their exact location in real space.
The challenge is to link data points from a data set presented as a statistical distribution, and their individual calculated design parameters, to an actual point in real space. Then it is possible to create a 3D spatial distribution of the data, similar to the block models resource being used by geologists, thereby providing the engineer the ability to identify areas of risk and opportunity with much greater confidence.
Block models of material properties have been used in the industry for years, however, in this format it is only functional to the geotechnical engineer. The authors felt that a block model should incorporate design specifications and likely rock mass performance as well. The aim is to create a means to communicate design specifications through this ‘block model’ to mine planners to provide them with more freedom and the ability to design the excavation geometries. The idea of a Geotechnical Model for Rapid Integration, or GMRi, was born.
An open source spatial collection (e.g. Comma Separated Values or CSV), or block model, of ground mass data (soil, rock and water) that is integrated with modelling results, both numerical and analytical, and monitoring data for a specific mine plan.
This model is to be of sufficient detail to provide a high level of confidence for geotechnical design parameter inputs into long- to medium-term mine planning and serves as a reliable basis in consideration of different mine planning scenarios in the short term.
4.2 Considerations to construct a GMRi
The challenge was to formulate a robust method and environment to move from geotechnical data, through rock mass modelling and numerical modelling, to an output that incorporates all input and output data for any specific design.
The construction of a GMRi can be considered as a five step process (Figure 12). In the following sections the authors will list some of the key considerations to realise the workflow.
Figure 12 Workflow to construct a GMRi
4.2.1 Compiling geotechnical data set
Compiling the geotechnical data set requires access to an up-to-date data package. Further evaluation of the data set requires confidence in the level of validation of the data set and knowledge with respect to geotechnical domains. The engineer needs to understand the gaps and uncertainties within the data set, and evaluate its impact with reference to knowledge of geotechnical targets, or objectives, to meet requirements of the level of study or operational activities to be undertaken.
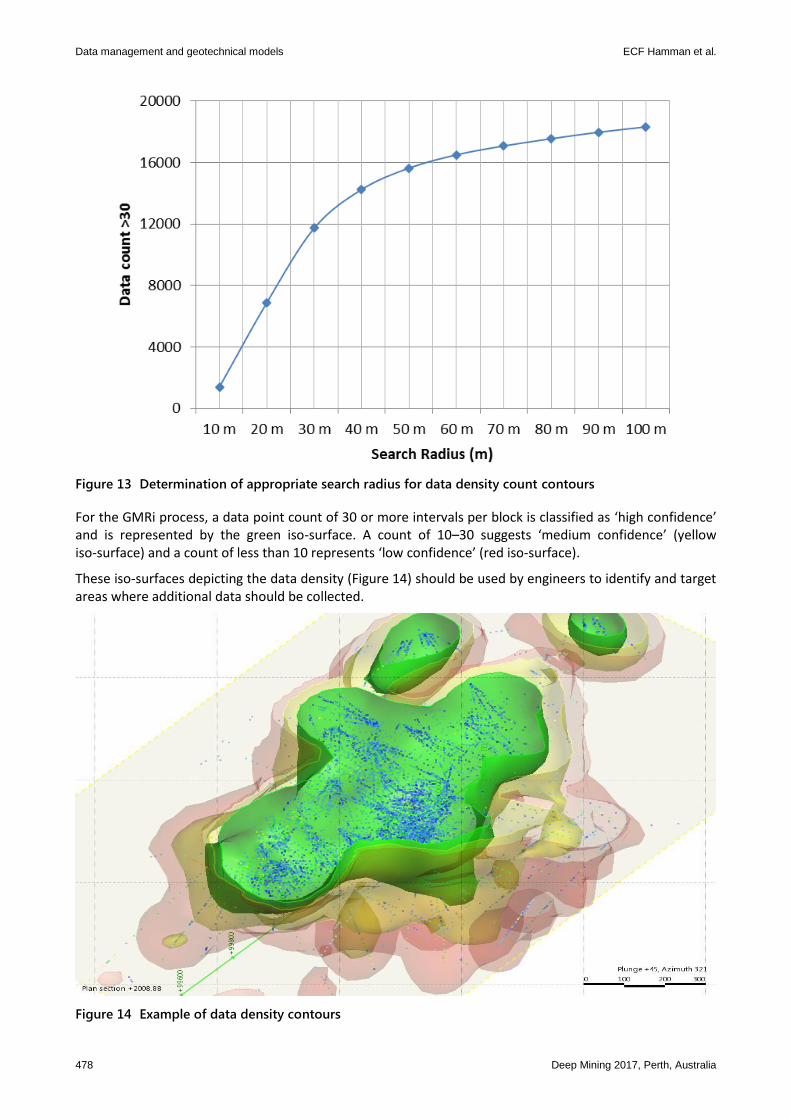
When using geotechnical data for a mine-scale assessment, it is important to also consider the relative confidence in the dataset spatially. One way of evaluating this is to quantify a statistically valid set of data points in equal sized blocks for the area of study. The sizing of the blocks is optimised to maximise the number of statistically valid blocks and minimise processing time. This can be done using the software GEM4D (Basson 2017), which allows counting the number of data points within a specified radius. The data count is repeated for several radii to determine the optimum search distance that would represent the data density most effectively. For the example, a search radius of 80 m was selected as the optimum search radius where after little additional information becomes available (Figure 13).
Compile data set
Construct rockmass
model
Construct numerical
stress model
Construct GMRi
Upload to Database
Data management and geotechnical models ECF Hamman et al.
478 Deep Mining 2017, Perth, Australia
Figure 13 Determination of appropriate search radius for data density count contours
For the GMRi process, a data point count of 30 or more intervals per block is classified as ‘high confidence’ and is represented by the green iso-surface. A count of 10–30 suggests ‘medium confidence’ (yellow iso-surface) and a count of less than 10 represents ‘low confidence’ (red iso-surface).
These iso-surfaces depicting the data density (Figure 14) should be used by engineers to identify and target areas where additional data should be collected.
Figure 14 Example of data density contours
Keynote addresses
Deep Mining 2017, Perth, Australia 479
4.2.2 Rock mass model construction
A technically sound rock mass model, similar to a geological resource model, forms the basis for geotechnical design on a mine-scale. It is important that the context against which the model is constructed is well understood. This type of model does not attempt to predict actual geotechnical behaviour of the rock mass, but provides an estimate of the likely existing conditions, based on an interpretation of the best current available knowledge. During the construction of a rock mass model, engineers should take due consideration of factors that may influence the distribution of any specific parameter on a mine-scale. These may include structural framework, rock type, and alteration or similar ground mass characteristics.
The workflow starts by selecting the different properties to be interpolated, or from which to construct a block model. All relevant data points are extracted from drill hole log files. If necessary it is exported as CSV file to merge with other data sources available.
Interpolation options are evaluated to determine the need for using a ‘structural trend’ or other forms of interpolation based on the variography. Note that a proper working knowledge of block models is needed to ensure that the correct interpolation parameters are set. Typically the interpolation will determine the value of a continuous variable, such as grade, between the measured data samples. If the data is both regularly and adequately sampled, then different interpolants will produce similar results. In mining, however, it is rarely the case that geotechnical data is so abundant, and therefore it is necessary to make an engineering judgement to determine the most suitable way to interpolate rock mass characteristics and classification data to produce reasonable results. This is largely done by trial and error.
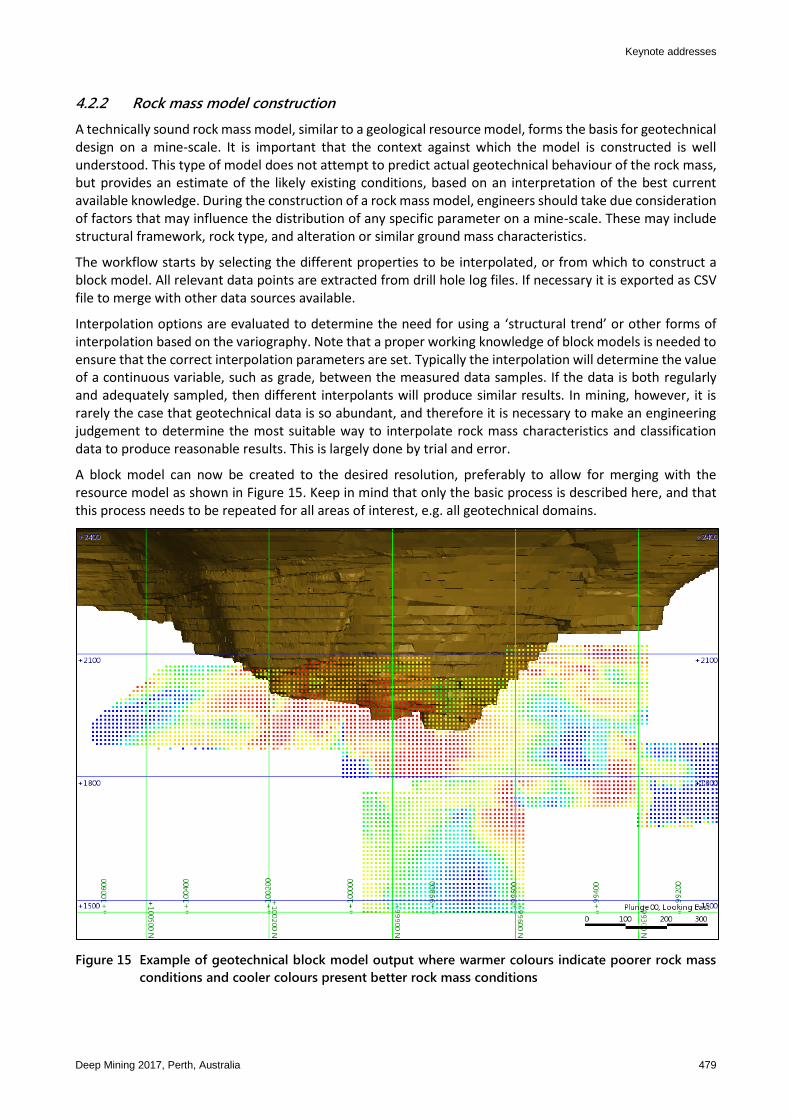
A block model can now be created to the desired resolution, preferably to allow for merging with the resource model as shown in Figure 15. Keep in mind that only the basic process is described here, and that this process needs to be repeated for all areas of interest, e.g. all geotechnical domains.
Figure 15 Example of geotechnical block model output where warmer colours indicate poorer rock mass
conditions and cooler colours present better rock mass conditions

Data management and geotechnical models ECF Hamman et al.
480 Deep Mining 2017, Perth, Australia
Once the block model has been constructed it is checked to ensure a realistic representation of the data. This can be done using the following:
Iso-surfaces – Trends in the iso-surfaces of the data can be visualised to assess if the model represents a reasonable outcome.
Scatter plots – Interpreted and actual data for the different properties and parameters are plotted to identify outliers and trends.
Swath plots – Sections are constructed at regular intervals, and for different orientations, to compare the interpreted values to the actual values.
Box and whisker plots – Interpreted and actual data are plotted for selected populations to compare and check the distribution and outliers.
Mean comparison – The estimate must be the same as the mean of the data within a sample volume. This is better when the technique used takes the de-clustering into account. Krigging typically does de-clustering better than the inverse distance or nearest neighbour methods.
A point cloud can then be created from the block model for the relevant area of interest, e.g. geotechnical domain/mining area. This point cloud forms the basis of the GMRi and as an exported CSV file it allows for further calculation and data manipulation.
4.2.3 Numerical modelling
At a mine-scale, the 3D numerical modelling software Map3D provides an ideal tool to rapidly evaluate different mining configurations. The software has been successfully used over the years to correlate underground observations with modelled behaviour.
This is a critical aspect for inclusion into a GMRi as it provides the basis for geotechnical input into mine planning such as ground support or likely rehabilitation requirements. It is furthermore possible to highlight areas where significant stress changes are likely to occur as a result of mining and to then pro-actively plan for and manage the expected condition.
First it is necessary to determine a correlation between observed rock mass behaviour and numerical modelling results. This could either be a correlation between the ratio of σ1 versus σ3 to evaluate tunnel and
pillar stability (example shown in Figure 16); or vs σn to determine stope overbreak where an ubiquitous rock mass fabric is present.

Keynote addresses
Deep Mining 2017, Perth, Australia 481
Figure 16 Example of correlation between σ1 versus σ3 and observed behaviour (after Sandy et al. 2010)
Then a mine-scale model is constructed in Map3D to a reasonable level of accuracy, without trying to build into the model too many complexities. Simpler models often provide better results and greatly reduce model run time. Models should include at least two mining steps. Mining step 1 should represent the current state of mining, while mining step 2 should represent the planned mining.
A point cloud, using the centres of the constructed rock mass model, can be used in the MSCALC analysis option, from where the results can be exported as a CSV again. The analysis results should include the calculated values for σ1 and σ3. This point cloud within the CSV file forms the first overlay of the GMRi and allows for data manipulation and calculation of additional parameters and failure criteria rankings.
4.2.4 Constructing the GMRi
The final step in this process is to construct a ‘block model’, or GMRi, that takes into consideration all available geotechnical information. Once all the data is merged, it is possible to calculate and include geotechnical design guidelines for the different geotechnical domains. Since the GMRi is in a CSV format it is compatible with various mine planning software packages, and can be interrogated against the existing geological resource model to find an optimal balance between stope grade, stope size and relative geotechnical risk, thus enabling the mine planner to run scenarios for the different design philosophies.
4.3 Examples of interpreting GMRi data
The effective use of the GMRi is not dependent on any specific piece of software, as the CSV file can be imported and manipulated in multiple packages in order to assess geotechnical design input. And since the GMRi includes all the rock mass properties, numerical modelling results, strength criteria, design guidelines and monitoring data in a point cloud, it is now possible to view the information in one work space.
The examples below illustrate how different information can be visualised for evaluation. The aim is to demonstrate the functionality of the GMRi, as such it does not represent a comprehensive analysis.

Data management and geotechnical models ECF Hamman et al.
482 Deep Mining 2017, Perth, Australia
4.3.1 Large open stope assessment
This example shows the potential for visualising data obtained from the GMRi for a randomly selected stope design using GEM4D. At first glance it is clear that from a data density point of view (data count > 30) the GMRi is reliable and analysis using the data will be at a level that provides good statistical confidence (Figure 17).
Figure 17 GMRi depicted as data density
The model also suggests that ‘good’ rock mass conditions (Figure 18) can be expected in terms of Barton’s Q classification.
Figure 18 GMRi depicted as Barton’s Q classification
30
150
250
350
5
20
35
45

Keynote addresses
Deep Mining 2017, Perth, Australia 483
The histogram provides an indication of the potential size of the stope based on the built-in empirical relationship (modified stability graph method) between rock mass conditions and a stable hydraulic radius (Figure 19).
Figure 19 GMRi histograms to provide an indication of the range of hydraulic radii
The stress values included in the GMRi are aimed at providing indicative values and do not consider the proposed stoping excavation (Figure 20). For a detailed numerical analysis, the final stope design would have to be evaluated separately using Map3D (Wiles 2017).
Figure 20 GMRi depicted as modelled stress results (1 obtained from Map3D)
In addition to rock mass classification data, the GMRi provides access to structural data obtained from drill hole logging and underground line mapping. The structural information is easily presented on a stereonet as shown in Figure 21.
20
30
40
MPa50
10

Data management and geotechnical models ECF Hamman et al.
484 Deep Mining 2017, Perth, Australia
Figure 21 GMRi depicted as structural disk and associated stereographic representations
4.3.2 Plotting data on development
Iso-surfaces can be generated from the block model values, numerical modelling results and the subsequent calculated values. The Factor of Safety (FS) was calculated from the induced stress and rock mass strength data for the different points in 3D space in the GMRi. The results are visualised as iso-surfaces (Figure 22) to identify areas below a set FS evaluated for a given failure criteria as described earlier.

Keynote addresses
Deep Mining 2017, Perth, Australia 485
Figure 22 GMRi depicted as iso-surfaces for a set failure criteria
The values of these iso-surfaces can then be mapped to develop wireframes using a nearest neighbour method (Figure 23).
Figure 23 Confidence level and confidence interval for expected failure mechanism

Data management and geotechnical models ECF Hamman et al.
486 Deep Mining 2017, Perth, Australia
4.3.3 Mine-scale assessment
The ability of a mining operation to provide accurate estimates of likely opportunities and cost profiles is very much dependent on having a reasonable idea of the likely mining conditions over the life of the mine. In addition to natural rock mass conditions and large-scale geological structures, the rock mass response to stress redistribution as a result of mining is important to be considered in this regard. This is best assessed through a mine-scale stress model to evaluate the status quo against likely future mining scenarios.
The purpose of developing mine-scale models is two-fold:
Identification of areas within the mine where conditions are likely to be different to what is currently known and to include flexibility in the mine design.
Provide input into cost models and mining assumptions for ‘existing’, ‘tangible’ and ‘blue sky’ resources.
In the series of figures below, the modelled results are visualised to represent expected conditions (e.g. pillar stability or expected tunnel conditions) in three categories:
Blue indicates conditions to a selected factor of safety (e.g. FS > 1.4).
Green indicates conditions approaching instability, an optimised design.
Red indicates potentially unstable conditions and highlights the need for a revised geotechnical design approach.
Figure 24 shows an evaluation of randomly selected tunnels at a mine-scale using the colour-coded approach described above. The results indicates that mining induced stress is not expected to significantly impact on general tunnel conditions, and that tunnel conditions will only start showing signs of stress related damage below 1,600 mRL. Once this level is reached, a different approach to ground support design or additional provision for rehabilitation of ground support will be required.
Figure 24 Evaluation of mine-scale tunnel stability

Keynote addresses
Deep Mining 2017, Perth, Australia 487
5 Conclusion
The challenge was to enable the geotechnical engineering teams to support their stakeholders in value-adding designing and operating activities. This was achieved by developing technical expertise, standardised systems and processes that utilised current technology. This paper covered two of the frameworks currently being utilised, namely that of the standardised data management (GeotAgg) and evaluation (GMRi).
By investment in aptly skilled technical resources, companies can achieve the following:
Establish a robust data management framework.
Compile reliable data sets, tailored to the specific needs of each project.
Formalise repeatable and auditable processes to evaluate data.
Utilise tailored data sets and formalised processes to assess design options and risks.
Share and communicate geotechnical data, parameters and design guidelines efficiently in 3D space.
Acknowledgement
This work has been developed through the input of various practitioners within AngloGold Ashanti as well as industry peers. The authors gratefully acknowledge the contribution of their peers and colleagues, and the management of AngloGold Ashanti for the opportunity to present this work.
References
Barton, NR, Lien, R & Lunde, J 1974, ‘Application of the Q-system in design decisions and appropriate support for underground installations’, in M Bergman (ed.), Proceedings of the International Conference on Subsurface Space, Pergamon Press, New York, pp. 553–561.
Basson, F 2017, GEM4D, BasRock, Perth, Western Australia, viewed 31 January 2017, http://www.basrock.net/gem4d Bieniawski, ZT 1989, Engineering Rock Mass Classifications, Wiley, New York. Cai, M, Kaiser, PK, Uno, H, Tasaka, Y & Minami, M 2004, ‘Estimation of rock mass deformation modulus and strength of jointed hard
rock masses using the GSI system’, International Journal of Rock Mechanics and Mining Sciences, vol. 41, pp 3–19. Davies, E 1967, Report of the Tribunal Appointed to Inquire into the Disaster at Aberfan on October 21st 1966, Her Majesty's Stationery
Office, London, pp. 131–132. Duran, A 2015, ‘A study in blockiness using borehole data for rock mass quality assessment’, Proceedings of the 2015 International
Symposium on Slope Stability in Open Pit Mining and Civil Engineering, The Southern African Institute of Mining and Metallurgy, Johannesburg, pp. 841–852.
Duran, A 2016, ‘Rock mass assessment – what goes wrong?’, in P Dight (ed.), Proceedings of the First Asia Pacific Slope Stability in Mining Conference, Australian Centre for Geomechanics, Perth, pp. 493–506.
Fowler, MJ 2013, ‘Structural data bias in the digital age’, in P Dight (ed.), Proceedings of the 2013 International Symposium on Slope Stability in Open Pit Mining and Civil Engineering, Australian Centre for Geomechanics, Perth, pp. 219–226.
Harr, ME 1996, Reliability-based design in Civil Engineering, Dover Publications, New York. Lilly, PA 2000, Risk Analysis and Decision Making, unpublished Master of Engineering Science course notes, Curtin University, Perth. McMahon, BK 1978, Application of Rock Mechanics to Mine Design, Australian Mineral Foundation, Glenside, South Australia. Norwegian Geotechnical Institute (NGI) 2015, Using the Q-system. Rock Mass Classification and Support Design, Norwegian
Geotechnical Institute, Oslo, viewed 31 January 2016, https://www.ngi.no/eng/Publications-and-library/Books/Q-system QGIS 2017, QGIS, version 2.18.3, QGIS, viewed 31 January 2017, http://www.qgis.org/en/site/index.html Read, JRL & Stacey, P 2009, Guidelines for Open Pit Slope Design, CSIRO Press, Collingwood, Victoria. Rocscience Inc. 2016, Dips, Rocscience Inc., Toronto, Ontario. Sandy, M, Sharrock, G, Albrecht, J & Vakili, L 2010, ‘Managing the transition from low stress to high stress conditions’, Proceedings of
the Second Australasian Ground Control Conference in Mining, The Australasian Institute of Mining and Metallurgy, Carlton South, pp.247–253.
Sullivan, TD 2006, ‘Pit slope design and risk – a view of the current state of the art’, Proceedings of the International Symposium on Stability of Rock Slopes in Open Pit Mining and Civil Engineering, The Southern African Institute of Mining and Metallurgy, Johannesburg, pp. 51–78.
Wiles, TD 2006, ‘Reliability of numerical modelling predictions’, International Journal of Rock Mechanics & Mining Sciences, vol. 43, no. 3, pp. 454–472.
Wiles 2017, Map3D, Map3D International Ltd, viewed 1 February 2017, www.map3d.com Ulusay, R & Hudson, JA 2007, The Complete ISRM Suggested Methods for Rock Characterization, Testing and Monitoring: 1974-2006,
compilation arranged by the ISRM Turkish National Group, Ankara. Ulusay, R & Hudson, JA 2016, The Complete ISRM Suggested Methods for Rock Characterization, Testing and Monitoring: 2007-2014,
Springer, London.

Data management and geotechnical models ECF Hamman et al.
488 Deep Mining 2017, Perth, Australia