data mining to find protective or risky dietary patterns...
TRANSCRIPT

Data mining to find protective or risky dietary patterns
for common complex diseases: implications on devising dietary guidelines
Wen-Harn Pan, PhD, FAHA
Distinguished Professor
Institute of Biomedical Sciences
Academia Sinica
Taipei, Taiwan
Taiwan Food Guide

Food-based guidelines Crucial for promoting
healthy eating
Comprehensible
Prudent & versatile
Easy to implement
2006

US Dietary Guidelines 2015-20201. Follow a healthy eating pattern across the lifespan.
Appropriate calorie, healthy BW, nutrient adequacy
2. Focus on variety, nutrient density, and amount. Nutrient needs, nutrient-dense foods, variety
3. Limit calories from added sugars and saturated fats and reduce sodium intake. Eating pattern, foods, beverages
4. Shift to healthier food and beverage choices. Cultural and personal preference
5. Support healthy eating patterns for all. Everyone has a role, multiple settings
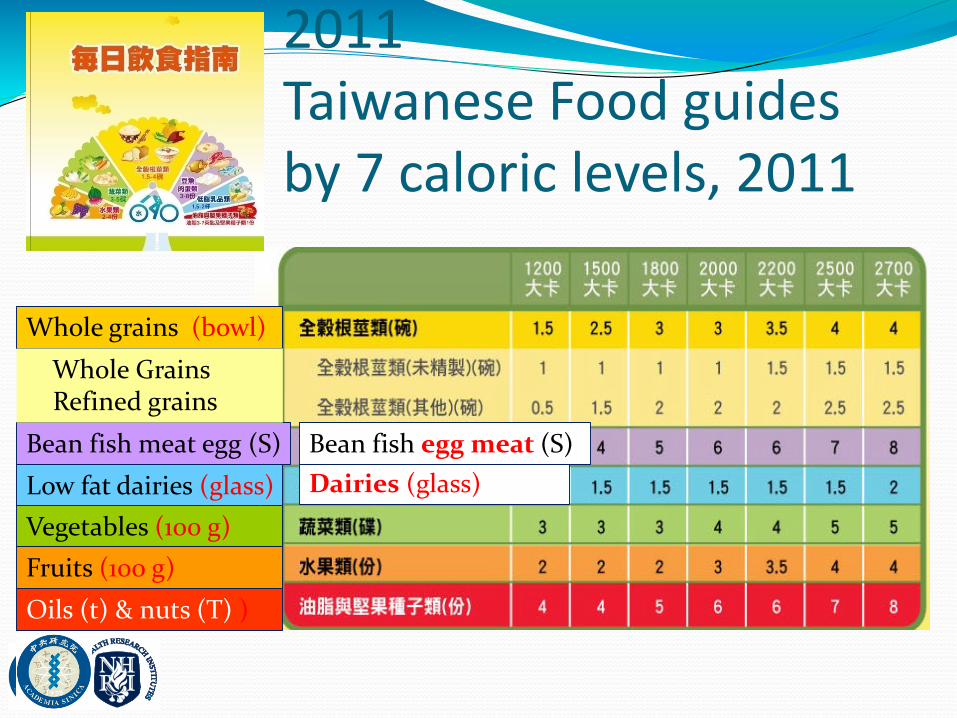
2011 Taiwanese Food guides by 7 caloric levels, 2011
Whole grains (bowl)
Bean fish meat egg (S)
Low fat dairies (glass)
Vegetables (100 g)
Fruits (100 g)
Whole GrainsRefined grains
Oils (t) & nuts (T) )
Dairies (glass)
Bean fish egg meat (S)
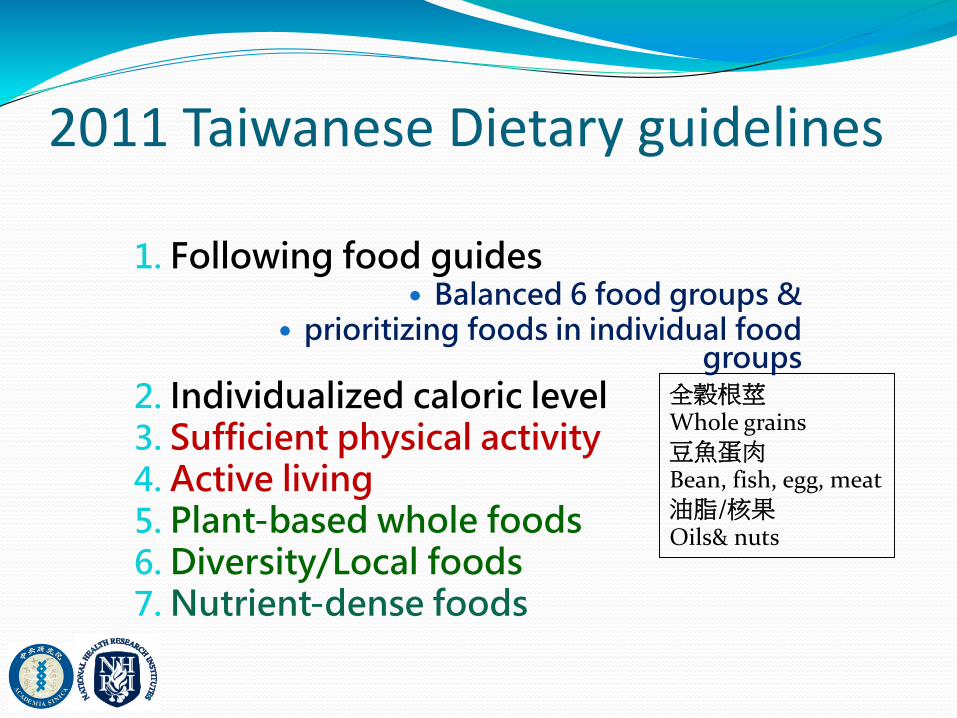
2011 Taiwanese Dietary guidelines
1. Following food guides Balanced 6 food groups &
prioritizing foods in individual food groups
2. Individualized caloric level3. Sufficient physical activity4. Active living5. Plant-based whole foods6. Diversity/Local foods7. Nutrient-dense foods
全穀根莖Whole grains豆魚蛋肉Bean, fish, egg, meat油脂/核果Oils& nuts

Taiwanese Dietary guidelines
8. Portion size control
9. Limit energy-dense and added sugar-
rich foods
10. Breast feeding for 6 months or more
11. Alcohol beverage in moderation
12. Food hygiene and safety

2011 (2017 revision)Taiwan Food Guide & Dietary Guideline
Identify Current Diet-related health problems in Taiwanese Considering dietary pattern-disease relations
Evidence-Based from nutrient point-of-view To fulfill DRIs and macro-nutrient composition (DASH
composition) (24-hour recall data from NAHSIT is used.) Low in Mg & B6 with previous recommendation
Multiple caloric levels Food-Based /cultural-sensitive Stressing plant foods, local foods, and nutrient dense
foods Diversity
Pan & Hung. Evidenced-based recommendation for the 2011 TaiwanFood guide. Nut Science J 2015.

Guidelines focusing on dietary pattern
Well-known beneficial dietary patterns
Mediterranean diet
DASH diet
Japanese diet
Vegetable & fruit rich dietary pattern
Vs. Traditional western pattern

Healthy dietary pattern throughout lifespan
How shall we improve it with new dietary pattern-health relationship findings?

More should be learned from“Data-Mining Results of the Dietary pattern-Disease relationships” in devising dietary guideline
Well-known beneficial dietary patterns
Mediterranean diet
DASH diet
Japanese diet
Vegetable & fruit rich dietary pattern
Traditional western dietary pattern

FFQ data for data mining of dietary pattern-disease relationship
Methods
Food frequency questionnaire
Faults Can not provide accurate estimates
of nutrient /or food intake
Merits for ranking people to study diet-
disease associations
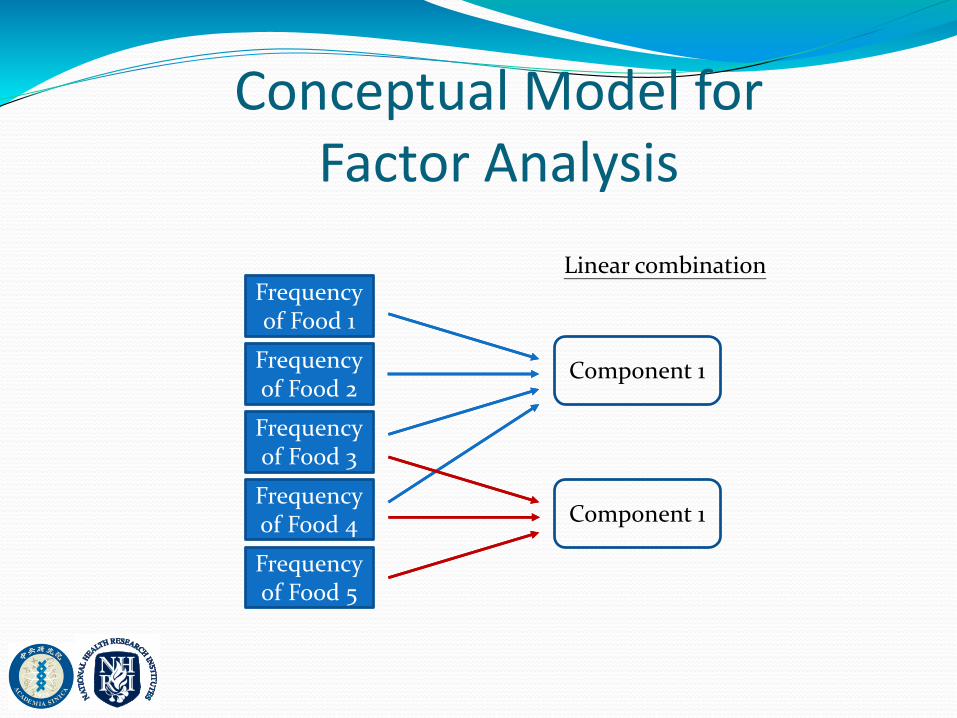
Conceptual Model for Factor Analysis
Frequencyof Food 1
Frequencyof Food 2
Frequencyof Food 3
Frequencyof Food 4
Frequencyof Food 5
Component 1
Component 1
Linear combination

Factor analysis Orthogonal rotation:to make factors independent
from one another

Association between Unhealthful Eating Patterns and Unfavorable Overall School performance in
Children Fuh & Pan JADA 2007
Nutrition and Health Survey in Taiwan (NAHSIT) for elementary school children, 2001-2002
2222 students 7 questions to assess overall school performance
22 items in FFQ

Factor analysis groups 22 items into5 dietary factors (facets)

Statistical methods Objective
Principal component analysis/factor
analysis
(PCA)
Explaining as much predictor
variation as possible
Reduced-rank regression for
continuous response variables
(RRR)
Explaining as much response
variation as possible
Partial least squares-discriminant
analysis for categorical response
variables
partial least squares balances the two objectives, seeking for factors that explain both response and predictor variation
Simple linear regressionY=a1X+a2X+a3X+…. anX+b+E
X:predictorY:response
Dimension reduction approaches


Endpoints of interests School children and youth
Asthma
Teacher rated school performance
Elderly
Hyperuricemia
Nasopharyngeal cancer
Frailty

Dietary frequency information Vegetable
Pickled vegetable
Fresh fruit
Whole grains
Rice, noodle and products
Breakfast cereals
Roots and tubers
Nuts and seeds
Milk, yogurt, cheese
Flavored milk
Soybean products
Egg
Fish
Shell fish
Deep-sea fish
Seafood products
Poultry
Red meat
Processed meat products
Innards
Fried foods
Snacks
Coffee
Tea
Sweetened beverage

Partial-least-square discriminant analysis discovered a dietary
pattern inversely associated with nasopharyngeal carcinoma risk
(PLos One 2016)
Yen-Li Lo, Wen-Harn Pan*, Wan-Lun Hsu, Yin-Chu Chien,Jen-Yang Chen, Mow-Ming Hsu, Pei-Jen Lou, I-
How Chen, Allan Hildesheim, Chien-Jen Chen*

Comparing 258 NPC cases & controlsCharacteristic/category Cases Controls P1
n (%) n (%)
Gender
Male
Female
258 (69.5)
113 (30.5)
222 (69.2)
99 (30.8)
0.91
Age (mean ±SD), years 45.6±11.6 46.0±11.7 0.62
Age, years
<35
35– 44
45– 54
55– 64
≧65
64 (17.3)
120 (32.4)
95 (25.6)
72 (19.4)
20 (5.4)
55 (17.1)
101 (31.5)
84 (26.2)
62 (19.3)
19 (5.9)
0.99
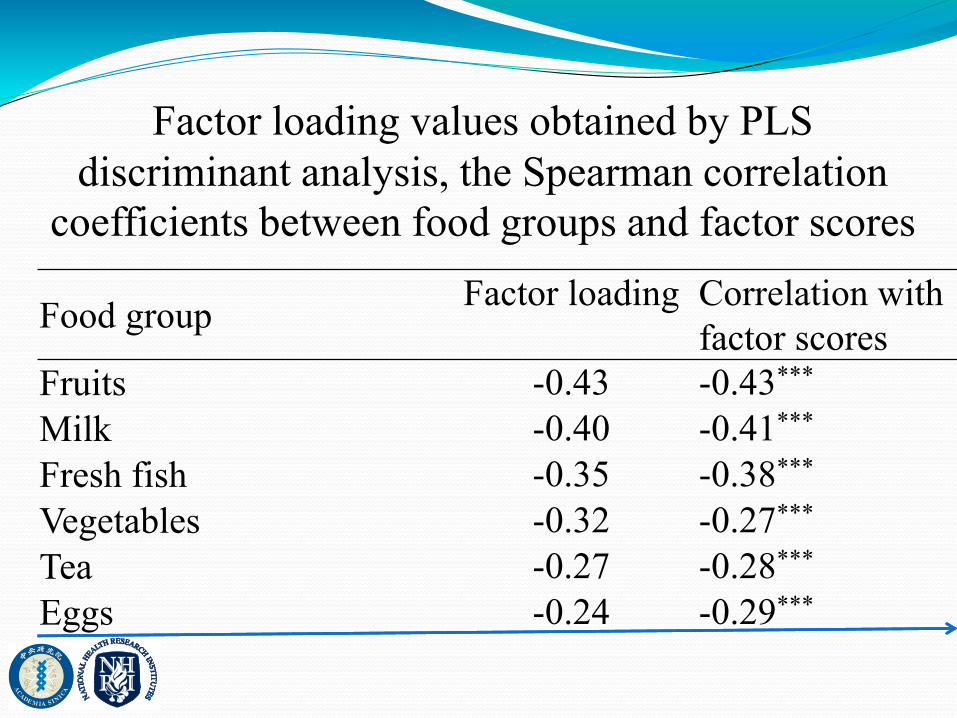
Factor loading values obtained by PLS
discriminant analysis, the Spearman correlation
coefficients between food groups and factor scores
Food groupFactor loading Correlation with
factor scores
Fruits -0.43 -0.43***
Milk -0.40 -0.41***
Fresh fish -0.35 -0.38***
Vegetables -0.32 -0.27***
Tea -0.27 -0.28***
Eggs -0.24 -0.29***

Dietary pattern score PLS or RRR was applied to find a dietary factor score
associated uric acid, from food frequency questionnaire.
A score was calculated for each participant for each dietary pattern as a sum of the food groups, each weighted according to the factor loadings.
Score = Dietary Pattern Loadings x Food Intake Frequency
Participant scores were categorized into quartiles.
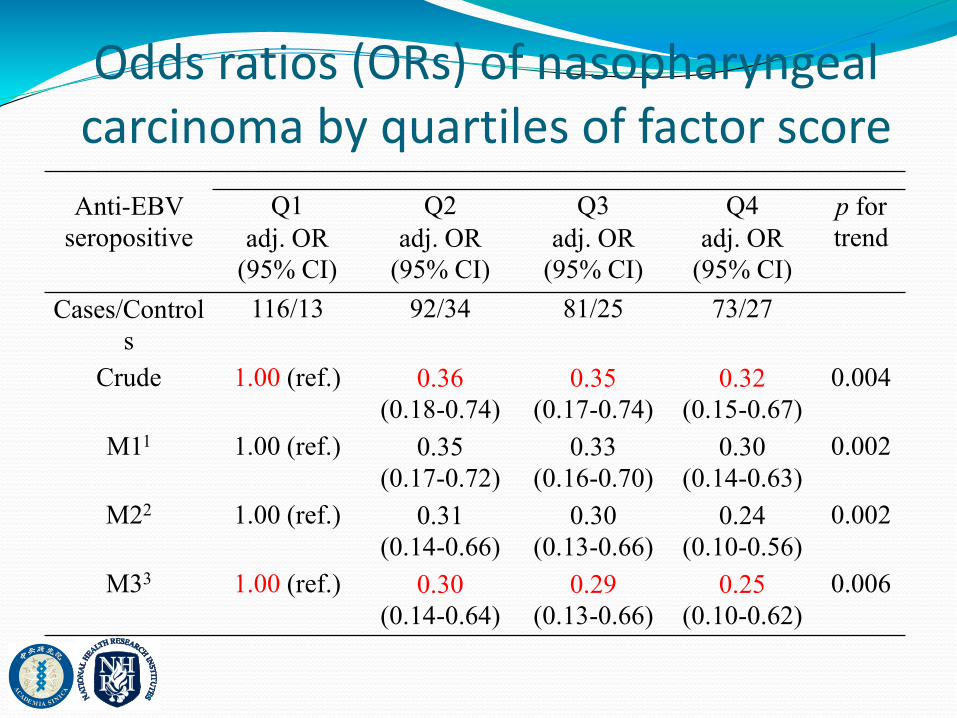
Odds ratios (ORs) of nasopharyngeal carcinoma by quartiles of factor score
Anti-EBV
seropositive
Q1
adj. OR
(95% CI)
Q2
adj. OR
(95% CI)
Q3
adj. OR
(95% CI)
Q4
adj. OR
(95% CI)
p for
trend
Cases/Control
s
116/13 92/34 81/25 73/27
Crude 1.00 (ref.) 0.36
(0.18-0.74)
0.35
(0.17-0.74)
0.32
(0.15-0.67)
0.004
M11 1.00 (ref.) 0.35
(0.17-0.72)
0.33
(0.16-0.70)
0.30
(0.14-0.63)
0.002
M22 1.00 (ref.) 0.31
(0.14-0.66)
0.30
(0.13-0.66)
0.24
(0.10-0.56)
0.002
M33 1.00 (ref.) 0.30
(0.14-0.64)
0.29
(0.13-0.66)
0.25
(0.10-0.62)
0.006
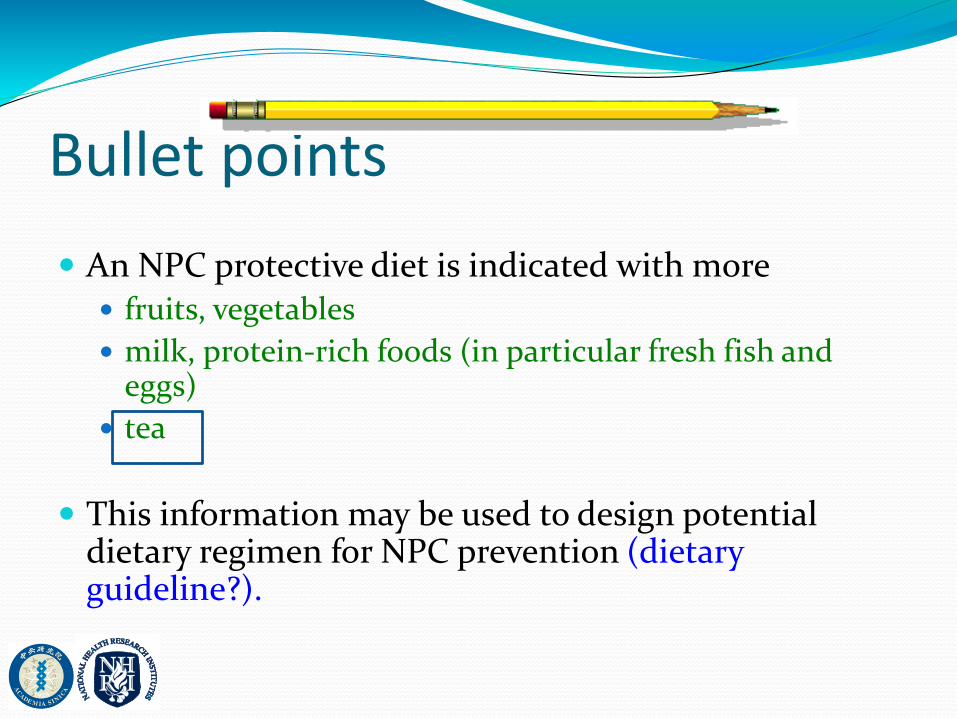
Bullet points
An NPC protective diet is indicated with more fruits, vegetables
milk, protein-rich foods (in particular fresh fish and eggs)
tea
This information may be used to design potential dietary regimen for NPC prevention (dietary guideline?).

Using data mining approach to find dietary pattern associated with frailty:
results from Nutrition and Health Survey in Taiwan, 2014-2016
Yen-Li Lo,Yao-Te Hsieh,Li-Lin Hsu,Shao-Yuan Chuang,Hsing-Yi Chang,Chih-Cheng Hsu,Ching-Yu Chen3,Wen-Harn Pan*
Journal of Geriatrics Society, 2017

Phenotype of frailty (Fried, 2001)
FrailtyWeakness
Slowness
Weight loss
Fatigue
Low physical activity
27
Nonfrail Prefrail Frailty
0 1-2 3-5
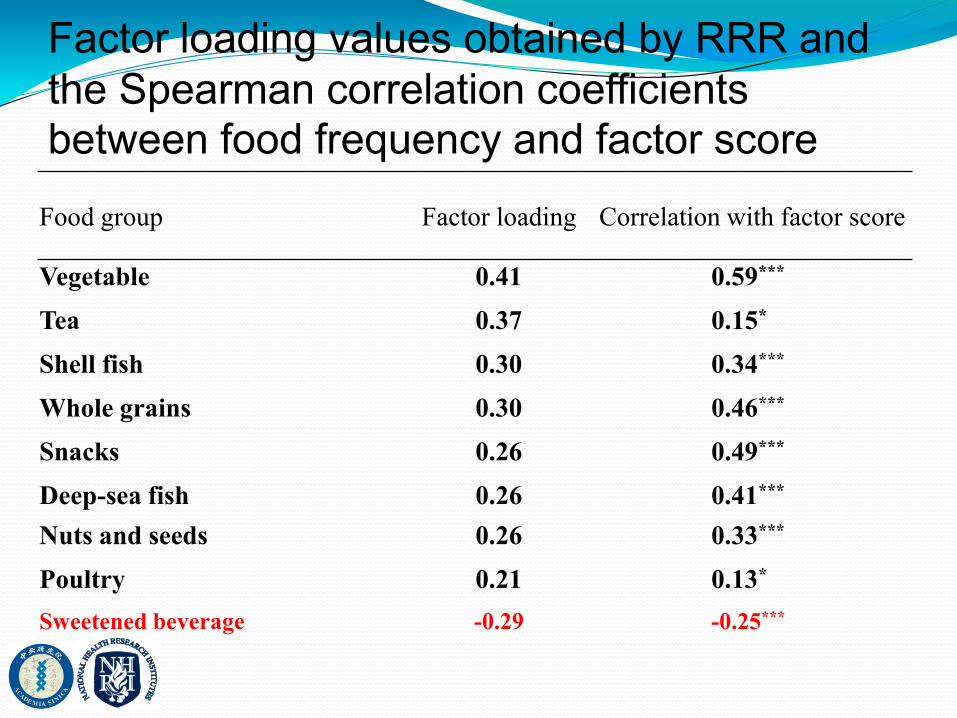
Factor loading values obtained by RRR and
the Spearman correlation coefficients between food frequency and factor score
Food group Factor loading Correlation with factor score
Vegetable 0.41 0.59***
Tea 0.37 0.15*
Shell fish 0.30 0.34***
Whole grains 0.30 0.46***
Snacks 0.26 0.49***
Deep-sea fish 0.26 0.41***
Nuts and seeds 0.26 0.33***
Poultry 0.21 0.13*
Sweetened beverage -0.29 -0.25***

Characteristics by tertiles of dietary pattern
score in 274 participants from NAHSIT 2013
Tertiles of dietary pattern scores
Tertile 1 Tertile 2 Tertile 3 pb
Age, years 74.4 ± 6.5 73.8 ± 7.4 72.6 ± 6.4 0.076
BMI, kg/m2 24.2 ± 3.5 24.2 ± 3.5 25.0 ± 3.6 0.967
Recent weight loss, n (%)
No 70 (81.8) 81 (91.0) 84 (93.3) 0.037
Yes 16 (18.2) 8 (9.0) 6 (6.7)
Exhaustion, n (%)
No 47 (64.4) 51 (89.5) 41 (78.9) 0.003
Yes 26 (35.6) 6 (10.5) 11 (21.1)
Grip strengtha, kg 21.1 ± 8.2 23.6 ± 8.4 26.6 ± 9.0 <.0001
Lean massa, kg 37.8 ± 6.9 38.9 ± 7.1 40.8 ± 7.6 0.009
Hemoglobina, mg/dL 13.0 ± 1.7 13.2 ± 1.5 13.6 ± 1.6 0.014

Odds ratios on frailty by tertiles of dietary
pattern score in 480 participants NAHSIT 2014
Tertiles of dietary patternscores
Tertile 3
as reference
Tertile 2
adj. OR (95% CI) Tertile 1
adj. OR (95% CI)
p
for trend
Frail vs. robust
N 3/86 9/64 13/55
Model 1 1.00 3.90
(0.91-16.77)
6.17
(1.49-25.59)
0.011
Model 2 1.00 5.02
(1.08-23.30)
6.28
(1.41-27.94)
0.017
Pre-&frail vs robust
N 74/86 93/64 102/55
Model 1 1.00 1.58 (0.99-2.52) 1.90 (1.18-3.07) 0.008
Model 2 1.00 1.74 (1.08-2.80) 2.04 (1.25-3.34) 0.004

Bullet points
A dietary pattern was associated with lower risk of frailty.
More phytonutrient-rich plant foods (vegetable, whole grains, nuts/seeds), tea, deep-sea fish, other protein-rich foods with low-saturated fat, discretionary calories from between-meal snack;
Less sweeten beverage.
This information may be used to design potential dietary regimen for frailty prevention. (dietary guideline?)

The association between Dietary and Hyperuricemia among adults in Taiwan
(Chuang SY & PanWH. APJCN 2011)

Dietary pattern score associating with uric acid and levels of uric acid
4.0
4.5
5.0
5.5
6.0
6.5
7.0
7.5
Men Women
Uri
c ac
id, m
g/dL
Q1 Q2 Q3 Q4
0.0
0.5
1.0
1.5
2.0
2.5
3.0
Q1 Q2 Q3 Q4
Diatery pattern score associated with uric acid
Od
ds R
ati
oHyperuricemia

The food pattern associated uric acid and frequency of food intake in men
0
4
8
12
16
20
Lean Meat Soy Egg Vegetable Ferment Small Fish
with bone
Q1 Q2 Q3 Q4
Tim
es / W
ee
k
Dietary pattern score associated with uric acid
(發酵食品)

The food pattern associated uric acid and frequency of food intake in men (count's)
0.0
0.5
1.0
1.5
2.0
2.5
3.0
3.5
Coffee Carrot Mushroom Bamboo
shoot
Soda drink Internal
organs
Q1 Q2 Q3 Q4
Dietary pattern score associated with uric acid
Tim
es / W
ee
k

The food pattern associated uric acid and frequency of food intake in women
0
1
2
3
4
5
6
Lean Meat Soy Egg Small Fish
with bone
Sea Weed
Q1 Q2 Q3 Q4
Tim
es / W
ee
k
Dietary pattern score associated with uric acid

The Dietary pattern associated uric acid and frequency of food intake in women (count's)
0
2
4
6
8
10
Dark vegetable Carrot Mushroom Coffee Bamboo shoot
Q1 Q2 Q3 Q4
Dietary pattern score associated with uric acid
Tim
es / W
ee
k
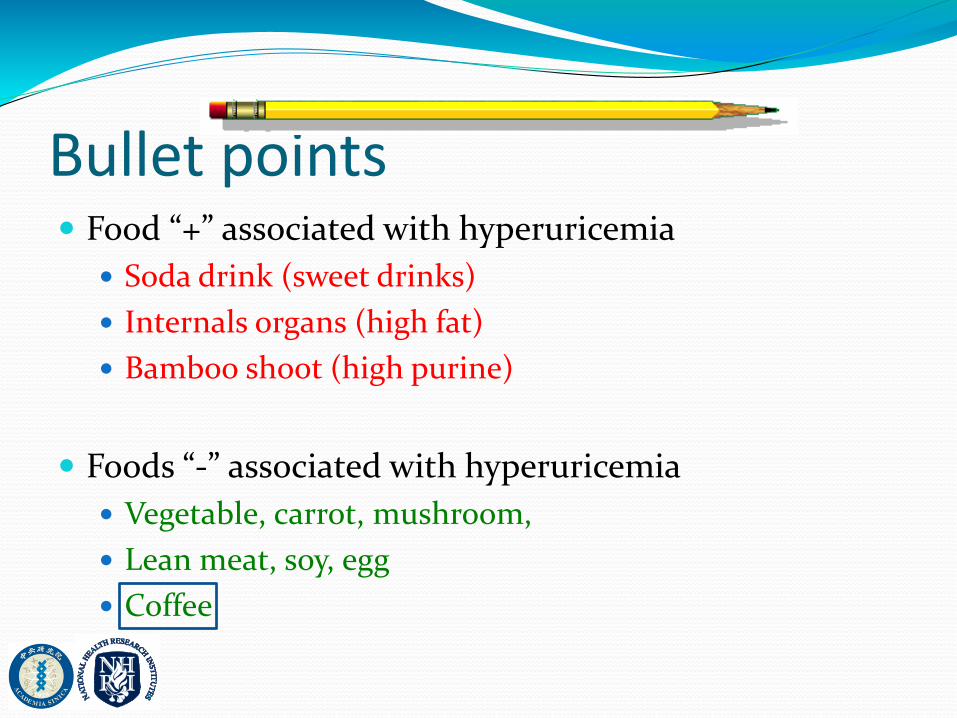
Bullet points Food “+” associated with hyperuricemia
Soda drink (sweet drinks)
Internals organs (high fat)
Bamboo shoot (high purine)
Foods “-” associated with hyperuricemia
Vegetable, carrot, mushroom,
Lean meat, soy, egg
Coffee

Risk of Asthma associated with Energy-dense but Nutrient-poor dietary pattern in Taiwanese Children Lee SC & WH Pan. APJCN 2012
2082 studentsWith ISAAC questionnaire
With FFQ dataIn NAHSIT elementary student survey
(2001-2002)
ISAAC: International Study of Asthma and Allergies in Children

The International Study of Asthma and Allergies in Childhood: ISAAC
a unique worldwide epidemiological research programme established in 1991 to investigate asthma, rhinitis and eczema in children due to considerable concern that these conditions were increasing in western and developing countries .
http://isaac.auckland.ac.nz/


RRR-derived Dietary pattern score associated with asthma in elementary school children
0
2
4
6
8
10
12
14
Q1 Q2 Q3 Q4 Q1 Q2 Q3 Q4 Q1 Q2 Q3 Q4
Current asthma Current severe asthma nocturnal cough
D ietary pattern score associated w ith asthm a
O R
Diet score associated with asthma symptom score
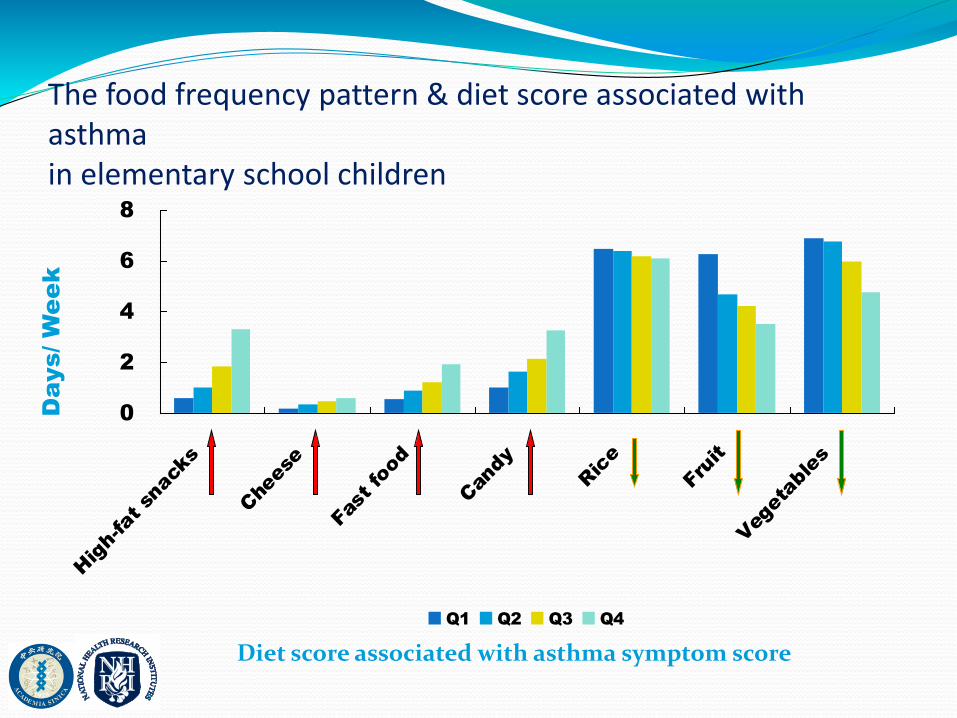
The food frequency pattern & diet score associated with asthma in elementary school children
0
2
4
6
8
Hig
h-fat sn
ack
s
Che
ese
Fas
t fo
od
Can
dy
Ric
e
Fru
it
Veg
eta
ble
s
Q1 Q2 Q3 Q4
Da
ys/ W
ee
k
Diet score associated with asthma symptom score

Summary of dietary patternstudiesFood
groups
School performance, asthma, UA, NPC, frailty
Vegetables Vegetable group (all), carrot-seaweed-dark green-mushroom-bamboo shoot (UA)
Fruits Fruit group (all)
Protein rich
foods
Lean meat-soy-egg-bony small fish-internal organ (hyperuricemia), fish-egg (NPC),
Shell fish-Deep sea fish-poultry (frailty)
Dairy Dairy group (school performance, NPC),
Cheese/fast food (asthma)
Carbohydrate Rice-candy-sweetened beverage (asthma), instant noodle-cookie-candy-sweetened
beverage (school performance), sweetened beverage (UA), whole grain-sweetened
beverage (frailty)
Whole grain (frailty)
Fats/Oils High fat/sweet snack-fried food (school performance), high fat snack-fast food (asthma)
Others
Coffee (UA, frailty), tea (NPC, frailty)

Summary We used data mining approach to find wellbeing-
related dietary patterns
Protectively associated
Vegetables, fruit, dairy
High quality protein-rich food and whole grain
Nuts/seeds
Natural beverage such as tea or coffee
Adversely associated
Candy-sweet drinks, fatty /fried/fast foods

Elaborations Current dietary guidelines and food guides focus
recommend general healthy eating pattern to follow across lifespan
People will experience some changing needs in different periods of life cycle, such as women at childbearing age, men susceptible to hyperuricemiaand gout, and elders susceptible to frailty and dementia.

More and more dimension reduction tools are made available to find dietary patterns associated with various disease conditions. Among them RRR or PLSD facilitates finding dietary patterns which maximize the degree of variation explained not only for outcomes of interest but also for food items.

We employed RRR/PLSD method to find dietary pattern inversely associated with asthma, hyperuricemia, nasopharyngeal cancer, frailty, and mild cognitive decline.
Most of the discovered dietary patterns confer with the current dietary guidelines and food guides
Certain individual foods or drinks stand out to show their potential protective functions (or harmful effects) to health conditions.
Dietary patterns associated with disease risks may contain more detailed information on foods of choice which can be used to enrich dietary guidelines tailored to needs of different stages of lifecycle or subgroups.

Conclusion Precision nutrition
Fine tuning for Different outcomes
Individuals
Comprehensive food frequency data should be valued. Natural beverage
Plant foods with different phytonutrients
Cooking method data included
Dimension reduction methods properly employed

Acknowledgement NAHSIT team in IBMS, Academia
Sinica, Taiwan
Su-Yi Hung and Naihua Yeh, MS
All Co-PIs and staffs
Yen-Li Lo, PhD
Dr. Shao-Yuan Chuang & Dr. Hsing-Yi Chang, NHRI, Taiwan
Dr. Hsin-Chou Yang, Ins Statistics, Academia Sinica

Thank you very much for your attention!

Mediterranean Diet 含豐富而多量之植物性食物(穀類、蔬菜、水果豆類、堅果種子與橄欖)
以橄欖油為油脂來源
適量至高量攝取魚類與海鮮、適量攝取蛋、禽肉與乳製品(乳酪與優格yogurt)、適量紅酒伴餐,但很少吃紅肉與肉製品。
流行病學與介入研究結果指出,此種飲食方式可降低代謝症候群、第二型糖尿病、心血管疾病、某些神經退化性疾病、癌症、衰弱症之風險。

DASH Diet得舒飲食Dietary Approach to Stop Hypertention
Total fat 27% of calories
Saturated fat 6% of calories
Protein 18% of calories
Carbohydrate 55% of calories
Cholesterol 150 mg
Sodium 2,300 mg*
Potassium 4,700 mg
Calcium 1,250 mg
Magnesium 500 mg
Fiber 30 g
Goal for a 2000 kcal Diet
* 1,500 mg of sodium was a lower goal tested and found to be even better for lowering blood pressure. It worked very well for people who already had high blood pressure, African Americans, and middle-aged and older adults.
•高鉀•高鈣•高鎂•高纖•稍高蛋白質•中脂飲食
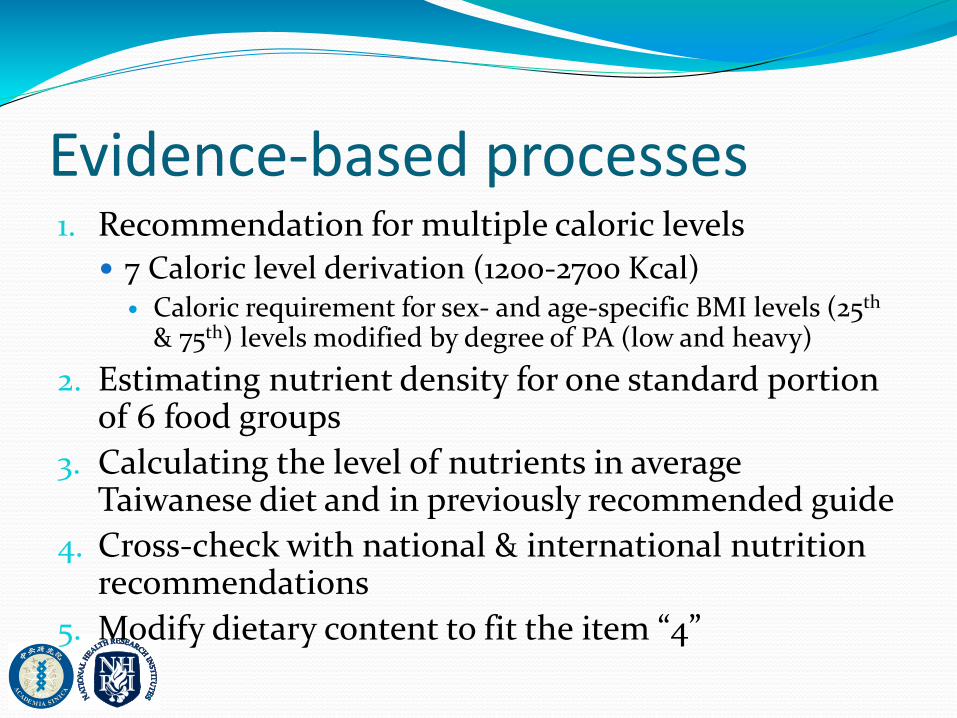
Evidence-based processes1. Recommendation for multiple caloric levels
7 Caloric level derivation (1200-2700 Kcal) Caloric requirement for sex- and age-specific BMI levels (25th
& 75th) levels modified by degree of PA (low and heavy)
2. Estimating nutrient density for one standard portion of 6 food groups
3. Calculating the level of nutrients in average Taiwanese diet and in previously recommended guide
4. Cross-check with national & international nutrition recommendations
5. Modify dietary content to fit the item “4”

National & international recommendations
Meeting DRI Vitamin A, B1, B2, niacin, B6, B12, C,
E, Ca, P, Mg, Fe, Zn
K, dietary fiber, CSI (cholesterol saturated fat index), P/S ratio
Meeting macronutrient composition of DASH Protein: fat: CHO= 17-18%: 28-29%:
54-55%

Consensus approach Dietary pattern/calories
Quality of foods (plant-based, nutrient-dense, non-refined)
Physical expenditure

*

Hazard ratios on Ischemic Strokeby folate status


Bullet points Folate is highly associated with other plant food
containing nutrients Dietary fiber
Vitamin C & carotenoins
Various minerals
It is likely that plant food intake is the protective factor for ischemic stroke.
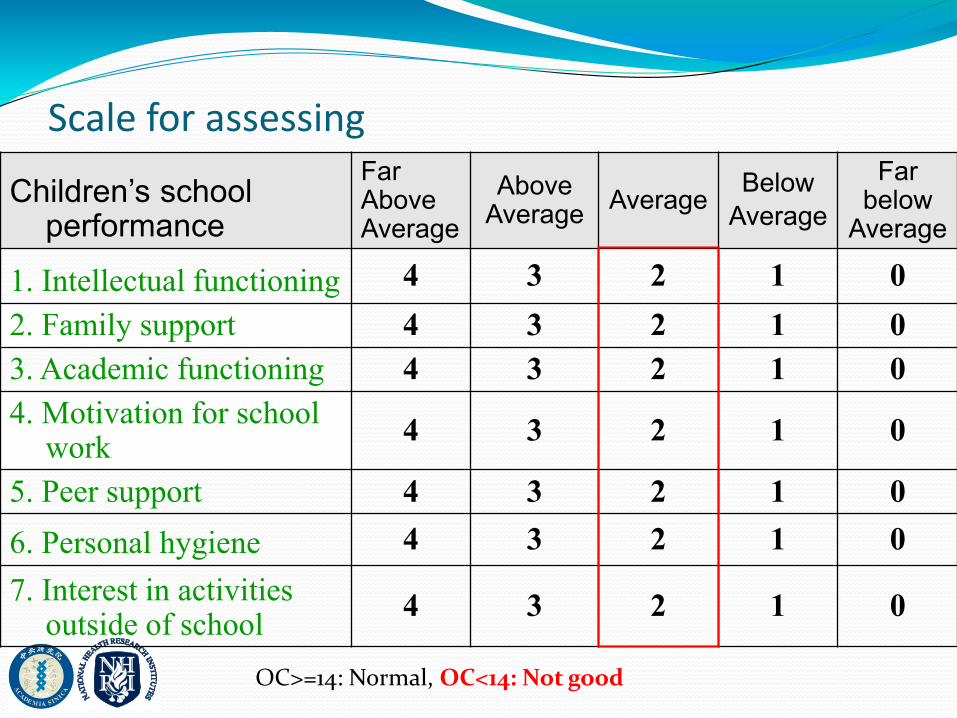
Scale for assessingOverall School Performance
Children’s school performance
Far AboveAverage
AboveAverage
AverageBelow
Average
Far below
Average
1. Intellectual functioning 4 3 2 1 0
2. Family support 4 3 2 1 0
3. Academic functioning 4 3 2 1 0
4. Motivation for school work
4 3 2 1 0
5. Peer support 4 3 2 1 0
6. Personal hygiene 4 3 2 1 0
7. Interest in activities outside of school
4 3 2 1 0
OC>=14: Normal, OC<14: Not good

• A score was calculated for each participant as a sum of the food groups, each weighted according to the factor loadings.
• Score = Dietary Pattern Loadings x Food Intake Frequency
• Participant scores were categorized into quartiles (Q1, Q2, Q3, Q4).

Dietary pattern associated with poor overall school performance in school children
5X
> 75th percentile
SF: Sweets and fried foods
HND: highly nutrient-dense food
Dairy: dairy products

Bullet points Dietary factors associating with poorer school
performance Less (dislike) nutrient dense foods (vegetables, fruit,
protein-rich foods) and dairies
More (like) high fat and sugar-containing foods and beverage
Do not eat breakfast
The more bad dietary habits, the poorer the overall school performance
Involved at least 6 food groups and 1 cooking method
•More deep-fried foods (fat)•More sweetened foods (simple carbohydrate)
•Low on vegetables and fruit•Low on dairy and protein-rich foods

Data mining to find protective or risky dietary patterns for common complex diseases: implications on devising dietary guidelines
Wen-Harn Pan, PhD, FAHA Institute of Biomedical Sciences Academia Sinica
ABSTRACT Current dietary guidelines and food guides focus primarily on adequate levels of caloric intake, healthy eating patterns
(balanced among the 6 food groups), and selecting nutrient dense foods from varieties of sources. While it is important to recommend general healthy eating pattern to follow across lifespan, people will experience some changing needs in different periods of life cycle, such as women at childbearing age, men susceptible to hyperuricemia and gout, and elders susceptible to frailty and dementia.
More and more dimension reduction tools are made available to find dietary patterns associated with various disease conditions. Among them, reduced rank regression (RRR) facilitates finding dietary patterns which maximize the degree of variation explained not only for outcomes of interest but also for food items.
Recently we employed RRR method to find dietary pattern inversely associated with asthma, hyperuricemia, nasopharyngeal cancer, frailty, and mild cognitive decline. Not only most of the discovered dietary patterns confer with the current dietary guidelines and food guides, but certain individual foods or drinks stand out to show their potential protective functions (or harmful effects) to health conditions.
Dietary patterns associated with disease risks may contain more detailed information on foods of choice which can be used to enrich dietary guidelines tailored to needs of different stages of lifecycle.
全方為飲食
全方位飲食

Content Principles on devising “Food Guide”
& ”Dietary Guideline”
Comprehensive data mining for
Dietary patterns associated with various health & wellbeing parameters