data processing & analysiscourses.washington.edu/fish538/lecturenotes/dataproc 8.pdf ·...
TRANSCRIPT

Data Processing & Analysis I

Acoustic Scattering Regions
Holliday and Pieper 1980
Lavery et al. 2002

Factors Influencing Acoustic Data Quality
1. Sensor: echosounder, transducer
2. Sampling platform: vessel, transducer mounting, electrical supply, grounding
3. Environment: water structure, surface conditions
4. Targets: behavior, material properties, orientation
5. Operator: parameter settings, biological sampling, recording
6. Analyst: size and density translations, abundance or biomass estimates

Echosounder Outputs: Sample Data
‘Raw’ Data - sample power (units watts) - sample angle (units degrees) along: fore, aft; athwart: port, starboard Processed Data - area backscatter strength: Sa - (Mean) volume backscatter strength: Sv - Nautical Area Backscattering Strength: SA, NASC - target strength: TS
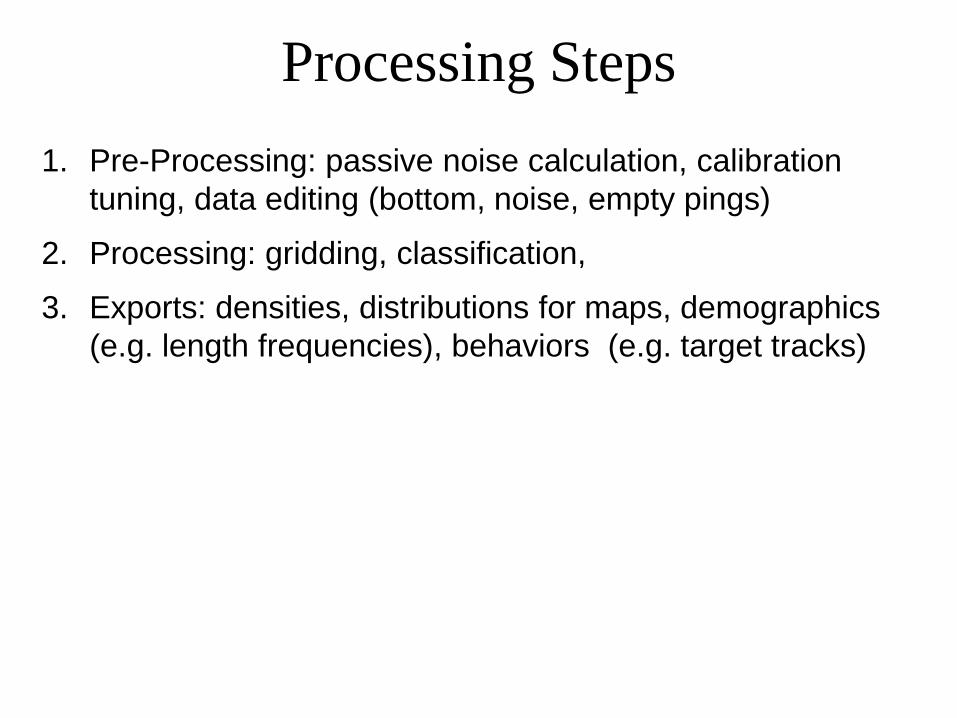
Processing Steps 1. Pre-Processing: passive noise calculation, calibration
tuning, data editing (bottom, noise, empty pings)
2. Processing: gridding, classification,
3. Exports: densities, distributions for maps, demographics (e.g. length frequencies), behaviors (e.g. target tracks)

Partitioning Backscattered Energy aka Scrutinizing
- the division of recorded backscatter into categories
- 3 components: quality control, dividing echo integrals, associating integrals with user-defined categories
- can be subjective (e.g. single frequency) or objective (e.g. multifrequency)
- each transect partitioned by operator or objective rules
- species mixtures complicates the task

Backscatter Categories Subjective: - analyst determined - species and/or size/length classes - based on prior knowledge, echogram, direct samples Objective - rule determined (*rules set by analyst*) - frequency- and/or amplitude-dependent backscatter - trawl catches for species compositions and length
frequencies and when constituents unknown - proportion energy by % species composition or weight

Mean Volume Backscatter Differencing
Sato et al. 2015

Relative Frequency Response - Choose a baseline frequency (f = 38 kHz typical) and compare
backscatter integral amplitudes to that frequency
𝑟 𝑓 =𝑆𝑣(𝑓)𝑆𝑣(𝑓𝑟𝑟𝑟)
=𝑆𝐴(𝑓)𝑆𝐴(𝑓𝑟𝑟𝑟)
𝑟𝑇 𝑓 =𝜎𝑏𝑏,𝑇,𝑖(𝑓)𝜎𝑏𝑏,𝑇,𝑖(𝑓𝑟𝑟𝑟)
For Single Targets
(Pedersen and Korneliussen 2009)
(Korneliussen and Ona 2002)

Frequency Response Example
Korneliussen and Ona 2002

o ed e p ca
DeRobertis & Ressler Goss et al.
o ed
Relative Sv strength
Jech & Michaels
Frequency differencing
Sv distribution
Training sets (pollock,
euphausiids, squid)
“Complex” classification
“Simple” classification
38, 70, & 120 kHz data
Uninformed Informed Informed empirical
Multifrequency Classification Approaches
S v
distribution S v max
amplitude
Frequency differencing
Probabilistic: Unsupervised, Semi-supervised

Unsupervised Classification Sv maximum amplitude
Original
38 kHz
70 kHz
120 kHz
38 kHz
70 kHz
120 kHz
Maximum
Sv confetti
Masked onto 38, 70, 120
Kloser et al. 2002

Unsupervised Probabilistic Classification 3 Frequency Backscatter:
5 Cluster Identification:
small fish krill
walleye pollock
krill
dense schools
ring down
back- ground
‘fish’
Anderson et al. 2007
Expectation maximization of finite mixture models

Sv relative strength, verified samples Original
Synthetic (additive colour)
38 kHz
70 kHz
120 kHz
Color scale
38 kHz
70 kHz
120 kHz
Supervised Classification: Integral Amplitude
Cochrane et al. 1991

Informed
Using verified data as training sets
Pollock Squid Euphausiids
All data
Analyst-assigned categories
Supervised Classification: Ref Library

Seimi-supervised Probabilistic Classification
Woillez et al. 2007
Generalized Gaussian mixture model with class discovery

Trawl Classification Trawl Catches, length-based single or multiple species:
- numbers and weight by species - lengths by species - lengths by sex
( )∑=
=iM
kiikijkij MNnP
1
Proportion (P) of catch by species i in length class j:
where
Mi is # hauls, nijk is number in length class j, and Nik is total # species
- equal weight by catch rate of each species
- weight by echo integrals in area

Length Frequency Data
0
50
100
150
200
5 15 25 35 45 55 65 75Length (cm)
Freq
uenc
y
HAUL 30
0
25
50
75
100
5 15 25 35 45 55 65 75Length (cm)
Freq
uenc
y
HAUL 36
0
15
30
45
60
5 15 25 35 45 55 65 75Length (cm)
Freq
uenc
y
HAUL 41
0
15
30
45
60
5 15 25 35 45 55 65 75Length (cm)
Freq
uenc
yHAUL 45
Walleye Pollock, Bering Sea, 2000
best case scenario
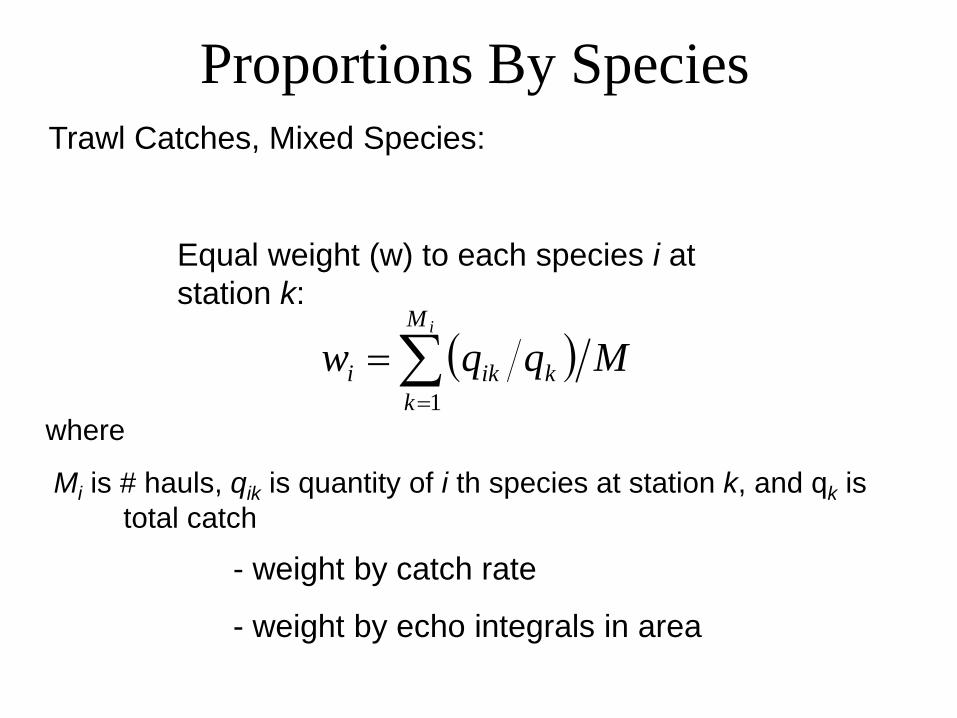
Proportions By Species Trawl Catches, Mixed Species:
( )∑=
=iM
kkiki Mqqw
1
Equal weight (w) to each species i at station k:
where
Mi is # hauls, qik is quantity of i th species at station k, and qk is total catch
- weight by catch rate
- weight by echo integrals in area

Grouping Homogeneous Regions - once all transect segments are categorized,
homogeneous regions are grouped (typically species and/or length structured)
- can use Kolmogorov-Smirnov test to examine differences in distribution of two trawl catches (Campbell 1974):
D statistic: range 0 (identical) to 1 (no similarity)
if 0.1 < p < 0.3 then samples same
0.1 threshold to incorporate sampling error

Converting Echo Integrals
- estimate density of targets ρi from the observed echo integrals Ei
where CE is a equipment calibration factor, <σbsi> is the mean backscattering cross section of class or species i
𝜌𝑖 = 𝐶𝐸𝐸𝑖𝜎𝑏𝑏𝑖

Aggregating Backscatter: SVAH
Sum Vertically
Average Horizontally
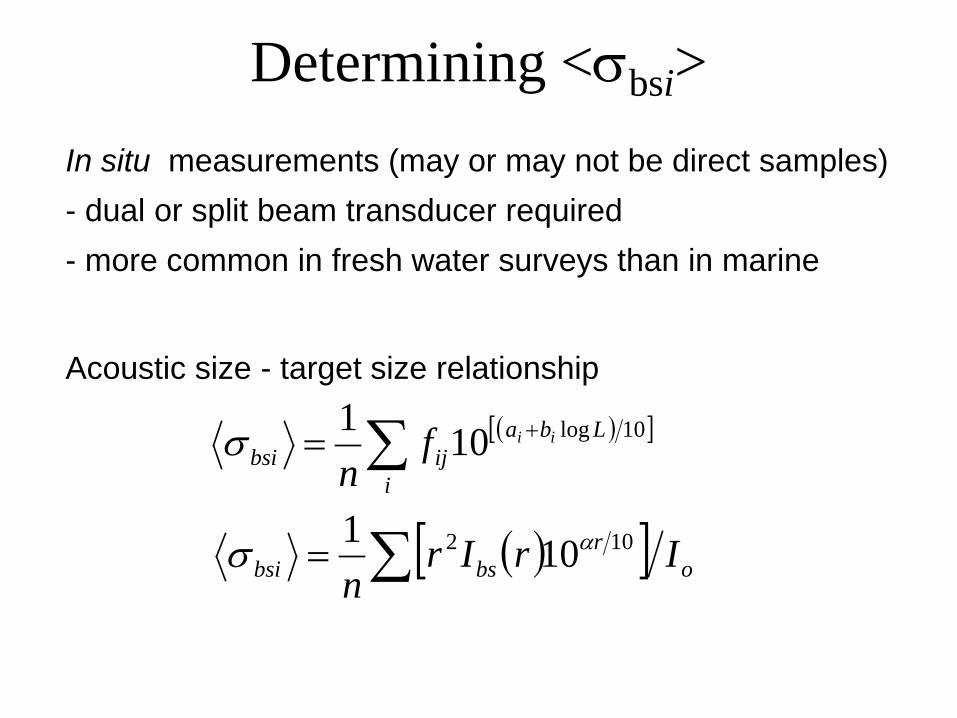
Determining <σbsi> In situ measurements (may or may not be direct samples) - dual or split beam transducer required - more common in fresh water surveys than in marine
Acoustic size - target size relationship
( )[ ]∑ +=i
Lbaijbsi
iifn
10log101σ
( )[ ]∑= or
bsbsi IrIrn
102 101 ασ

Determining <σbsi> Model estimates (requires acoustic size-animal size (length) relationship):
- numerous models available, most combine anatomical representation with material properties to estimate backscatter
∑ ∑== LLl
nLRSL
nbs
bsi *1*1σ
* log of the means ≠ mean of the logs*
RSL is a non dimensional, linear measure
)log(20)log(20 LRSLTS +=

Determining <σbsi> Challenge of Multiple species (need direct sample data):
weight by backscatter proportions using catch, catch-rate of each species, or echo integrals in vicinity of catches
Direct biomass estimate:
derive TS -Weight relationship and adjust parameters accordingly (by size class as L-W curves are non-linear)
)log(LbaTS ww +=Example: Pacific Hake (Merluccius productus)
-36 dB kg-1 for 50 to 55 cm fish (Williamson and Traynor 1984)

Abundance Estimates - calculate densities independently for each EDSU, species
or category of target, and depth interval (resolution depends on distributions of animals)
- if randomly distributed then mean density x area of interest - if contagious then calculate abundance in each region and
sum - partition abundances by length classes - interpolation among transects: area includes up to ½ the
distance between two transects, assume observed density throughout area, sum areal or volumetric estimates
- other methods: contour maps, geostatistical (e.g. kriging) - extrapolation outside of transects: don’t do it! adjust your
survey design and transect layout

Abundance/Biomass Estimates by Length
Assume you have: σbs for each length class i frequency f of each length class i known distance between transects defined homogeneous regions j length-weight relationship (a & b constants) for each length class
jibsi
jjaji fareaSN ,,,1
×××=σ
Abundance
Biomass ( )bjijiji LaNB ,,, ××=
∑∑=m
jjiji
n
iBorNTotal ,,

Intercalibration - use of multiple vessels to obtain a single estimate - new vessel replacing an older vessel
INTERCALIBRATION non-zero intercept
0.00
500.00
1000.00
1500.00
2000.00
2500.00
3000.00
3500.00
0.00 1000.00 2000.00 3000.00 4000.00
SCOTIA
TRID
ENS points
T on SS on TFunc- quiet vs non-quiet vessel
- ideally amounts will match
See also: De Robertis et al. 2008, 2010a,b,