data report and summary analyses of the u.s. west coast limited
TRANSCRIPT

Data Report and Summary Analyses of the U.S. West Coast Limited Entry Groundfish Bottom Trawl Fishery West Coast Groundfish Observer Program National Marine Fisheries Service Northwest Fisheries Science Center Fishery Resource Analysis and Monitoring Division 2725 Montlake Blvd E Seattle, WA 98112 Prepared by: Marlene A. Bellman and Eliza Heery Pacific States Marine Fisheries Commission Northwest Fisheries Science Center 2725 Montlake Blvd E Seattle, WA 98112 Publication Date: October 15, 2009

This document should be cited as follows: (NWFSC) Northwest Fisheries Science Center. 2009. Data Report and Summary Analyses of the U.S. West Coast Limited Entry Groundfish Bottom Trawl Fishery. West Coast Groundfish Observer Program. NWFSC, 2725 Montlake Blvd E., Seattle, WA 98112.
2

TABLE OF CONTENTS
INTRODUCTION............................................................................................................ 4
Overview ........................................................................................................................................................4
West Coast Limited Entry Groundfish Trawl Fishery ..............................................................................4
Commercial Groundfish Bottom Trawl Fishery Data ...............................................................................4
West Coast Groundfish Observer Program ...............................................................................................5
Program Goals...............................................................................................................................................5
METHODS ...................................................................................................................... 5
Limited Entry Groundfish Trawl Permit Selection ...................................................................................5
Coverage of the LE Groundfish Bottom Trawl Fishery ............................................................................6
Trawl Data Collection...................................................................................................................................7
Data Quality Control and Management......................................................................................................7
Data Processing .............................................................................................................................................8
Analysis ........................................................................................................................................................10
RESULTS AND DISCUSSION....................................................................................... 13
Overall Coverage Levels.............................................................................................................................13
Spatial Distribution of Observations .........................................................................................................13
Observed Total Catch, Discard Ratios, and Bycatch Ratios ...................................................................15
Biological Data Collection and Summary .................................................................................................16
Summary......................................................................................................................................................17
REFERENCES .............................................................................................................. 17
FIGURES ...................................................................................................................... 19
TABLES ........................................................................................................................ 33
APPENDIX A ................................................................................................................ 58
APPENDIX B ................................................................................................................ 59
APPENDIX C ................................................................................................................ 62
3

INTRODUCTION
Overview
This report summarizes discarded catch data collected by the West Coast Groundfish Observer Program (WCGOP) from the limited entry (LE) bottom trawl fishery from January 1, 2008 through April 30, 2009. The WCGOP collects at-sea data from LE trawl and fixed gear fisheries, as well as from nearshore, shrimp, California halibut, and deep-water fisheries. The WCGOP’s goal is to improve total catch estimates by collecting information on the discarded catch (fish returned overboard at-sea) of west coast groundfish species. The data are used in assessing and managing a variety of groundfish species.
West Coast Limited Entry Groundfish Trawl Fishery
The LE groundfish bottom trawl fishery off the west coast of the United States operates from the Canadian border to Morro Bay, California. Each vessel that participates in the LE groundfish bottom trawl fishery must have a federal groundfish permit with a trawl endorsement. In 2008, there were 179 LE trawl permits of which 10 were associated with factory processors that target Pacific hake and are observed by the At-Sea Hake Observer Program (ASHOP). Groundfish bottom trawl vessels range in size from 35 to 95 feet, with an average length of 65 feet. Vessels fish throughout the year in a wide range of depths and deliver catch to shoreside processors. Bottom trawlers often target species assemblages, which can result in diverse catch, especially when compared to single species trawl fisheries, such as the midwater trawl fishery for Pacific hake. A single groundfish bottom trawl tow often includes fifteen to twenty species. Fish size and weight of the total catch also vary widely. Groundfish trawl vessels retain the portion of their catch that is marketable and permitted to be landed. The portion of the catch which is prohibited by regulations or not marketable is discarded at-sea. Regulations for the groundfish bottom trawl fishery are set by the Pacific Fishery Management Council (PFMC). Active management of the fishery began in the early 1980’s with the establishment of optimum yields (OY’s) for several managed species and trip limits for widow rockfish, the Sebastes complex, and sablefish. The objective of trip limits has been to slow the pace of landings to maintain year-round fishing, processing, and marketing opportunities. Since the 1980’s, regulations have evolved to further separate individual groundfish species for management purposes and led to the current use of cumulative two-month trip limits for most species (PFMC 2008). Cumulative trip limits are a specified weight of fish that can be landed during a particular time period.
Commercial Groundfish Bottom Trawl Fishery Data
Fisheries managers and enforcement officers use state-issued sales receipts, referred to as fish tickets, and vessel logbooks to monitor landings and fishing behavior in the LE bottom trawl fishery. Fish ticket and vessel logbook data are transferred to the Pacific Coast Fisheries Information Network (PacFIN) regional database system by state fishery agencies in Washington, Oregon, and California. Fish ticket information is uploaded to PacFIN on a monthly basis and is subject to updates frequently thereafter. Fish tickets are trip-aggregated
4

sales receipts for market species/categories. Trip limit amounts may be changed through in-season management based on the fish ticket data. As fish tickets only provide information on the amount of fish landed, to ensure that total catch does not exceed the annual OY, managers also need discard information for each managed species. One of the best means of acquiring accurate data needed to estimate the amount of discarded catch is through an at-sea observer program.
West Coast Groundfish Observer Program
On May 24, 2001, NOAA Fisheries (National Marine Fisheries Service, NMFS) established the WCGOP in accordance with the Pacific Coast Groundfish Fishery Management Plan (50 CFR Part 660) (66 FR 20609). This regulation requires all vessels that catch groundfish in the United States Exclusive Economic Zone (EEZ) from 3-200 miles offshore to carry an observer when notified to do so by NMFS or its designated agent. Subsequent state rule-making has extended NMFS’s ability to require that California and Oregon vessels which only fish in the 0-3 mile state territorial zone also carry observers. Observers are stationed along the US west coast from Bellingham, Washington to San Diego, California.
Program Goals
The WCGOP’s goal is to improve estimates of total catch and discard by observing groundfish fisheries along the US west coast. Originally, the WCGOP focused observer effort in the LE trawl and fixed gear fisheries. In 2002, the WCGOP began deploying observers in open access fisheries while increasing its coverage of the LE trawl fishery. In 2005, the WCGOP increased its coverage of the LE fixed gear fishery and in 2006, the WCGOP improved coverage of the nearshore fishery. Currently, the WCGOP coverage goal is to maintain, at a minimum, 20% coverage of the LE trawl and fixed gear fisheries by landings, while continuing to improve coverage in the open access and nearshore fisheries. The observer coverage plan is available at: http:// www.nwfsc.noaa.gov/research/divisions/fram/observer/observersamplingplan.pdf.
METHODS
Limited Entry Groundfish Trawl Permit Selection
Limited entry groundfish trawl permits are selected for observation using stratified random sam-pling. First, the WCGOP determines the amount of time (based on available resources) it will take to observe the entire fleet; this is termed the selection cycle. The selection cycle varies due to changing priorities and observer resources. Because of the data and timeline requirements for fisheries managers and historical observer program vessel coverage, the selection cycle does not coincide with the date range of the observer data analyzed in this report. The data in this report were collected during three selection cycles. The three selection cycles were May 1, 2007 to February 29, 2008 (selection cycle 8), March 1, 2008 to October 31, 2008 (selection cycle 9), and November 1, 2008 to June 30, 2009 (selection cycle 10). For each selection cycle, the number of permits selected for observer coverage were as follows: selection cycle 8 - 108 permits; selection cycle 9 - 111 permits; selection cycle 10 – 116 permits. To avoid selecting vessels that have not been participating in the LE bottom trawl fishery, the WCGOP classified permits meeting the following criteria as inactive:
5

Permits that landed little or no non-Pacific hake groundfish during the previous 18-month period.
All permits associated with catcher-processors or motherships that only participate in the offshore component of the Pacific hake midwater trawl fishery.
Permits associated with recently sunk vessels or that are owned by deceased or terminally ill persons.
Permits associated with unidentified vessels.
Permits which were determined to be inactive were removed from all selection cycles. If a vessel becomes active during the selection cycle, they are required to notify the WCGOP and are subsequently added to the selection list. The WCGOP aggregates ports along the US west coast into port groups, which are considered sampling strata. Vessels with LE groundfish trawl permits are assigned to a port group based upon the location of the previous year’s landings. Within each port group, the vessels are randomly selected for coverage during a two-month period, which coincides with the two-month cumulative trip limit period. After the entire fleet has been selected, a new selection cycle begins. This selection process is designed to produce a logistically feasible sampling plan with a distribution of observations throughout the entire geographic range of the fishery over time. Based on this design and the current level of WCGOP funding, the program is currently cycling through the LE groundfish trawl fleet every eight to ten months. For more information on the rationale behind vessel selection, see the observer coverage plan at: http://www.nwfsc.noaa.gov/research/divisions/fram/observer/observersamplingplan.pdf
Coverage of the LE Groundfish Bottom Trawl Fishery
A list of fisheries in order of priority for observer coverage can be found in the WCGOP observer training manual (NWFSC 2008). The LE groundfish bottom trawl fleet is WCGOP’s highest priority for observer coverage. Nearly all trips taken within the two-month period by a vessel whose permit has been selected are covered by an observer. However, in some cases, vessels whose permits are selected for a specific two-month period may not be covered by an observer during that period or may not be covered on all trips during that period. A trip may be waived from observer coverage due to observer availability or a safety issue that can be fixed in a relatively short period of time. A few LE trawl vessels are given longer selection cycle waivers. A selection cycle waiver allows the vessel to fish without an observer during all trips taken during the entire selection cycle. Selection cycle waivers are given when a vessel has a serious safety concern that cannot be easily remedied. Some vessels may receive a coverage period waiver. Coverage period waivers allow a vessel to fish all trips during a two-month period without an observer. Coverage period waivers are given for a variety of reasons including observer availability and vessel safety. Vessels are given a coverage period waiver for a specified two-month period and are added to the selection list for the next two-month period. For instance, if a vessel is given a coverage period waiver for January 1 through February 28, that vessel is automatically selected for observer coverage for
6

the period March 1 through April 30. Vessels continue to be added in the subsequent selection list until either an observer covers them or until the selection cycle ends.
Trawl Data Collection
Fisheries observers are trained professionals who monitor and record catch data on commercial fishing vessels by following protocols in the WCGOP Manual (NWFSC 2008). Data collected by the observers on a trip basis include:
• Start time, end time, depth, and the start and end location of tows
• Gear type and fishing strategy
• Fish ticket identification numbers
Data collected by the observers on a tow basis include:
• Estimated total catch weight (including tows for which there is 100% discard)
• Weight of discard by catch category
• Reason for discard by catch category or species
• Species composition of discard by catch category
• Weight of fish retained by catch category which is generally copied from vessel logbooks
• Catch of prohibited species and incidental take of protected species
• Size composition, tags, and viability assessments for Pacific halibut
• Size composition of discarded fish
• Basic taxonomic composition of non-fish bycatch
• Biological collections (otoliths, maturity, food habits, genetic samples, etc.)
For more information regarding observer sampling on trawlers, refer to the WCGOP Observer Training Manual, Chapter 4.
Data Quality Control and Management
The WCGOP uses the following procedure to ensure that the quality of data collected is main-tained:
1. Data are collected at-sea by the observer following protocols in the WCGOP Manual (NWFSC 2008).
2. Data are entered into a secure database system. A database table hierarchy is located in Appendix A.
3. Observers are debriefed by WCGOP staff after every two-month period. The debriefing includes:
• Calculation, Data Form, and Sampling Methodology Checks - Observers send data to a debriefer on a monthly basis. The debriefer checks all calculations for accuracy, reviews data forms for completeness, and ensures appropriate sampling methodologies were
7

• Observer Logbook Review - Observers keep logbooks detailing the events of each trip, basic deck schematics, sampling methods used, communication logs, and confirmation of a current safety decal. Any tows during which sampling problems occurred are documented in the logbook and reviewed during debriefing.
• Interview - The observer is interviewed by the debriefer. During the interview, sampling methodologies employed on all trips are discussed and data errors are updated.
• Evaluation - Observers are evaluated on their performance based upon WCGOP generated criteria.
• Data Entry Check - Electronic data are compared to the raw data for keypunch errors. Also, all corrections discovered during debriefing are updated in the database program.
4. Database Quality Control Queries - Quality control queries are run to detect data that fall outside specified ranges and identify other inconsistencies between data elements. These database quality control queries are run every six months to a year on all data collected during a specified time period.
5. Database Update - The raw data from all entries that are highlighted by the quality control queries are reviewed and the electronic data are updated.
Data Processing
Data processing includes the following steps: expand the subsample of species composition to the tow-level; translate observer species codes to the appropriate PacFIN fish ticket data codes; identify and select the observer data records to match to fish tickets; query and process all PacFIN fish ticket data associated with the LE groundfish bottom trawl fishery; and merge observer data and fish ticket data. The translation of WCGOP to PacFIN species codes allows a more seamless match of observer data with fish ticket data and provides consistent information for calculating observer coverage of overall fishery landings. The WCGOP database administrator expands the subsamples of catch categories to the tow level. A tow-level expansion is needed to estimate the total retained and discarded weight for each species because the sampling procedure used to collect the species composition data allows for subsampling of the population. The following equation is used to calculate the weight of the subsample by summing across the observed weights of the individual species:
s
ksk xw
where: xks= observed weight of the species s in catch category k in the subsample wk = weight of the subsample from catch category k
The sampling ratio (Rk) used to scale the subsample weights to the amount in the catch category is calculated by dividing the weight of the subsample by the total weight of the catch category
8

using the equation:
kkk ywR /
where:
yk = the total weight of catch category k The tow-level expanded weight of species s in category k is calculated by dividing the species weight in the subsample by the sampling ratio in the following equation:
kksks RxX /
where:
Xks= the weight of species s in catch category k Tallying the weight (Xks) of the species (s) across all categories (k) within a tow provides the total weight of the species retained or discarded. Once the tow-level expansion is complete, a data file that includes all fields necessary for the analysis is produced. Observer data that meet the following criteria are removed for the fish ticket matching process:
• Trips with tows where no retained or discarded information is recorded.
• All discarded catch information.
• Trips where no fish ticket could be found.
• Partial trips (trips where the vessel was observed for less than 100% of their landed catch).
Next, the translation step of the process adds coding to the WCGOP observer data that allows for the appropriate match to the coding system used to record data on fish tickets in PacFIN. Once these two steps are completed, the retained catch records from the observer data, which are typically vessel supplied estimates, are merged with fish ticket data to provide more accurate estimates of retained catch. The WCGOP data are linked to fish tickets by direct fish ticket number(s) obtained by the observer and/or by comparing the return date recorded by the observer with the dates of fish tickets from the vessel. For trips with multiple fish tickets, the fish ticket data are combined for analysis purposes. For trips with missing fish tickets, the observer retained catch data are not adjusted. The WCGOP data are adjusted so that the total trip pounds of retained fish in a catch category matches the total trip pounds on the fish ticket, because the fish ticket weight is often more accu-rate and fish tickets are legally binding documents. To match the total trip pounds, the weights within each observer retained catch category are scaled up or down by the ratio of fish ticket and observer trip weights for that category, using the following equation to calculate the adjustment
9

factor:
k
mtkmtkmtk xxA /
where:
xmtk = lbs in catch category k in tow t in trip m Amtk = adjustment factor used for catch category k in tow t in trip m
The equation used to adjust the WCGOP data is:
mkmtkmtk CAx
where:
Cmk = lbs in catch category k for trip m recorded on the fish ticket When a catch category in the WCGOP data cannot be matched to a fish ticket catch category, the WCGOP data are not adjusted. Catch categories found only on the fish tickets are distributed across the observed tows using the proportion of the observed catch per tow divided by the total observed catch per trip using the following equation:
mkmtmtk
t k smtks
k smtks
mt
CBC
x
xB
where:
Bmt= the proportion of observed catch in tow t in trip m Cmtk = lbs in catch category k for tow t in trip m recorded on the fish ticket
Upon completion of the observer data merge and adjustment with fish ticket data, the data that had been previously removed for the matching process are then incorporated back into the data file for analysis.
Analysis
Observer coverage rates in the LE groundfish bottom trawl fishery were calculated as the propor-tion of this fishery’s fleet-wide landings of Pacific Coast Groundfish Fishery Management Plan (FMP) groundfish (except Pacific hake) that were observed (Appendix B). Coverage rates were computed based on the complete dataset for 2008 and January through April of 2009. After coverage rates were calculated but prior to subsequent analyses, data that met the following criteria were removed:
• Data where WCGOP data quality standards were not met.
10

• Tows where no retained or discarded information was recorded.
• Tows where the species composition of discarded catch was not known (unsampled dis-card).
Although all of the vessels included in the sampling frame described in this report are participants in the LE groundfish bottom trawl fishery, it is necessary to remove some portions of the LE trawl data prior to analysis for two reasons. First, after being selected, some LE bottom trawl vessels may switch to midwater trawl gear, which typically yields a species catch composition and discard/bycatch trends that are distinct from the bottom trawl fleet. All midwater trawl tows are therefore removed from the dataset prior to subsequent analyses. However, none of the observed tows in 2008 or January through April of 2009 were recorded to have employed midwater trawl gear. Second, some LE bottom trawl vessels participate in more than one fishery on a single observed trip. This is primarily an issue in California, where LE bottom trawl vessels may also participate in the state-permitted California halibut fishery. California halibut tows can occur on the same trip as tows targeting groundfish and are identified in the LE bottom trawl dataset based on the following criteria:
• The observer recorded the tow target as California halibut.
• The observer recorded the tow target as nearshore mix, sand sole or other flatfish, and the tow took place in less than 30 fathoms and south of 40°10' N. latitude.
All tows that met at least one of the above requirements were removed from the LE bottom trawl dataset and excluded from further analysis. The LE bottom trawl data removed from this analysis for the California halibut fishery are reported in the annual update of the report “Data Report and Summary Analyses of the West Coast California Halibut Trawl Fishery” (NMFS 2008a). Once these steps had been applied, the ratio estimator technique (Cochran 1977) was used to estimate bycatch and discard rates for each major species or species group. Rates were calculated for all of the stocks currently managed under rebuilding plans, as well as stocks for which discard is estimated annually on a fleet-wide basis. Bycatch and discard information for prohibited and protected resources such as Pacific halibut, salmon, green sturgeon, marine mammals, seabirds, and sea turtles are provided in separate reports, which are available electronically at www.nwfsc.noaa.gov/research/ divisions/fram/observer/datareport/index.cfm. The ratio estimates (R ) were calculated by area (i), season (j) and depth (d): i
t t
ijdtijdtijd xyR /
where:
y = the discarded or total catch pounds of a species in tow t, area i, season j, and depth d
ijdt
x = the retained pounds of FMP groundfish species (except Pacific hake) in tow t, area i, season j, and depth d
ijdt
11

The variance of R is approximated by using the following equation: ijd
2
2
2
2
2
2
2
22)()()()(
)(ijd
ijdt
ijd
ijdt
ijd
ijdt
ijd
ijdt
ijd
ijdijd
x
xs
y
ys
x
xs
y
ys
x
yRVar
where:
ijdx and ijdy = the means of x and y over the tows in area i, season j, and depth d it it
s (x ) and s (y ) = the standard errors of x and y over all tows in area i, season j, anddepth d
2ijdt
2ijdt it it
This variance estimator is that which was employed by Pikitch et al. (1998) and is based on methods presented by Cochran (1977). Note that Var (R ) cannot be calculated when x = 0 or y = 0 for all sets and should be considered with extreme caution when R is equal to one. In order to best support fishery management, variance was calculated separately for data in each geographic area, season and depth. Variance estimates, therefore, do not relate back directly to the random stratified sampling framework employed by the WCGOP, where vessels within each port group were the sampling unit.
ijd ijdt
ijdt ijd
Discard ratios were computed as the observed discard weight of each species over the observed weight of all retained groundfish species listed in the Pacific Coast Groundfish FMP, except Pacific hake. Similarly, bycatch ratios were calculated as the observed total catch weight (dis-carded + retained) divided by the observed weight of retained FMP groundfish (except Pacific hake). Pacific hake was excluded when using a retained groundfish denominator because it is inappropriate to include retained hake as a metric of effort in the LE bottom trawl fishery. Vessels that land this species are considered to be targeting Pacific hake exclusively and are thus part of a separate fishery. In all cases where a FMP groundfish species grouping was used to compute discard and bycatch ratios, any retained weights that were recorded by the observer but that did not appear on fish tickets were excluded from the denominator. This was necessary to prevent double-counting associated with differences in the species codes used by observers and processors. For instance, while observers may record rockfish catch at the species level, various species of rockfish are often grouped, weighed, and recorded together by the processor under a grouped species code such as NUSP - northern unspecified slope rockfish. In some cases, this difference in species coding prevents observer and fish ticket weights from matching and adjusting properly. Species coding on fish tickets varies considerably between processors and over time, and it is not possible to make assumptions regarding which individual observer-recorded species likely coincide with species grouping codes on fish tickets. Instead, by using only the retained groundfish weight from fish tickets in discard and bycatch ratio denominators, we prevent double-counting of retained weights. This is not a factor when using a single species in the denominator, such as sablefish in the fixed gear fisheries, as any retained weights in observer and fish ticket data that share the same species code will match and adjust properly.
12

RESULTS AND DISCUSSION
Overall Coverage Levels
The total number of observed trips, tows, vessels, and observed and total fleet-wide groundfish landings in the LE bottom trawl fishery are summarized in Table 1 for 2008 and for January through April of 2009. The observed coverage rate, calculated as the proportion of fleet-wide non-hake FMP groundfish landings observed, is provided with summaries for each WCGOP port group, two geographic areas north and south of the groundfish management line at 40°10' N. lati-tude, and for the entire US west coast. Observer coverage in the LE bottom trawl fishery in 2008 increased on a coastwide basis relative to 2007 from 18% to 22% (NMFS 2008b). Overall, coverage was higher in the area north of 40°10' N. latitude (22%) than in the area south of this line (19%). When split out by port group, Astoria had the highest rate of observer coverage at 25%, followed by Eureka and San Francisco, which both had coverage rates of 24%. During January through April of 2009, landings from observed LE bottom trawl trips were 23% of the total tonnage for all LE bottom trawl trips. The early 2009 coverage level indicates a consistent rate in the current calender year which is above the target of 20% coverage.
Spatial Distribution of Observations
The distribution of observed trips and tows among port groups provides perspective on where observer coverage and, secondarily, fishing effort was focused along the US west coast in the LE groundfish bottom trawl fishery. Overall, observed trips were distributed throughout west coast port groups from Bellingham to Morro Bay, with peaks in Astoria (126 trips) and San Francisco (86 trips). Relative to 2007, coverage levels in 2008 were up in all port groups except for Fort Bragg, where it decreased from 24% to 15%, and Monterey/Morro Bay/Santa Barbara, where it decreased from 16% to 8% (NMFS 2008b). Fort Bragg, Monterey/Morro Bay/Santa Barbara, and Neah Bay were the only port groups where coverage fell below the target of 20%. In the Neah Bay port group, 30.6 mt of groundfish were landed by limited entry trawl vessels throughout the year with no observer coverage. Coverage in the Monterey/Morro Bay/Santa Barbara port groups is reported in Table 1 as 8%. In collaboration with The Nature Conservancy (TNC), the WCGOP has observed one trawl vessel out of Morro Bay during periods other than those selected randomly. However, coverage rates summarized in Table 1 for the Monterey/Morro Bay/Santa Barbara port groups represent only those trips that were observed under the random stratified sampling design, and not the remaining trips observed outside of the selected periods for this vessel. Coverage levels are subject to variation for several reasons. The WCGOP can control the number of boats observed, but not the amount of fish landed by these boats or the location of fishing effort. Coverage levels will fluctuate as a function of the amount of fish landed in a fishery and the amount of fish landed by the vessels observed, but these fluctuations are to be expected.
13

In 2008, spatial closures were employed in the LE groundfish trawl fishery by groundfish man-agement. The Rockfish Conservation Area (RCA) closures in this fishery are the most complex in terms of latitudinal stratification and the variety of depth-related boundaries in use. Latitudinal stratification used in 2008 included the following: north of 48° 10’ N. latitude, 48° 10’ to 46° 38.17’ N. latitude, 46° 38.17’ to 46° 16’ N. latitude, 46° 16’ to 45° 46’ N. latitude, 45° 46’ to 43° 20.83’ N. latitude, 43° 20.83’ to 42° 40.50’ N. latitude, 42° 40.50’ to 40° 10’ N. latitude, and south of 40° 10’ N. latitude. Overall, boundaries were set anywhere from the shoreline out to 200 fathoms during 2008. The shoreward boundary was set at either 60 or 75 fathoms, when it was not extended to the shoreline in all of the latitudinal areas north of 40° 10’ N. latitude. The RCA in the area south of 40° 10’ N. latitude was set from 100 to 150 fathoms throughout the entire year. Maps summarizing the spatial distribution of all LE bottom tows recorded in trawl logbooks and tows observed are presented for three sections of the US west coast in Figures 1a-c. In these fig-ures, trawl tows were assigned to 10 km by 10 km grid blocks based on the starting locations of tows. The shading of each block reflects the number of trawl logbook tows, with darker shading indicating more tows. The circles overlaid on each block reflect the number of observed tows, with larger circles indicating more tows. Blocks with the darkest shading and the smallest circles indicate fishing locations that received less observer coverage relative to fishing effort. The spatial distribution of the LE trawl fleet and those tows observed by the WCGOP can be reviewed for general spatial sampling coverage in 2008. Figure 1a depicts the coast north of Coos Bay, Oregon. Figure 1b presents the area south of Coos Bay, Oregon to just north of San Francisco, California. Figure 1c portrays the remainder of the California coast with bottom trawl fishing effort, as far south as Morro Bay. Coastwide, the spatial distribution of fleet-wide LE bottom trawl tows appears to have been generally well sampled by observers during 2008. However, there are several distinct areas on the Oregon continential shelf where vessels fished in 2008 but there was no observer coverage of tows in those areas (Figures 1b-1c). Based on trawl logbook data, vessels fishing in those particular areas were observed in 2008, but during other times of the year when they were fishing in different locations. Spatially, there was less overall fishing effort on the Washington continential shelf in 2008 relative to 2007. Coastwide, observer coverage demonstrated a very high correspondence to those areas with high fishing effort by the fleet on the continential slope. Table 2 presents the number of tows and retained weight of non-hake FMP groundfish from observer and logbook data separated by management area (north and south of 40° 10’ N. latitude), depth interval (0-125, 126-250, and > 250 fathoms) and season (winter: November through April, summer: May through October). This provides an alternative form of observer coverage rate for the 2008 LE bottom trawl fishery that is based on observer and logbook tows rather than fleet-wide fish ticket landings. A similar table for the 2007 LE bottom trawl fishery was provided in the groundfish total mortality report (Bellman et al. 2008, Table 1), although the table used a finer level of depth stratification. The finer level of stratification used in previous years analyses required that strata routinely be combined across depth or season to ensure an adequate sample size for analysis. It is unclear how the process of combining strata may influence discard and bycatch ratios. The validity of stratification in terms of isolating variance in discard has not yet been ojectively tested. Until more work can be completed to evaluate
14
which strata (area/depth/season) are most appropriate for this discard analyis, broader stratification is warrented. Thus, broader depth strata were used in the present analysis, which continue to highlight the areas shoreward and seaward of RCA closures relevant in the fishery management framework. Broader depth stratification are also necessary for consistency when evaluating discard or bycatch over time, as depth-based spatial closures change on a yearly basis. The depth strata utilized in this report were also used in analyses which evaulated discard and total mortality estimates over time, using all available years of WCGOP data from 2002-2008 (Bellman and Heery In Review).
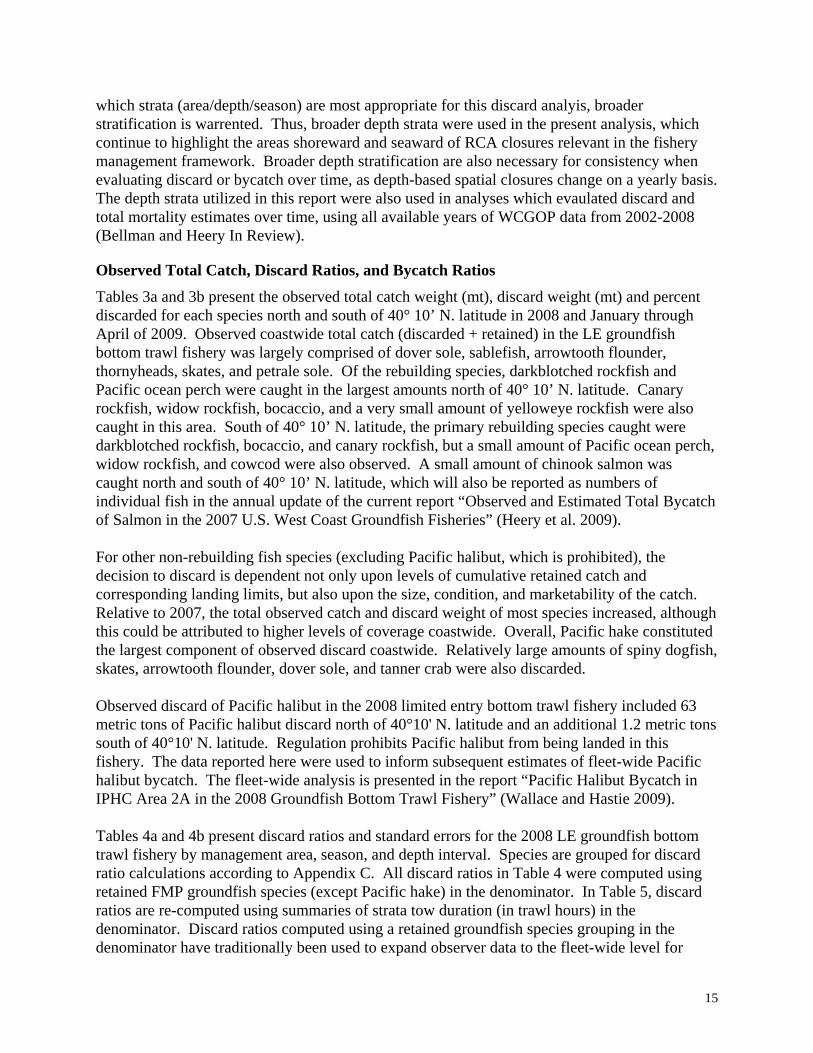
Observed Total Catch, Discard Ratios, and Bycatch Ratios
Tables 3a and 3b present the observed total catch weight (mt), discard weight (mt) and percent discarded for each species north and south of 40° 10’ N. latitude in 2008 and January through April of 2009. Observed coastwide total catch (discarded + retained) in the LE groundfish bottom trawl fishery was largely comprised of dover sole, sablefish, arrowtooth flounder, thornyheads, skates, and petrale sole. Of the rebuilding species, darkblotched rockfish and Pacific ocean perch were caught in the largest amounts north of 40° 10’ N. latitude. Canary rockfish, widow rockfish, bocaccio, and a very small amount of yelloweye rockfish were also caught in this area. South of 40° 10’ N. latitude, the primary rebuilding species caught were darkblotched rockfish, bocaccio, and canary rockfish, but a small amount of Pacific ocean perch, widow rockfish, and cowcod were also observed. A small amount of chinook salmon was caught north and south of 40° 10’ N. latitude, which will also be reported as numbers of individual fish in the annual update of the current report “Observed and Estimated Total Bycatch of Salmon in the 2007 U.S. West Coast Groundfish Fisheries” (Heery et al. 2009). For other non-rebuilding fish species (excluding Pacific halibut, which is prohibited), the decision to discard is dependent not only upon levels of cumulative retained catch and corresponding landing limits, but also upon the size, condition, and marketability of the catch. Relative to 2007, the total observed catch and discard weight of most species increased, although this could be attributed to higher levels of coverage coastwide. Overall, Pacific hake constituted the largest component of observed discard coastwide. Relatively large amounts of spiny dogfish, skates, arrowtooth flounder, dover sole, and tanner crab were also discarded. Observed discard of Pacific halibut in the 2008 limited entry bottom trawl fishery included 63 metric tons of Pacific halibut discard north of 40°10' N. latitude and an additional 1.2 metric tons south of 40°10' N. latitude. Regulation prohibits Pacific halibut from being landed in this fishery. The data reported here were used to inform subsequent estimates of fleet-wide Pacific halibut bycatch. The fleet-wide analysis is presented in the report “Pacific Halibut Bycatch in IPHC Area 2A in the 2008 Groundfish Bottom Trawl Fishery” (Wallace and Hastie 2009). Tables 4a and 4b present discard ratios and standard errors for the 2008 LE groundfish bottom trawl fishery by management area, season, and depth interval. Species are grouped for discard ratio calculations according to Appendix C. All discard ratios in Table 4 were computed using retained FMP groundfish species (except Pacific hake) in the denominator. In Table 5, discard ratios are re-computed using summaries of strata tow duration (in trawl hours) in the denominator. Discard ratios computed using a retained groundfish species grouping in the denominator have traditionally been used to expand observer data to the fleet-wide level for
15

coastwide discard estimation in the LE groundfish bottom trawl fishery (Bellman et al. 2008). Tables 6a and 6b provide bycatch ratios for the 2008 LE groundfish bottom trawl fishery. All bycatch ratios for this fishery were computed using retained FMP groundfish species (except Pacific hake) in the denominator. Bycatch ratios for rebuilding species are presented in Figure 2 for all years observed. Relative to 2007, bycatch ratios for most rebuilding species decreased slightly north of 40° 10’ N. latitude. The bycatch ratio for yelloweye rockfish did go up slightly in this area, with the ratio for this species slightly higher in the summer between 0 and 125 fathoms. South of 40° 10’ N. latitude, bycatch ratios for bocaccio and widow rockfish increased slightly from 2007 to 2008. Figure 3 displays pie charts representing the percentage of observed tows in which rebuilding species were caught by management area. Overall, no catch of rebuilding species (0 pounds) was observed on more than 75% of bottom trawl tows. On a percentage basis, darkblotched rockfish was caught most frequently, as 23% of observed tows caught this species north of 40˚10’ N. latitude. Pacific ocean perch was the next most commonly encountered species, with catch recorded on 19% of observed tows in the northern strata. For many rebuilding species, catch was observed on less than 5% of bottom trawl tows in each strata (i.e. north – bocaccio, canary, widow, and yelloweye rockfish; south – cowcod, Pacific ocean perch, canary, widow, yelloweye rockfish).
Biological Data Collection and Summary
WCGOP observers primarily collect length or sexed lengths from non-protected resources although in some circumstances they also collect otoliths or viabilities. Biological data are col-lected from randomly selected individuals within a species composition sample and only from the discarded portion of the total catch. Biological data collected in the LE groundfish bottom trawl fishery for non-protected resources from September 2003 through April 2009 are summarized in Table 7. Biological data were only summarized in this report for species with more than 30 observations. The length frequency distributions of discarded rebuilding species from biological data are reported for the LE groundfish bottom trawl fishery in Figure 4. Figure 5 presents length fre-quency distributions of other discarded groundfish species. For protected resources, including any species regulated under the Endangered Species Act (ESA), additional types of biological data are collected whenever possible. It is the policy of the WCGOP to collect lengths, photographs, and tissue samples from all green sturgeon observed, as well as sexes and fin ray samples from all dead individuals. For salmon, observers record length and sex for all individuals, as well as record weight, note presence or absence of an adipose fin, and collect scales and snouts. Information regarding biosampling procedures for marine mam-mals, seabirds, green sturgeon, and salmon is available in the WCGOP observer training manual (NWFSC 2008). Table 8 summarizes the biological data for protected fish resources collected by observers in the LE groundfish bottom trawl fishery from September 2003 through April 2009. Across all years, observers sampled a total of 554 chinook salmon, 8 coho salmon, 2 chum salmon, and 3
16

unidentified salmon.
Summary
Bycatch and discard rates calculated from observer data collected in the LE bottom trawl fishery from January 2008 through April 2009 are now available for use in the management process. The observer data will be used in conjunction with additional commercial bottom trawl fishery data to inform current fishery management in projection modeling of bycatch. In addition, these discard rates will be used to estimate discard at the fleet-wide level to account for annual coastwide mortality in this fishery. The collected biological data will also be available for use by stock assessment authors.
REFERENCES
Cochran, W.G. 1977. Sampling Techniques. John Wiley & Sons, New York. 155 p. Bellman, M.A., Heery, E., and J. Hastie. 2008. Estimated Discard and Total Catch of Selected Groundfish Species in the 2007 U.S. West Coast Fisheries. Northwest Fisheries Science Center, 2725 Montlake Blvd E, Seattle, WA. Available at http://www.nwfsc.noaa.gov/research/ divisions/fram/observer/datareport/docs/TotalMortality_update2007.pdf Heery, E.H., Bellman, M.A., and J. Hastie. 2009. Observed and Estimated Total Bycatch of Salmon in the 2007 U.S. West Coast Groundfish Fisheries. Northwest Fisheries Science Center, 2725 Montlake Blvd E, Seattle, WA. Available at http://www.nwfsc.noaa.gov/research/ divisions/fram/observer/datareport/docs/salmon_mortality_2007.pdf National Marine Fisheries Service (NMFS). 2008a. Data Report and Summary Analyses of the West Coast California Halibut Trawl. NOAA, Northwest Fisheries Science Center, 2725 Montlake Blvd E, Seattle, WA. Available at http://www.nwfsc.noaa.gov/research/divisions/ fram/observer/datareport/docs/ca_halibut_final08.pdf National Marine Fisheries Service (NMFS). 2008b. West Coast Groundfish Observer Program Data Report and Summary Analyses of the West Coast Limited Entry Groundfish Bottom Trawl Fishery. NOAA, Northwest Fisheries Science Center, 2725 Montlake Blvd E, Seattle, WA. Available at http://www.nwfsc.noaa.gov/research/divisions/fram/observer/datareport/docs/ limited_entry_trawl_obs_rpt_oct08.pdf. Northwest Fisheries Science Center (NWFSC). 2008. West coast groundfish observer training manual. NOAA, West Coast Groundfish Observer Program. Northwest Fisheries Science Center, 2725 Montlake Blvd E, Seattle, WA. Available at http://www.nwfsc.noaa.gov/research/ divisions/ fram/observer/observermanual/observermanual.cfm. Pacific Fishery Management Council (PFMC). 2008. Pacific Coast Groundfish Fishery Manage-ment Plan for the California, Oregon, and Washington Groundfish Fishery as Amended through Amendment 19. PFMC, 7700 NE Ambassador Place, Suite 100, Portland, OR. Available at: http://www.pcouncil.org/groundfish/gffmp/fmpthru19.pdf.
17

Pikitch, E.K., Wallace, J.R., Babcock, E.A., Erikson, D.L. Saelens, M., and G. Oddsson. 1998. Pacific halibut bycatch in the Washington, Oregon, and California groundfish and shrimp trawl fisheries. N. Am. J. Fish. Mgmt. 18:569-586. Wallace, J., and J. Hastie. 2009. Pacific Halibut Bycatch in IPHC Area 2A in the 2008 Groundfish Bottom Trawl Fishery. NOAA, Northwest Fisheries Science Center, 2725 Montlake Blvd E, Seattle, WA.
18

FIGURES
Figure 1a. Locations of observed and fleet logbook trawl tows north of Coos Bay, Oregon in 2008.
19

Figure 1b. Locations of observed and fleet logbook trawl tows south of Coos Bay, Oregon and north of San Francisco, California in 2008.
20

Figure 1c. Locations of observed and fleet logbook trawl tows south of San Francisco, California in 2008.
21

Figure 2. Bycatch ratios of rebuilding species for all observed years from the limited entry groundfish bottom trawl fishery by management area; north (solid circles) and south (outlined circles) of 40˚10’ N. latitude. Bycatch ratios were computed as the observed total catch of rebuilding species divided by the weight of retained FMP groundfish (excluding Pacific hake).
2002 2003 2004 2005 2006 2007 2008
0.00
00.
004
0.00
8
Bocaccio
year
Byc
atch
rat
io
NorthSouth
2002 2003 2004 2005 2006 2007 2008
0.00
000.
0010
0.00
200.
0030
Canary rockfish
year
Byc
atch
rat
io
NorthSouth
2002 2003 2004 2005 2006 2007 2008
0e+
002e
-04
4e-0
46e
-04
8e-0
4
Cowcod
year
Byc
atch
rat
io
NorthSouth
2002 2003 2004 2005 2006 2007 2008
0.00
00.
005
0.01
00.
015
Darkblotched rockfish
year
Byc
atch
rat
io
NorthSouth
22

Figure 2 continued. Bycatch ratios of rebuilding species for all observed years from the limited entry groundfish bottom trawl fishery by management area; north (solid circles) and south (outlined circles) of 40˚10’ N. latitude. Bycatch ratios were computed as the observed total catch of rebuilding species divided by the weight of retained FMP groundfish (excluding Pacific hake).
2002 2003 2004 2005 2006 2007 2008
0.00
00.
004
0.00
80.
012
Pacific ocean perch
year
Byc
atch
rat
io
NorthSouth
2002 2003 2004 2005 2006 2007 2008
0.00
00.
001
0.00
20.
003
0.00
4
Widow rockfish
year
Byc
atch
rat
io
NorthSouth
2002 2003 2004 2005 2006 2007 2008
0e+
004e
-05
8e-0
5
Yelloweye rockfish
year
Byc
atch
rat
io
NorthSouth
23

Figure 3. Pie charts showing the percentage of observed tows during which rebuilding species were caught (0, 1-15, 16-50, 51-150, 151-300, > 300 lbs) in the 2008 limited entry groundfish bottom trawl fishery by management area.
84.5%
7.9%
3.9%
2.8%
BocaccioSOUTH of 40'10'N
Percentage of hauls that caught:
0 lbs1-15 lbs16-50 lbs51-150 lbs151-300 lbs>300 lbs
99.7% 0.1%
BocaccioNORTH of 40'10'N
97%
2.2%
Canary rockfishNORTH of 40'10'N
94.1%
5%0.7%
Canary rockfishSOUTH of 40'10'N
98.9% 0.9%
CowcodSOUTH of 40'10'N
24

25
Figure 3 continued. Pie charts showing the percentage of observed tows during which rebuilding species were caught (0, 1-15, 16-50, 51-150, 151-300, > 300 lbs) in the 2008 limited entry groundfish bottom trawl fishery by management area.
77.3%
11.7%
4.9%
3.3%1.1%
Darkblotched rockfishNORTH of 40'10'N
91%
6.1%
1.1%
Darkblotched rockfishSOUTH of 40'10'N
Percentage of hauls that caught:
0 lbs1-15 lbs16-50 lbs51-150 lbs151-300 lbs>300 lbs
81.2%
8.1%
3.9%
4%1.2%
Pacific ocean perchNORTH of 40'10'N
98.9% 1.1%
Pacific ocean perchSOUTH of 40'10'N

Figure 3 continued. Pie charts showing the percentage of observed tows during which rebuilding species were caught (0, 1-15, 16-50, 51-150, 151-300, > 300 lbs) in the 2008 limited entry groundfish bottom trawl fishery by management area.
98.3%1.2%
Widow rockfishNORTH of 40'10'N
97.6%1.3%
Widow rockfishSOUTH of 40'10'N
Percentage of hauls that caught:
0 lbs1-15 lbs16-50 lbs51-150 lbs151-300 lbs>300 lbs
99.7% 0.3%
Yelloweye rockfishNORTH of 40'10'N
99.8% 0.2%
Yelloweye rockfishSOUTH of 40'10'N
26

Figure 4. Length frequency distributions of discarded rebuilding species observed in the LE groundfish bottom trawl fishery from September 2003 – April 2009.
20 30 40 50 60 70 80
050
100
150
200
Bocaccio
Length (cm)
Fre
que
ncy
n = 1585
20 40 60 80
01
02
03
04
0
Cowcod
Length (cm)
Fre
que
ncy
n = 277
20 40 60 80
010
020
03
0040
050
0
Pacific ocean perch
Fre
que
ncy
n = 3278
Length (cm)
10 20 30 40 50 60 700
100
200
300
Canary rockfish
Length (cm)
n = 2485
10 20 30 40 50
02
0040
060
08
00
Darkblotched rockfish
Length (cm)
n = 5521
30 35 40 45 50 55
02
040
6080
100
Widow rockfish
n = 451
Length (cm)
27

Figure 4 continued. Length frequency distributions of discarded rebuilding species observed in the LE groundfish bottom trawl fishery from September 2003 – April 2009.
10 20 30 40 50 60 70
02
46
81
01
214
Yelloweye rockfish
Length (cm)
Fre
que
ncy
n = 134
28

Figure 5. Length frequency distributions of discarded (non-rebuilding) species observed in the LE groundfish bottom trawl fishery from September 2003 – April 2009. Plots are only provided for groundfish species for which at least 100 length measurements are available.
29
20 40 60 80
01
00
20
03
00
40
05
00
Arrowtooth flounder
Length (cm)
Fre
qu
en
cy
n = 5705
10 20 30 40 50 60
02
00
40
06
00
80
0
Aurora rockfish
Length (cm)
n = 5812
20 30 40 50 60
01
02
03
04
05
06
07
0
Blackgill rockfish
Length (cm)
Fre
qu
en
cy
n = 596
10 20 30 40 50
05
01
00
15
0
Chilipepper rockfish
Length (cm)
n = 1155
10 20 30 40 50 60 70
02
00
40
06
00
80
01
00
0
Dover sole
Fre
qu
en
cy
n = 6222
Length (cm)
10 20 30 40
02
00
40
06
00
English sole
n = 3225
Length (cm)

Figure 5 continued. Length frequency distributions of discarded (non-rebuilding) species observed in the LE groundfish bottom trawl fishery from September 2003 – April 2009. Plots are only provided for groundfish species for which at least 100 length measurements are available.
30
10 20 30 40
05
01
00
15
0
Greenstriped rockfish
Length (cm)
Fre
que
ncy
n = 1084
50 100 150
01
00
20
03
00
40
05
00
Longnose skate
Length (cm)
Fre
que
ncy
n = 7008
0 20 40 60 80 100
01
00
20
03
00
40
05
00
Lingcod
Length (cm)
n = 7277
10 20 30 40 50
05
00
10
001
50
0
Longspine thornyhead
Length (cm)
n = 5731
5 10 15 20 25 30 35
01
002
003
004
005
00
Pacific sanddab
Fre
que
ncy
n = 2713
Length (cm)
10 20 30 40
020
04
00
60
0
Petrale sole
n = 2621
Length (cm)

Figure 5 continued. Length frequency distributions of discarded (non-rebuilding) species observed in the LE groundfish bottom trawl fishery from September 2003 – April 2009. Plots are only provided for groundfish species for which at least 100 length measurements are available.
0 10 20 30 40 50 60
05
01
00
15
02
00
25
0
Redbanded rockfish
Length (cm)
Fre
qu
en
cy
n = 1969
20 40 60 80
05
01
00
15
02
00
25
0
Rougheye rockfish
Length (cm)
n = 2108
20 40 60 80
01
00
200
30
04
00
Sablefish
Length (cm)
Fre
que
ncy
n = 3782
10 20 30 40 50 60
05
00
10
00
15
00
Shortspine thornyhead
Fre
que
ncy
n = 5403
Length (cm)
20 40 60 80 100
01
02
03
04
0
Shortraker rockfish
Length (cm)
n = 745
20 40 60 80 100 120
01
00
20
03
00
40
0
Spiny dogfish
n = 5742
31Length (cm)

Figure 5 continued. Length frequency distributions of discarded (non-rebuilding) species observed in the LE groundfish bottom trawl fishery from September 2003 – April 2009. Plots are only provided for groundfish species for which at least 100 length measurements are available.
10 15 20 25 30 35 40 45
020
04
00
600
800
Splitnose rockfish
Length (cm)
Fre
que
ncy
n = 3322
20 30 40 50 60
01
020
30
40
50
60
Starry flounder
Length (cm)
n = 192
5 10 15 20 25 30 35
05
010
01
50
200
Stripetail rockfish
Length (cm)
Fre
qu
ency
n = 883
20 30 40 50
05
10
15
20
25
Yellowtail rockfish
Length (cm)
n = 164
32

TABLES
Table 1. Total trips, tows, vessels, and groundfish landings observed in the limited entry groundfish bottom trawl fishery in 2008 (above) and January through April 2009 (below). Coverage rates (last column on right) for each port group and management area are computed as the proportion of total FMP groundfish landings (excluding Pacific hake) that were observed. Data are combined as needed to ensure confidentiality.
Port Group
Number of observed
trips
Number of observed
tows
Number of observed
vessels
Observed groundfish landings
(mt)
Total groundfish landings
(mt)
% of total groundfish landings observed
Bellingham 7 80 4 147.3 823.1 18%Neah Bay -- -- -- -- 30.6 -- Astoria 126 1392 30 2178.8 8789.6 25%Newport 58 500 15 697.8 3136.1 22%Coos Bay 70 377 17 691.7 3535.7 20%Crescent City 29 152 12 352.4 2021.7 17%Eureka 70 352 10 711.4 2920.9 24%Fort Bragg 26 207 6 249.4 1613.1 15%San Francisco 86 360 10 223.5 944.7 24%Monterey 11 45 3 33.0 397.0 8%Morro BaySanta BarbaraLos Angeles -- -- -- -- -- --
North of 40°10' N 358 2826 83 4728.6 21257.7 22%South of 40°10' N 132 639 23 556.9 2954.8 19%
Coastwide total 483 3465 107 5285.4 24212.4 22%
Bellingham 8 74 3 158.4 536.3 30%Neah BayAstoria 46 452 15 820.4 3856.5 21%Newport 31 253 10 390.1 1389.9 28%Coos Bay 40 207 10 369.3 1571.1 24%Crescent City 30 158 8 250.8 802.0 31%Eureka 13 76 4 143.0 947.3 15%Fort Bragg 9 57 3 88.7 526.2 17%San Francisco 9 50 5 47.6 239.2 20%MontereyMorro BaySanta Barbara -- -- -- -- -- -- Los Angeles -- -- -- -- -- --
North of 40°10' N 168 1213 48 2121.2 9103.0 23%South of 40°10' N 20 114 10 147.2 765.5 19%
Coastwide total 186 1327 58 2268.4 9868.5 23%
2008
Jan
- Apr
200
9
Note: The number of trips and vessels north and south of 40°10' N. latitude do not sum to coastwide totals because some vessels fish in both areas on the same trip. Also, any hauls that are lacking spatial information are included in coastwide and port group totals only.
33

Table 2. Number of tows and retained weight (mt) of FMP groundfish species (excluding Pacific hake) from observer and logbook data for the 2008 limited entry groundfish bottom trawl fishery by depth, season, and management area. Tows targeting California halibut have been removed from both observer and logbook data. Winter season is January-April and November-December and summer season is May-October.
Winter Summer Winter Summer Winter Summer Winter SummerObserved fleet
0-125 440 280.7 10 207 9.7 103.2126-250 656 1298.0 39 55 34.8 76.5> 250 523 685 1092.7 1063.2 64 83 93.2 162.7Total 946 1781 1872.4 2641.8 113 345 137.7 342.4
All trawl logbooks0-125 2568 1571.8 229 793 102.8 316.8126-250 2450 4429.8 509 380 556.2 477.9> 250 2889 2815 6037.7 4242.9 378 620 587.1 876.8Total 5449 7833 10404.5 10244.6 1116 1793 1246.2 1671.6
Percentage observed0-125 17% 18% 4% 26% 9% 33%126-250 27% 29% 8% 14% 6% 16%> 250 18% 24% 18% 25% 17% 13% 16% 19%Total 17% 23% 18% 26% 10% 19% 11% 20%
NORTH of 40°10' N Lat. SOUTH of 40°10' N Lat.
Depth interval (fathoms)
Number of towsRetained groundfish
(mt) Number of towsRetained groundfish
(mt)
17% 18%
423 779.7
2560 4366.8
34

Table 3a. Observed catch weight (mt), discard weight (mt), and percent discarded from observed vessels in the 2008 limited entry groundfish bottom trawl fishery by management area. Rebuilding, non-rebuilding, and non-groundfish species are presented alphabetically. Retained weights were grouped when species-specific information was unavailable or grouped on fish tickets and did not allow for a species-specific comparison of total catch versus discard.
Total catch (mt)
Discard (mt)
Total % discarded
Total catch (mt)
Discard (mt)
Total % discarded
Rebuilding speciesBocaccio * 0.09 0.05 56.0% 1.59 1.40 87.9%Canary rockfish 2.57 2.50 97.1% 0.33 0.02 4.9%Cowcod * -- -- -- 0.05 0.05 100.0%Darkblotched rockfish * 43.24 23.99 55.5% 1.96 0.06 2.9%Pacific ocean perch * 25.21 8.91 35.3% 0.01 0.00 0.0%Widow rockfish 0.94 0.58 61.6% 0.15 0.15 100.0%Yelloweye rockfish * 0.02 0.01 69.7% 0.00 0.00 100.0%
Non-rebuilding speciesArrowtooth flounder 743.94 115.84 15.6% 1.30 0.96 73.8%Big skate 11.00 10.60 96.3% 0.40 0.40 100.0%Black rockfish 0.01 0.00 10.0% 0.03 0.00 0.0%Bronzespotted rockfish -- -- -- 0.00 0.00 0.0%Brown rockfish 0.00 0.00 100.0% 0.01 0.00 10.0%Butter sole 0.06 0.06 100.0% -- -- -- Cabezon 0.02 0.02 72.4% -- -- -- California skate 0.01 0.01 100.0% 1.10 1.10 100.0%Chilipepper rockfish 0.17 0.09 54.2% 22.18 14.79 66.7%Dover sole 2211.70 83.37 3.8% 187.70 23.62 12.6%English sole 57.82 8.27 14.3% 16.81 5.59 33.3%Flatfish 43.36 21.38 49.3% 35.30 13.65 38.7%
Curlfin turbot 0.07 0.08Deepsea sole 5.32 2.04Hornyhead turbot -- 0.01Hybrid sole 0.10 -- Pacific sanddab 11.12 9.75Roughscale sole 0.00 -- Slender sole 1.94 0.29Unspecified flatfish 2.26 0.54Unspecified sanddab 0.58 0.93
Flathead sole 0.27 0.00 1.7% -- -- -- Grenadier 44.28 34.82 78.7% 14.26 12.23 85.8%
Abyssal grenadier 0.12 -- California grenadier 0.91 0.14Giant grenadier 24.42 5.93Pacific grenadier 7.72 6.01Popeye grenadier 0.04 0.00Shoulderspot grenadier 0.03 -- Smooth grenadier 0.04 -- Softhead grenadier 0.00 -- Unspecified grenadier 1.54 0.15
Kelp greenling 0.00 0.00 19.7% -- -- -- Lingcod 31.25 12.33 39.5% 5.98 2.52 42.0%
* Mislabeling or grouping of these species on non-distributed fish tickets may cause retained catch weights to be underestimated.
NORTH of 40°10' N SOUTH of 40°10' N
35
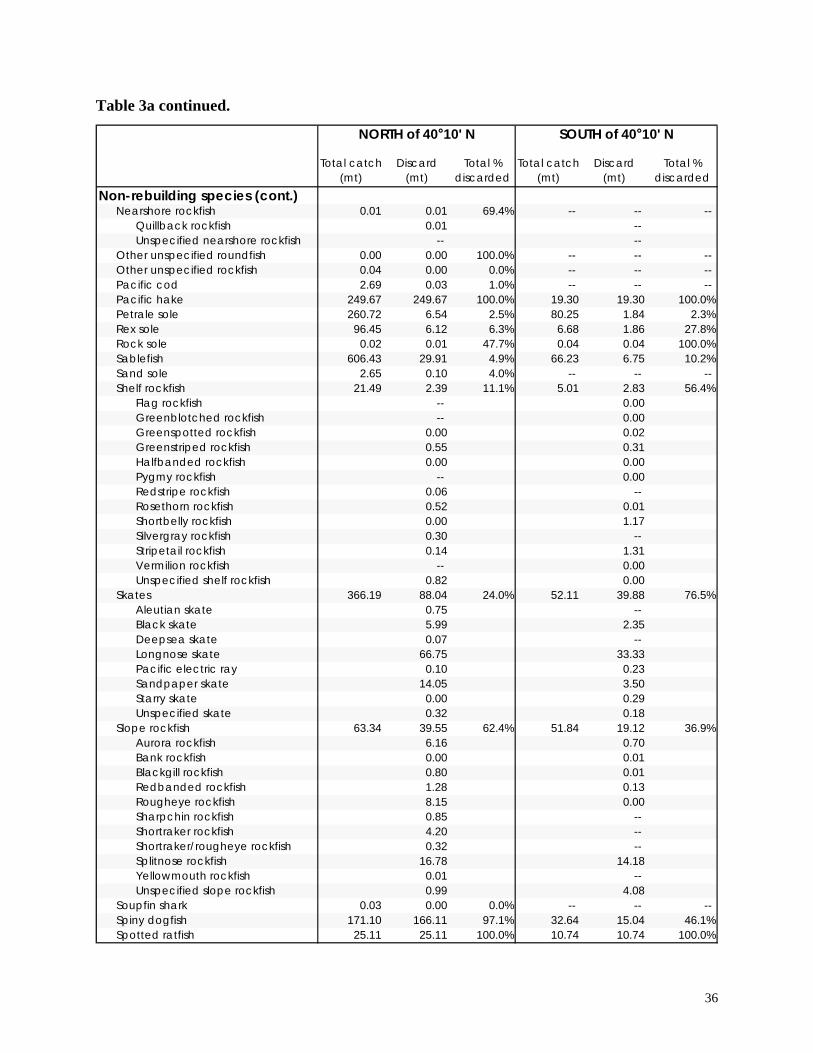
Table 3a continued.
Total catch (mt)
Discard (mt)
Total % discarded
Total catch (mt)
Discard (mt)
Total % discarded
Non-rebuilding species (cont.)Nearshore rockfish 0.01 0.01 69.4% -- -- --
Quillback rockfish 0.01 -- Unspecified nearshore rockfish -- --
Other unspecified roundfish 0.00 0.00 100.0%
-- -- -- Other unspecified rockfish 0.04 0.00 0.0% -- -- -- Pacific cod 2.69 0.03 1.0% -- -- -- Pacific hake 249.67 249.67 100.0% 19.30 19.30 100.0%Petrale sole 260.72 6.54 2.5% 80.25 1.84 2.3%Rex sole 96.45 6.12 6.3% 6.68 1.86 27.8%Rock sole 0.02 0.01 47.7% 0.04 0.04 100.0%Sablefish 606.43 29.91 4.9% 66.23 6.75 10.2%Sand sole 2.65 0.10 4.0% -- -- -- Shelf rockfish 21.49 2.39 11.1% 5.01 2.83 56.4%
Flag rockfish -- 0.00Greenblotched rockfish -- 0.00Greenspotted rockfish 0.00 0.02Greenstriped rockfish 0.55 0.31Halfbanded rockfish 0.00 0.00Pygmy rockfish -- 0.00Redstripe rockfish 0.06 -- Rosethorn rockfish 0.52 0.01Shortbelly rockfish 0.00 1.17Silvergray rockfish 0.30 -- Stripetail rockfish 0.14 1.31Vermilion rockfish -- 0.00Unspecified shelf rockfish 0.82 0.00
Skates 366.19 88.04 24.0% 52.11 39.88 76.5%Aleutian skate 0.75 -- Black skate 5.99 2.35Deepsea skate 0.07 -- Longnose skate 66.75 33.33Pacific electric ray 0.10 0.23Sandpaper skate 14.05 3.50Starry skate 0.00 0.29Unspecified skate 0.32 0.18
Slope rockfish 63.34 39.55 62.4% 51.84 19.12 36.9%Aurora rockfish 6.16 0.70Bank rockfish 0.00 0.01Blackgill rockfish 0.80 0.01Redbanded rockfish 1.28 0.13Rougheye rockfish 8.15 0.00Sharpchin rockfish 0.85 -- Shortraker rockfish 4.20 -- Shortraker/rougheye rockfish 0.32 -- Splitnose rockfish 16.78 14.18Yellowmouth rockfish 0.01 -- Unspecified slope rockfish 0.99 4.08
Soupfin shark 0.03 0.00 0.0% -- -- -- Spiny dogfish 171.10 166.11 97.1% 32.64 15.04 46.1%Spotted ratfish 25.11 25.11 100.0% 10.74 10.74 100.0%
NORTH of 40°10' N SOUTH of 40°10' N
36

Table 3a continued.
Total catch (mt)
Discard (mt)
Total % discarded
Total catch (mt)
Discard (mt)
Total % discarded
Non-rebuilding species (cont.)Starry flounder 1.73 0.26 15.2% 0.02 0.00 0.0%Swordspine rockfish -- -- -- 0.00 0.00 100.0%Thornyheads 510.41 46.96 9.2% 97.60 7.86 8.1%
Longspine Thornyhead 33.04 7.59Shortspine Thornyhead 11.00 0.25Mixed thornyheads 2.92 0.02
Yellowtail rockfish 2.36 0.20 8.5% 0.01 0.01 100.0%Non-groundfish species
American shad 0.175 0.175 100.0% 0.040 0.040 100.0%Anchovy (unidentified) 0.000 0.000 100.0% -- -- --Anglerfish (unidentified) 0.000 0.000 100.0% -- -- -- Armored box crab -- -- -- 0.200 0.200 100.0%Bairdi tanner crab 0.009 0.009 100.0% -- -- -- Barracudina (unidentified) 0.001 0.001 100.0% -- -- -- Bigfin eelpout 0.502 0.502 100.0% 0.107 0.107 100.0%Bigscale (unidentified) 0.000 0.000 100.0% -- -- -- Bivalves (unidentified) 0.002 0.002 100.0% -- -- -- Black eelpout 0.039 0.039 100.0% 0.001 0.001 100.0%Black hagfish 0.001 0.001 100.0% -- -- -- Blackbelly eelpout 0.000 0.000 100.0% -- -- -- Blackedge poacher 0.001 0.001 100.0% -- -- -- Blob sculpin 0.051 0.051 100.0% -- -- -- Blue shark 0.057 0.057 100.0% -- -- -- Brown box crab 0.003 0.003 100.0% 0.172 0.172 100.0%Brown cat shark 8.671 8.671 100.0% 2.115 2.115 100.0%Brown Irish lord sculpin 0.002 0.002 100.0% -- -- -- Brown smoothhound shark 0.308 0.308 100.0% 0.000 0.000 100.0%California king crab 0.010 0.010 100.0% 0.008 0.008 100.0%California slickhead 2.277 2.277 100.0% 2.457 2.457 100.0%Cat shark (unidentified) 0.063 0.063 100.0% 0.142 0.142 100.0%Crab (unidentified) 0.006 0.006 100.0% 0.000 0.000 100.0%Cusk-eel (unidentified) 0.001 0.001 100.0% -- -- -- Decorator/spider crab (unidentified) 0.002 0.002 100.0% 0.000 0.000 100.0%Deep-sea spider crab 0.003 0.003 100.0% -- -- -- Dragonfish (unidentified) 0.000 0.000 100.0% -- -- -- Dungeness crab 34.403 34.403 100.0% 5.635 5.635 100.0%Eelpout (unidentified) 7.171 7.171 100.0% 0.388 0.388 100.0%Fangtooth 0.000 0.000 100.0% 0.000 0.000 100.0%Filetail cat shark 0.001 0.001 100.0% 0.112 0.112 100.0%Giant wrymouth 0.016 0.016 100.0% -- -- -- Hagfish (unidentified) 0.001 0.001 100.0% -- -- -- Hair crab 0.012 0.012 100.0% 0.002 0.002 100.0%Hermit crab (unidentified) 0.011 0.011 100.0% 0.000 0.000 100.0%Hundred fathom mora 0.001 0.001 100.0% -- -- -- Jackmackerel -- -- -- 0.009 0.009 100.0%Jellyfish (unidentified) 0.284 0.284 100.0% 0.015 0.015 100.0%King (Chinook) salmon 0.115 0.115 100.0% 0.007 0.007 100.0%King crab (unidentified) 0.003 0.003 100.0% 0.000 0.000 100.0%Lancetfish (unidentified) 0.050 0.050 100.0% -- -- -- Laternfish (unidentified) 0.005 0.005 100.0% 0.000 0.000 100.0%
NORTH of 40°10' N SOUTH of 40°10' N
37

Table 3a continued.
Total catch (mt)
Discard (mt)
Total % discarded
Total catch (mt)
Discard (mt)
Total % discarded
Non-groundfish species (cont.)Longfin dragonfish 0.000 0.000 100.0% -- -- -- Longnose cat shark 0.022 0.022 100.0% 0.001 0.001 100.0%Longnose lancetfish 0.022 0.022 100.0% -- -- -- Longspine combfish 0.001 0.001 100.0% 0.061 0.061 100.0%Loosejaw (unidentified) 0.003 0.003 100.0% -- -- -- Lumpsucker (unidentified) -- -- -- 0.005 0.005 100.0%Lyre crab (unidentified) 0.000 0.000 100.0% -- -- -- Mackerel (unidentified) 0.001 0.001 100.0% -- -- -- Manefish 0.000 0.000 100.0% -- -- -- Midshipman (unidentified) -- -- -- 0.092 0.092 100.0%Mola mola (sunfish) -- -- -- 0.008 0.008 100.0%Monkeyface prickleback 0.016 0.016 100.0% -- -- -- Octopus (unidentified) 1.686 1.450 86.0% 0.380 0.355 93.3%Other nongroundfish 4.725 2.505 53.0% 0.077 0.077 100.0%Oxeye oreo 0.002 0.002 100.0% -- -- -- Pacific flatnose 1.035 1.035 100.0% 0.812 0.812 100.0%Pacific halibut 63.501 63.501 100.0% 1.241 1.241 100.0%Pacific herring 0.026 0.026 100.0% 0.002 0.002 100.0%Pacific lamprey 0.001 0.001 100.0% -- -- -- Pacific mackerel -- -- -- 0.003 0.003 100.0%Pacific rock crab -- -- -- 0.000 0.000 100.0%Pacific sardine 0.442 0.442 100.0% 0.001 0.001 100.0%Pacific scabbardfish 0.002 0.002 100.0% -- -- -- Pacific sleeper shark 1.208 1.208 100.0% 0.147 0.147 100.0%Pacific tom cod -- -- -- 0.000 0.000 100.0%Pacific viperfish 0.001 0.001 100.0% 0.000 0.000 100.0%Paperbone (unidentified) 0.001 0.001 100.0% -- -- -- Pink surfperch -- -- -- 0.031 0.031 100.0%Plainfin midshipman 0.000 0.000 100.0% 0.005 0.005 100.0%Poacher (unidentified) 0.029 0.029 100.0% 0.037 0.037 100.0%Prickleback (unidentified) 0.000 0.000 100.0% -- -- -- Prowfish 0.002 0.002 100.0% -- -- -- Ragfish 0.122 0.122 100.0% -- -- -- Red rock crab 0.004 0.004 100.0% 0.011 0.011 100.0%Ribbonfish (unidentified) 0.006 0.006 100.0% -- -- -- Ronquil (unidentified) 0.000 0.000 100.0% -- -- -- Scarlet king crab 0.075 0.075 100.0% 0.022 0.022 100.0%Sculpin (unidentified) 0.495 0.495 100.0% 0.030 0.030 100.0%Sea cucumber (unidentified) 0.677 0.677 100.0% 0.001 0.001 100.0%Shark (unidentified) 5.489 5.443 99.2% 0.764 0.757 99.1%Shrimp (unidentified) 0.023 0.023 100.0% 0.010 0.010 100.0%Sixgill shark -- -- -- 0.088 0.088 100.0%Slickhead (unidentified) 0.128 0.128 100.0% 0.044 0.044 100.0%Smelt (unidentified) 0.004 0.004 100.0% -- -- -- Snailfish (unidentified) 0.891 0.891 100.0% 0.040 0.040 100.0%Snakehead eelpout 0.007 0.007 100.0% 0.001 0.001 100.0%Snipe eel (unidentified) 0.000 0.000 100.0% -- -- -- Spiky king crab -- -- -- 0.001 0.001 100.0%Spiny king crab -- -- -- 0.027 0.027 100.0%Spiny lithode crab 0.314 0.314 100.0% 0.001 0.001 100.0%
NORTH of 40°10' N SOUTH of 40°10' N
38

Table 3a continued.
Total catch (mt)
Discard (mt)
Total % discarded
Total catch (mt)
Discard (mt)
Total % discarded
Non-groundfish species (cont.)Squid (unidentified) 14.510 9.211 63.5% 5.796 3.976 68.6%Stone coral 0.268 0.268 100.0% -- -- -- Sturgeon poacher 0.000 0.000 100.0% -- -- -- Surfperch (unidentified) 0.000 0.000 100.0% 0.043 0.043 100.0%Tanner crab (unidentified) 5.639 5.639 100.0% 1.499 1.499 100.0%Tanneri tanner crab 78.372 78.372 100.0% 22.944 22.944 100.0%Threadfin sculpin -- -- -- 0.001 0.001 100.0%Threadfin slickhead 0.215 0.215 100.0% 0.009 0.009 100.0%Tubeshoulder (unidentified) 0.005 0.005 100.0% 0.409 0.409 100.0%Twoline eelpout 0.536 0.536 100.0% 0.134 0.134 100.0%Urchin (unidentified) 1.728 1.728 100.0% 0.032 0.032 100.0%Viperfish (unidentified) 0.002 0.002 100.0% 0.000 0.000 100.0%White croaker -- -- -- 0.276 0.178 64.4%Wolf-eel 0.019 0.012 64.6% 0.010 0.010 100.0%Wrymouth (unidentified) 0.000 0.000 100.0% -- -- --
NORTH of 40°10' N SOUTH of 40°10' N
39

Table 3b. Observed catch weight (mt), discard weight (mt), and percent discarded from observed vessels in the January through April 2009 limited entry groundfish bottom trawl fishery by management area. Rebuilding, non-rebuilding, and non-groundfish species are presented alphabetically. Retained weights were grouped when species-specific information was unavailable or grouped on fish tickets and did not allow for a species-specific comparison of total catch versus discard.
Total catch (mt)
Discard (mt)
Total % discarded
Total catch (mt)
Discard (mt)
Total % discarded
Rebuilding speciesBocaccio * 0.00 0.00 7.9% 0.46 0.27 57.3%Canary rockfish 0.11 0.07 65.4% 0.00 0.00 100.0%Cowcod * -- -- -- 0.00 0.00 100.0%Darkblotched rockfish * 24.53 14.52 59.2% 0.63 0.01 0.9%Pacific ocean perch * 12.83 5.88 45.9% 0.00 0.00 0.0%Widow rockfish 0.71 0.34 47.8% 0.12 0.12 100.0%Yelloweye rockfish * 0.00 0.00 0.0% -- -- --
Non-rebuilding speciesArrowtooth flounder 383.28 43.67 11.4% 0.71 0.70 98.9%Big skate 1.37 1.34 97.7% -- -- -- Black rockfish 0.00 0.00 100.0% -- -- -- Bronzespotted rockfish 0.00 0.00 100.0% -- -- -- Butter sole 0.05 0.00 0.0% -- -- -- California skate 0.01 0.01 100.0% 0.03 0.03 100.0%Chilipepper rockfish 0.23 0.14 62.1% 5.92 0.01 0.1%Dover sole 1009.95 32.42 3.2% 48.66 11.08 22.8%English sole 18.79 3.72 19.8% 2.20 0.30 13.6%Flatfish 18.04 11.83 65.6% 0.85 0.76 89.7%
Curlfin turbot 0.00 -- Deepsea sole 2.45 0.72Flathead sSole 0.00 -- Greenland turbot 0.00 -- Hornyhead turbot -- 0.00Pacific sanddab 6.08 0.01Slender sole 0.45 0.03Unspecified flatfish 1.00 -- Unspecified sanddab 1.86 0.00
Flathead sole 0.10 0.10 100.0% -- -- -- Grenadier 20.11 16.93 84.2% 4.32 2.82 65.2%
California grenadier 0.36 0.28Giant grenadier 10.80 0.88Pacific Grenadier 5.18 1.26Popeye Grenadier 0.00 -- Smooth Grenadier 0.00 -- Unspecified grenadier 0.58 0.40
Kelp greenling 0.01 0.01 100.0% -- -- -- Lingcod 6.75 1.53 22.7% 0.48 0.00 0.5%Other groundfish 0.00 0.00 100.0% 0.06 0.06 100.0%Other unspecified rockfish -- -- -- 0.01 0.00 0.0%Pacific cod 11.05 0.03 0.2% -- -- -- Pacific hake 17.25 17.25 100.0% 5.59 5.59 100.0%
* Mislabeling or grouping of these species on non-distributed fish tickets may cause retained catch weights to be underestimated.
NORTH of 40°10' N SOUTH of 40°10' N
40

Table 3b continued.
Total catch (mt)
Discard (mt)
Total % discarded
Total catch (mt)
Discard (mt)
Total % discarded
Non-rebuilding species (cont.)Petrale sole 172.24 5.80 3.4% 25.47 0.07 0.3%Rex sole 35.29 3.37 9.5% 1.40 0.37 26.2%Rock sole 0.00 0.00 100.0% -- -- -- Rosy rockfish 0.03 0.03 100.0% -- -- -- Sablefish 202.19 11.70 5.8% 23.42 0.50 2.1%Sand sole 0.06 0.01 14.7% -- -- -- Shelf rockfish 7.46 0.88 11.7% 3.42 0.11 3.1%
Chameleon rockfish 0.00 -- Greenstriped rockfish 0.09 0.01Redstripe rockfish 0.04 0.00Rosethorn rockfish 0.32 0.02Silvergray rockfish 0.02 -- Stripetail rockfish 0.02 0.08Unspecified shelf rockfish 0.37 0.00
Skates 130.25 40.35 31.0% 9.39 9.21 98.0%Aleutian skate 0.38 0.01Black skate 3.83 0.92Deepsea skate 0.11 -- Longnose skate 29.37 7.30Sandpaper skate 6.56 0.97Unspecified skate 0.12 0.01
Slope rockfish 21.78 14.11 64.8% 30.29 8.94 29.5%Aurora rockfish 1.39 0.10Bank rockfish 0.00 0.00Blackgill rockfish 0.21 0.00Redbanded rockfish 0.32 0.02Rougheye rockfish 5.04 -- Sharpchin rockfish 0.58 0.05Shortraker rockfish 1.51 0.00Shortraker/rougheye rockfish 0.16 -- Splitnose rockfish 4.42 7.98Yellowmouth rockfish 0.01 -- Unspecified slope rockfish 0.46 0.79
Spiny dogfish 71.70 71.70 100.0% 3.74 3.74 100.0%Spotted ratfish 6.23 6.23 100.0% 0.80 0.80 100.0%Swordspine rockfish 0.00 0.00 100.0% -- -- -- Thornyheads 229.13 38.47 16.8% 27.94 5.31 19.0%
Longspine thornyhead 31.95 4.84Shortspine thornyhead 3.96 0.15Mixed thornyheads 2.57 0.32
Yellowtail rockfish 1.43 0.22 15.4% -- -- -- Non-groundfish species
American shad 0.097 0.097 100.0% 0.006 0.006 100.0%Anchovy (unidentified) 0.000 0.000 100.0% -- -- -- Armored box crab -- -- -- 0.003 0.003 100.0%Bairdi tanner crab 0.000 0.000 100.0% -- -- -- Bearded eelpout -- -- -- 0.000 0.000 100.0%Bigfin eelpout 0.133 0.133 100.0% 0.018 0.018 100.0%Bigscale (unidentified) 0.000 0.000 100.0% -- -- --
NORTH of 40°10' N SOUTH of 40°10' N
41

Table 3b continued.
Total catch (mt)
Discard (mt)
Total % discarded
Total catch (mt)
Discard (mt)
Total % discarded
Non-groundfish species (cont.)Black eelpout 0.002 0.002 100.0% 0.000 0.000 100.0%Blob sculpin 0.027 0.027 100.0% 0.022 0.022 100.0%Brown box crab 0.003 0.003 100.0% 0.001 0.001 100.0%Brown cat shark 3.657 3.657 100.0% 1.031 1.031 100.0%California halibut 0.008 0.008 100.0% -- -- -- California king crab -- -- -- 0.000 0.000 100.0%California slickhead 2.168 2.168 100.0% 0.889 0.889 100.0%Crab (unidentified) 0.003 0.003 100.0% 0.001 0.001 100.0%Daggertooth 0.002 0.002 100.0% 0.004 0.004 100.0%Decorator/spider crab (unidentified) 0.001 0.001 100.0% 0.000 0.000 100.0%Dragonfish (unidentified) 0.000 0.000 100.0% -- -- -- Dungeness crab 3.064 3.064 100.0% 0.203 0.203 100.0%Eelpout (unidentified) 2.320 2.320 100.0% 0.477 0.477 100.0%Fangtooth 0.000 0.000 100.0% -- -- -- Filetail cat shark -- -- -- 0.051 0.051 100.0%Green sturgeon 0.091 0.091 100.0% -- -- -- Gunnel (unidentified) 0.000 0.000 100.0% -- -- -- Hagfish (unidentified) 0.002 0.002 100.0% -- -- -- Hair crab 0.016 0.016 100.0% -- -- -- Hermit crab (unidentified) 0.003 0.003 100.0% 0.000 0.000 100.0%Jellyfish (unidentified) 0.107 0.107 100.0% 0.020 0.020 100.0%King (Chinook) salmon 0.076 0.076 100.0% -- -- -- King crab (unidentified) 0.006 0.006 100.0% 0.003 0.003 100.0%King of the salmon 0.016 0.016 100.0% -- -- -- Lancetfish (unidentified) 0.027 0.027 100.0% 0.002 0.002 100.0%Laternfish (unidentified) 0.004 0.004 100.0% 0.000 0.000 100.0%Long-armed spider crab 0.000 0.000 100.0% -- -- -- Longnose lancetfish 0.015 0.015 100.0% -- -- -- Longspine combfish -- -- -- 0.001 0.001 100.0%Lyre crab (unidentified) 0.000 0.000 100.0% -- -- -- Mackeral (unidentified) 0.002 0.002 100.0% -- -- -- Midshipman (unidentified) 0.019 0.019 100.0% -- -- -- Octopus (unidentified) 0.494 0.494 100.0% 0.059 0.059 100.0%Other nongroundfish 1.006 0.960 95.5% -- -- -- Pacific flatnose 0.666 0.666 100.0% 0.458 0.458 100.0%Pacific hagfish 0.000 0.000 100.0% -- -- -- Pacific halibut 44.923 44.919 100.0% 0.367 0.367 100.0%Pacific herring 0.000 0.000 100.0% -- -- -- Pacific lamprey 0.000 0.000 100.0% -- -- -- Pacific sandlance 0.007 0.007 100.0% -- -- -- Pacific sardine 0.001 0.001 100.0% -- -- -- Pacific scabbardfish 0.002 0.002 100.0% 0.004 0.004 100.0%Pacific sleeper shark 0.335 0.335 100.0% 0.123 0.123 100.0%Pacific staghorn sculpin -- -- -- 0.000 0.000 100.0%Paperbone (unidentified) 0.001 0.001 100.0% -- -- -- Pink surfperch -- -- -- 0.001 0.001 100.0%Poacher (unidentified) 0.008 0.008 100.0% -- -- -- Ragfish 0.034 0.034 100.0% -- -- -- Scarlet king crab 0.035 0.035 100.0% 0.003 0.003 100.0%
NORTH of 40°10' N SOUTH of 40°10' N
42

Table 3b continued.
Total catch (mt)
Discard (mt)
Total % discarded
Total catch (mt)
Discard (mt)
Total % discarded
Non-groundfish species (cont.)Sculpin (unidentified) 0.039 0.039 100.0% -- -- -- Sea cucumber (unidentified) 0.158 0.158 100.0% 0.000 0.000 100.0%Sevengill shark 0.015 0.015 100.0% -- -- -- Shark (unidentified) 0.898 0.898 100.0% 0.054 0.054 100.0%Shrimp (unidentified) 0.003 0.003 100.0% 0.003 0.003 100.0%Sixgill shark -- -- -- 0.021 0.021 100.0%Slickhead (unidentified) 0.014 0.014 100.0% 0.002 0.002 100.0%Snailfish (unidentified) 0.405 0.405 100.0% 0.040 0.040 100.0%Snakehead eelpout 0.001 0.001 100.0% -- -- -- Spiny king crab -- -- -- 0.001 0.001 100.0%Spiny lithode crab 0.001 0.001 100.0% -- -- -- Squid (unidentified) 0.304 0.304 100.0% 0.121 0.121 100.0%Stone coral 0.021 0.021 100.0% -- -- -- Surf smelt 0.001 0.001 100.0% -- -- -- Surfperch (unidentified) 0.006 0.006 100.0% -- -- -- Tanner crab (unidentified) 4.805 4.805 100.0% -- -- -- Tanneri tanner crab 41.027 41.027 100.0% 8.776 8.225 93.7%Threadfin sculpin -- -- -- 0.000 0.000 100.0%Threadfin slickhead 0.158 0.158 100.0% 0.004 0.004 100.0%Tubeshoulder (unidentified) 0.015 0.015 100.0% 0.006 0.006 100.0%Twoline eelpout 0.235 0.235 100.0% 0.068 0.068 100.0%Urchin (unidentified) 0.152 0.152 100.0% 0.003 0.003 100.0%Viperfish (unidentified) 0.001 0.001 100.0% -- -- -- Walleye pollock 0.001 0.001 100.0% -- -- -- White croaker -- -- -- 0.000 0.000 100.0%
NORTH of 40°10' N SOUTH of 40°10' N
43

Table 4a. Discard ratios and standard errors from observed trips north of 40°10' N latitude in the 2008 limited-entry bottom trawl fishery by season and depth. Ratios are computed as the observed discard weight divided by the observed weight (adjusted to fish tickets) of retained FMP groundfish species (excluding Pacific hake). Winter season is January-April and November-December and summer season is May-October. Species are grouped according to Appendix C. Columns with darker shading signify that data were combined across more than one depth interval.
Discard ratio SE
Discard ratio SE
Discard ratio SE
Seasonwinter 0.0000 0.0050 0.0000 NAsummer 0.0000 NA 0.0000 0.0596 0.0000 NAwinter 0.0025 1.8324 0.0000 NAsummer 0.0011 0.0215 0.0002 0.0215 0.0000 0.0184winter 0.0187 0.0748 0.0004 0.0065summer 0.0002 0.0080 0.0066 0.0468 0.0003 0.0039winter 0.0037 0.0442 0.0001 0.0043summer 0.0002 0.1822 0.0045 0.0443 0.0001 0.0018winter 0.0007 0.0512 0.0000 0.0002summer 0.0000 0.1097 0.0000 0.0040 0.0000 0.0004winter 0.0000 NA 0.0000 NAsummer 0.0000 0.0132 0.0000 0.0035 0.0000 NA
Non-rebuilding specieswinter 0.0419 0.1770 0.0093 0.0450summer 0.1508 0.2767 0.0179 0.0622 0.0070 0.0409winter 0.0021 0.4779 0.0001 0.0349summer 0.0261 0.2079 0.0011 0.4684 0.0001 0.0480winter 0.0000 NA 0.0000 NAsummer 0.0000 NA 0.0000 NA 0.0000 NAwinter 0.0000 NA 0.0000 NAsummer 0.0000 0.0015 0.0000 NA 0.0000 NAwinter 0.0000 0.0405 0.0000 0.0029summer 0.0000 NA 0.0000 0.3337 0.0000 NAwinter 0.0224 0.1356 0.0263 0.0974summer 0.0162 0.0672 0.0010 0.0062 0.0294 0.1146winter 0.0008 0.0119 0.0000 0.0006summer 0.0270 0.0699 0.0000 0.0013 0.0000 0.0001winter 0.0000 NA 0.0000 NAsummer 0.0000 0.0013 0.0000 NA 0.0000 NAwinter 0.0035 0.0549 0.0000 0.0020summer 0.0315 0.1478 0.0005 0.0201 0.0000 NAwinter 0.0278 0.0803 0.0081 0.0336summer 0.0528 0.2356 0.0118 0.0333 0.0057 0.0277winter 0.0003 0.0023 0.0069 0.0165summer 0.0000 NA 0.0010 0.0049 0.0226 0.0414winter 0.0000 0.0153 0.0024 0.1536summer 0.0000 NA 0.0000 0.0067 0.0003 0.0807winter 0.0029 0.0074 0.0003 0.0048summer 0.0589 0.0522 0.0006 0.0025 0.0006 0.0045winter 0.0061 0.0329 0.0010 0.0350summer 0.0356 0.1237 0.0063 0.0328 0.0011 0.0668winter 0.0000 NA 0.0000 NAsummer 0.0000 0.0052 0.0000 NA 0.0000 NAwinter 0.0005 0.0068 0.0000 0.0014summer 0.0006 0.0098 0.0009 0.0168 0.0000 0.0039winter 0.0051 0.0108 0.0008 0.0061summer 0.0002 0.0234 0.0116 0.0148 0.0021 0.0059
NORTH OF 40°10' N Lat. Depth interval (fathoms)0-125 126-250 ≥ 250
Rebuilding species Denominator = Retained groundfish (mt)
Bocaccio
Canary rockfish
Darkblotched rockfish
Pacific ocean perch
Widow rockfish
Yelloweye rockfish
Denominator = Retained groundfish (mt)
Arrowtooth flounder
Big skate
Black rockfish (North of 46° 16' N. lat.)
Black rockfish (South of 46° 16' N. lat.)
Chilipepper
Dover sole
English sole
Kelp greenling
Lingcod
Longnose skate
Longspine thornyhead
Mixed thornyheads
Other flatfish
Other groundfish
Other nearshore rockfish
Other shelf rockfish
Other slope rockfish
44

Table 4a continued.
Discard ratio SE
Discard ratio SE
Discard ratio SE
Seasonwinter 0.0000 0.0004 0.0000 NAsummer 0.0001 0.0013 0.0000 0.0012 0.0000 NAwinter 0.0727 0.3056 0.0134 0.0678summer 0.0989 1.0227 0.0868 0.2062 0.0356 0.1536winter 0.0049 0.0493 0.0001 0.0038summer 0.0093 0.0154 0.0000 0.0005 0.0000 0.0001winter 0.0000 NA 0.0000 NAsummer 0.0000 NA 0.0000 0.0052 0.0000 0.0047winter 0.0060 0.0248 0.0076 0.0208summer 0.0042 0.0276 0.0065 0.0268 0.0068 0.0316winter 0.0003 0.0459 0.0000 0.0010summer 0.0000 NA 0.0005 0.0999 0.0000 0.0008winter 0.0000 NA 0.0000 NAsummer 0.0000 NA 0.0000 NA 0.0000 NAwinter 0.0024 0.0079 0.0006 0.0012summer 0.0000 0.0003 0.0047 0.0108 0.0022 0.0049winter 0.0004 0.1453 0.0000 0.0109summer 0.0000 NA 0.0000 0.0412 0.0000 NAwinter 0.0968 0.2913 0.0059 0.0959summer 0.2278 1.2702 0.0129 0.1251 0.0033 0.2131winter 0.0095 0.0654 0.0002 0.0114summer 0.0002 0.1600 0.0060 0.0566 0.0013 0.1039winter 0.0000 NA 0.0000 NAsummer 0.0009 0.0092 0.0000 NA 0.0000 NAwinter 0.0001 0.0172 0.0115 0.0325summer 0.0000 NA 0.0003 0.0089 0.0205 0.0385winter 0.0050 0.0067 0.0046 0.0064summer 0.0045 0.0139 0.0053 0.0055 0.0039 0.0042winter 0.0000 NA 0.0000 NAsummer 0.0000 NA 0.0000 0.0087 0.0000 NAwinter 0.0000 0.0226 0.0000 NAsummer 0.0002 0.0060 0.0001 0.0096 0.0000 NA
winter 0.0005 0.0279 0.0000 0.0024summer 0.1206 0.2020 0.0001 0.0095 0.0000 0.0041winter 0.0008 0.0108 0.0016 0.0073summer 0.0040 0.0321 0.0003 0.0017 0.0031 0.0089winter 0.0065 0.0094 0.0081 0.0039summer 0.0052 0.0339 0.0100 0.0070 0.0173 0.0081winter 0.0018 0.0141 0.0361 0.0621summer 0.0000 NA 0.0024 0.0110 0.0376 0.0555
NORTH OF 40°10' N Lat. Depth interval (fathoms)0-125 126-250 ≥ 250
Non-rebuilding species (cont.) Denominator = Retained groundfish (mt)
Pacific cod (North of 43° N. lat.)
Pacific hake
Petrale sole
Redstripe rockfish
Sablefish
Sharpchin rockfish
Shortbelly rockfish
Shortspine thornyhead
Silvergray rockfish
Spiny dogfish
Splitnose rockfish
Starry flounder
Unspecified grenadiers
Unspecified skate
Yellowmouth rockfish
Yellowtail rockfish
Non-groundfish species
Other nongroundfish
Tanner crab
Denominator = Retained groundfish (mt)
Dungeness crab
Other non-FMP flatfish
45

Table 4b. Discard ratios and standard errors from observed trips south of 40° 10’ N latitude in the 2008 limited entry groundfish bottom trawl fishery by season and depth. Ratios are computed as the observed discard weight divided by the observed weight (adjusted to fish tickets) of retained FMP groundfish species (excluding Pacific hake). Winter season is January-April and November-December and summer season is May-October. Species are grouped according to Appendix C.
Discard ratio SE
Discard ratio SE
Discard ratio SE
Seasonwinter 0.0008 NA 0.0001 NA 0.0000 NAsummer 0.0126 0.2440 0.0012 0.0551 0.0000 NAwinter 0.0000 NA 0.0000 NA 0.0000 NAsummer 0.0002 0.0043 0.0000 NA 0.0000 NAwinter 0.0000 NA 0.0000 NA 0.0000 NAsummer 0.0005 0.3228 0.0000 NA 0.0000 NAwinter 0.0001 0.0027 0.0002 0.0068 0.0000 NAsummer 0.0001 0.0075 0.0005 0.0068 0.0000 NAwinter 0.0001 NA 0.0000 NA 0.0000 NAsummer 0.0007 0.1340 0.0010 0.3430 0.0000 NAwinter 0.0000 NA 0.0000 NA 0.0000 NAsummer 0.0000 NA 0.0000 NA 0.0000 NA
Non-rebuilding specieswinter 0.0009 0.0093 0.0099 0.1176 0.0020 0.3990summer 0.0018 0.0551 0.0023 0.0536 0.0003 0.0361winter 0.0000 NA 0.0000 NA 0.0000 NAsummer 0.0000 NA 0.0001 0.0098 0.0000 NAwinter 0.0186 0.4123 0.0001 NA 0.0000 NAsummer 0.0021 0.3084 0.0000 NA 0.0000 NAwinter 0.0000 NA 0.0000 NA 0.0000 NAsummer 0.0000 NA 0.0000 NA 0.0000 NAwinter 0.0000 NA 0.0000 0.0003 0.0000 NAsummer 0.0000 0.0067 0.0001 0.0028 0.0000 0.0003winter 0.0008 0.0058 0.0023 0.0949 0.0000 NAsummer 0.1401 0.6611 0.0032 0.0586 0.0000 NAwinter 0.0047 0.0565 0.0145 0.0784 0.0946 0.3216summer 0.0128 0.0475 0.0255 0.1318 0.0675 0.3107winter 0.0012 0.0089 0.0060 0.0833 0.0000 NAsummer 0.0514 0.0964 0.0008 0.0565 0.0000 NAwinter 0.0000 NA 0.0000 NA 0.0000 NAsummer 0.0000 NA 0.0000 NA 0.0000 NAwinter 0.0061 0.0594 0.0000 NA 0.0000 NAsummer 0.0219 0.3080 0.0025 0.0862 0.0000 NAwinter 0.2729 2.1585 0.1269 0.6342 0.0075 0.1109summer 0.1284 0.3479 0.1020 0.4385 0.0277 0.1621winter 0.0000 NA 0.0009 0.0263 0.0476 0.0994summer 0.0000 NA 0.0081 0.3487 0.0155 0.0927winter 0.0000 NA 0.0000 NA 0.0002 NAsummer 0.0000 NA 0.0000 NA 0.0000 NAwinter 0.0071 0.0270 0.0077 0.0447 0.0000 0.0013summer 0.1191 0.1715 0.0066 0.0368 0.0005 0.0082winter 0.0143 0.2336 0.0254 0.2981 0.0027 0.3694summer 0.0550 0.3478 0.0478 0.6152 0.0008 0.0199winter 0.0000 NA 0.0000 NA 0.0000 NAsummer 0.0000 0.0052 0.0000 NA 0.0000 NAwinter 0.0042 0.0268 0.0004 0.0127 0.0000 NAsummer 0.0476 0.8608 0.0102 0.0764 0.0000 NA
SOUTH OF 40°10' N Lat. Depth interval (fathoms)0-125 126-250 ≥ 250
Rebuilding species Denominator = Retained groundfish (mt)
Bocaccio
Canary rockfish
Cowcod
Darkblotched rockfish
Widow rockfish
Yelloweye rockfish
Denominator = Retained groundfish (mt)
Arrowtooth flounder
Bank rockfish
Big skate
Black rockfish
Blackgill rockfish
Chilipepper
Longnose skate
Dover sole
English sole
Kelp greenling
Lingcod
Longspine thornyhead
Mixed thornyheads
Other flatfish
Other groundfish
Other nearshore rockfish
Other shelf rockfish
46

Table 4b continued.
Discard ratio SE
Discard ratio SE
Discard ratio SE
Seasonwinter 0.0000 NA 0.0024 0.0137 0.0000 NAsummer 0.0001 0.0037 0.0050 0.0298 0.0022 0.0164winter 0.0005 0.0107 0.0750 0.6185 0.0040 0.2932summer 0.0389 0.2573 0.1070 1.2592 0.0253 0.1658winter 0.0038 0.0250 0.0032 0.0235 0.0000 0.0013summer 0.0163 0.0469 0.0001 0.0022 0.0000 NAwinter 0.0002 0.0066 0.0060 0.1035 0.0111 0.0854summer 0.0013 0.0421 0.0499 0.5950 0.0096 0.0730winter 0.0000 NA 0.0000 NA 0.0000 NAsummer 0.0000 NA 0.0000 NA 0.0000 NAwinter 0.0000 NA 0.0002 NA 0.0000 NAsummer 0.0003 0.0337 0.0149 0.2654 0.0000 NAwinter 0.0000 NA 0.0015 0.0098 0.0004 0.0050summer 0.0002 0.0326 0.0009 0.0052 0.0004 0.0023winter 0.0062 0.0601 0.0147 0.1950 0.0002 0.0660summer 0.1121 0.6317 0.0374 0.2864 0.0002 0.0168winter 0.0000 NA 0.0494 0.4458 0.0001 0.0044summer 0.0004 0.0218 0.1609 0.8763 0.0006 0.0073winter 0.0000 NA 0.0000 NA 0.0000 NAsummer 0.0000 NA 0.0000 NA 0.0000 NAwinter 0.0000 NA 0.0001 0.0195 0.0745 0.1839summer 0.0000 NA 0.0001 0.0059 0.0324 0.1311winter 0.0005 0.0088 0.0165 0.0985 0.0199 0.0947summer 0.0177 0.0404 0.0292 0.1240 0.0072 0.0209winter 0.0000 NA 0.0000 NA 0.0000 NAsummer 0.0001 0.0226 0.0000 NA 0.0000 NASeasonwinter 0.0236 0.2089 0.0087 0.4473 0.0000 NAsummer 0.0493 0.1771 0.0002 0.0150 0.0000 NAwinter 0.0114 0.1428 0.0001 0.0050 0.0146 0.0632summer 0.0011 0.0076 0.0010 0.0204 0.0041 0.0318winter 0.0044 0.0196 0.0776 0.4273 0.0458 0.0285summer 0.0109 0.0099 0.0119 0.0381 0.0258 0.0227winter 0.0000 NA 0.0101 0.1032 0.0721 0.2031summer 0.0001 0.0325 0.0158 0.2192 0.0994 0.2876
Other slope rockfish
Pacific hake
Spiny dogfish
Splitnose rockfish
Starry flounder
Petrale sole
Sablefish
Sharpchin rockfish
Shortbelly rockfish
Unspecified grenadiers
SOUTH OF 40°10' N Lat. Depth interval (fathoms)0-125 126-250 ≥ 250
Non-rebuilding species (cont.) Denominator = Retained groundfish (mt)
Shortspine thornyhead
Unspecified skate
Yellowtail rockfish
Non-rebuilding species Denominator = Retained groundfish (mt)
Other non-FMP flatfish
Other nongroundfish
Tanner crab
Dungeness crab
47

Table 5a. Discard ratios and standard errors from observed trips north of 40°10' N latitude in the 2008 limited-entry bottom trawl fishery by season and depth. Ratios are computed as the observed discard weight (lbs) divided by the observed tow duration (hrs). Winter season is January-April and November-December and summer season is May-October. Species are grouped according to Appendix C. Columns with darker shading signify that data were combined across more than one depth interval.
Discard ratio SE
Discard ratio SE
Discard ratio SE
Seasonwinter 0.0081 0.1941 0.0000 NAsummer 0.0065 NA 0.0285 2.0940 0.0000 NAwinter 2.4116 71.6953 0.0010 NAsummer 0.6447 0.6049 0.1437 0.7548 0.0231 0.4430winter 18.2163 2.8403 0.3872 0.2584summer 0.1120 0.2245 5.9260 1.6401 0.1813 0.0936winter 3.5755 1.7170 0.0848 0.1705summer 0.0909 5.1420 4.0373 1.5548 0.0404 0.0426winter 0.6512 1.9996 0.0008 0.0096summer 0.0185 3.0964 0.0335 0.1394 0.0007 0.0107winter 0.0000 NA 0.0000 NAsummer 0.0163 0.3665 0.0038 0.1250 0.0000 NA
Non-rebuilding specieswinter 40.8878 6.8047 8.0435 1.7625summer 85.6858 7.1950 16.1580 2.1467 3.8378 0.9743winter 2.0574 18.6292 0.0460 1.3866summer 14.8272 5.6738 1.0116 16.5059 0.0584 1.1559winter 0.0000 NA 0.0000 NAsummer 0.0000 NA 0.0000 NA 0.0000 NAwinter 0.0000 NA 0.0000 NAsummer 0.0020 0.0427 0.0000 NA 0.0000 NAwinter 0.0469 1.5862 0.0010 0.1161summer 0.0000 NA 0.0386 11.7818 0.0000 NAwinter 21.8999 5.2394 22.8151 3.8369summer 9.1811 1.8829 0.8820 0.2180 16.1869 2.7355winter 0.8117 0.4629 0.0149 0.0252summer 15.3283 1.9228 0.0196 0.0462 0.0003 0.0019winter 0.0000 NA 0.0000 NAsummer 0.0009 0.0360 0.0000 NA 0.0000 NAwinter 3.4475 2.1343 0.0321 0.0781summer 17.9073 4.1162 0.4803 0.7078 0.0000 NAwinter 27.1084 2.8506 7.0309 1.2819summer 30.0098 6.4137 10.6070 1.1255 3.1634 0.6483winter 0.2532 0.0899 5.9428 0.6390summer 0.0000 NA 0.9046 0.1667 12.4357 0.9682winter 0.0114 0.6005 2.0531 6.1069summer 0.0000 NA 0.0168 0.2350 0.1550 1.9445winter 2.8230 0.2779 0.2393 0.1916summer 33.4874 1.4200 0.5037 0.0877 0.3071 0.1081winter 5.9940 1.2252 0.8352 1.3915summer 20.2129 3.3511 5.6673 1.1094 0.5862 1.6082winter 0.0000 NA 0.0000 NAsummer 0.0196 0.1454 0.0000 NA 0.0000 NAwinter 0.5119 0.2643 0.0153 0.0574summer 0.3378 0.2755 0.7661 0.5925 0.0222 0.0934winter 4.9975 0.4041 0.6965 0.2411summer 0.0989 0.6605 10.4091 0.5021 1.1694 0.1404
NORTH OF 40°10' N Lat. Depth interval (fathoms)0-125 126-250 ≥ 250
Rebuilding species Denominator = Tow duration (hrs)
Bocaccio
Canary rockfish
Darkblotched rockfish
Pacific ocean perch
Widow rockfish
Yelloweye rockfish
Denominator = Tow duration (hrs)
Arrowtooth flounder
Big skate
Black rockfish (North of 46° 16' N. lat.)
Black rockfish (South of 46° 16' N. lat.)
Chilipepper
Dover sole
English sole
Kelp greenling
Lingcod
Longnose skate
Longspine thornyhead
Mixed thornyheads
Other flatfish
Other groundfish
Other nearshore rockfish
Other shelf rockfish
Other slope rockfish
48

Table 5a continued.
Discard ratio SE
Discard ratio SE
Discard ratio SE
Seasonwinter 0.0010 0.0146 0.0000 NAsummer 0.0443 0.0369 0.0026 0.0417 0.0000 NAwinter 70.9406 11.4656 11.6457 2.6215summer 56.1911 28.6265 78.1529 6.7554 19.6039 3.6047winter 4.7448 1.9226 0.1014 0.1536summer 5.2870 0.4143 0.0093 0.0178 0.0004 0.0012winter 0.0406 NA 0.0003 NAsummer 0.0000 NA 0.0101 0.1824 0.0052 0.1121winter 5.8994 0.9458 6.5874 0.8092summer 2.3743 0.7726 5.8578 0.9324 3.7626 0.7565winter 0.2638 1.7949 0.0007 0.0414summer 0.0038 NA 0.4426 3.5204 0.0005 0.0190winter 0.0011 NA 0.0000 NAsummer 0.0000 NA 0.0000 NA 0.0000 NAwinter 2.3656 0.2960 0.4805 0.0480summer 0.0025 0.0097 4.2616 0.3693 1.2209 0.1148winter 0.3502 5.6720 0.0039 0.4367summer 0.0011 NA 0.0134 1.4464 0.0000 NAwinter 94.4475 10.4210 5.1151 3.8134summer 129.4688 35.2111 11.6550 4.3399 1.7969 5.1301winter 9.2328 2.4864 0.1591 0.4517summer 0.0999 4.5101 5.3998 1.9752 0.7096 2.5052winter 0.0036 NA 0.0000 NAsummer 0.5268 0.2550 0.0000 NA 0.0000 NAwinter 0.1255 0.6684 9.9962 1.2479summer 0.0000 NA 0.2337 0.3106 11.2672 0.8965winter 4.8603 0.2250 4.0201 0.2353summer 2.5761 0.3841 4.7983 0.1707 2.1478 0.0917winter 0.0092 NA 0.0000 NAsummer 0.0000 NA 0.0048 0.3068 0.0000 NAwinter 0.0263 0.8827 0.0000 NAsummer 0.1280 0.1695 0.0812 0.3391 0.0000 NA
winter 0.4937 1.0715 0.0017 0.0927summer 68.5549 5.1186 0.1022 0.3338 0.0009 0.0974winter 0.8215 0.4144 1.4268 0.2737summer 2.2849 0.8773 0.2283 0.0569 1.7328 0.2028winter 6.3589 0.3486 7.0077 0.1373summer 2.9719 0.9505 9.0392 0.2314 9.4992 0.1861winter 1.7957 0.5197 31.2346 2.1485summer 0.0005 NA 2.1991 0.3694 20.7000 1.1865
NORTH OF 40°10' N Lat. Depth interval (fathoms)0-125 126-250 ≥ 250
Non-rebuilding species (cont.) Denominator = Tow duration (hrs)
Pacific cod (North of 43° N. lat.)
Pacific hake
Petrale sole
Redstripe rockfish
Sablefish
Sharpchin rockfish
Shortbelly rockfish
Shortspine thornyhead
Silvergray rockfish
Spiny dogfish
Splitnose rockfish
Starry flounder
Unspecified grenadiers
Unspecified skate
Yellowmouth rockfish
Yellowtail rockfish
Non-groundfish species
Other nongroundfish
Tanner crab
Denominator = Tow duration (hrs)
Dungeness crab
Other non-FMP flatfish
49

Table 5b. Discard ratios and standard errors from observed trips north of 40° 10’ N latitude in the 2008 limited entry groundfish bottom trawl fishery by season and depth. Ratios are computed as the observed discard weight (lbs) divided by the observed tow duration (hrs) summarized in each strata. Winter season is January-April and November-December and summer season is May-October. Species are grouped according to Appendix C.
Discard ratio SE
Discard ratio SE
Discard ratio SE
Seasonwinter 0.6341 NA 0.0440 NA 0.0000 NAsummer 5.3283 5.2260 0.9095 1.9542 0.0000 NAwinter 0.0000 NA 0.0000 NA 0.0000 NAsummer 0.0654 0.0935 0.0000 NA 0.0000 NAwinter 0.0000 NA 0.0000 NA 0.0000 NAsummer 0.1924 7.0319 0.0361 NA 0.0000 NAwinter 0.0417 0.0798 0.1001 0.1722 0.0000 NAsummer 0.0504 0.1629 0.3633 0.2446 0.0000 NAwinter 0.0677 NA 0.0000 NA 0.0000 NAsummer 0.3149 2.8662 0.7413 12.6035 0.0000 NAwinter 0.0000 NA 0.0000 NA 0.0000 NAsummer 0.0134 NA 0.0000 NA 0.0000 NA
Non-rebuilding specieswinter 0.7360 0.1986 5.3038 2.3246 0.9523 9.3369summer 0.7641 1.1855 1.7268 1.9402 0.2047 1.0733winter 0.0000 NA 0.0000 NA 0.0000 NAsummer 0.0000 NA 0.0746 0.3603 0.0000 NAwinter 15.0147 10.6780 0.0496 NA 0.0000 NAsummer 0.8885 6.6562 0.0000 NA 0.0000 NAwinter 0.0000 NA 0.0000 NA 0.0000 NAsummer 0.0000 NA 0.0000 NA 0.0000 NAwinter 0.0000 NA 0.0056 0.0083 0.0000 NAsummer 0.0085 0.1473 0.0656 0.0966 0.0025 0.0094winter 0.6228 0.1573 1.2400 2.4180 0.0000 NAsummer 59.4674 13.7723 2.3549 2.1249 0.0000 NAwinter 3.7657 1.6149 7.7693 1.6468 44.0803 6.9266summer 5.4374 0.9702 18.9511 4.5297 43.2384 9.0950winter 0.9752 0.2488 3.2371 1.9111 0.0000 NAsummer 21.8141 1.8862 0.6190 2.0771 0.0000 NAwinter 0.0000 NA 0.0000 NA 0.0000 NAsummer 0.0000 NA 0.0000 NA 0.0000 NAwinter 4.8962 1.6633 0.0000 NA 0.0000 NAsummer 9.3101 6.6999 1.8639 3.1290 0.0000 NAwinter 220.1200 41.9681 67.9512 9.6579 3.5059 2.4746summer 54.4675 6.3045 75.7031 13.1645 17.7523 4.7123winter 0.0000 NA 0.4558 0.6406 22.1718 2.0517summer 0.0000 NA 5.9856 12.7956 9.8954 2.7539winter 0.0000 NA 0.0000 NA 0.1118 NAsummer 0.0037 NA 0.0000 NA 0.0000 NAwinter 5.7405 0.6585 4.1131 0.8854 0.0138 0.0294summer 50.5421 3.3900 4.9019 1.2702 0.2991 0.2453winter 11.5389 7.1084 13.6299 6.8743 1.2614 8.5989summer 23.3308 7.3594 35.4802 22.0607 0.5171 0.5830winter 0.0000 NA 0.0000 NA 0.0000 NAsummer 0.0022 0.1139 0.0000 NA 0.0000 NAwinter 3.3652 0.6525 0.1908 0.3154 0.0000 NAsummer 20.1775 18.7754 7.5372 2.6906 0.0000 NA
SOUTH OF 40°10' N Lat. Depth interval (fathoms)0-125 126-250 ≥ 250
Rebuilding species Denominator = Tow duration (hrs)
Bocaccio
Canary rockfish
Cowcod
Darkblotched rockfish
Widow rockfish
Yelloweye rockfish
Denominator = Tow duration (hrs)
Arrowtooth flounder
Bank rockfish
Big skate
Black rockfish
Blackgill rockfish
Chilipepper
Dover sole
English sole
Kelp greenling
Lingcod
Longnose skate
Longspine thornyhead
Mixed thornyheads
Other flatfish
Other groundfish
Other nearshore rockfish
Other shelf rockfish
50

Table 5b continued.
Discard ratio SE
Discard ratio SE
Discard ratio SE
Seasonwinter 0.0000 NA 1.2971 0.3276 0.0000 NAsummer 0.0499 0.0808 3.7211 1.0696 1.3983 0.4837winter 0.4385 0.3109 40.1402 12.9200 1.8765 6.8218summer 16.5184 5.3803 79.4151 45.5025 16.1766 4.7223winter 3.0256 0.6784 1.7026 0.5437 0.0036 0.0293summer 6.9292 0.9769 0.0465 0.0812 0.0000 NAwinter 0.1903 0.1704 3.2249 2.6129 5.1572 1.9770summer 0.5452 0.9037 37.0271 21.6625 6.1380 2.1626winter 0.0000 NA 0.0000 NA 0.0000 NAsummer 0.0000 NA 0.0000 NA 0.0000 NAwinter 0.0113 NA 0.1098 NA 0.0000 NAsummer 0.1177 0.7265 11.0452 8.6208 0.0000 NAwinter 0.0000 NA 0.8141 0.2066 0.1691 0.1172summer 0.0809 0.7099 0.6896 0.1722 0.2776 0.0684winter 4.9966 1.1782 7.8503 4.2978 0.0961 1.5415summer 47.5755 13.3719 27.7315 9.6290 0.0987 0.4899winter 0.0000 NA 26.4828 10.7409 0.0320 0.1024summer 0.1739 0.4728 119.4508 30.8913 0.3801 0.2168winter 0.0000 NA 0.0000 NA 0.0000 NAsummer 0.0000 NA 0.0000 NA 0.0000 NAwinter 0.0000 NA 0.0530 0.4881 34.7381 4.0016summer 0.0000 NA 0.0436 0.2078 20.7733 3.7257winter 0.4009 0.1776 8.8164 1.6220 9.2787 2.0347summer 7.4950 0.8121 21.6625 4.0078 4.5918 0.5754winter 0.0000 NA 0.0000 NA 0.0000 NAsummer 0.0366 0.4834 0.0000 NA 0.0000 NASeasonwinter 19.0308 4.2033 4.6786 10.8802 0.0000 NAsummer 20.9170 3.3570 0.1430 0.5237 0.0000 NAwinter 9.2159 3.7364 0.0544 0.1195 6.8232 1.2980summer 0.4599 0.1510 0.7672 0.7211 2.6512 0.8986winter 3.5115 0.5569 41.5348 10.5069 21.3528 0.5613summer 4.6145 0.1775 8.8494 1.3159 16.5276 0.6317winter 0.0000 NA 5.4244 2.1211 33.5936 3.6580summer 0.0216 0.7051 11.6959 7.4944 63.6372 7.6923
SOUTH OF 40°10' N Lat. Depth interval (fathoms)0-125 126-250 ≥ 250
Non-rebuilding species (cont.) Denominator = Tow duration (hrs)
Other slope rockfish
Pacific hake
Petrale sole
Sablefish
Sharpchin rockfish
Shortbelly rockfish
Shortspine thornyhead
Spiny dogfish
Splitnose rockfish
Denominator = Tow duration (hrs)
Dungeness crab
Starry flounder
Unspecified grenadiers
Unspecified skate
Yellowtail rockfish
Tanner crab
Other non-FMP flatfish
Other nongroundfish
Non-rebuilding species
51

Table 6a. Bycatch ratios and standard errors from observed trips north of 40°10' N latitude in the 2008 limited-entry bottom trawl fishery by season and depth. Ratios are computed as the observed total catch weight divided by the observed weight (adjusted to fish tickets) of retained FMP groundfish species (excluding Pacific hake). Winter season is January-April and November-December and summer season is May-October. Species are grouped according to Appendix C. Columns with darker shading signify that data were combined across more than one depth interval.
Bycatch ratio SE
Bycatch ratio SE
Bycatch ratio SE
Seasonwinter 0.0001 0.0100 0.0000 NAsummer 0.0000 NA 0.0000 0.0596 0.0000 NAwinter 0.0025 1.8321 0.0000 NAsummer 0.0014 0.0223 0.0002 0.0215 0.0000 0.0183winter 0.0261 0.0841 0.0029 0.0186summer 0.0002 0.0082 0.0127 0.0602 0.0030 0.0110winter 0.0116 0.0702 0.0007 0.0160summer 0.0011 0.9739 0.0108 0.0561 0.0009 0.0223winter 0.0009 0.0514 0.0001 0.0050summer 0.0000 0.1097 0.0001 0.0043 0.0000 0.0027winter 0.0000 0.0049 0.0000 0.0012summer 0.0000 0.0132 0.0000 0.0033 0.0000 0.0009
Non-rebuilding specieswinter 0.2478 0.5431 0.0846 0.3516summer 0.1921 0.4054 0.2535 0.5238 0.0710 0.4382winter 0.0021 0.4779 0.0001 0.0349summer 0.0275 0.2090 0.0011 0.4684 0.0001 0.0480winter 0.0000 NA 0.0000 NAsummer 0.0000 0.0036 0.0000 NA 0.0000 NAwinter 0.0000 NA 0.0000 NAsummer 0.0000 0.0018 0.0000 NA 0.0000 NAwinter 0.0001 0.0552 0.0000 0.0027summer 0.0000 NA 0.0000 0.3337 0.0000 NAwinter 0.3420 0.7975 0.6645 0.8315summer 0.4175 0.5488 0.4714 0.6103 0.4607 0.5177winter 0.0255 0.1170 0.0010 0.0155summer 0.1264 0.2265 0.0008 0.0158 0.0004 0.0075winter 0.0000 NA 0.0000 NAsummer 0.0000 0.0011 0.0000 NA 0.0000 NAwinter 0.0108 0.0677 0.0007 0.0224summer 0.0421 0.1516 0.0072 0.1125 0.0009 0.2742winter 0.0376 0.0892 0.0137 0.0448summer 0.0530 0.2356 0.0259 0.0448 0.0097 0.0356winter 0.0042 0.0376 0.0608 0.1062summer 0.0000 NA 0.0074 0.0353 0.1426 0.1645winter 0.0005 0.2950 0.0068 0.3105summer 0.0001 0.4084 0.0044 0.3399 0.0105 1.1426winter 0.0263 0.0416 0.0102 0.0288summer 0.1832 0.1045 0.0253 0.0440 0.0185 0.0361winter 0.0062 0.0328 0.0010 0.0350summer 0.0356 0.1237 0.0063 0.0328 0.0011 0.0668winter 0.0000 NA 0.0000 NAsummer 0.0000 0.0049 0.0000 NA 0.0000 NAwinter 0.0020 0.0250 0.0001 0.0033summer 0.0022 0.0339 0.0010 0.0171 0.0000 0.0039winter 0.0171 0.0247 0.0039 0.0191summer 0.0008 0.0680 0.0275 0.0201 0.0086 0.0157
NORTH OF 40°10' N Lat. Depth interval (fathoms)0-125 126-250 ≥ 250
Rebuilding species Denominator = Retained groundfish (mt)
Bocaccio
Canary rockfish
Darkblotched rockfish
Pacific ocean perch
Widow rockfish
Yelloweye rockfish
Denominator = Retained groundfish (mt)
Arrowtooth flounder
Big skate
Black rockfish (North of 46° 16' N. lat.)
Black rockfish (South of 46° 16' N. lat.)
Chilipepper
Dover sole
English sole
Kelp greenling
Lingcod
Longnose skate
Longspine thornyhead
Mixed thornyheads
Other flatfish
Other groundfish
Other nearshore rockfish
Other shelf rockfish
Other slope rockfish
52

Table 6a continued.
Bycatch ratio SE
Bycatch ratio SE
Bycatch ratio SE
Seasonwinter 0.0007 0.1350 0.0000 0.0017summer 0.0073 0.0956 0.0000 0.0086 0.0001 0.0042winter 0.0727 0.3056 0.0134 0.0678summer 0.0989 1.0227 0.0868 0.2062 0.0356 0.1536winter 0.2704 0.5080 0.0053 0.0803summer 0.1496 0.1560 0.0014 0.0321 0.0002 0.0051winter 0.0000 NA 0.0000 NAsummer 0.0000 NA 0.0000 0.0052 0.0000 0.0047winter 0.0413 0.0800 0.1436 0.1812summer 0.0127 0.0633 0.1216 0.1519 0.2407 0.2256winter 0.0003 0.0459 0.0000 0.0010summer 0.0000 NA 0.0005 0.0999 0.0000 0.0008winter 0.0000 NA 0.0000 NAsummer 0.0000 NA 0.0000 NA 0.0000 NAwinter 0.0242 0.0499 0.0439 0.0501summer 0.0014 0.1058 0.0668 0.0684 0.0947 0.0784winter 0.0004 0.1453 0.0000 0.0109summer 0.0000 NA 0.0000 0.0412 0.0000 NAwinter 0.0968 0.2913 0.0105 0.2729summer 0.2278 1.2702 0.0129 0.1251 0.0033 0.2131winter 0.0095 0.0654 0.0002 0.0114summer 0.0002 0.1600 0.0063 0.0567 0.0015 0.1041winter 0.0000 NA 0.0000 NAsummer 0.0034 0.0277 0.0000 NA 0.0007 0.4713winter 0.0003 0.0332 0.0160 0.0434summer 0.0000 NA 0.0003 0.0092 0.0246 0.0464winter 0.0764 0.1045 0.0326 0.0371summer 0.1814 0.3455 0.0648 0.0679 0.0310 0.0343winter 0.0000 NA 0.0000 NAsummer 0.0000 NA 0.0000 0.0087 0.0000 NAwinter 0.0001 0.0317 0.0000 0.0012summer 0.0066 0.1077 0.0003 0.0138 0.0001 0.0044
winter 0.0005 0.0279 0.0000 0.0024summer 0.1206 0.2020 0.0001 0.0095 0.0000 0.0041winter 0.0008 0.0108 0.0016 0.0073summer 0.0040 0.0321 0.0003 0.0017 0.0031 0.0089winter 0.0103 0.0169 0.0093 0.0049summer 0.0061 0.0343 0.0113 0.0073 0.0188 0.0083winter 0.0018 0.0141 0.0361 0.0621summer 0.0000 NA 0.0024 0.0110 0.0376 0.0555
NORTH OF 40°10' N Lat. Depth interval (fathoms)0-125 126-250 ≥ 250
Non-rebuilding species (cont.) Denominator = Retained groundfish (mt)
Pacific cod (North of 43° N. lat.)
Pacific hake
Petrale sole
Redstripe rockfish
Sablefish
Sharpchin rockfish
Shortbelly rockfish
Shortspine thornyhead
Silvergray rockfish
Spiny dogfish
Splitnose rockfish
Starry flounder
Unspecified grenadiers
Unspecified skate
Yellowmouth rockfish
Yellowtail rockfish
Non-groundfish species
Other nongroundfish
Tanner crab
Denominator = Retained groundfish (mt)
Dungeness crab
Other non-FMP flatfish
53

Table 6b. Bycatch ratios and standard errors from observed trips south of 40° 10’ N latitude in the 2008 limited entry groundfish bottom trawl fishery by season and depth. Ratios are computed as the observed total catch weight divided by the observed weight (adjusted to fish tickets) of retained FMP groundfish species (excluding Pacific hake). Winter season is January-April and November-December and summer season is May-October. Species are grouped according to Appendix C.
Discard ratio SE
Discard ratio SE
Discard ratio SE
Seasonwinter 0.0008 NA 0.0001 NA 0.0000 NAsummer 0.0142 0.2449 0.0012 0.0546 0.0002 0.0164winter 0.0002 NA 0.0000 NA 0.0000 NAsummer 0.0027 0.0617 0.0000 NA 0.0003 0.0261winter 0.0000 NA 0.0000 NA 0.0000 NAsummer 0.0005 0.3228 0.0000 NA 0.0000 NAwinter 0.0001 0.0065 0.0096 0.1878 0.0002 0.0123summer 0.0003 0.0075 0.0081 0.0948 0.0059 0.1147winter 0.0001 NA 0.0000 NA 0.0000 NAsummer 0.0007 0.1340 0.0010 0.3430 0.0000 NAwinter 0.0000 NA 0.0000 NA 0.0000 NAsummer 0.0000 NA 0.0000 NA 0.0000 NA
Non-rebuilding specieswinter 0.0009 0.0093 0.0099 0.1176 0.0022 0.3919summer 0.0021 0.0544 0.0060 0.1245 0.0004 0.0320winter 0.0000 NA 0.0000 NA 0.0000 0.0006summer 0.0000 NA 0.1712 8.3549 0.0000 NAwinter 0.0186 0.4123 0.0001 NA 0.0000 NAsummer 0.0021 0.3084 0.0000 NA 0.0000 NAwinter 0.0000 NA 0.0000 NA 0.0000 NAsummer 0.0000 NA 0.0000 NA 0.0002 NAwinter 0.0000 NA 0.0022 0.0239 0.0000 NAsummer 0.0002 0.0083 0.0007 0.0229 0.0029 0.0915winter 0.0166 0.1068 0.0049 0.1013 0.0019 0.1880summer 0.1995 0.7375 0.0090 0.1057 0.0024 0.0751winter 0.0053 0.0569 0.5619 3.4935 0.3810 1.2466summer 0.0761 0.5313 0.4463 1.6271 0.5570 1.0455winter 0.1214 0.8106 0.0093 0.0971 0.0002 0.0409summer 0.1454 0.2015 0.0037 0.1376 0.0000 NAwinter 0.0000 NA 0.0000 NA 0.0000 NAsummer 0.0000 NA 0.0000 NA 0.0000 NAwinter 0.0406 0.4437 0.0080 0.2354 0.0001 0.0078summer 0.0488 0.3385 0.0035 0.0856 0.0000 NAwinter 0.2729 2.1585 0.1269 0.6342 0.0075 0.1109summer 0.1284 0.3479 0.1020 0.4385 0.0335 0.1667winter 0.0000 NA 0.0011 0.0267 0.4086 0.7107summer 0.0002 0.1615 0.0089 0.3479 0.2360 0.4637winter 0.0000 NA 0.0000 NA 0.0002 NAsummer 0.0000 NA 0.0000 NA 0.0000 NAwinter 0.0137 0.0432 0.0194 0.0892 0.0022 0.1437summer 0.3328 0.3942 0.0202 0.0967 0.0170 0.1242winter 0.0143 0.2336 0.0254 0.2981 0.0027 0.3694summer 0.0550 0.3478 0.0478 0.6152 0.0008 0.0199winter 0.0000 NA 0.0000 NA 0.0000 NAsummer 0.0001 0.0177 0.0000 NA 0.0000 NAwinter 0.0042 0.0268 0.0004 0.0127 0.0000 NAsummer 0.0576 0.8818 0.0104 0.0764 0.0001 0.0033
SOUTH OF 40°10' N Lat. Depth interval (fathoms)0-125 126-250 ≥ 250
Rebuilding species Denominator = Retained groundfish (mt)
Bocaccio
Canary rockfish
Cowcod
Darkblotched rockfish
Widow rockfish
Yelloweye rockfish
Denominator = Retained groundfish (mt)
Arrowtooth flounder
Bank rockfish
Big skate
Black rockfish
Blackgill rockfish
Chilipepper
Dover sole
English sole
Kelp greenling
Lingcod
Longnose skate
Longspine thornyhead
Mixed thornyheads
Other flatfish
Other groundfish
Other nearshore rockfish
Other shelf rockfish
54

Table 6b continued.
Discard ratio SE
Discard ratio SE
Discard ratio SE
Seasonwinter 0.0000 NA 0.0361 0.1420 0.0007 0.0113summer 0.0139 0.7959 0.0501 0.2446 0.0139 0.0724winter 0.0005 0.0107 0.0750 0.6185 0.0040 0.2932summer 0.0389 0.2573 0.1070 1.2592 0.0253 0.1658winter 0.8250 4.5466 0.2989 1.2992 0.0002 0.0207summer 0.4854 0.7824 0.1527 1.5434 0.0002 NAwinter 0.0010 0.0461 0.0809 0.4613 0.2381 0.5474summer 0.0099 0.3504 0.1345 0.7409 0.1839 0.4458winter 0.0000 NA 0.0000 NA 0.0000 NAsummer 0.0000 NA 0.0000 NA 0.0000 NAwinter 0.0000 NA 0.0002 NA 0.0000 NAsummer 0.0003 0.0337 0.0149 0.2654 0.0000 NAwinter 0.0000 NA 0.0289 0.2070 0.0991 0.2537summer 0.0014 0.1479 0.0090 0.0523 0.0573 0.1276winter 0.0062 0.0601 0.0147 0.1950 0.0002 0.0660summer 0.2716 1.1594 0.0522 0.4943 0.0002 0.0168winter 0.0000 NA 0.0644 0.4694 0.0049 0.0878summer 0.0010 0.0247 0.2776 1.1062 0.0139 0.0739winter 0.0000 NA 0.0001 0.0068 0.0000 NAsummer 0.0001 0.0128 0.0000 NA 0.0000 0.0026winter 0.0000 NA 0.0001 0.0195 0.0906 0.1910summer 0.0000 NA 0.0001 0.0059 0.0357 0.1344winter 0.0005 0.0088 0.0170 0.1003 0.0202 0.0948summer 0.0836 0.1697 0.0692 0.2795 0.0156 0.1045winter 0.0000 NA 0.0000 NA 0.0000 NAsummer 0.0001 0.0226 0.0000 NA 0.0000 NASeasonwinter 0.0236 0.2089 0.0087 0.4473 0.0000 NAsummer 0.0493 0.1771 0.0002 0.0150 0.0000 NAwinter 0.0114 0.1428 0.0001 0.0050 0.0146 0.0632summer 0.0011 0.0076 0.0010 0.0204 0.0041 0.0318winter 0.0044 0.0196 0.0776 0.4273 0.0458 0.0285summer 0.0121 0.0107 0.0240 0.1228 0.0313 0.0264winter 0.0000 NA 0.0101 0.1032 0.0721 0.2031summer 0.0001 0.0325 0.0158 0.2192 0.0994 0.2876
SOUTH OF 40°10' N Lat. Depth interval (fathoms)0-125 126-250 ≥ 250
Non-rebuilding species (cont.) Denominator = Retained groundfish (mt)
Other slope rockfish
Pacific hake
Petrale sole
Sablefish
Sharpchin rockfish
Shortbelly rockfish
Shortspine thornyhead
Spiny dogfish
Splitnose rockfish
Denominator = Retained groundfish (mt)
Dungeness crab
Starry flounder
Unspecified grenadiers
Unspecified skate
Yellowtail rockfish
Tanner crab
Other non-FMP flatfish
Other nongroundfish
Non-rebuilding species
55

Table 7. Summary of the number of length measurements and the number of individual fish sexed by WCGOP observers in the limited entry groundfish bottom trawl fishery from September 2003 through April 2009. The date range of biological data for each species is also provided. Biological data is only summarized for species with more than 30 observations.
Years available # lengths # sexes
Bocaccio 2004 - Apr 2009 1585 812Canary rockfish 2004 - Apr 2009 2485 1557Cowcod 2004 - Apr 2009 277 138Darkblotched rockfish Sep 2003 - Apr 2009 5521 2221Pacific ocean perch 2004 - Apr 2009 3278 680Widow rockfish 2004 - Apr 2009 451 127Yelloweye rockfish Sep 2003 - Apr 2009 134 90
Other speciesArrowtooth flounder 2006 - Apr 2009 5705 1Aurora rockfish 2004 - Apr 2009 5812 3Bank rockfish 2006 - Apr 2009 32 0Blackgill rockfish 2004 - Apr 2009 596 5Chilipepper rockfish 2004, 2006 - Apr 2009 1155 6Dover sole 2006 - Apr 2009 6222 0Dungeness crab 2007 - Apr 2009 1865 1680English sole 2006 - Apr 2009 3225 0Greenstriped rockfish 2005 - Apr 2009 1084 6Lingcod 2004 - Apr 2009 7277 503Longnose skate 2006 - Apr 2009 7008 6787Longspine thornyhead 2006 - Apr 2009 5731 0Pacific halibut Sep 2003 - Apr 2009 3833 0Pacific sanddab 2006 - Apr 2009 2713 0Petrale sole 2006 - Apr 2009 2621 1795Redbanded rockfish 2006 - Apr 2009 1969 0Rosethorn rockfish 2007 - Apr 2009 67 0Rougheye rockfish 2004 - Apr 2009 2108 79Sablefish 2004 - Apr 2009 3782 170Sharpchin rockfish 2007 - Apr 2009 47 0Shortraker 2004 - Apr 2009 745 28Shortspine thornyhead 2006 - Apr 2009 5403 5Silvergray rockfish 2004 - Apr 2009 95 25Spiny dogfish 2006 - Apr 2009 5742 5667Splitnose rockfish 2004, 2006 - Apr 2009 3322 2Starry flounder 2006 - 2008 192 0Stripetail rockfish 2006 - Apr 2009 883 0Unidentified skate 2007 - 2008 106 106Yellowtail rockfish 2004, 2006 - Apr 2009 164 0
Rebuilding species
56

Table 8. Summary of biological data for protected resources collected by WCGOP observers in the limited entry groundfish bottom trawl fishery from September 2003 through April 2009. The number of length measurements and the number of individuals sexed is reported for each year where data are available.
# lengths # sexesSalmonChinook salmon
Sep - Dec 2003 8 82004 276 2652005 118 1052006 9 92007 28 282008 54 53Jan - Apr 2009 61 59
Chum salmon2003 1 02004 1 1
Coho salmon2004 5 52005 1 12007 2 1
Unidentified salmon2004 3 3
57

APPENDIX A WCGOP Database Table Hierarchy
TRIPS
FISHING_ACTIVITIES
FISHING_LOCATIONS
CATCHES
SPECIES COMPOSITION
SPECIES_COMPOSITION_ITEMS
BIO_SPECIMENS
BIO_SPECIMEN_ITEMS
DISSECTIONS
Database Table Descriptions
The database tables listed below are a subset of the tables contained in the entire Oracle database. They represent the tables that are actually used to contain the WCGOP data collected by the WCGOP.
BIO_SPECIMENS Sets of species physical measurements resulting from
sampling catches occurring in a tow or set BIO_SPECIMEN_ITEMS Physical measurements collected for an individual fish,
mammal or bird occurring in a biological sample CATCHES PacFIN catch category based on estimates of fish
caught during a tow or set CATCH_CATEGORIES PacFIN catch categories
DISSECTIONS Physical specimens collected for an individual fish, mammal or bird
FISHING_ACTIVITIES Fishing tows or sets occurring during a trip
FISHING_LOCATIONS Locations of tows or sets
PORTS Coastal cities where fishing activity is based out of
SPECIES Fish, mammal, and bird species that might be encountered during fishing
SPECIES_COMPOSITIONS Sets of species weights and counts resulting from sampling catches occurring in a tow or set
SPECIES_COMPOSITIONS_ITEMS Weights and counts for individual species occurring in a species composition sample
TRIPS Sets of fishing activities that occur between the time a vessel leaves port and when it returns
VESSELS Trawl, longline, pot, or other fishing vessels
58

APPENDIX B
Common and scientific names of species included in the Pacific Coast Groundfish Fishery Man-agement Plan, as amended through Amendment 19 (PFMC 2008).
SHARKS
Big skate, Raja binoculata California skate, R. inornata Leopard shark, Triakis semifasciata Longnose skate, R. rhina Soupfin shark, Galeorhinus zyopterus Spiny dogfish, Squalus acanthias
RATFISH
Ratfish, Hydrolagus colliei
MORIDS
Finescale codling, Antimora microlepis
GRENADIERS
Pacific rattail, Coryphaenoides acrolepis
ROUNDFISH
Cabezon, Scorpaenichthys marmoratus Kelp greenling, Hexagrammos decagrammus Lingcod, Ophiodon elongatus Pacific cod, Gadus macrocephalus Pacific whiting, (hake) Merluccius productus Sablefish, Anoplopoma fimbria
FLATFISH
Arrowtooth flounder, (turbot) Atheresthes stomias Butter sole, Isopsetta isolepis Curlfin sole, Pleuronichthys decurrens Dover sole, Microstomus pacificus English sole, Parophrys vetulus Flathead sole, Hippoglossoides elassodon Pacific sanddab, Citharichthys sordidus Petrale sole, Eopsetta jordani Rex sole, Glyptocephalus zachirus Rock sole, Lepidopsetta bilineata Sand sole, Psettichthys melanostictus Starry flounder, Platichthys stellatus
59

ROCKFISH
Includes all genera and species of the family Scopaenidae, even if not listed, that occur in the Washington, Oregon, and California area. The Scopaenidae genera are Sebastes, Scorpaena, Sebastolobus, and Scorpaenodes.
Aurora, Sebastes. aurora Bank, S. rufus Black, S. melanops Black-and-yellow, S. chrysolmelas. Blackgill, S. melanostomus Blue, S. mystinus Bocaccio, S. paucispinis Bronzespotted, S. gilli Brown, S. auriculatus Calico, S. dalli California scorpionfish, Scorpaena guttata Canary, Sebastes pinniger Chameleon, S. phillipsi Chilipepper, S. goodei China, S. nebulosus Copper, S. caurinus Cowcod, S. levis Darkblotched, S. crameri Dusky, S. ciliatus Dwarf-red, S. rufianus Flag, S. rubrivinctus Freckled, S. lentiginosus Gopher, S. carnatus Grass, S. rastrelliger Greenblotched, S. rosenblatti Greenspotted, S. chlorostictus Greenstriped, S. elongatus Halfbanded, S. semicinctus Harlequin, S. variegatus Honeycomb, S. umbrosus Kelp, S. atrovirens Longspine thornyhead, Sebastolobus altivelis Mexican, Sebastes. macdonaldi Olive, S. serranoides Pink, S. eos Pinkrose, S. simulator Pygmy, S. wilsoni Pacific ocean perch, S. alutus Quillback, S. maliger Redbanded, S. babcocki Redstripe, S. proriger
60

Rosethorn, S. helvomaculatus Rosy, S. rosaceus Rougheye, S. aleutianus Sharpchin, S. zacentrus Shortbelly, S. jordani Shortraker, S. borealis Shortspine thornyhead, Sebastolobus alascanus Silvergrey, Sebastes. brevispinus Speckled, S. ovalis Splitnose rockfish, S. diploproa Squarespot, S. hopkinsi Starry, S. constellatus Stripetail, S. saxicola Swordspine, S. ensifer Tiger, S. nigorcinctus Treefish, S. serriceps Vermilion, S. miniatus Widow, S. entomelas Yelloweye, S. ruberrimus Yellowmouth, S. reedi Yellowtail, S. flavidus
61

APPENDIX C
Species indentification codes used in the Pacific Coast Fisheries Information Network (PacFIN) database and assigned to WCGOP observer data, with aggregated species groups used in this report (Tables 4-6).
PacFIN Species
ID PacFIN Common Name Species Group - North of 40˚ 10' N latitude
Species Group - South of 40˚ 10' N latitude FMP
ALBC ALBACORE Other nongroundfish Other nongroundfish
APLC ALASKA PLAICE Other non-FMP flatfish Other non-FMP flatfish
ARR1 NOM. AURORA ROCKFISH Other slope rockfish Other slope rockfish yes
ARRA AURORA ROCKFISH Other slope rockfish Other slope rockfish yes
ART1 NOM. ARROWTOOTH FLOUNDER Arrowtooth flounder Arrowtooth flounder yes
ARTH ARROWTOOTH FLOUNDER Arrowtooth flounder Arrowtooth flounder yes
ASRK PACIFIC ANGEL SHARK Other nongroundfish Other nongroundfish
BABL BLACK ABALONE Other nongroundfish Other nongroundfish
BANK BANK ROCKFISH Other slope rockfish Bank rockfish (Remaining rockfish) yes
BCAC BOCACCIO Bocaccio (Remaining rockfish) Bocaccio yes
BCC1 NOM. BOCACCIO Bocaccio (Remaining rockfish) Bocaccio yes
BCLM BUTTER CLAM Other nongroundfish Other nongroundfish
BGL1 NOM. BLACKGILL ROCKFISH Other slope rockfish Blackgill (Remaining rockfish) yes
BKCR BLUE KING CRAB Other nongroundfish Other nongroundfish
BLCK BLACK ROCKFISH Black rockfish Black rockfish yes
BLGL BLACKGILL ROCKFISH Other slope rockfish Blackgill (Remaining rockfish) yes
BLK1 NOM. BLACK ROCKFISH Black rockfish Black rockfish yes
BLU1 NOM. BLUE ROCKFISH Other nearshore rockfish Other nearshore rockfish yes
BLUR BLUE ROCKFISH Other nearshore rockfish Other nearshore rockfish yes
BMCK BULLET MACKEREL Other nongroundfish Other nongroundfish
BMRL BLUE MARLIN Other nongroundfish Other nongroundfish
BMSL BLUE OR BAY MUSSEL Other nongroundfish Other nongroundfish
BNK1 NOM. BANK ROCKFISH Other slope rockfish Bank rockfish (Remaining rockfish) yes
BRNZ BRONZESPOTTED ROCKFISH Other shelf rockfish Other shelf rockfish yes
BRW1 NOM. BROWN ROCKFISH Other nearshore rockfish Other nearshore rockfish yes
BRWN BROWN ROCKFISH Other nearshore rockfish Other nearshore rockfish yes
BRZ1 NOM. BRONZESPOTTED RK Other shelf rockfish Other shelf rockfish yes
BSJK BLACK SKIPJACK Other nongroundfish Other nongroundfish
BSKT BIG SKATE Big skate Big skate yes
BSOL BUTTER SOLE Other flatfish Other flatfish yes
BSRK BLUE SHARK Other nongroundfish Other nongroundfish
BSRM UNSP. BAIT SHRIMP Other nongroundfish Other nongroundfish
BTCR BAIRDI TANNER CRAB Tanner crab Tanner crab
BTNA BLUEFIN TUNA Other nongroundfish Other nongroundfish
BTRY BAT RAY Other nongroundfish Other nongroundfish
BYEL BLACK-AND-YELLOW ROCKFISH Other nearshore rockfish Other nearshore rockfish yes
BYL1 NOM. BLACK-AND-YELLOW RK Other nearshore rockfish Other nearshore rockfish yes
CBZ1 NOM. CABEZON Other groundfish Cabezon yes
CBZN CABEZON Other groundfish Cabezon yes
CEEL SPOTTED CUSK-EEL Other nongroundfish Other nongroundfish
62

PacFIN Species
ID PacFIN Common Name Species Group - North of 40˚ 10' N latitude
Species Group - South of 40˚ 10' N latitude FMP
CHL1 NOM. CALIFORNIA HALIBUT California halibut California halibut
CHLB CALIFORNIA HALIBUT California halibut California halibut
CHN1 NOM. CHINA ROCKFISH Other nearshore rockfish Other nearshore rockfish yes
CHNA CHINA ROCKFISH Other nearshore rockfish Other nearshore rockfish yes
CHNK CHINOOK SALMON Other nongroundfish Other nongroundfish
CHUM CHUM SALMON Other nongroundfish Other nongroundfish
CKLE BASKET COCKLE Other nongroundfish Other nongroundfish
CLC1 NOM. CALICO ROCKFISH Other nearshore rockfish Other nearshore rockfish yes
CLCO CALICO ROCKFISH Other nearshore rockfish Other nearshore rockfish yes
CLP1 NOM. CHILIPEPPER Chilipepper (Remaining rockfish) Chilipepper yes
CLPR CHILIPEPPER Chilipepper (Remaining rockfish) Chilipepper yes
CMCK CHUB MACKEREL Other nongroundfish Other nongroundfish
CMEL CHAMELEON ROCKFISH Other shelf rockfish Other shelf rockfish yes
CML1 NOM. CHAMELEON ROCKFISH Other shelf rockfish Other shelf rockfish yes
CMSL CALIFORNIA MUSSEL Other nongroundfish Other nongroundfish
CNR1 NOM. CANARY ROCKFISH Canary rockfish Canary rockfish yes
CNRY CANARY ROCKFISH Canary rockfish Canary rockfish yes
COHO COHO SALMON Other nongroundfish Other nongroundfish
COP1 NOM. COPPER ROCKFISH Other nearshore rockfish Other nearshore rockfish yes
COPP COPPER ROCKFISH Other nearshore rockfish Other nearshore rockfish yes
CPLN CAPELIN Other nongroundfish Other nongroundfish
CSKT CALIFORNIA SKATE Unspecified skate Unspecified skate yes
CSOL CURLFIN SOLE Other flatfish Other flatfish yes
CTRB C-O SOLE Other non-FMP flatfish Other non-FMP flatfish
CUDA PACIFIC BARRACUDA Other nongroundfish Other nongroundfish
CWC1 NOM. COWCOD ROCKFISH Other shelf rockfish Cowcod yes
CWCD COWCOD ROCKFISH Other shelf rockfish Cowcod yes
DBR1 NOM. DARKBLOTCHED ROCKFISH Darkblotched rockfish Darkblotched rockfish yes
DBRK DARKBLOTCHED ROCKFISH Darkblotched rockfish Darkblotched rockfish yes
DCRB DUNGENESS CRAB Dungeness crab Dungeness crab
DFLT UNSP. DEEP FLOUNDERS Other flatfish Other flatfish yes
DOVR DOVER SOLE Dover sole Dover sole yes
DRDO DORADO Other nongroundfish Other nongroundfish
DSOL DEEPSEA SOLE Other non-FMP flatfish Other non-FMP flatfish
DSRK SPINY DOGFISH Spiny dogfish Spiny dogfish yes
DTRB DIAMOND TURBOT Other non-FMP flatfish Other non-FMP flatfish
DUSK DUSKY ROCKFISH Other groundfish Other groundfish yes
DVR1 NOM. DOVER SOLE Dover sole Dover sole yes
DWRF DWARF-RED ROCKFISH Other shelf rockfish Other shelf rockfish yes
EELS UNSPECIFIED EELS Other nongroundfish Other nongroundfish
EGL1 NOM. ENGLISH SOLE English sole English sole yes
EGLS ENGLISH SOLE English sole English sole yes
ESTR EASTERN OYSTER Other nongroundfish Other nongroundfish
ETNA BIGEYE TUNA Other nongroundfish Other nongroundfish
EULC EULACHON Eulachon Eulachon
63

PacFIN Species
ID PacFIN Common Name Species Group - North of 40˚ 10' N latitude
Species Group - South of 40˚ 10' N latitude FMP
EURO EUROPEAN OYSTER Other nongroundfish Other nongroundfish
FLAG FLAG ROCKFISH Other shelf rockfish Other shelf rockfish yes
FLG1 NOM. FLAG ROCKFISH Other shelf rockfish Other shelf rockfish yes
FNTS FANTAIL SOLE Other non-FMP flatfish Other non-FMP flatfish
FRCK FRECKLED ROCKFISH Other shelf rockfish Other shelf rockfish yes
FSOL FLATHEAD SOLE Other flatfish Other flatfish yes
GABL GREEN ABALONE Other nongroundfish Other nongroundfish
GBAS GIANT SEA BASS Other nongroundfish Other nongroundfish
GBL1 NOM. GREENBLOTCHED RK Other shelf rockfish Other shelf rockfish yes
GBLC GREENBLOTCHED ROCKFISH Other shelf rockfish Other shelf rockfish yes
GCLM GAPER CLAM Other nongroundfish Other nongroundfish
GDUK GEODUCK Other nongroundfish Other nongroundfish
GKCR GOLDEN KING CRAB Other nongroundfish Other nongroundfish
GPH1 NOM. GOPHER ROCKFISH Other nearshore rockfish Gopher rockfish (Remaining rockfish) yes
GPHR GOPHER ROCKFISH Other nearshore rockfish Gopher rockfish (Remaining rockfish) yes
GPRW GOLDEN PRAWN Other nongroundfish Other nongroundfish
GRAS GRASS ROCKFISH Other nearshore rockfish Other nearshore rockfish yes
GRDR UNSP. GRENADIERS Unspecified grenadiers Unspecified grenadiers yes
GRS1 NOM. GRASS ROCKFISH Other nearshore rockfish Other nearshore rockfish yes
GSP1 NOM. GREENSPOTTED RK Other shelf rockfish Other shelf rockfish yes
GSPT GREENSPOTTED ROCKFISH Other shelf rockfish Other shelf rockfish yes
GSQD GIANT SQUID Other nongroundfish Other nongroundfish
GSR1 NOM. GREENSTRIPED ROCKFISH Other shelf rockfish Other shelf rockfish yes
GSRK GREENSTRIPED ROCKFISH Other shelf rockfish Other shelf rockfish yes
GSRM GHOST SHRIMP Other nongroundfish Other nongroundfish
GSTG GREEN STURGEON Green sturgeon Green sturgeon
GTRB GREENLAND TURBOT Other non-FMP flatfish Other non-FMP flatfish
HBRK HALFBANDED ROCKFISH Other shelf rockfish Other shelf rockfish yes
HCLM HORSE CLAMS Other nongroundfish Other nongroundfish
HLQN HARLEQUIN ROCKFISH Other shelf rockfish Other shelf rockfish yes
HNY1 NOM. HONEYCOMB ROCKFISH Other shelf rockfish Other shelf rockfish yes
HNYC HONEYCOMB ROCKFISH Other shelf rockfish Other shelf rockfish yes
HTRB HORNYHEAD TURBOT Other non-FMP flatfish Other non-FMP flatfish
ISRK BIGEYE THRESHER SHARK Other nongroundfish Other nongroundfish
JCLM CALIFORNIA JACKKNIFE CLAM Other nongroundfish Other nongroundfish
JMCK JACK MACKEREL Other nongroundfish Other nongroundfish
KFSH GIANT KELPFISH Other nongroundfish Other nongroundfish
KGL1 NOM. KELP GREENLING Kelp greenling Kelp greenling yes
KLP1 NOM. KELP ROCKFISH Other nearshore rockfish Other nearshore rockfish yes
KLPG KELP GREENLING Kelp greenling Kelp greenling yes
KLPR KELP ROCKFISH Other nearshore rockfish Other nearshore rockfish yes
KMKA KAMCHATKA FLOUNDER Other non-FMP flatfish Other non-FMP flatfish
KSTR KUMAMOTO OYSTER Other nongroundfish Other nongroundfish
LCD1 NOM. LINGCOD Lingcod Lingcod yes
LCLM NATIVE LITTLENECK Other nongroundfish Other nongroundfish
64

PacFIN Species
ID PacFIN Common Name Species Group - North of 40˚ 10' N latitude
Species Group - South of 40˚ 10' N latitude FMP
LCOD LINGCOD Lingcod Lingcod yes
LDAB LONGFIN SANDDAB Other non-FMP flatfish Other non-FMP flatfish
LDB1 NOM. LONGFIN SANDDAB Other non-FMP flatfish Other non-FMP flatfish
LOBS CALIF. SPINY LOBSTER Other nongroundfish Other nongroundfish
LSKT LONGNOSE SKATE Longnose skate Longnose skate yes
LSP1 NOM. LONGSPINE THORNYHEAD Longspine thornyhead Longspine thornyhead yes
LSPN LONGSPINE THORNYHEAD Longspine thornyhead Longspine thornyhead yes
LSRK LEOPARD SHARK Other groundfish Other groundfish yes
LSTR OLYMPIA OYSTER Other nongroundfish Other nongroundfish
LUVR LOUVAR Other nongroundfish Other nongroundfish
MACL MUD CLAMS Other nongroundfish Other nongroundfish
MAKO SHORTFIN MAKO SHARK Other nongroundfish Other nongroundfish
MCLM MANILA CLAM Other nongroundfish Other nongroundfish
MEEL MONKEYFACE EEL Other nongroundfish Other nongroundfish
MISC MISC. FISH/ANIMALS Other nongroundfish Other nongroundfish
MOLA COMMON MOLA Other nongroundfish Other nongroundfish
MRLN STRIPED MARLIN Other nongroundfish Other nongroundfish
MSC2 MISCELLANEOUS FISH Other nongroundfish Other nongroundfish
MSHP PLAINFIN MIDSHIPMAN Other nongroundfish Other nongroundfish
MSQD MARKET SQUID Other nongroundfish Other nongroundfish
MSRM MUD SHRIMP Other nongroundfish Other nongroundfish
MXR1 NOM. MEXICAN ROCKFISH Other shelf rockfish Other shelf rockfish yes
MXRF MEXICAN ROCKFISH Other shelf rockfish Other shelf rockfish yes
NANC NORTHERN ANCHOVY Other nongroundfish Other nongroundfish
NRCK NORTHERN ROCKFISH Other groundfish Other groundfish yes
NSHR NORTHERN NEAR-SHORE RK Other nearshore rockfish Other nearshore rockfish yes
NSLF NORTHERN SHELF ROCKFISH Other shelf rockfish Other shelf rockfish yes
NSLP NORTHERN SLOPE ROCKFISH Other slope rockfish Other slope rockfish yes
NUSF NOR. UNSP. SHELF ROCKFISH Other shelf rockfish Other shelf rockfish yes
NUSP NOR. UNSP. SLOPE ROCKFISH Other slope rockfish Other slope rockfish yes
NUSR NOR. UNSP. NEAR-SHORE RK Other nearshore rockfish Other nearshore rockfish yes
OABL OTHER ABALONE Other nongroundfish Other nongroundfish
OANC OTHER ANCHOVY Other nongroundfish Other nongroundfish
OBAS OTHER BASS Other nongroundfish Other nongroundfish
OCLM OTHER CLAM Other nongroundfish Other nongroundfish
OCRB OTHER CRAB Other nongroundfish Other nongroundfish
OCRK OTHER CROAKER Other nongroundfish Other nongroundfish
OCTP UNSP. OCTOPUS Other nongroundfish Other nongroundfish
ODSR OTHER DEMERSAL RKFSH Other groundfish Other groundfish yes
OECH OTHER ECHINODERM Other nongroundfish Other nongroundfish
OFLT OTHER FLATFISH Other flatfish Other flatfish yes
OGRN OTHER GROUNDFISH Other groundfish Other groundfish yes
OLV1 NOM. OLIVE ROCKFISH Other nearshore rockfish Other nearshore rockfish yes
OLVE OLIVE ROCKFISH Other nearshore rockfish Other nearshore rockfish yes
OMSK OTHER MOLLUSKS Other nongroundfish Other nongroundfish
OPLG OTHER PELAGIC RKFSH Other groundfish Other groundfish yes
65
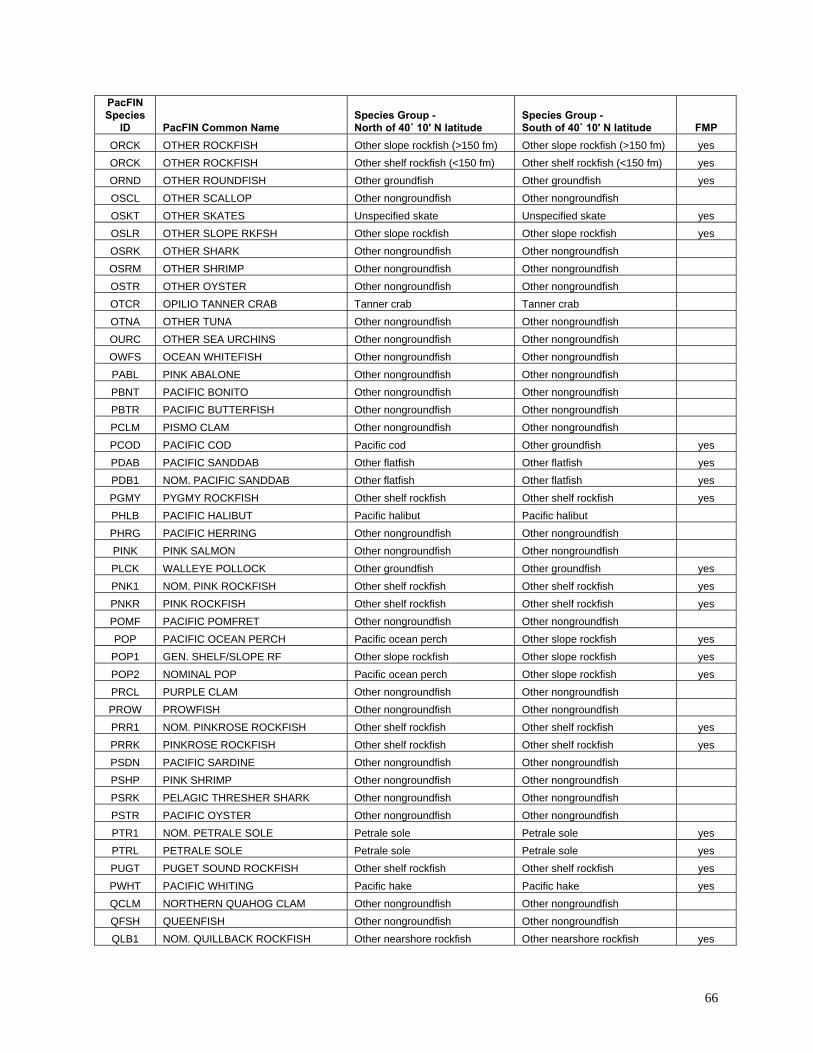
PacFIN Species
ID PacFIN Common Name Species Group - North of 40˚ 10' N latitude
Species Group - South of 40˚ 10' N latitude FMP
ORCK OTHER ROCKFISH Other slope rockfish (>150 fm) Other slope rockfish (>150 fm) yes
ORCK OTHER ROCKFISH Other shelf rockfish (<150 fm) Other shelf rockfish (<150 fm) yes
ORND OTHER ROUNDFISH Other groundfish Other groundfish yes
OSCL OTHER SCALLOP Other nongroundfish Other nongroundfish
OSKT OTHER SKATES Unspecified skate Unspecified skate yes
OSLR OTHER SLOPE RKFSH Other slope rockfish Other slope rockfish yes
OSRK OTHER SHARK Other nongroundfish Other nongroundfish
OSRM OTHER SHRIMP Other nongroundfish Other nongroundfish
OSTR OTHER OYSTER Other nongroundfish Other nongroundfish
OTCR OPILIO TANNER CRAB Tanner crab Tanner crab
OTNA OTHER TUNA Other nongroundfish Other nongroundfish
OURC OTHER SEA URCHINS Other nongroundfish Other nongroundfish
OWFS OCEAN WHITEFISH Other nongroundfish Other nongroundfish
PABL PINK ABALONE Other nongroundfish Other nongroundfish
PBNT PACIFIC BONITO Other nongroundfish Other nongroundfish
PBTR PACIFIC BUTTERFISH Other nongroundfish Other nongroundfish
PCLM PISMO CLAM Other nongroundfish Other nongroundfish
PCOD PACIFIC COD Pacific cod Other groundfish yes
PDAB PACIFIC SANDDAB Other flatfish Other flatfish yes
PDB1 NOM. PACIFIC SANDDAB Other flatfish Other flatfish yes
PGMY PYGMY ROCKFISH Other shelf rockfish Other shelf rockfish yes
PHLB PACIFIC HALIBUT Pacific halibut Pacific halibut
PHRG PACIFIC HERRING Other nongroundfish Other nongroundfish
PINK PINK SALMON Other nongroundfish Other nongroundfish
PLCK WALLEYE POLLOCK Other groundfish Other groundfish yes
PNK1 NOM. PINK ROCKFISH Other shelf rockfish Other shelf rockfish yes
PNKR PINK ROCKFISH Other shelf rockfish Other shelf rockfish yes
POMF PACIFIC POMFRET Other nongroundfish Other nongroundfish
POP PACIFIC OCEAN PERCH Pacific ocean perch Other slope rockfish yes
POP1 GEN. SHELF/SLOPE RF Other slope rockfish Other slope rockfish yes
POP2 NOMINAL POP Pacific ocean perch Other slope rockfish yes
PRCL PURPLE CLAM Other nongroundfish Other nongroundfish
PROW PROWFISH Other nongroundfish Other nongroundfish
PRR1 NOM. PINKROSE ROCKFISH Other shelf rockfish Other shelf rockfish yes
PRRK PINKROSE ROCKFISH Other shelf rockfish Other shelf rockfish yes
PSDN PACIFIC SARDINE Other nongroundfish Other nongroundfish
PSHP PINK SHRIMP Other nongroundfish Other nongroundfish
PSRK PELAGIC THRESHER SHARK Other nongroundfish Other nongroundfish
PSTR PACIFIC OYSTER Other nongroundfish Other nongroundfish
PTR1 NOM. PETRALE SOLE Petrale sole Petrale sole yes
PTRL PETRALE SOLE Petrale sole Petrale sole yes
PUGT PUGET SOUND ROCKFISH Other shelf rockfish Other shelf rockfish yes
PWHT PACIFIC WHITING Pacific hake Pacific hake yes
QCLM NORTHERN QUAHOG CLAM Other nongroundfish Other nongroundfish
QFSH QUEENFISH Other nongroundfish Other nongroundfish
QLB1 NOM. QUILLBACK ROCKFISH Other nearshore rockfish Other nearshore rockfish yes
66

PacFIN Species
ID PacFIN Common Name Species Group - North of 40˚ 10' N latitude
Species Group - South of 40˚ 10' N latitude FMP
QLBK QUILLBACK ROCKFISH Other nearshore rockfish Other nearshore rockfish yes
RABL RED ABALONE Other nongroundfish Other nongroundfish
RATF SPOTTED RATFISH Other groundfish Other groundfish yes
RCK1 BOCACCIO+CHILIPEPPER RK Other shelf rockfish Other shelf rockfish yes
RCK2 UNSP. BOLINA RCKFSH Other nearshore rockfish Other nearshore rockfish yes
RCK3 UNSP. DPWTR REDS RCKFSH Other slope rockfish Other slope rockfish yes
RCK4 UNSP. REDS RCKFSH Other groundfish Other groundfish yes
RCK5 UNSP. SMALL REDS RCKFSH Other groundfish Other groundfish yes
RCK6 UNSP. ROSEFISH RCKFSH Other groundfish Other groundfish yes
RCK7 UNSP. GOPHER RCKFSH Other nearshore rockfish Gopher rockfish (Remaining rockfish) yes
RCK8 CANARY+VERMILION RCKFSH Canary rockfish Canary rockfish yes
RCK9 BLACK+BLUE ROCKFISH Black rockfish Black rockfish yes
RCKG ROCK GREENLING Other nongroundfish Other nongroundfish
RCLM RAZOR CLAM Other nongroundfish Other nongroundfish
RCRB ROCK CRAB Other nongroundfish Other nongroundfish
RDB1 NOM. REDBANDED ROCKFISH Other slope rockfish Other slope rockfish yes
RDBD REDBANDED ROCKFISH Other slope rockfish Other slope rockfish yes
REDS REDSTRIPE ROCKFISH Redstripe rockfish (Remaining rockfish) Other shelf rockfish yes
REX REX SOLE Other flatfish Other flatfish yes
REX1 NOM. REX SOLE Other flatfish Other flatfish yes
REYE ROUGHEYE ROCKFISH Other slope rockfish Other slope rockfish yes
RFLT REMAINING FLATFISH Other flatfish Other flatfish yes
RGL1 NOM. ROCK GREENLING Other nongroundfish Other nongroundfish
RGRN REMAINING GROUNDFISH Other groundfish Other groundfish yes
RHRG ROUND HERRING Other nongroundfish Other nongroundfish
RKCR RED KING CRAB Other nongroundfish Other nongroundfish
ROS1 NOM. ROSY ROCKFISH Other shelf rockfish Other shelf rockfish yes
ROSY ROSY ROCKFISH Other shelf rockfish Other shelf rockfish yes
RPRW RIDGEBACK PRAWN Other nongroundfish Other nongroundfish
RRCK REMAINING ROCKFISH Other groundfish Other groundfish yes
RRND REMAINING ROUNDFISH Other groundfish Other groundfish yes
RSL1 NOM. ROCK SOLE Other flatfish Other flatfish yes
RSOL ROCK SOLE Other flatfish Other flatfish yes
RST1 NOM. ROSETHORN ROCKFISH Other shelf rockfish Other shelf rockfish yes
RSTN ROSETHORN ROCKFISH Other shelf rockfish Other shelf rockfish yes
RURC RED SEA URCHIN Other nongroundfish Other nongroundfish
RZCL ROSY RAZOR CLAM Other nongroundfish Other nongroundfish
SABL SABLEFISH Sablefish Sablefish yes
SAIL SAILFISH Other nongroundfish Other nongroundfish
SARY PACIFIC SAURY Other nongroundfish Other nongroundfish
SBL1 NOM. SHORTBELLY ROCKFISH Shortbelly rockfish Shortbelly rockfish yes
SBLY SHORTBELLY ROCKFISH Shortbelly rockfish Shortbelly rockfish yes
SCLM SOFT-SHELLED CLAM Other nongroundfish Other nongroundfish
SCLP UNSP. SCULPIN Other nongroundfish Other nongroundfish
SCOR CALIFORNIA SCORPIONFISH Other groundfish Other nearshore rockfish yes
67

PacFIN Species
ID PacFIN Common Name Species Group - North of 40˚ 10' N latitude
Species Group - South of 40˚ 10' N latitude FMP
SCR1 NOM. CALIF. SCORPIONFISH Other groundfish Other nearshore rockfish yes
SDB1 NOM. SPECKLED SANDDAB Other non-FMP flatfish Other non-FMP flatfish
SFL1 NOM. STARRY FLOUNDER Starry flounder Starry flounder yes
SFLT UNSP. SHALLOW FLOUNDERS Other flatfish Other flatfish yes
SHAD UNSPECIFIED SHAD Other nongroundfish Other nongroundfish
SHP1 NOM. CALIFORNIA SHEEPHEAD Other nongroundfish Other nongroundfish
SHPD CALIFORNIA SHEEPHEAD Other nongroundfish Other nongroundfish
SHRP SHARPCHIN ROCKFISH Sharpchin rockfish (Remaining rockfish) Sharpchin - south yes
SKCR SCARLET KING CRAB Other nongroundfish Other nongroundfish
SLGR SILVERGREY ROCKFISH Silvergrey rockfish (Remaining rockfish) Other shelf rockfish yes
SLNS SLENDER SOLE Other non-FMP flatfish Other non-FMP flatfish
SMLT UNSP. SMELT Other nongroundfish Other nongroundfish
SNOS SPLITNOSE ROCKFISH Splitnose rockfish (Remaining rockfish) Splitnose rockfish yes
SNS1 NOM. SPLITNOSE ROCKFISH Splitnose rockfish (Remaining rockfish) Splitnose rockfish yes
SOCK SOCKEYE SALMON Other nongroundfish Other nongroundfish
SPK1 NOM. SPECKLED ROCKFISH Other shelf rockfish Other shelf rockfish yes
SPKL SPECKLED ROCKFISH Other shelf rockfish Other shelf rockfish yes
SPRW SPOTTED PRAWN Other nongroundfish Other nongroundfish
SQID UNSP. SQUID Other nongroundfish Other nongroundfish
SQR1 NOM. SQUARESPOT Other shelf rockfish Other shelf rockfish yes
SQRS SQUARESPOT ROCKFISH Other shelf rockfish Other shelf rockfish yes
SRFP SURFPERCH SPP. Other nongroundfish Other nongroundfish
SRKR SHORTRAKER ROCKFISH Other slope rockfish Other slope rockfish yes
SSCL SHARPNOSE SCULPIN Other nongroundfish Other nongroundfish
SSDB SPECKLED SANDDAB Other non-FMP flatfish Other non-FMP flatfish
SSHR SOUTHERN NEAR-SHORE RK Other nearshore rockfish Other nearshore rockfish yes
SSLF SOUTHERN SHELF ROCKFISH Other shelf rockfish Other shelf rockfish yes
SSLP SOUTHERN SLOPE ROCKFISH Other slope rockfish Other slope rockfish yes
SSO1 NOM. SAND SOLE Other flatfish Other flatfish yes
SSOL SAND SOLE Other flatfish Other flatfish yes
SSP1 NOM. SHORTSPINE THORNYHEAD Shortspine thornyhead Shortspine thornyhead yes
SSPN SHORTSPINE THORNYHEAD Shortspine thornyhead Shortspine thornyhead yes
SSRD Deep So. Nearshore RF Other nearshore rockfish Other nearshore rockfish yes
SSRK SOUPFIN SHARK Other groundfish Other groundfish yes
SSRS Shallow So. Nearshore RF Other nearshore rockfish Other nearshore rockfish yes
STAR STARRY ROCKFISH Other shelf rockfish Other shelf rockfish yes
STL1 NOM. STRIPETAIL ROCKFISH Other shelf rockfish Other shelf rockfish yes
STLH STEELHEAD Other nongroundfish Other nongroundfish
STNA SKIPJACK TUNA Other nongroundfish Other nongroundfish
STR1 NOM. STARRY ROCKFISH Other shelf rockfish Other shelf rockfish yes
STRK STRIPETAIL ROCKFISH Other shelf rockfish Other shelf rockfish yes
STRY STARRY FLOUNDER Starry flounder Starry flounder yes
SUSF SOU. UNSP. SHELF ROCKFISH Other shelf rockfish Other shelf rockfish yes
SUSP SOU. UNSP. SLOPE ROCKFISH Other slope rockfish Other slope rockfish yes
68

PacFIN Species
ID PacFIN Common Name Species Group - North of 40˚ 10' N latitude
Species Group - South of 40˚ 10' N latitude FMP
SUSR SOU. UNSP. NEAR-SHORE RK Other nearshore rockfish Other nearshore rockfish yes
SWRD SWORDFISH Other nongroundfish Other nongroundfish
SWS1 NOM. SWORDSPINE ROCKFISH Other shelf rockfish Other shelf rockfish yes
SWSP SWORDSPINE ROCKFISH Other shelf rockfish Other shelf rockfish yes
TCOD PACIFIC TOMCOD Other nongroundfish Other nongroundfish
TGR1 NOM. TIGER ROCKFISH Other shelf rockfish Other shelf rockfish yes
THD1 NOM. THORNYHEADS Mixed thornyheads Mixed thornyheads yes
THDS THORNYHEADS (MIXED) Mixed thornyheads Mixed thornyheads yes
TIGR TIGER ROCKFISH Other shelf rockfish Other shelf rockfish yes
TRE1 NOM. TREEFISH Other nearshore rockfish Other nearshore rockfish yes
TREE TREEFISH Other nearshore rockfish Other nearshore rockfish yes
TSRK COMMON THRESHER SHARK Other nongroundfish Other nongroundfish
UABL UNSPECIFIED ABALONE Other nongroundfish Other nongroundfish
UCLM UNSPECIFIED CLAM Other nongroundfish Other nongroundfish
UCRB UNSPECIFIED CRAB Other nongroundfish Other nongroundfish
UDAB UNSP. SANDDABS Other flatfish Other flatfish yes
UDF1 UNSP. DEEP-91 FLOUNDERS Other flatfish Other flatfish yes
UDF2 UNSP. DEEP-95 FLOUNDERS Other flatfish Other flatfish yes
UDM1 UNSP. DEMERSAL-91 Other groundfish Other groundfish yes
UDNR UNSP. DEEP NEAR-SHORE RF Other nearshore rockfish Other nearshore rockfish yes
UDSR UNSP. DEMERSAL RKFSH Other groundfish Other groundfish yes
UDW1 SHORTRAKER+ROUGHEYE Other slope rockfish Other slope rockfish yes
UECH UNSPECIFIED ECHINODERM Other nongroundfish Other nongroundfish
UFL1 FLOUNDERS (NO FSOL) Other flatfish Other flatfish yes
UFLT UNSP. FLATFISH Other flatfish Other flatfish yes
UGRN UNSP. GROUNDFISH Other groundfish Other groundfish yes
UHAG UNSPECIFIED HAGFISH Other nongroundfish Other nongroundfish
UHLB UNSPECIFIED HALIBUT Other nongroundfish Other nongroundfish
UJEL UNSP. JELLYFISH Other nongroundfish Other nongroundfish
UKCR UNSP. KING CRAB Other nongroundfish Other nongroundfish
UMCK UNSP. MACKEREL Other nongroundfish Other nongroundfish
UMSK UNSPECIFIED MOLLUSKS Other nongroundfish Other nongroundfish
UPLG UNSP. PELAGIC RKFSH Other groundfish Other groundfish yes
UPOP UNSP. POP GROUP Pacific ocean perch Other slope rockfish yes
URCK UNSP. ROCKFISH Other slope rockfish (>150 fm) Other slope rockfish (>150 fm) yes
URCK UNSP. ROCKFISH Other shelf rockfish (<150 fm) Other shelf rockfish (<150 fm) yes
URK1 SRKR+REYE+NRCK+SHRP Other slope rockfish Other slope rockfish yes
URND UNSP. ROUNDFISH Other groundfish Other groundfish yes
USCL UNSPECIFIED SCALLOP Other nongroundfish Other nongroundfish
USCU UNSP. SEA CUCUMBERS Other nongroundfish Other nongroundfish
USF1 UNSP. SHALLOW-91 FLOUNDERS Other flatfish Other flatfish yes
USHR UNSP. NEAR-SHORE ROCKFISH Other nearshore rockfish Other nearshore rockfish yes
USKT UNSP. SKATE Unspecified skate Unspecified skate yes
USLF UNSP. SHELF ROCKFISH Other shelf rockfish Other shelf rockfish yes
USLP UNSP. SLOPE ROCKFISH Other slope rockfish Other slope rockfish yes
USLR UNSP. SLOPE RKFSH Other slope rockfish Other slope rockfish yes
69

70
PacFIN Species
ID PacFIN Common Name Species Group - North of 40˚ 10' N latitude
Species Group - South of 40˚ 10' N latitude FMP
USMN UNSP. SALMON Other nongroundfish Other nongroundfish
USR1 UNSP. SLOPE-91 Other groundfish Other groundfish yes
USR2 UNSP. SLOPE-93 Other groundfish Other groundfish yes
USRK UNSP. SHARK Other nongroundfish Other nongroundfish
USRM UNSP. OCEAN SHRIMP Other nongroundfish Other nongroundfish
USTG UNSP. STURGEON Other nongroundfish Other nongroundfish
USTR UNSPECIFIED OYSTER Other nongroundfish Other nongroundfish
UTCR UNSP. TANNER CRAB Tanner crab Tanner crab
UTNA UNSPECIFIED TUNA Other nongroundfish Other nongroundfish
UTRB UNSP. TURBOTS Other flatfish Other flatfish yes
UURC UNSP. SEA URCHINS Other nongroundfish Other nongroundfish
VRM1 NOM. VERMILLION ROCKFISH Other shelf rockfish Other shelf rockfish yes
VRML VERMILION ROCKFISH Other shelf rockfish Other shelf rockfish yes
WABL WHITE ABALONE Other nongroundfish Other nongroundfish
WBAS WHITE SEABASS Other nongroundfish Other nongroundfish
WCLM WASHINGTON CLAM Other nongroundfish Other nongroundfish
WCRK WHITE CROAKER Other nongroundfish Other nongroundfish
WDOW WIDOW ROCKFISH Widow rockfish Widow rockfish yes
WDW1 NOM. WIDOW ROCKFISH Widow rockfish Widow rockfish yes
WEEL WOLF EEL Other nongroundfish Other nongroundfish
WHOO WAHOO Other nongroundfish Other nongroundfish
WSTG WHITE STURGEON Other nongroundfish Other nongroundfish
YEY1 NOM. YELLOWEYE ROCKFISH Yelloweye rockfish Yelloweye rockfish yes
YEYE YELLOWEYE ROCKFISH Yelloweye rockfish Yelloweye rockfish yes
YLTL YELLOWTAIL Other nongroundfish Other nongroundfish
YMTH YELLOWMOUTH ROCKFISH Yellowmouth rockfish (Remaining rockfish) Other slope rockfish yes
YSOL YELLOWFIN SOLE Other non-FMP flatfish Other non-FMP flatfish
YTNA YELLOWFIN TUNA Other nongroundfish Other nongroundfish
YTR1 NOM. YELLOWTAIL ROCKFISH Yellowtail rockfish Yellowtail rockfish (Remaining rockfish) yes
YTRK YELLOWTAIL ROCKFISH Yellowtail rockfish Yellowtail rockfish (Remaining rockfish) yes