day-to-day variability of equatorial electrojet and its …2015...day-to-day variability of...
TRANSCRIPT

Day-to-day variability of equatorial electrojet and its role onthe day-to-day characteristics of the equatorial ionizationanomaly over the Indian and Brazilian sectorsK. Venkatesh1, P. R. Fagundes1, D. S. V. V .D. Prasad2, C. M. Denardini3, A. J. de Abreu4, R. de Jesus1,3,and M. Gende5
1IP&D, Universidade do Vale do Paraiba, Sao Jose dos Campos, Brazil, 2Department of Physics, Andhra University, Visakhapatnam,India, 3Instituto Nacional de Pesquisas Espaciais, S. J. Campos, Brazil, 4Instituto Tecnológico de Aeronáutica (ITA), Divisão deCiências Fundamentais, São José dos Campos - SP, Brazil, 5Facultad de Ciências Astronómicas y Geofísicas, Universidad Nacionalde La Plata, La Plata, Argentina
Abstract The equatorial electrojet (EEJ) is a narrow band of current flowing eastward at the ionosphericE region altitudes along the dayside dip equator. Mutually perpendicular electric and magnetic fields overthe equator results in the formation of equatorial ionization anomaly (EIA), which in turn generates largeelectron density variabilities. Simultaneous study on the characteristics of EEJ and EIA is necessary tounderstand the role of EEJ on the EIA variabilities. This is helpful for the improved estimation of total electroncontent (TEC) and range delays required for satellite-based communication and navigation applications. Presentstudy reports simultaneous variations of EEJ and GPS-TEC over Indian and Brazilian sectors to understand the roleof EEJ on the day-to-day characteristics of the EIA. Magnetometer measurements during the low solar activityyear 2004 are used to derive the EEJ values over the two different sectors. The characteristics of EIA are studiedusing two different chains of GPS receivers along the common meridian of 77°E (India) and 45°W (Brazil). Thediurnal, seasonal, and day-to-day variations of EEJ and TEC are described simultaneously. Variations of EIAduring different seasons are presented along with the variations of the EEJ in the two hemispheres. Therole of EEJ variations on the characteristic features of the EIA such as the strength and temporal extent ofthe EIA crest has also been reported. Further, the time delay between the occurrences of the day maximumEEJ and the well-developed EIA is studied and corresponding results are presented in this paper.
1. Introduction
The worldwide solar-driven wind flowing across the field lines results in the E region Sq-current system thatproduces an intensified eastward electric field in the dayside ionosphere. At the geomagnetic equator, the Sqcurrent systems of the southern and northern hemispheres merge with each other and intensify to form ajet-like current in the E region of the ionosphere, which is called as “equatorial electrojet.” Chapman [1951]introduced the name equatorial electrojet designating a belt approximately 600 km wide centered on thedip equator due to an electric current in the E region of the ionosphere around 100 km altitudes. Theequatorial electrojet (EEJ) phenomena primarily caused by the strongly enhanced (Cowling) conductivity incombination with the large-scale polarization electric field and the ionospheric E-layer tidal winds. Duringsome times, in the EEJ region, the horizontal component of the Earth’s magnetic field (H) decreases rapidlyfor a period of few hours, suggesting a reversal of the current direction. Based on themagnetic field observationsin the African sector, Gouin and Mayaud [1967] suggested a plausible explanation for this event and named it asthe “counter electrojet (CEJ).” The counter electrojet is predominant during early morning and early afternoonhours [Mayaud, 1977].
Over the geomagnetic equator, the electric and magnetic fields are mutually perpendicular to each otherleading to the fountain effect, under which, the plasma is lifted to the higher altitudes. The plasma at higheraltitudes diffuses along the magnetic field lines under the gravitational and pressure gradient forces resultingin the formation of a double-humped latitudinal distribution of ionization known as the equatorial ionizationanomaly (EIA). The two humps of ionization on either sides of the equator around ±20° are called as the crestsof the EIA, and the depleted ionization region over the equator is called as the trough of the EIA. In thepresence of the well-developed EIA, the electron density over the equatorial and low latitudes exhibits signif-icant variability with local time, latitude, and altitude. As it is described, the driving force behind the fountain
VENKATESH ET AL. DAY-TO-DAY VARIABILITY OF EEJ AND EIA 1
PUBLICATIONSJournal of Geophysical Research: Space Physics
RESEARCH ARTICLE10.1002/2015JA021307
Key Points:• Variability of EEJ and EIA are studiedover Indian and Brazilian sectors
• EIA strength show strong dependencewith the IEEJ integrated up to daymaximum
• A time delay is observed betweenthe day maximum EEJ andwell-developed EIA
Correspondence to:K. Venkatesh,[email protected]
Citation:Venkatesh, K., P. R. Fagundes, D. S. V. V. D.Prasad, C. M. Denardini, A. J. de Abreu,R. de Jesus, and M. Gende (2015), Day-to-day variability of equatorial electrojetand its role on the day-to-day charac-teristics of the equatorial ionizationanomaly over the Indian and Braziliansectors, J. Geophys. Res. Space Physics,120, doi:10.1002/2015JA021307.
Received 6 APR 2015Accepted 25 SEP 2015Accepted article online 30 SEP 2015
©2015. American Geophysical Union.All Rights Reserved.

effect is the E× B drifts over the equatorbeing controlled by the strength ofthe EEJ. Thus, the EEJ and EIA are themost typical equatorial and low-latitudeionospheric phenomena, and the char-acteristics of EEJ play a vital role on theelectron density distribution over equa-torial and low latitudes.
Since the discovery of the EEJ atHuancayo (Peru) near the dip-equator,several studies have been carried outto explain the generating mechanismof the equatorial electrojet (EEJ) [Bakerand Martyn, 1953; Chapman andBartels, 1940]. Reviews on EEJ and CEJhave been made by different researchers[Richmond, 1973; Kane, 1976; Mayaud,
1977; Forbes, 1981; Reddy, 1981, 1989; Stening, 1985; Rastogi, 1989; Mazaudier et al., 1993; Doumouya et al.,1998; Mazaudier et al., 2005]. During the past few decades, theoretical and scientific models of the iono-spheric dynamo have been developed to explain the mechanism of the EEJ flow and its morphology[Sugiura and Cain, 1966; Sugiura and Poros, 1969; Richmond, 1973; Kane and Trivedi, 1982; Stening, 1985;Reddy, 1989; Chandra et al., 2000; Rabiu et al., 2007; Denardini et al., 2009; Abbas et al., 2012; Rastogiet al., 2013; Guizelli et al., 2013]. Electrojet characteristics have also been simulated by assuming simple cur-rent configurations such as line current [Forbush and Casaverde, 1961], thin-band current [Chapman, 1951]and fourth degree current distribution [Fambitakoye, 1976], and thick current distribution [Onwumechili,1967]. All these investigations revealed that the EEJ exhibits significant diurnal, seasonal, day-to-day, andlongitudinal variabilities. Therefore, a simultaneous study of the day-to-day characteristics of EEJ and EIA is use-ful in understanding the quantitative role of EEJ on the equatorial and low-latitude ionospheric electron densityvariabilities. This will be helpful in achieving improved accuracy in the estimation of equatorial and low-latitude ionospheric total electron content (TEC) and corresponding range delays required for the satellitebased communication and navigation applications.
The geomagnetic equator passes through the Indian and Brazilian sectors, while India is on the northernhemisphere and Brazil is on the southern hemisphere. Simultaneous observations using magnetometersand GPS-TEC receivers at multiple locations over the Indian sector in northern hemisphere and Braziliansector in southern hemisphere are used to understand the day-to-day variability of EEJ and its role on thecharacteristics of the EIA and electron density distribution, the results of which are discussed inthis paper.
2. Data and Analysis
The horizontal components of the Earth’s magnetic field measured over an equatorial station Tirunelveliand an off-equatorial station Alibag in the Indian sector and from an equatorial station Sao Luiz and anoff equatorial station Vassouras in the Brazilian sector during the low solar activity year 2004 (meanRz= 41) are used. The magnetometer measurements from the Indian sector are obtained from the IndianInstitute of Geomagnetism online data portal (http://wdciig.res.in/WebUI/Home.aspx). In the Braziliansector, the magnetometers are from the Embrace Network [Denardini et al., 2013]. The locations of thesemagnetometers are shown as red colored filled squares in Figure 1, and corresponding coordinates aregiven in Table 1. The H-component values of the Earth magnetic field at the above four locations are nor-malized to the difference between the H-component values and the mean midnight values for the fivequietest days. Quiet days are considered as provided by the World Data Center for Geomagnetism,Kyoto (http://wdc.kugi.kyoto-u.ac.jp/qddays/index.html). Finally, variations of the EEJ ground strengthare estimated by calculating the difference between the ΔH values at equatorial and off equatorial stationsover Indian and Brazilian sectors.
Figure 1. Map showing the locations of the GPS receivers (magenta cir-cles) and magnetometers (red squares) over Indian and Brazilian sectors.The geomagnetic equator is shown as green colored curve.
Journal of Geophysical Research: Space Physics 10.1002/2015JA021307
VENKATESH ET AL. DAY-TO-DAY VARIABILITY OF EEJ AND EIA 2
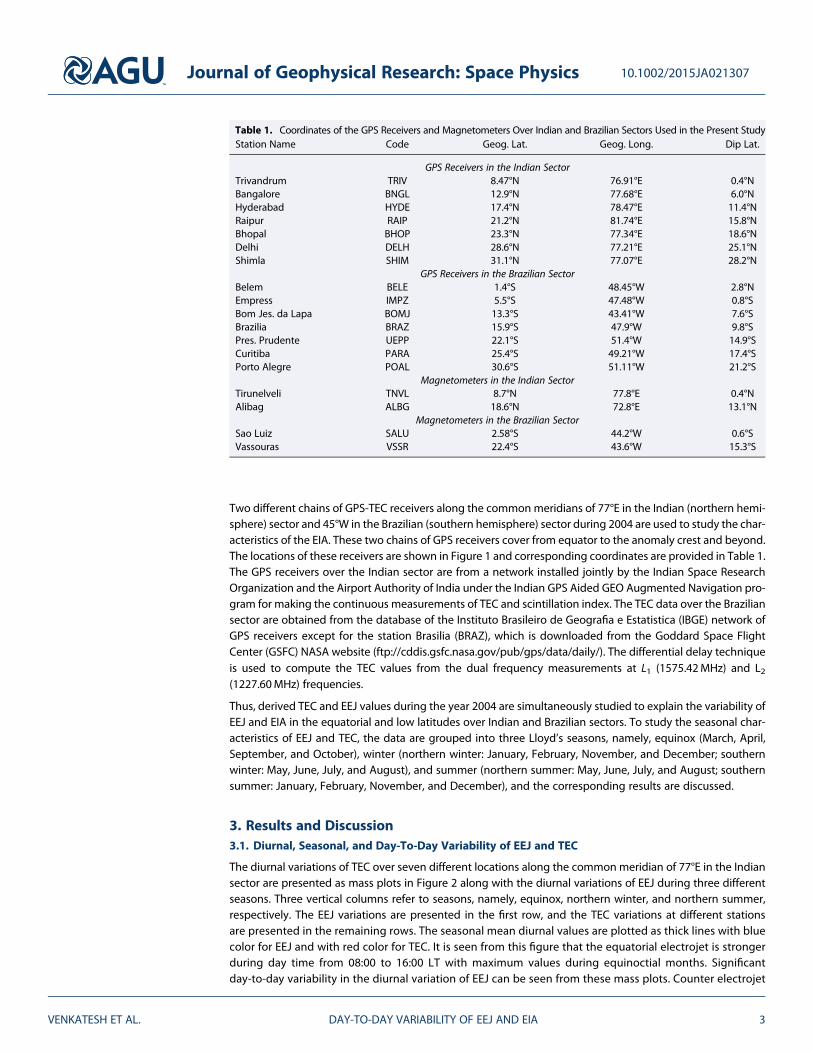
Two different chains of GPS-TEC receivers along the common meridians of 77°E in the Indian (northern hemi-sphere) sector and 45°W in the Brazilian (southern hemisphere) sector during 2004 are used to study the char-acteristics of the EIA. These two chains of GPS receivers cover from equator to the anomaly crest and beyond.The locations of these receivers are shown in Figure 1 and corresponding coordinates are provided in Table 1.The GPS receivers over the Indian sector are from a network installed jointly by the Indian Space ResearchOrganization and the Airport Authority of India under the Indian GPS Aided GEO Augmented Navigation pro-gram for making the continuous measurements of TEC and scintillation index. The TEC data over the Braziliansector are obtained from the database of the Instituto Brasileiro de Geografia e Estatistica (IBGE) network ofGPS receivers except for the station Brasilia (BRAZ), which is downloaded from the Goddard Space FlightCenter (GSFC) NASA website (ftp://cddis.gsfc.nasa.gov/pub/gps/data/daily/). The differential delay techniqueis used to compute the TEC values from the dual frequency measurements at L1 (1575.42MHz) and L2(1227.60MHz) frequencies.
Thus, derived TEC and EEJ values during the year 2004 are simultaneously studied to explain the variability ofEEJ and EIA in the equatorial and low latitudes over Indian and Brazilian sectors. To study the seasonal char-acteristics of EEJ and TEC, the data are grouped into three Lloyd’s seasons, namely, equinox (March, April,September, and October), winter (northern winter: January, February, November, and December; southernwinter: May, June, July, and August), and summer (northern summer: May, June, July, and August; southernsummer: January, February, November, and December), and the corresponding results are discussed.
3. Results and Discussion3.1. Diurnal, Seasonal, and Day-To-Day Variability of EEJ and TEC
The diurnal variations of TEC over seven different locations along the common meridian of 77°E in the Indiansector are presented as mass plots in Figure 2 along with the diurnal variations of EEJ during three differentseasons. Three vertical columns refer to seasons, namely, equinox, northern winter, and northern summer,respectively. The EEJ variations are presented in the first row, and the TEC variations at different stationsare presented in the remaining rows. The seasonal mean diurnal values are plotted as thick lines with bluecolor for EEJ and with red color for TEC. It is seen from this figure that the equatorial electrojet is strongerduring day time from 08:00 to 16:00 LT with maximum values during equinoctial months. Significantday-to-day variability in the diurnal variation of EEJ can be seen from these mass plots. Counter electrojet
Table 1. Coordinates of the GPS Receivers and Magnetometers Over Indian and Brazilian Sectors Used in the Present StudyStation Name Code Geog. Lat. Geog. Long. Dip Lat.
GPS Receivers in the Indian SectorTrivandrum TRIV 8.47°N 76.91°E 0.4°NBangalore BNGL 12.9°N 77.68°E 6.0°NHyderabad HYDE 17.4°N 78.47°E 11.4°NRaipur RAIP 21.2°N 81.74°E 15.8°NBhopal BHOP 23.3°N 77.34°E 18.6°NDelhi DELH 28.6°N 77.21°E 25.1°NShimla SHIM 31.1°N 77.07°E 28.2°N
GPS Receivers in the Brazilian SectorBelem BELE 1.4°S 48.45°W 2.8°NEmpress IMPZ 5.5°S 47.48°W 0.8°SBom Jes. da Lapa BOMJ 13.3°S 43.41°W 7.6°SBrazilia BRAZ 15.9°S 47.9°W 9.8°SPres. Prudente UEPP 22.1°S 51.4°W 14.9°SCuritiba PARA 25.4°S 49.21°W 17.4°SPorto Alegre POAL 30.6°S 51.11°W 21.2°S
Magnetometers in the Indian SectorTirunelveli TNVL 8.7°N 77.8°E 0.4°NAlibag ALBG 18.6°N 72.8°E 13.1°N
Magnetometers in the Brazilian SectorSao Luiz SALU 2.58°S 44.2°W 0.6°SVassouras VSSR 22.4°S 43.6°W 15.3°S
Journal of Geophysical Research: Space Physics 10.1002/2015JA021307
VENKATESH ET AL. DAY-TO-DAY VARIABILITY OF EEJ AND EIA 3

(CEJ) events are found to be more frequent during winter and summer months. From the seasonal meandiurnal variations, the maximum EEJ is found to be around 60 nT during equinox and around 40 nT duringwinter and summer months.
The diurnal variations of TEC presented for seven different stations from equator to the anomaly crest andbeyond also show higher values during equinoctial months compared to winter and summer months. Theday maximum values of TEC increase from equator (TRIV) to the anomaly crest (RAIP and BHOP) and decreasebeyond during the three seasons. Significant day-to-day variability in TEC is observed at all the locations, andgreater variability is found around the anomaly crest locations. It can be inferred from these plots that theseasonal and day-to-day characteristics in the variations of EEJ and TEC are similar.
Figure 3 shows the diurnal variations of EEJ and TEC as mass plots along with the seasonal mean valuesduring equinox, southern winter, and southern summer over the Brazilian sector. Three panels in the firstrow represent the diurnal variations of EEJ, while the other panels in remaining rows represent the diurnalvariation of TEC at different locations during three seasons. It is observed from these figures that the TECat different locations show higher values during equinoctial months and lower values during winter months.The day maximum values of TEC are found to be higher at and around the anomaly crest locations. Theday-to-day variability in the diurnal variation of TEC is observed at all the locations during the three seasons,and this variability is higher around the anomaly crest locations during equinoctial months. The seasonal
Figure 2. Mass plots showing the diurnal variations of EEJ (first row) and TEC over seven different locations from equator tothe anomaly crest and beyond in the Indian sector during three different seasons, namely, equinox, northern winter, andnorthern summer of the year 2004.
Journal of Geophysical Research: Space Physics 10.1002/2015JA021307
VENKATESH ET AL. DAY-TO-DAY VARIABILITY OF EEJ AND EIA 4

and day-to-day variabilities in TEC variations over the equatorial and low-latitude sectors have beenreported in the earlier studies using measurements from different parts of the globe [Abdu et al., 1996;Mannucci et al., 1998; Brunini et al., 2003; Jee et al., 2005, Bagiya et al., 2009; Venkatesh et al., 2014;Shimeis et al., 2014, 2015, and references therein].
It is seen from Figure 3 that the EEJ over Brazil shows higher values during equinoctial months and lowervalues during southern summer months. During equinoctial and summer seasons, after attaining the daymaximum, the EEJ slowly decays and reaches the minimum level around the late-night hours. Whereas inthe Indian sector (Figure 2), the EEJ reaches to the minimum level by the evening hours. A detailed insightin to diurnal variations of EEJ revealed that in the Indian sector, the EEJ reaches the day minimum levelbetween 1600 and 1800 h LT during more than 60% of the days. Whereas in the Brazilian sector, the EEJreaches the day minimum after 2000 h LT during more than 70% of the days. From the diurnal variationsof EEJ reported by Doumouya et al. [1998] over African sector, it is seen that the EEJ reaches the day minimumin later hours during equinoctial months compared to that during other seasons. Mazaudier et al. [2006]studied the longitudinal differences in the Earth magnetic field variations between Indian and Vietnamesesectors and reported that the magnetic field is stronger in the Vietnamese longitudes than in the Indianlongitudes. Chandrasekhar et al. [2014] have also reported significant longitudinal variations in the EEJcharacteristics using the magnetometer measurements in the Indian sector. It has also been shown that
Figure 3. Mass plots showing the diurnal variations of EEJ (first row) and TEC over seven different locations from equator tothe anomaly crest and beyond in the Brazilian sector during three different seasons, namely, equinox, southern winter, andsouthern summer of the year 2004.
Journal of Geophysical Research: Space Physics 10.1002/2015JA021307
VENKATESH ET AL. DAY-TO-DAY VARIABILITY OF EEJ AND EIA 5

the EEJ is strongest in South Americaand weakest in Indian sector with a sec-ondary minimum in the Atlantic sectorand secondary maximum in the wes-tern African sector [Doumouya et al.,2003; Doumouya and Cohen, 2004].
The diurnal variations of EEJ over Brazilalso show that the CEJ events are morefrequent during winter and summermonths compared to those duringequinoctial months. Mayaud [1977],Doumouya et al. [1998], and Denardiniet al. [2009] have also reported thatthe CEJ events are more frequent andclear during solstice months overAfrican and Brazilian sectors. Further,it is also observed that the CEJ eventsare more frequent during presunrisehours compared to those during theevening hours. Simultaneous compari-son of the diurnal variations of EEJ overIndian and Brazilian sectors revealedthat these morning CEJ events aremore frequent in the Brazilian sectorcompared to the Indian sector.
To study the local time variations in theoccurrence of CEJ, the percentage ofCEJ events at different local times is pre-sented as histograms in Figure 4 forIndian and Brazilian sectors. It can beseen from this figure that 65% of thetotal CEJ events in the Indian sector areduring afternoon, while 50% of theevents are observed between 1400and 1600 h LT. In the Brazilian sector,nearly 75% of the total CEJ events areobserved in the morning before 1000 hLT. From the seasonal behavior of CEJevents described in Figure 2, it may benoted here that among the 50% CEJ
events in the afternoon hours over Indian sector, most of the cases occur during winter and summer months.Further, in the Brazilian sector, the major contribution to the 75% of morning CEJ events occurs during winterand summer months as it is evidenced in Figure 3. Using the EEJ measurements in the African sector,Doumouya et al. [1998] reported that roughly 50% of the CEJ events are observed during morning hours.Fambitakoye and Mayaud [1976] have also reported CEJ events between 7 and 8 h LT during the centralAfrican experiment.Muniz [1992] reported that the CEJ events do not occur at the same local time in differentlongitudes since there is a modulation effect in CEJ events due to Moon. Alex and Mukherjee [2001] alsocompared the CEJ events at two equatorial stations Trivandrum and Addis Ababa and reported that thereare differences in CEJ events when observed in different longitudinal sectors.
Further, significant day-to-day variability is observed in the diurnal variations of EEJ over Indian and Braziliansectors during the three different seasons. Day-to-day variability in EEJ has also been reported using the mea-surements in the African sector by Abbas et al. [2012] and in the Indian sector by Chandrasekhar et al. [2014].This EEJ variability can be attributed to the variability of the ionospheric processes and physical structure
Figure 4. Histograms showing the variation of the percentage of CEJevents at different local times in the Indian and Brazilian sectors duringthe year 2004.
Journal of Geophysical Research: Space Physics 10.1002/2015JA021307
VENKATESH ET AL. DAY-TO-DAY VARIABILITY OF EEJ AND EIA 6

such as conductivity and wind structure [Abbas et al., 2012]. Yamazaki et al. [2014] reported that the irregularvariability of the neutral wind produces day-to-day variations in the daily range of Sq (H) near the magneticequator causing the electrojet variability from day-to-day. They have also shown that the zonal polarizationelectric field of the zonal wind is the main source of the day-to-day variations of equatorial electrojet. In thepresent study, simultaneous observations of the diurnal, seasonal, and day-to-day characteristics of EEJand TEC in the Indian and Brazilian sectors reveal that both the parameters show equinoctial maxima withsignificant day-to-day variability in the day maximum values. Particularly, in both the sectors, the variabil-ities in TEC around the anomaly crest locations are in coincidence with the EEJ variabilities during threedifferent seasons.
3.2. Semi Annual Variations in EEJ and TEC
The EEJ values over Indian and Brazilian sectors along with the TEC over two equatorial stations (TRIV in Indiaand BELE in Brazil) and two anomaly crest locations (BHOP in India and BRAZ in Brazil) are analyzed to studythe semiannual characteristics. Monthly mean diurnal variations of EEJ and TEC during the year 2004 are pre-sented as contour plots in Figure 5. Figure 5 (top) shows the variations of EEJ and TEC over Indian sector,while Figure 5 (bottom) represents those over the Brazilian sector. It is readily seen from these contours thatboth EEJ and TEC have shown semiannual variations with two peaks during equinoctial months ofMarch/April and September/October. Chandrasekhar et al. [2014] have studied the EEJ variations over theIndian sector and reported the semiannual behavior with two peaks in the equinoctial months. Magnetic fieldobservations from other regions of the globe have also revealed the semiannual behavior in the EEJ varia-tions [Doumouya et al., 1998; Mazaudier et al., 2005, 2006; Abbas et al., 2012]. It is seen from this figure thatthe TEC values over the equatorial stations are lower compared to those over the anomaly crest locations.However, the semiannual behavior in TEC over equator and anomaly crests are similar to that observed inthe variations of EEJ. Over the contours of EEJ and TEC, magenta colored vertical lines are drawn along the
Figure 5. Contour plots showing the diurnal variation of EEJ and TEC over the equator and anomaly crest locations in theIndian and Brazilian sectors during the year 2004.
Journal of Geophysical Research: Space Physics 10.1002/2015JA021307
VENKATESH ET AL. DAY-TO-DAY VARIABILITY OF EEJ AND EIA 7

day maximum covering the two semiannual peaks. It can be noticed from these magenta lines that themaximum in the diurnal variation of EEJ is observed around 1100 h LT, while the day maximum is seenaround 1500 h LT in the diurnal variation of TEC in both the hemispheres. This indicates that after theoccurrence of the day maximum in EEJ, there exists a time lag to reach the day maximum level in TEC.
3.3. Role of EEJ Variations on the Formation and Characteristics of the EIA Crest
The characteristic features of the EIA such as the strength, location, and the extent of the anomaly are theparameters required to understand the electron density variability in the equatorial and low-latitude sectors.The TEC data from two different chains of stations over Indian and Brazilian sectors are analyzed to derive thecharacteristic features of the EIA. The simultaneous values of the EEJ strength are used to study its role on the for-mation and development of the EIA crest, and the corresponding results are presented in the following sections.3.3.1. Variations of EIA and EEJ During Different SeasonsFigure 6 represents the contour plots of TEC showing the equatorial ionization anomaly during different monthsrepresenting equinox, winter, and summer seasons over Indian and Brazilian sectors. The correspondingmonthlymean diurnal variations of EEJ are superimposed as white colored curves on the EIA contours. The three contourson the top row show the EIA variations over Indian sector, while the three contours in the bottom row representthose of the Brazilian sector. It is observed that the EIA crest is strong during equinoctial months over the twohemispheres. The anomaly crest is found to be weak during summer (July 2004) in the northern hemisphereand during winter (June 2004) in the southern hemisphere. Also, the location of the EIA crest is found to befarther from the equator during equinoctial months compared to that duringwinter and summermonths in bothhemispheres. Simultaneously, the white colored monthly mean EEJ shows strong peak during equinoctialmonths with the day maximum of about 60nT in both the sectors, which is in coincidence with the observedstrong EIA. Further, during northern summer (July 2004) and southern winter (June 2004), the EEJ is found tobe weak showing the day maximum of about 40nT in the Indian sector and about 20nT in the Brazilian sector,which is also in coincidence with the weak EIA seen in the TEC variations. These observations indicate that the
Figure 6. Equatorial ionization anomaly variations during three different months representing three seasons equinox,winter, and summer in the Indian and Brazilian sectors. The simultaneous monthly mean diurnal variations of EEJ valuesare plotted on the corresponding contours.
Journal of Geophysical Research: Space Physics 10.1002/2015JA021307
VENKATESH ET AL. DAY-TO-DAY VARIABILITY OF EEJ AND EIA 8
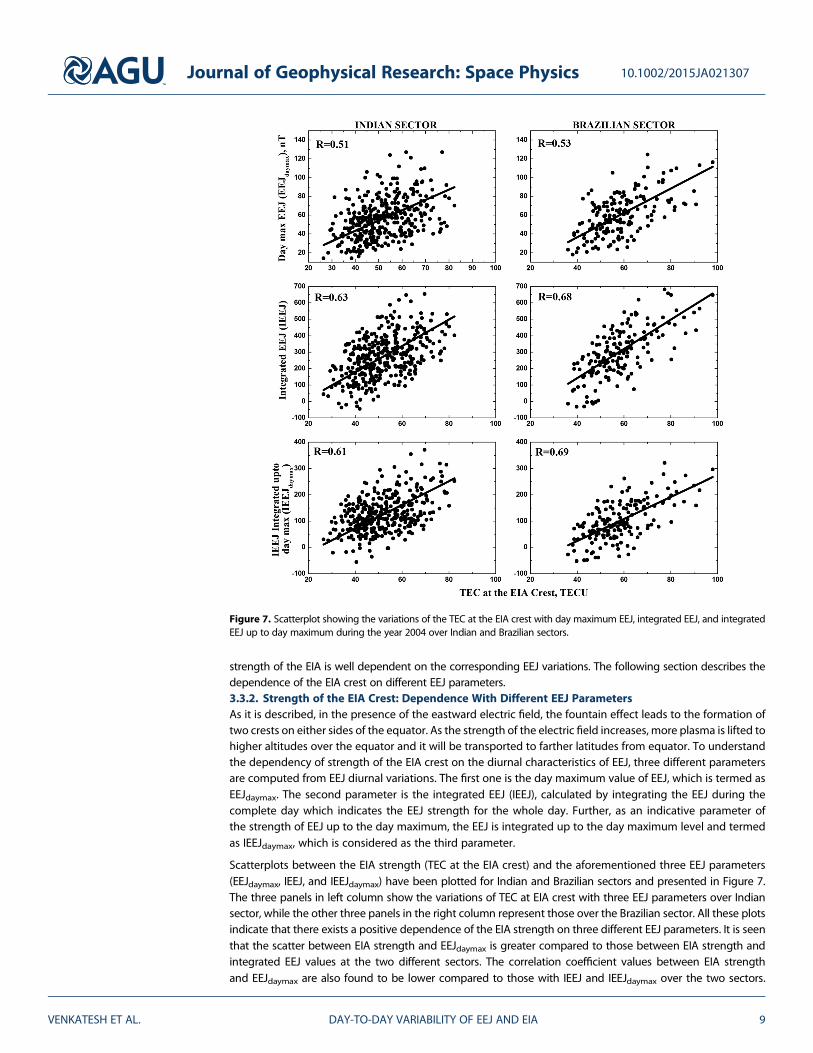
strength of the EIA is well dependent on the corresponding EEJ variations. The following section describes thedependence of the EIA crest on different EEJ parameters.3.3.2. Strength of the EIA Crest: Dependence With Different EEJ ParametersAs it is described, in the presence of the eastward electric field, the fountain effect leads to the formation oftwo crests on either sides of the equator. As the strength of the electric field increases, more plasma is lifted tohigher altitudes over the equator and it will be transported to farther latitudes from equator. To understandthe dependency of strength of the EIA crest on the diurnal characteristics of EEJ, three different parametersare computed from EEJ diurnal variations. The first one is the day maximum value of EEJ, which is termed asEEJdaymax. The second parameter is the integrated EEJ (IEEJ), calculated by integrating the EEJ during thecomplete day which indicates the EEJ strength for the whole day. Further, as an indicative parameter ofthe strength of EEJ up to the day maximum, the EEJ is integrated up to the day maximum level and termedas IEEJdaymax, which is considered as the third parameter.
Scatterplots between the EIA strength (TEC at the EIA crest) and the aforementioned three EEJ parameters(EEJdaymax, IEEJ, and IEEJdaymax) have been plotted for Indian and Brazilian sectors and presented in Figure 7.The three panels in left column show the variations of TEC at EIA crest with three EEJ parameters over Indiansector, while the other three panels in the right column represent those over the Brazilian sector. All these plotsindicate that there exists a positive dependence of the EIA strength on three different EEJ parameters. It is seenthat the scatter between EIA strength and EEJdaymax is greater compared to those between EIA strength andintegrated EEJ values at the two different sectors. The correlation coefficient values between EIA strengthand EEJdaymax are also found to be lower compared to those with IEEJ and IEEJdaymax over the two sectors.
Figure 7. Scatterplot showing the variations of the TEC at the EIA crest with day maximum EEJ, integrated EEJ, and integratedEEJ up to day maximum during the year 2004 over Indian and Brazilian sectors.
Journal of Geophysical Research: Space Physics 10.1002/2015JA021307
VENKATESH ET AL. DAY-TO-DAY VARIABILITY OF EEJ AND EIA 9

This indicates that the strength of the EIA ismore dependent on integrated EEJ values (IEEJ and IEEJdaymax) com-pared to that of the day maximum EEJ. Further, the two different cases with the IEEJ and IEEJdaymax have shownsimilar correlation coefficient values in both the sectors. This observation indicates that for the formation of theEIA crest, the role of the strength of EEJ up to the daymaximum (IEEJdaymax) is more significant compared to theinfluence of EEJ after the day maximum.
To understand the role of the IEEJdaymax on the strength of the EIA crest, various examples of the EIA alongwith the corresponding EEJ diurnal variations over Indian and Brazilian sectors have been plotted andpresented in Figure 8. The eight contours in the top two rows represent the examples over the Indian sector,while the remaining eight contours in the bottom two rows represent the examples over the Brazilian sector.It is seen from the example on 17 July 2004 in the Indian sector that there is a strong counter electrojet in themorning hours, and later, the EEJ reaches to a day maximum of about 70 nT. In this case, the anomaly is notclearly observed and the EIA crest is not formed. In the adjacent contour on 25 October 2004, there is nocounter electrojet and the day maximum EEJ is around 70 nT. A well-developed equatorial anomaly is seenon this day with a strong EIA crest. In these four different sets of examples, even though the day maximumvalues of EEJ are nearly similar and occurred around the same local time, the anomaly can be seen on the days
Figure 8. Examples showing the equatorial ionization anomaly variations along with the corresponding diurnal variations of EEJ over Indian and Brazilian sectors.
Journal of Geophysical Research: Space Physics 10.1002/2015JA021307
VENKATESH ET AL. DAY-TO-DAY VARIABILITY OF EEJ AND EIA 10

without morning CEJ and it is absent during the days with morning CEJ. During the four CEJ days (17 July 2004,25 January 2004, 27 July 2004, and 15 May 2004) there is counter electrojet in the morning hours and theIEEJdaymax is less and is not producing sufficient uplift for the plasma over the equator for the formation ofEIA crest. During the other four cases (25 October 2004, 24 February 2004, 26 March 2004, and 3 February2004) there is no morning CEJ and the IEEJdaymax is strong and is producing enough uplift for the plasma overthe equator leading to the formation of the strong EIA crest.
Similarly, different sets of examples are presented over the Brazilian sector. In the examples on four CEJ days(1 January 2004, 12 January 2004, 13 June 2004, and 27 February 2004), a strong counter electrojet is seen inthe morning hours leading to a smaller value of IEEJdaymax resulting in the absence of the formation of clearanomaly crest. During the other four examples without morning CEJ (25 March 2004, 27 January 2004, 8March 2004, and 13 May 2004), IEEJdaymax gives strong support to the formation of the clear anomaly witha strong EIA crest. All these examples presented over Indian and Brazilian sectors clearly indicate that theEEJ strength up to the day maximum (IEEJdaymax) plays significant role on the formation and developmentof the EIA crest. This is also in agreement with the observations made from scatterplots in Figure 7 usingthe data for the year 2004, where the IEEJdaymax shows nearly similar correlation compared to that of theIEEJ and more correlation compared to those with EEJdaymax.3.3.3. Role of the Diurnal Variation of EEJ on the Temporal Extent of the EIA CrestOnce the well-developed equatorial anomaly is formed, it may start decaying soon or may exist for some timeand then start decaying to the normal conditions. Therefore, the duration of the existence of the anomaly isanother important aspect to understand the electron density variability over the equatorial and low latitudes.To study the effect of EEJ variations on the temporal extent of the EIA, different examples of the anomalyalong with EEJ diurnal variations are presented in Figure 9. The six contour plots in the top two rows repre-sent different examples over Indian sector, and the remaining six contours in the bottom two rows representthe examples over Brazilian sector. The corresponding EEJ diurnal variations are plotted as white coloredcurves on each of the contours. From the three contours in the first row over the Indian sector, it is seen thatthe electrojet show three different diurnal characteristics. On 12 October 2004, the electrojet exhibits a sharpday maximum around 1000 h LT. The anomaly on this day is strong and exists for only a short duration. In thesecond example on 23 October 2004, the EEJ shows a broad day maximum between 08:00 to 14:00 h LT. Onthis day, the strong anomaly is seen for a long duration of more than 4 h. Further, in the third example on 19July 2004, the EEJ shows a double humped structure with two peaks around 10:00 and 14:00 h LT.Surprisingly, from the electron density distribution over the EIA crest on this day, it is seen that a weak anom-aly is formed around noon hours, which decays for some time, and later, a well-developed anomaly is formedand it stays for few hours.
Similarly, over the Brazilian sector, the EEJ variations on 8 April 2004 show a sharp day maximum and thecorresponding anomaly is very strong and exists for a short duration. On the other day of 2 May 2004, theEEJ shows a broad day maximum, while the anomaly is also seen for a long duration of about 4 h. In the otherexample on 1 February 2004, the EEJ shows double humped structure with two peaks around 11:00 and16:00 h LT and the corresponding anomaly on this day shows two weak crests. Even though the cases oftwo crests are very rare, these type of examples give more evidence about the role of EEJ on the EIA character-istics. Different examples presented in Figure 9 over Indian and Brazilian sectors indicate that on each particularday, the diurnal characteristics of the EEJ play a vital role on the structure and temporal extent of the EIA crest.3.3.4. Time Delay Between the Occurrences of the Day Maximum EEJ and the Well-Developed EIAIt is mentioned in section 3.2 from Figure 5 that there is a time lag between the occurrences of the daymaximum EEJ and the day maximum TEC over Indian and Brazilian sectors. Also, different cases presentedin various contours to describe the characteristics of the EIA (Figures 6, 8, and 9) and indicate that there isa time lag between the day maximum EEJ and the well-developed EIA crest. To understand the variationsof this time difference in detail, the day-to-day EEJ and EIA variations over the two sectors during the year2004 are analyzed. The time differences between the occurrences of day maximum EEJ and well-developedanomaly are calculated, and the results are presented in Figure 10 as histograms for various time differencevalues. Figure 10 (top) shows the percentage of cases for each half an hour over Indian sector, and Figure 10(bottom) shows those over the Brazilian sector. It is seen from these histograms that the time differencebetween the occurrences of day maximum EEJ and well-developed EIA varies from a minimum of 3 h to amaximum of about 5 h over the two different sectors. Further, it is clearly seen from these histograms that
Journal of Geophysical Research: Space Physics 10.1002/2015JA021307
VENKATESH ET AL. DAY-TO-DAY VARIABILITY OF EEJ AND EIA 11

nearly 80% of the cases have a time difference of 3:30 to 4:30 h over both Indian and Brazilian sectors. It canbe inferred from these observations that it takes around 4 h to form a well-developed EIA crest after theoccurrence of the day maximum in the diurnal variation of EEJ.
4. Summary
Variabilities in the equatorial electrojet and the equatorial ionization anomaly are simultaneously studiedto understand the role of EEJ on the EIA characteristics in the Indian (northern hemisphere) and Brazilian
Figure 9. Contour plots showing the variations of the EIA crest with respect to the variations in the diurnal characteristics ofthe EEJ over Indian and Brazilian sectors.
Journal of Geophysical Research: Space Physics 10.1002/2015JA021307
VENKATESH ET AL. DAY-TO-DAY VARIABILITY OF EEJ AND EIA 12

(southern hemisphere) sectors. Themagnetometer measurements duringthe low solar activity year 2004 are usedto derive the EEJ values. SimultaneousGPS-TEC measurements from two differ-ent chains of stations along the commonmeridian of 77°E in the Indian sector and45°W in the Brazilian sector are used tostudy the EIA variabilities. It is observedthat the diurnal variations of EEJ showequinoctial maximum in both sectors.Significant day-to-day variability isobserved in the diurnal variations ofEEJ over the Indian and Brazilian sec-tors. The diurnal variations of TEC havealso shown significant seasonal depen-dence with equinoctial maximum andsummer minimum in the Indian sectorand winter minimum in the Braziliansector. TEC variations at all locationsexhibit significant day-to-day variabil-ity, which is found to be more promi-nent at and around the anomaly crestlocations during the equinoctialmonths. Simultaneous observations ofEEJ and TEC around the anomaly crestlocations reveal similar seasonal andday-to-day variability in their values.Semiannual behavior with two peaks inMarch/April and September/Octoberis simultaneously observed in the EEJand TEC variations over the equator andanomaly crests locations in the twohemispheres.
The strength of the EIA during different seasons is in agreement with the strength of the EEJ over the twosectors. The strength of the EIA has shown good correlation with the integrated EEJ values (IEEJ andIEEJdaymax) compared to the day maximum EEJ. It is also found that the integrated EEJ strength up to theday maximum (IEEJdaymax) plays a vital role on the formation of the EIA. For each particular day, the tem-poral extent of the well-developed EIA crest and its characteristics have shown significant dependencewith the corresponding diurnal characteristics of the EEJ. Further, it is observed that after the occurrenceof the day maximum in the EEJ, there exists a time delay for the formation of the well-developed EIA. Inmajor number of cases, this delay is found to vary around 4 h. It may be inferred from the present studyover the Indian and Brazilian sectors that the diurnal variations of the EEJ have significant control on theformation as well as the development of the EIA. The two important aspects observed in this analysis are(i) the dependence of the EIA strength on the IEEJdaymax and (ii) the time delay between the occurrencesof the day maximum EEJ and well-developed EIA. This indicates that the diurnal characteristics of theEEJ can provide the information about the EIA characteristics few hours in advance.
The present study demonstrates that the day-to-day variability of EIA and the characteristic features of theanomaly crest exhibit strong dependence with the EEJ diurnal characteristics. This study also reveals thatthe EEJ could provide information of the EIA characteristics few hours in advance. Hence, quantitativestudies on the role of EEJ on EIA characteristic features over different regions during different solar activityconditions will be of immense use for the improved predictions of TEC over the equatorial and low-latitude sectors.
Figure 10. Histograms showing the variation of the time differencebetween the occurrences of day maximum EEJ and well-developed EIAcrest in the Indian and Brazilian sectors during the year 2004.
Journal of Geophysical Research: Space Physics 10.1002/2015JA021307
VENKATESH ET AL. DAY-TO-DAY VARIABILITY OF EEJ AND EIA 13

ReferencesAbbas, M., B. D. B. Joshua, I. A. Adimula, A. B. Raibu, and O. R. Bello (2012), Variability of electrojet strength along the magnetic equator using
MAGDAS/CPMN data, J. Inf. Data Manage., 1(1), 10–13. [Available at http://researchpub.org/journal/jidm/number/vol1-no1-2.pdf.]Abdu, M. A., I. S. Batista, and J. R. deSouza (1996), An overview of IRI-observational data comparison in American (Brazilian) sector low latitude
ionosphere, Adv. Space Res., 18(6), 13–22, doi:10.1016/0273-1177(95)00893-4.Alex, S., and S. Mukherjee (2001), Local time dependence of the equatorial counter electrojet effect in a narrow longitudinal belt, Earth
Planets Space, 53, 1151–1161. [Available at http://svr4.terrapub.co.jp/journals/EPS/pdf/2001/5312/53121151.pdf.]Bagiya, M. S., H. P. Joshi, K. N. Iyer, M. Aggarwal, S. Ravindrayan, and B. M. Pathan (2009), TEC variations during low solar activity period (2005–2007)
near the equatorial ionospheric anomaly crest region in India, Ann. Geophys., 27, 1047–1057, doi:10.5194/angeo-27-1047-2009.Baker, W. G., and D. F. Martyn (1953), Electric current in the ionosphere, The conductivity, Philos. Trans. R. Soc. London, 246(A913), 281–294,
doi:10.1098/rsta.1953.0016.Brunini, C., M. A. Van Zele, A. Meza, and M. Gende (2003), Quiet and perturbed ionospheric representation according to the electron content
from GPS signals, J. Geophys. Res., 108(A2), 1056, doi:10.1029/2002JA009346.Chandra, H., H. S. S. Sinha, and R. G. Rastogi (2000), Equatorial electrojet studies from rocket and ground measurements, Earth Planet Space,
52(2), 111–120. [Available at http://link.springer.com/article/10.1186%2FBF03351619.]Chandrasekhar, N. P., K. Arora, and N. Nagarajan (2014), Characterization of seasonal and longitudinal variability of EEJ in the Indian region,
J. Geophys. Res. Space Physics, 119, 10,242–10,259, doi:10.1002/2014JA020183.Chapman, S. (1951), The equatorial electrojet as detected from the abnormal electric current distribution about Huancayo, Peru and elsewhere,
Arch. Meteorol., Geophys. Bioklimatol., Ser. A, 4(1), 368–390. [Available at http://link.springer.com/article/10.1007%2FBF02246814.]Chapman, S., and J. Bartels (1940), Geomagnetism, vol. 1 and 2, Oxford Univ. Press. (Clarendon), London and New York.Denardini, C. M., M. A. Abdu, H. C. Aveiro, L. C. A. Resende, P. D. S. C. Almeida, E. P. A. Olivio, J. H. A. Sobral, and C. M. Wrasse (2009), Counter
electrojet features in the Brazilian sector: Simultaneous observation by radar, digital sounder and magnetometers, Ann. Geophys., 27,1593–1603, doi:10.5194/angeo-27-1593-2009.
Denardini, C. M., L. C. A. Resende, J. Moro, M. Rockenbach, P. R. Fagundes, M. A. Gende, S. S. Chen, N. J. Schuch, and A. Petry (2013), The SouthAmerican K index: Initial steps from the embrace magnetometer network, Proc. of the 13th International Congress of the BrazilianGeophysical Society & EXPOGEF, Rio de Janeiro, Brazil 26–29 August 2013, 1901–1905, doi:10.1190/sbgf2013-391.
Doumouya, V., and Y. Cohen (2004), Improving and testing the empirical equatorial electrojet model with CHAMP satellite data, Ann.Geophys., 22, 3323–3333, doi:10.5194/angeo-22-3323-2004.
Doumouya, V., J. Vassal, Y. Cohen, O. Fambitakoye, and M. Menvielle (1998), Equatorial electrojet at African longitudes: First results frommagnetic measurements, Ann. Geophys., 16, 658–666, doi:10.1007/s00585-998-0658-9.
Doumouya, V., Y. Cohen, B. R. Arora, and K. Yumoto (2003), Local time and longitude dependence of the equatorial electrojet magneticeffects, J. Atmos. Terr. Phys., 65(14–15), 1265–1282, doi:10.1016/j.jastp.2003.08.014.
Fambitakoye, O. (1976), Equatorial electrojet and regular daily variation SR–II. The centre of the equatorial electrojet, J. Atmos. Terr. Phys.,38(1), 19–26, doi:10.1016/0021-9169(76)90189-6.
Fambitakoye, O., and P. N. Mayaud (1976), The squatorial electrojet and regular daily variation SR: I. A determination of the equatorialelectrojet parameters, J. Atmos. Terr. Phys., 38, 1–17, doi:10.1016/0021-9169(76)90188-4.
Forbes, J. M. (1981), The equatorial electrojet, Rev. Geophys. Space Phys., 19(3), 469–504, doi:10.1029/RG019i003p00469.Forbush, S. E., and M. Casaverde (1961), The Equatorial Electrojet in Peru, 620 pp., The Kirby Lithographic Company, Inc., Washington, D. C.
[Available at http://catalog.hathitrust.org/Record/001639508.]Gouin, P., and P. N. Mayaud (1967), A propos de lexistence possible d’un “contre-electrojet” aux latitudes magnetiques equatoriales, Ann.
Geophys., 23, 41–47.Guizelli, L. M., C. M. Denardini, J. Moro, and L. C. A. Resende (2013), Climatological study of the daytime occurrence of the 3-meter EEJ plasma
irregularities over Jicamarca close to the solar minimum (2007 and 2008), Earth Planets Space, 65, 39–44, doi:10.5047/eps.2012.05.008.Jee, G., R. W. Schunk, and L. Scherliess (2005), On the sensitivity of total electron content (TEC) to upper atmospheric/ionospheric parameters,
J. Atmos. Sol. Terr. Phys., 67(11), 1040–1052, doi:10.1016/j.jastp.2005.04.001.Kane, R. P. (1976), Geomagnetic field variations, Space Sci. Rev., 18, 413–540. [Available at http://link.springer.com/article/10.1007/BF00217344.]Kane, R. P., and N. B. Trivedi (1982), Comparison of equatorial electrojet characteristics at Huancayo and Eusebio (Fortaleza) in the South
American region, J. Atmos. Terr. Phys., 44(9), 785–792, doi:10.1016/0021-9169(82)90007-1.Mannucci, A. J., B. D. Wilson, D. N. Yuan, C. M. Ho, U. J. Lindqwister, and T. F. Runge (1998), A global mapping technique for GPS derived
ionospheric total electron content measurements, Radio Sci., 33, 565–582, doi:10.1029/97RS02707.Mayaud, P. N. (1977), The equatorial counter electrojet – A review of its geomagnetic aspects, J. Atmos. Terr. Phys., 39(9–10), 1055–1070,
doi:10.1016/0021-9169(77)90014-9.Mazaudier, A. C., et al. (2006), Sun-Earth System Interaction studies over Vietnam: An international cooperative project, Ann. Geophys., 24,
3313–3327, doi:10.5194/angeo-24-3313-2006.Mazaudier, C., et al. (1993), International equatorial electrojet year, Braz. J. Geophys., 11(3), 303–317.Mazaudier, C. A., et al. (2005), On equatorial geophysics studies: A review on the IGRGEA results during the last decade, J. Atmos. Terr. Phys.,
67, 301–313, doi:10.1016/j.jastp.2004.10.001.Muniz, B. L. (1992), The equatorial electrojet: A brief review, Geofisica Internacional, 31(2), 115–120. [Available at http://www.revistas.unam.
mx/index.php/geofisica/article/view/39477.]Onwumechili, C. A. (1967), Geomagnetic variations in the equatorial zone, in Physics of Geomagnetic Phenomena, vol. 1, Chap.III-2, edited by
S. Matsushita and W. H. Campbell, pp. 425–507, Academic Press, New York.Rabiu, A. B., N. Nagarajan, F. N. Okeke, and E. A. Anyibi (2007), A study of day-to-day variability in geomagnetic field variations at the
electrojet zone of Addis Ababa, East Africa, Afr. J. Sci. Tech., 8(2), 54–63.Rastogi, R. G. (1989), The equatorial electrojet: Magnetic and ionospheric effects, in Geomagnetism, vol. 3, chap. 7, pp. 461–525, edited by
J. A. Jacobs, Academic Press, London.Rastogi, R. G., H. Chandra, S. Rahul, N. B. Trivedi, and S. L. Fontes (2013), A comparison of equatorial electrojet in Peru and east Brazil, Open
Atmos. Sci. J., 7, 29–36, doi:10.2174/1874282320130417003.Reddy, C. A. (1981), The equatorial electrojet: A review of the ionospheric and geomagnetic aspects, J. Atmos. Terr. Phys., 43(5–6), 557–571,
doi:10.1016/0021-9169(81)90118-5.Reddy, C. A. (1989), The equatorial electrojet, Pure Appl. Geophys., 131(3), 485–508. [Available http://link.springer.com/article/10.1007%
2FBF00876841.]
Journal of Geophysical Research: Space Physics 10.1002/2015JA021307
VENKATESH ET AL. DAY-TO-DAY VARIABILITY OF EEJ AND EIA 14
AcknowledgmentsOne of the authors, K.V., wish to expresshis sincere thanks to the Fundação deAmparo a Pesquisa do Estado de SaoPaulo (FAPESP), Sao Paulo, Brazil,for providing financial supportthrough the process 2012/08445-9 and2013/17380-0. C.M. Denardini thanksCNPq/MCTI (grant 303121/2014-9),FAPESP (grant 2012/08445-9), and tothe Brazilian Government (Program2056, Budget Action N387, Budget Plan08/2013-2017), which supported both thescientific and infrastructure projects thatgave birth to the Embrace MagnetometerNetwork and to the Embrace/INPEProgram. The authors wish to expresstheir sincere thanks to IBGE (http://www.ibge.gov.br/home/geociencias/geodesia/rbmc/rbmc_est.php) for providingGPS-TEC data over Brazil, to the GSFC,NASA for providing the TEC data overBrasilia (BRAZ) (http://cdaweb.gsfc.nasa.gov/istp_public/), and the Indian Instituteof Geomagnetism for providingmagnetometer data in the Indian sector(http://wdciig.res.in/WebUI/Home.aspx).One of the authors, K.V., wishes to expresshis heartfelt gratitude to his mentor lateP.V.S.Rama Rao for his invaluablesuggestions.

Richmond, A. D. (1973), Equatorial electrojet—I. Development of a model including winds and electric field, J. Atmos. Terr. Phys., 35(6),1083–1103, doi:10.1016/0021-9169(73)90007-X.
Shimeis, A., C. A. Mazaudier, R. Fleury, A. M. Mahrous, and A. F. Hassan (2014), Transient variations of vertical total electron content over someAfrican stations from 2002 to 2012, Adv. Space Res., 54, 2159–2171, doi:10.1016/j.asr.2014.07.038.
Shimeis, A., C. Borries, C. A. Mazaudier, R. Fleury, A. M. Mahrous, A. F. Hassan, and S. Nawar (2015), TEC variations along an East Euro-Africanchain during 5th April 2010 geomagnetic storm, Adv. Space Res., 55, 2239–2247, doi:10.1016/j.asr.2015.01.005.
Stening, R. J. (1985), Modeling the equatorial electrojet, J. Geophys. Res., 90(A2), 1705–1719, doi:10.1029/JA090iA02p01705.Sugiura, M., and J. C. Cain (1966), A model equatorial electrojet, J. Geophys. Res., 71(7), 1869–1877, doi:10.1029/JZ071i007p01869.Sugiura, M., and D. J. Poros (1969), An improved model equatorial electrojet with a meridional current system, J. Geophys. Res., 74(16),
4025–4034, doi:10.1029/JA074i016p04025.Venkatesh, K., P. R. Fagundes, G. K. Seemala, R. de Jesus, A. J. de Abreu, and V. G. Pillat (2014), On the performance of the IRI-2012 and
NeQuick2 models during the increasing phase of the unusual 24th solar cycle in the Brazilian equatorial and low-latitude sectors,J. Geophys. Res. Space Physics, 119, 5087–5105, doi:10.1002/2014JA019960.
Yamazaki, Y., A. D. Richmond, A. Maute, H.-L. Liu, N. Pedatella, and F. Sassi (2014), On the day-to-day variation of the equatorial electrojetduring quiet periods, J. Geophys. Res. Space Physics, 119, 6966–6980, doi:10.1002/2014JA020243.
Journal of Geophysical Research: Space Physics 10.1002/2015JA021307
VENKATESH ET AL. DAY-TO-DAY VARIABILITY OF EEJ AND EIA 15