dds grr phase modulation in the picopak clock … grr phase modulation in the picopak clock...dds...
TRANSCRIPT

1
DDS GRR Phase Modulation in the PicoPak Clock Measurement Module
W.J. Riley Hamilton Technical Services
Beaufort, SC 29907 USA
Introduction
The PicoPak clock measurement module [1] uses a direct digital synthesizer (DDS) to generate its internal reference signal and to make phase measurements using a phase tracking loop and the DDS phase offset word. Any unwanted phase modulation can affect those phase measurements. Besides DDS phase quantization and other sources of baseband noise in the phase detector, DC amplifier and analog comparator, low frequency DDS phase variations could also be introduced into the measurement results by so-called Grand Repetition Rate (GRR) phase modulation [2-3]. This paper describes that phenomenon and its possible effect on PicoPak phase measurements.
GRR Phase Modulation
The Analog Devices AD9951 DDS [4] used in the PicoPak module has 32 bits of frequency resolution, 14 bits of phase offset resolution, 19 bits of cosine table resolution, and 14 bits of DAC resolution [5]. For all output frequencies except those where the DDS frequency word is a power of two (a PicoPak signal input of exactly 6 MHz or 12 MHz), there is a residue in the DDS phase accumulator when it “spills over” each cycle of the output frequency. That residue typically repeats at a rather long interval (e.g., 10’s of seconds) at the GRR rate equal to: GRR = 2N/GCD(W, 2N) where: GRR = Grand Repetition Rate GDC = Greatest Common Divisor [6] N = # DDS frequency word bits (32-bits for PicoPak AD9951) W = DDS frequency word For example, at a PicoPak signal frequency of exactly 10 MHz, the closest 32-bit DDS tuning word is 357,913,941 (15555555 hex) for its 120 MHz clock frequency, the GDC is 1, the GRR is 4,294,967,296, and the GRR period is about 35.79 seconds. The GRR period for the adjacent DDS tuning words is one-quarter as long (8.95 seconds) for -1 and on-half as long (19.90 seconds) for +1 since their GDC are 4 and 2 respectively. Notice also that the closest DDS setting has fractional frequency difference of about -9.31x10⁻¹⁰ at exactly 10 MHz, which corresponds to a phase slew of 931 ps/s or 153 DDS phase increments per second. This phase ramp has a period of about 107 seconds, x4 the GRR period. That phase slew is removed mathematically from the reported PicoPak data. The effect of the DDS phase accumulator residue is to cause phase modulation at the GRR period (and its multiples) because of different cosine samples being used as it changes. In the frequency domain, this would cause discrete spectral components (spurs) at the GRR frequency. Although this is attenuated by the relatively large number (19) of cosine lookup table bits, it could possible cause a

2
periodic variation in the PicoPak phase reading, especially with coherent reference and signal inputs, or with very low noise sources, when observing its noise floor. The phase residue does not affect the DDS frequency accuracy, and is, in fact, necessary for it. The amplitude of the GRR spurs is low for the large DDS tuning words used in the PicoPak. The other more commonly considered AM and PM RF DDS spurs due to phase truncation, DAC nonlinearity, etc. are mostly attenuated by its low pass reconstruction filter and are not of great concern in the PicoPak application.
Looking for GRR PM Spurs
It is hard to quantify the expected amplitude of the low frequency GRR phase modulation since it depends on the details of the cosine lookup hardware, and it is best examined by performing a 10 MHz coherent noise floor test. When doing so, it is important to note the exact DDS setting, and to adjust the applied signal level for the lowest noise floor. As a first step, the raw phase data can be inspected for any obvious periodic variation. Then spectral analysis can be performed on either the phase or frequency data. White PM quantization noise is expected as the dominate noise process, so the power spectral density of the phase fluctuations will be flat versus Fourier frequency, at least at the higher frequencies, while thermal wandering and other more divergent fluctuations will likely be present at the lower frequencies. Because of that, it may be better to examine the spectrum of the frequency data,
which will be “prewhitened” and increase toward higher Fourier frequencies as Sy(f)f2. An important clue will be how the observed spurs vary with changes in the DDS word. There are, of course, other mechanisms for DDS spur generation [7-9], and many other possibilities related to PC noise, switching power supplies, phase detector (mixer) products, powerline components, ground loops, etc. as well as spurs associated with the source(s) themselves. Those things can be hard to sort out.
Measured GRR PM Spurs
It is unlikely that GRR PM spurs are significant in PicoPak data. The four plots below (Figures 1-4) below show the phase and frequency data and spectra for a 1-hour coherent 10 MHz PicoPak measurement. There is no evidence of significant spectral components in the 5 s to 200 s (200 mHz to 5 mHz) range. These data had a relatively high 1s ADEV of 1.4x10⁻¹¹ at a relatively high +7 dBm signal level and used a nominal 15555555 hex DDS frequency setting.

3
Figure 1. Phase Data
Figure 2. Frequency Data
Figure 3. Phase Spectrum Figure 4. Frequency Spectrum
The slow phase variations are probably due to thermal sensitivity and air conditioner cycling, while the short-term phase variations (see Figure 5) appear somewhat cyclic but with no consistent periodicity. The spectral plots have the expected slopes for white PM quantization noise at the higher Fourier frequencies. These data plots and spectra are typical of PicoPak coherent measurements, and seem free of obvious DDS GRR spurs.
Figure 5. Short-Term Phase Data
4
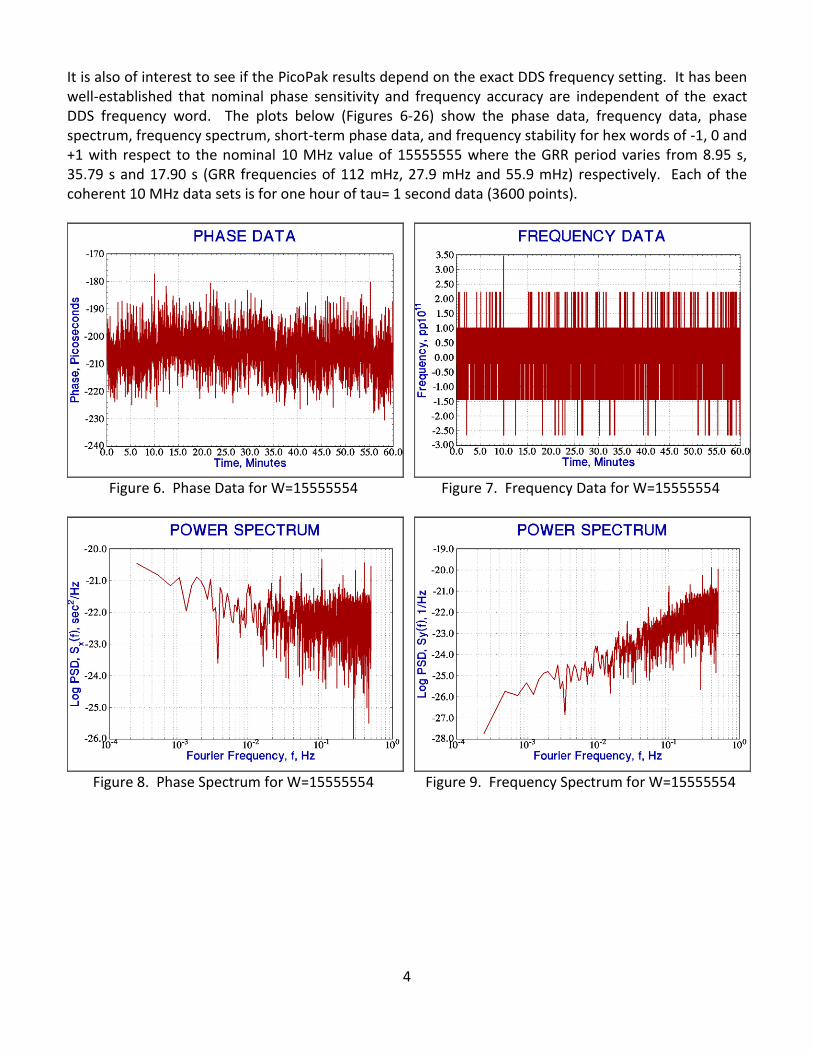
It is also of interest to see if the PicoPak results depend on the exact DDS frequency setting. It has been well-established that nominal phase sensitivity and frequency accuracy are independent of the exact DDS frequency word. The plots below (Figures 6-26) show the phase data, frequency data, phase spectrum, frequency spectrum, short-term phase data, and frequency stability for hex words of -1, 0 and +1 with respect to the nominal 10 MHz value of 15555555 where the GRR period varies from 8.95 s, 35.79 s and 17.90 s (GRR frequencies of 112 mHz, 27.9 mHz and 55.9 mHz) respectively. Each of the coherent 10 MHz data sets is for one hour of tau= 1 second data (3600 points).
Figure 6. Phase Data for W=15555554 Figure 7. Frequency Data for W=15555554
Figure 8. Phase Spectrum for W=15555554 Figure 9. Frequency Spectrum for W=15555554
5
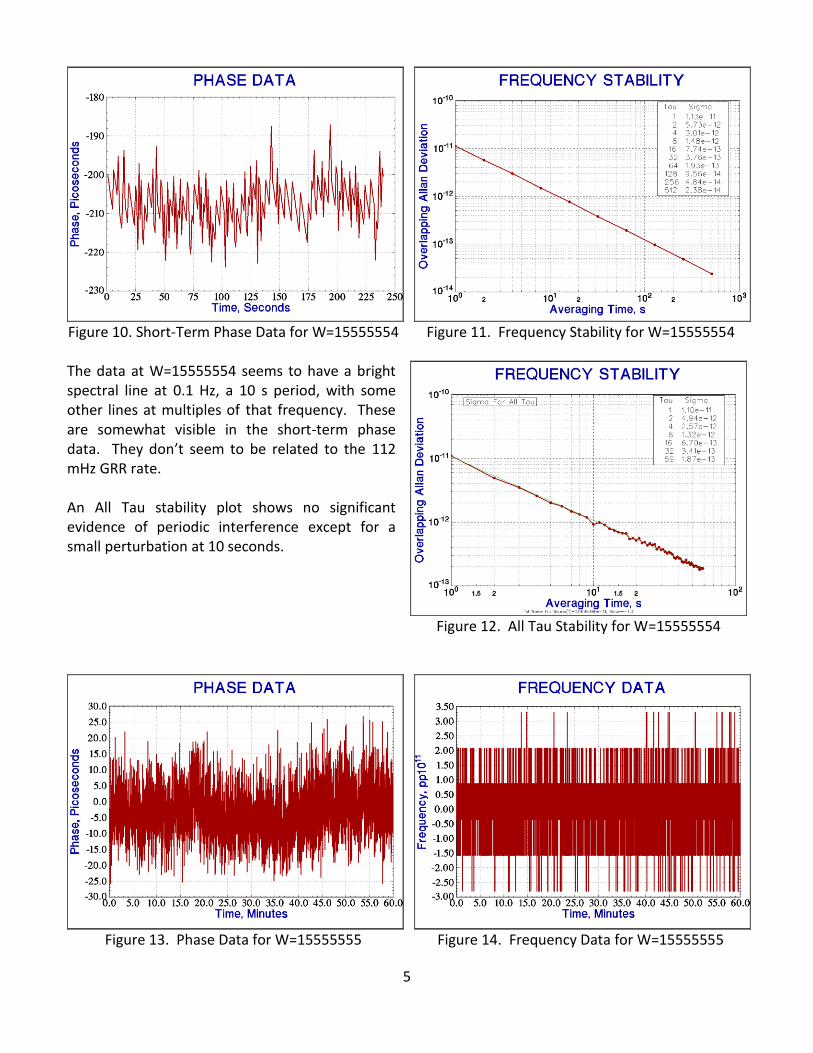
Figure 10. Short-Term Phase Data for W=15555554 Figure 11. Frequency Stability for W=15555554 The data at W=15555554 seems to have a bright spectral line at 0.1 Hz, a 10 s period, with some other lines at multiples of that frequency. These are somewhat visible in the short-term phase data. They don’t seem to be related to the 112 mHz GRR rate. An All Tau stability plot shows no significant evidence of periodic interference except for a small perturbation at 10 seconds.
Figure 12. All Tau Stability for W=15555554
Figure 13. Phase Data for W=15555555 Figure 14. Frequency Data for W=15555555

6
Figure 15. Phase Spectrum for W=15555555 Figure 16. Frequency Spectrum for W=15555555
Figure 17. Short-Term Phase Data for W=15555555 Figure 18. Frequency Stability for W=15555555 The data at W=15555555 also seems to have a bright spectral line at 0.1 Hz, a 10 s period, with some other lines at multiples of that frequency. These are somewhat visible in the short-term phase data. They definitely aren’t related to the 27.9 mHz GRR rate. An All Tau stability plot shows no significant evidence of periodic interference except for very small perturbations at 10 seconds and multiples thereof.
Figure 19. All Tau Stability for W=15555555
7
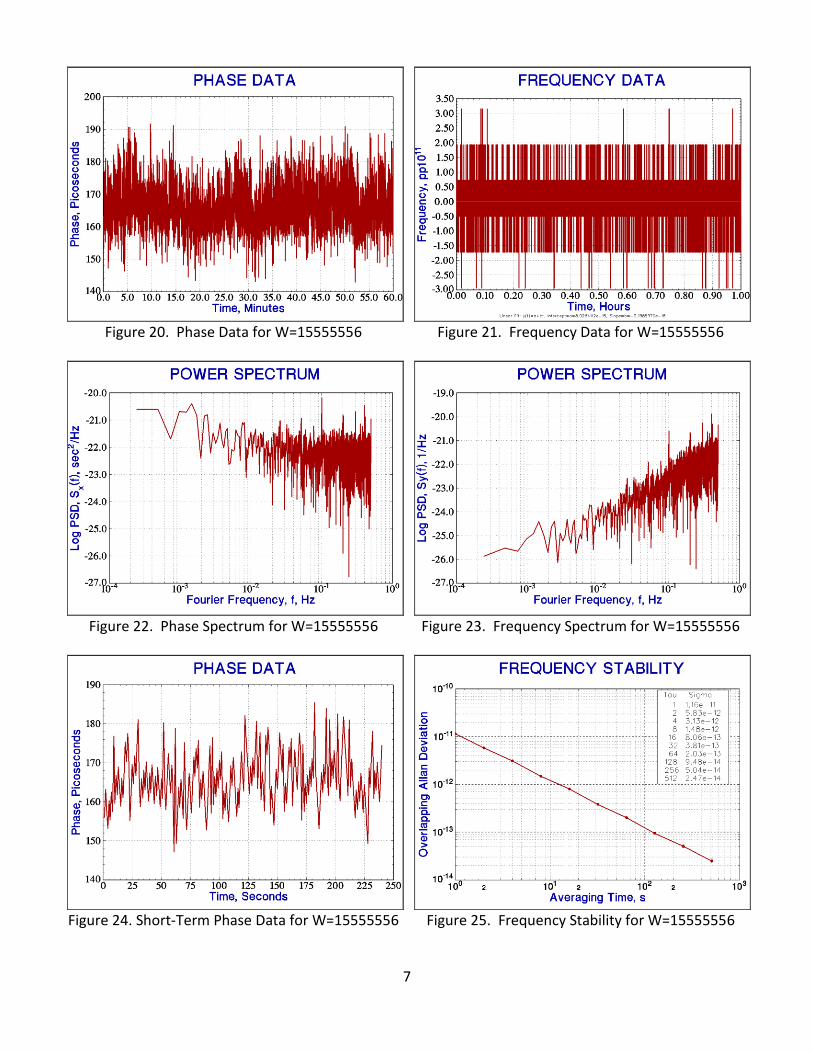
Figure 20. Phase Data for W=15555556
Figure 21. Frequency Data for W=15555556
Figure 22. Phase Spectrum for W=15555556
Figure 23. Frequency Spectrum for W=15555556
Figure 24. Short-Term Phase Data for W=15555556 Figure 25. Frequency Stability for W=15555556
8
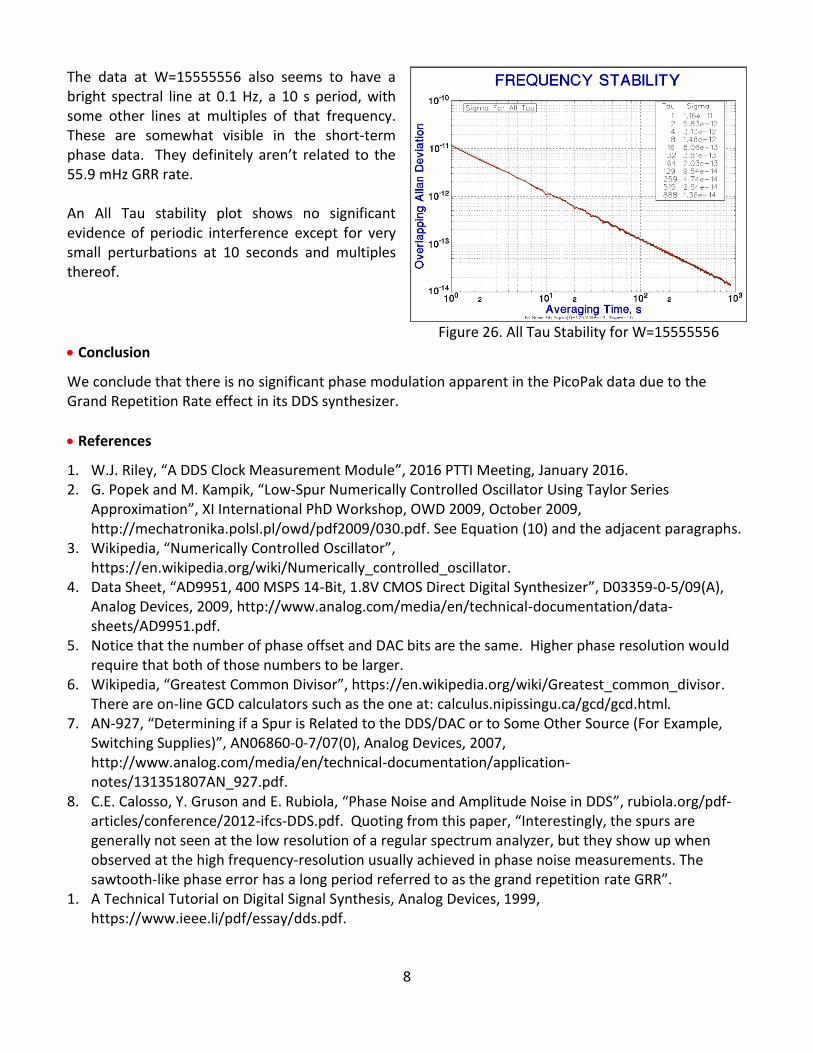
The data at W=15555556 also seems to have a bright spectral line at 0.1 Hz, a 10 s period, with some other lines at multiples of that frequency. These are somewhat visible in the short-term phase data. They definitely aren’t related to the 55.9 mHz GRR rate. An All Tau stability plot shows no significant evidence of periodic interference except for very small perturbations at 10 seconds and multiples thereof.
Figure 26. All Tau Stability for W=15555556
Conclusion
We conclude that there is no significant phase modulation apparent in the PicoPak data due to the Grand Repetition Rate effect in its DDS synthesizer.
References
1. W.J. Riley, “A DDS Clock Measurement Module”, 2016 PTTI Meeting, January 2016. 2. G. Popek and M. Kampik, “Low-Spur Numerically Controlled Oscillator Using Taylor Series
Approximation”, XI International PhD Workshop, OWD 2009, October 2009, http://mechatronika.polsl.pl/owd/pdf2009/030.pdf. See Equation (10) and the adjacent paragraphs.
3. Wikipedia, “Numerically Controlled Oscillator”, https://en.wikipedia.org/wiki/Numerically_controlled_oscillator.
4. Data Sheet, “AD9951, 400 MSPS 14-Bit, 1.8V CMOS Direct Digital Synthesizer”, D03359-0-5/09(A), Analog Devices, 2009, http://www.analog.com/media/en/technical-documentation/data-sheets/AD9951.pdf.
5. Notice that the number of phase offset and DAC bits are the same. Higher phase resolution would require that both of those numbers to be larger.
6. Wikipedia, “Greatest Common Divisor”, https://en.wikipedia.org/wiki/Greatest_common_divisor. There are on-line GCD calculators such as the one at: calculus.nipissingu.ca/gcd/gcd.html.
7. AN-927, “Determining if a Spur is Related to the DDS/DAC or to Some Other Source (For Example, Switching Supplies)”, AN06860-0-7/07(0), Analog Devices, 2007, http://www.analog.com/media/en/technical-documentation/application-notes/131351807AN_927.pdf.
8. C.E. Calosso, Y. Gruson and E. Rubiola, “Phase Noise and Amplitude Noise in DDS”, rubiola.org/pdf-articles/conference/2012-ifcs-DDS.pdf. Quoting from this paper, “Interestingly, the spurs are generally not seen at the low resolution of a regular spectrum analyzer, but they show up when observed at the high frequency-resolution usually achieved in phase noise measurements. The sawtooth-like phase error has a long period referred to as the grand repetition rate GRR”.
1. A Technical Tutorial on Digital Signal Synthesis, Analog Devices, 1999, https://www.ieee.li/pdf/essay/dds.pdf.
9
File: DDS GRR Phase Modulation in the PicoPak Clock Measurement Module.doc W.J. Riley
Hamilton Technical Services February 5, 2016