de genes rhythmic genes jtk cycle rhythmic & non-rhythmic ......(a) venn diagram depicting the...
TRANSCRIPT

11,142 1,3921,450
DE genes(n=12,592)
rhythmic genes(n=12,534)
A
Supplemental Figure 1. Comparison of diurnally cycling genes identified with JTK-Cycle and DESeq2.(A) Venn diagram depicting the overlap of genes identified as rhythmic by JTK-Cycle and differentially-expressed (DE) by DESeq2.(B) Heat map depicting the phase distributions of rhythmic genes in clusters c1-c18.(C) Comparison of percent of rhythmic (blue) and non-rhythmic (red) genes identified by JTK-Cycle across the range of observed amplitudes (maximum / mean expression).(D) Comparison of percent of differentially expressed (DE, blue) and non-differentially expressed (non-DE, red) genes across the range of observed amplitudes (maximum / mean expression). Additional data are in Supplemental Data Set 1.
Clu
ster
Phase (lag)Bc1c2c3c4c5c6c7c8c9
c10c11c12c13c14c15c16c17c18
0 1 2 3 4 5 6 7 8 9 10 11 12 13 14 15 16 17 18 19 20 21 22 23
0 10 +5
Percent of cluster genes in phase (lag)
JTK cycle rhythmic & non-rhythmic expressed genes
Perc
ent
0
50
100
1 1.4 1.8 2.2 2.6 3 3.4 3.8 4.2 4.6 5 +max / mean
non-rhythmic
rhythmic
C
JTK cycle rhythmic & non-rhythmic expressed genes
Perc
ent
0
50
100
1 1.4 1.8 2.2 2.6 3 3.4 3.8 4.2 4.6 5 +max / mean
non-DE
DE
D
Supplemental Data. Zones et al. (2015). Plant Cell. 10.1105/tpc.15.00498

Supplemental Figure 2. Expression of rhythmic genes that were identified by DE analysis but not JTK cycle.Expression heat maps of differentially expressed, non-rhythmic genes (light green sector of Venn diagram in Supplemental Figure 1A) from each replicate. Expression of 1,450 genes normalized to the maximum expression for each gene. Relative time, light and dark phases, and cell cycle stages are indicated above. Additional data are in Supplemental Data Set 1.
1,450 genes
Replicate 1 Replicate 2
0 0.5 1
Normalized expression
light dark
G1 S/M G0
light dark
G1 S/M G0
Supplemental Data. Zones et al. (2015). Plant Cell. 10.1105/tpc.15.00498

Supplemental Figure 3. Expression of rhythmic genes that were identified by JTK cycle but not by DE analysis.Expression heat maps of rhythmic, non-differentially expressed genes (pink sector of Venn diagram in Supplemental Figure 1A) from each replicate. Expression of 1,392 genes normalized to the maximum expression for each gene. Relative time, light and dark phases, and cell cycle stages are indicated above. Additional data are in Supplemental Data Set 1.
Replicate 1 Replicate 2
0 0.5 1
Normalized expression 1,392 genes
light dark
G1 S/M G0
light dark
G1 S/M G0
Supplemental Data. Zones et al. (2015). Plant Cell. 10.1105/tpc.15.00498
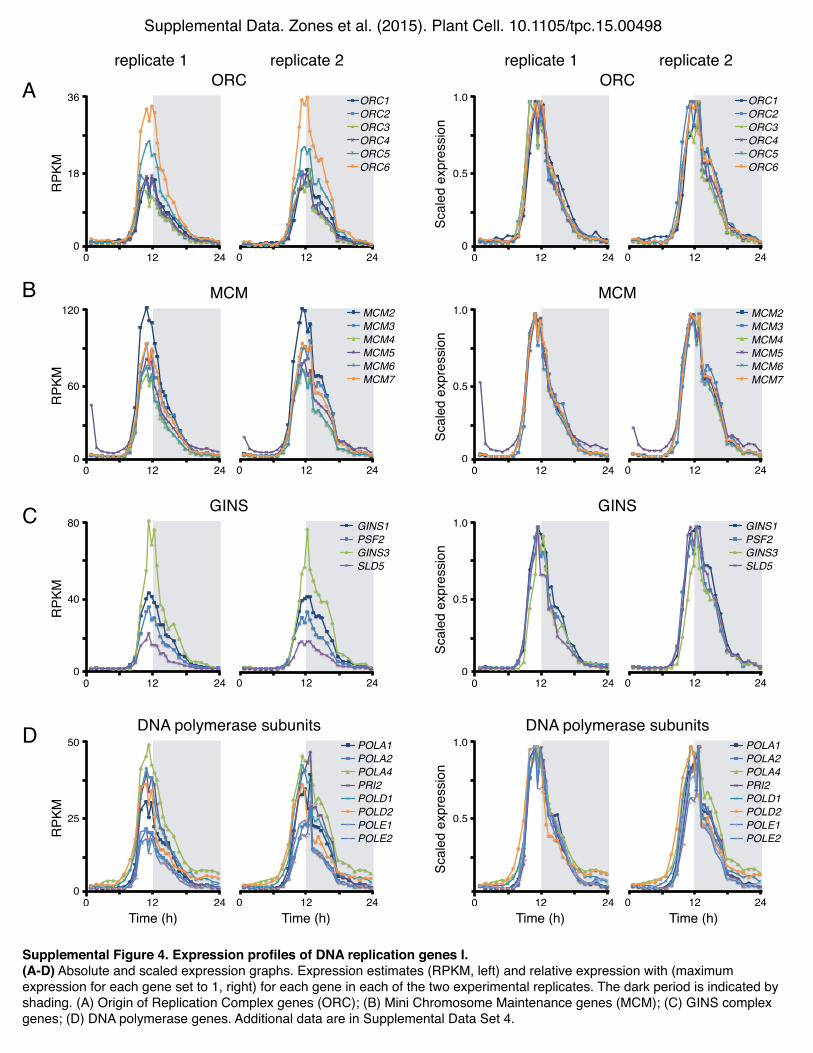
Supplemental Figure 4. Expression profiles of DNA replication genes I.(A-D) Absolute and scaled expression graphs. Expression estimates (RPKM, left) and relative expression with (maximum expression for each gene set to 1, right) for each gene in each of the two experimental replicates. The dark period is indicated by shading. (A) Origin of Replication Complex genes (ORC); (B) Mini Chromosome Maintenance genes (MCM); (C) GINS complex genes; (D) DNA polymerase genes. Additional data are in Supplemental Data Set 4.
Supplemental Data. Zones et al. (2015). Plant Cell. 10.1105/tpc.15.00498
replicate 1 replicate 2 replicate 1 replicate 2
ARP
KM
ORC
0 12 240 12 240
18
36 ORC1ORC2ORC3ORC4ORC5ORC6
0 12 24
ORC1%ORC2%ORC3%ORC4%ORC5%ORC6%
Scal
ed e
xpre
ssio
n
ORC
0 12 240 12 240
0.5
1.0 ORC1ORC2ORC3ORC4ORC5ORC6
0 12 24
ORC1%ORC2%ORC3%ORC4%ORC5%ORC6%
B
RPKM
MCM
0 12 240 12 240
60
120 MCM2MCM3MCM4MCM5MCM6MCM7
0 12 24
MCM2$MCM3$MCM4$MCM5$MCM6$MCM7$
Scal
ed e
xpre
ssio
n
MCM
0 12 240 12 240
0.5
1.0 MCM2MCM3MCM4MCM5MCM6MCM7
0 12 24
MCM2$MCM3$MCM4$MCM5$MCM6$MCM7$
C
RPKM
GINS
0 12 240 12 240
40
80 GINS1PSF2GINS3SLD5
0 12 24
GINS1&PSF2&GINS3&SLD5&
Scal
ed e
xpre
ssio
n
GINS
0 12 240 12 240
0.5
1.0 GINS1PSF2GINS3SLD5
0 12 24
GINS1&PSF2&GINS3&SLD5&
D
Scal
ed e
xpre
ssio
n
DNA polymerase subunits
0 12 240 12 24
0.5
1.0 POLA1POLA2POLA4PRI2POLD1POLD2POLE1POLE2
0 12 24
POLA1&POLA2&POLA4&PRI2&POLD1&POLD2&POLE1&POLE2&RP
KM
DNA polymerase subunits
Time (h)0 12 240 12 24
0
25
50 POLA1POLA2POLA4PRI2POLD1POLD2POLE1POLE2
0 12 24
POLA1&POLA2&POLA4&PRI2&POLD1&POLD2&POLE1&POLE2&
Time (h) Time (h) Time (h)

Supplemental Figure 5. Expression profiles of DNA replication genes II.(A-D) Absolute and scaled expression graphs. Expression estimates (RPKM, left) and relative expression with (maximum expression for each gene set to 1, right) for each gene in each of the two experimental replicates. The dark period is indicated by shading. (A) DNA Replication Factor C complex genes (RFC); (B) Replication Factor A complex genes (RFA); (C) Other DNA replication genes as indicated; (D) Other DNA replication genes as indicated. Additional data are in Supplemental Data Set 4.
Supplemental Data. Zones et al. (2015). Plant Cell. 10.1105/tpc.15.00498
replicate 1 replicate 2 replicate 1 replicate 2
D
RPKM
Other replication genes 2
0 12 240 12 240
35
70 TOP2TOPBP1DNA LigaseDNA2FEN1RNaseH2ARNaseH2A2
0 12 24
TOP2%TOPBP1%DNA%Ligase%DNA2%FEN1%RNaseH2A%RNaseH2A_2%
Scal
ed e
xpre
ssio
n
Other replication genes 2
0 12 240 12 240
0.5
1.0 TOP2TOPBP1DNA LigaseDNA2FEN1RNaseH2ARNaseH2A2
0 12 24
TOP2%TOPBP1%DNA%Ligase%DNA2%FEN1%RNaseH2A%RNaseH2A_2%
C
RPKM
Other replication genes 1
0 12 240 12 240
150
300 CDC45CDC6CDT1PCNAMCM10RIR1RIR2
0 12 24
CDC45%CDC6%CDT1%PCNA%MCM10%RIR1%RIR2%
Scal
ed e
xpre
ssio
n
Other replication genes 1
0 12 240 12 240
0.5
1.0 CDC45CDC6CDT1PCNAMCM10RIR1RIR2
0 12 24
CDC45%CDC6%CDT1%PCNA%MCM10%RIR1%RIR2%
ARP
KMRFC
0 12 240 12 240
40
80 RFC1RFC2RFC3RFC4RFC5
0 12 24
RFC1%RFC2%RFC3%RFC4%RFC5%
Scal
ed e
xpre
ssio
n
RFC
0 12 240 12 240
0.5
1.0 RFC1RFC2RFC3RFC4RFC5
0 12 24
RFC1%RFC2%RFC3%RFC4%RFC5%
B
RPKM
RFA
0 12 240 12 240
60
120 RFA1/RPA70ARFA2/RPA30RFA3/RPA70B
0 12 24
RFA1/RPA70A)RFA2/RPA30)RFA3/RPA70B)
0 12 24
RFA1/RPA70A)RFA2/RPA30)RFA3/RPA70B)
0 12 24
RFA1/RPA70A)RFA2/RPA30)RFA3/RPA70B)
Scal
ed e
xpre
ssio
n
RFA
0 12 240 12 240
0.5
1.0 RFA1/RPA70ARFA2/RPA30RFA3/RPA70B
0 12 24
RFA1/RPA70A)RFA2/RPA30)RFA3/RPA70B)
0 12 24
RFA1/RPA70A)RFA2/RPA30)RFA3/RPA70B)
0 12 24
RFA1/RPA70A)RFA2/RPA30)RFA3/RPA70B)
Time (h) Time (h) Time (h) Time (h)

Supplemental Figure 6. Expression Profiles of SMC genes.(A-D) Absolute and scaled expression graphs. Expression estimates (RPKM, left) and relative expression with (maximum expression for each gene set to 1, right) for each gene in each of the two experimental replicates. The dark period is indicated by shading. (A) Cohesin complex genes; (B) Condensin complex genes; (C) SMC5B/SMC6A complex genes that are coexpressed with Cohesin and Condensin complex genes; (D) SMC5A and SMC6B. Additional data are in Supplemental Data Set 4.
Supplemental Data. Zones et al. (2015). Plant Cell. 10.1105/tpc.15.00498
replicate 1 replicate 2 replicate 1 replicate 2
D
RPK
M
SMC5A/6B
0 12 240 12 240
9
18 SMC5ASMC6B
0! 12! 24!
SMC5A&SMC6B&
Scal
ed e
xpre
ssio
n
SMC5A/6B
0 12 240 12 240
0.5
1.0 SMC5ASMC6B
0! 12! 24!
SMC5A&SMC6B&
C
RPK
M
SMC5B/6A
0 12 240 12 240
15
30
0 12 24
SMC5B&SMC6A&NSE1&NSE4&
SMC5BSMC6ANSE1NSE4
Scal
ed e
xpre
ssio
n
SMC5B/6A
0 12 240 12 240
0.5
1.0
0 12 24
SMC5B&SMC6A&NSE1&NSE4&
SMC5BSMC6ANSE1NSE4
B
RPK
M
Condensin
0 12 240 12 240
30
60
0 12 24
SMC2%SMC4%CAP%D2%
SMC2SMC4CAPD2
Scal
ed e
xpre
ssio
n
Condensin
0 12 240 12 240
0.5
1.0
0 12 24
SMC2%SMC4%CAP%D2%
SMC2SMC4CAPD2
AR
PKM
Cohesin
0 12 240 12 240
15
30 SMC1SMC3DCC1SCC3CTF18CTF8SCC2
0 12 24
SMC1%SMC3%DCC1%SCC3%CTF18%CTF8%SCC2%
Scal
ed e
xpre
ssio
n
Cohesin
0 12 240 12 240
0.5
1.0 SMC1SMC3DCC1SCC3CTF18CTF8SCC2
0 12 24
SMC1%SMC3%DCC1%SCC3%CTF18%CTF8%SCC2%
Time (h) Time (h) Time (h) Time (h)

Supplemental Figure 7. Expression profiles of cell cycle regulatory genes.(A-D) Absolute and scaled expression graphs. Expression estimates (RPKM, left) and relative expression with (maximum expression for each gene set to 1, right) for each gene in each of the two experimental replicates. The dark period is indicated by shading. (A) Retinoblastoma Tumor Suppressor Pathway genes (RB); (B) Cell cycle CDKs and cyclins; (C) Other cell cycle regulatory genes; (D) D type cyclins. Additional data are in Supplemental Data Set 4.
replicate 1 replicate 2 replicate 1 replicate 2
ARP
KM
RB pathway
0 12 240 12 240
20
40 MAT3DP1E2F1E2FR1
0 12 24
MAT3%DP1%E2F1%E2FR1%
Scal
ed e
xpre
ssio
n
RB pathway
0 12 240 12 240
0.5
1.0 MAT3DP1E2F1E2FR1
0 12 24
MAT3%DP1%E2F1%E2FR1%
B
RPKM
Cell cycle CDKs & cyclins
0 12 240 12 240
75
150 CDKA1CDKB1CYCA1CYCB1CYCAB1
0 12 24
CDKA1&CDKB1&CYCA1&CYCB1&CYCAB1&
Scal
ed e
xpre
ssio
n
cell cycle CDKs & cyclins
0 12 240 12 240
0.5
1.0 CDKA1CDKB1CYCA1CYCB1CYCAB1
0 12 24
CDKA1&CDKB1&CYCA1&CYCB1&CYCAB1&
C
RPKM
Other regulators
0 12 240 12 240
60
120 CKS1WEE1ESP1
0 12 24
CKS1%WEE1%ESP1%
Scal
ed e
xpre
ssio
n
Other regulators
0 12 240 12 240
0.5
1.0 CKS1WEE1ESP1
0 12 24
CKS1%WEE1%ESP1%
D
RPKM
D cyclins
0 12 240 12 240
60
120 CYCD1CYCD2CYCD3CYCD4
0 12 24
CYCD1%CYCD2%CYCD3%CYCD4%
Scal
ed e
xpre
ssio
n
D cyclins
0 12 240 12 240
0.5
1.0 CYCD1CYCD2CYCD3CYCD4
0 12 24
CYCD1%CYCD2%CYCD3%CYCD4%
Supplemental Data. Zones et al. (2015). Plant Cell. 10.1105/tpc.15.00498
Time (h) Time (h) Time (h) Time (h)

replicate 1 replicate 2 replicate 1 replicate 2R
PKM
RDP
0 12 240 12 240
18
36
Scal
ed e
xpre
ssio
n
RDP
0 12 240 12 240
0.5
1.0RDP1RDP2RDP3RDP4RDP5
0 12 24
RDP1%RDP2%RDP3%RDP4%RDP5%
RDP1RDP2RDP3RDP4RDP5
0 12 24
RDP1%RDP2%RDP3%RDP4%RDP5%
Supplemental Figure 8. Expression profiles of RDP genes.Absolute and scaled expression graphs. Expression estimates (RPKM, left) and relative expression with (maximum expression for each gene set to 1, right) for each gene in each of the two experimental replicates. The dark period is indicated by shading. Rhodanese domain phosphatase (RDP) genes are related to the cell cycle regulatory phosphatase CDC25 (Bisová et al., 2005). None of the RDP genes show an expression pattern similar to other cell cycle regulatory genes including WEE1 (Supplemental Figure 7C), a homolog of the kinase whose activity is opposed by CDC25 in fungi and metazoans. Additional data are in Supplemental Data Set 4.
Supplemental Data. Zones et al. (2015). Plant Cell. 10.1105/tpc.15.00498
Time (h) Time (h) Time (h) Time (h)

Supplemental Figure 9. Expression profiles of Anaphase Promoting Complex / Cyclosome (APC/C) genes.(A-B) Absolute and scaled expression graphs. Expression estimates (RPKM, left) and relative expression with (maximum expression for each gene set to 1, right) for each gene in each of the two experimental replicates. The dark period is indicated by shading. (A) APC genes; (B) Averaged expression of APC genes and APC regulatory genes CDC20 and CDH1. Additional data are in Supplementary Data Set 4.
replicate 1 replicate 2 replicate 1 replicate 2A
RPK
M
0 12 240 12 240
18
36
Scal
ed e
xpre
ssio
n
0 12 240 12 240
0.5
1.0
0 12 24
APC1APC2APC3/CDC27APC4APC5APC6APC8APC10APC11APC13
APC1APC2APC3/CDC27APC4APC5APC6APC8APC10APC11APC13
0 12 24
APC1APC2APC3/CDC27APC4APC5APC6APC8APC10APC11APC13
APC1APC2APC3/CDC27APC4APC5APC6APC8APC10APC11APC13
RPK
M
0 12 240 12 240
60
120
Scal
ed e
xpre
ssio
n0 12 240 12 24
0
0.5
1.0B
0 12 24
APC_av'CDC20'CDH1'
APC (av)CDC20CDH1
0 12 24
APC_av'CDC20'CDH1'
APC (av)CDC20CDH1
Supplemental Data. Zones et al. (2015). Plant Cell. 10.1105/tpc.15.00498
Time (h) Time (h) Time (h) Time (h)

Supplemental Figure 10. Expression profiles of chloroplast division genes.(A-C) Absolute and scaled expression graphs. Expression estimates (RPKM, left) and relative expression with (maximum expression for each gene set to 1, right) for each gene in each of the two experimental replicates. The dark period is indicated by shading; (A) FTSZ genes; (B) MIN genes; (C) Dynamin-related GTPase genes (DRPs). Additional data are in Supplemental Data Set 4.
replicate 1 replicate 2 replicate 1 replicate 2
AR
PKM
FTSZ
0 12 240 12 240
80
160
Scal
ed e
xpre
ssio
n
FTSZ
0 12 240 12 240
0.5
1.0FTSZ1FTSZ2
0 12 24
FTSZ1&FTSZ2&
FTSZ1FTSZ2
0 12 24
FTSZ1&FTSZ2&
RPK
M
MIN
0 12 240 12 240
120
240
Scal
ed e
xpre
ssio
n
MIN
0 12 240 12 240
0.5
1.0B
MIND1MINE1MINE2
0 12 24
MIND1&MINE1&MINE2&
MIND1MINE1MINE2
0 12 24
MIND1&MINE1&MINE2&
RPK
M
Dynamic-related GTPases
0 12 240 12 240
40
80
Scal
ed e
xpre
ssio
n
Dynamic-Related GTPases
0 12 240 12 240
0.5
1.0C ARCS/DRP5BARC6ARC6-like
0 12 24
ARCS/DRP5B*ARC6*ARC6,like*
ARCS/DRP5BARC6ARC6-like
0 12 24
ARCS/DRP5B*ARC6*ARC6,like*
Supplemental Data. Zones et al. (2015). Plant Cell. 10.1105/tpc.15.00498
Time (h) Time (h) Time (h) Time (h)

Supplemental Figure 11. Cell cycle gene resampling statistics.(A) Table of cluster membership. The number of genes in each cluster (c1-c18) and un-clustered expressed genes (U) are shown for all expressed genes (Supplemental Data Set 1), annotated cell cycle genes from Supplemental Data Set 4, and DIV or GEX genes from Supplemental Data Set 5.(B-D) Resampling statistics for indicated gene sets. The observed versus expected (“Resample” columns) cluster membership distribution was examined for (B) cell cycle genes, (C) DIV genes, and (D) GEX genes. Clusters with significantly enriched membership from each of the three groups are boxed in blue. Mean, standard deviation (sd), significance (z-score, p-value), and false discovery rate (FDR) are shown for each cluster (c1-c18) and un-clustered expressed genes (U).
A Cluster membershipc1 c2 c3 c4 c5 c6 c7 c8 c9 c10 c11 c12 c13 c14 c15 c16 c17 c18 U Ʃ
Expressed Genes 472 434 250 595 406 488 629 1050 645 1035 1071 899 859 846 1044 769 796 304 2179 14771Cell Cycle 0 0 0 1 0 2 2 7 2 76 12 0 1 1 0 2 0 0 2 108
All DIV 0 2 0 0 1 0 2 4 1 23 1 0 1 0 0 0 0 0 2 37All GEX 3 2 0 0 0 0 2 2 0 1 0 0 1 0 0 1 0 0 3 15
Cluster Observed Resample (mean)
Resample (sd) z-score p-value FDR
c1 0 3.4 1.8 -1.9 0.058 0.14c2 0 3.2 1.8 -1.8 0.069 0.15c3 0 1.8 1.4 -1.4 0.18 0.22c4 1 4.4 2.0 -1.7 0.094 0.16c5 0 3.0 1.7 -1.8 0.081 0.15c6 2 3.6 1.9 -0.85 0.40 0.42c7 2 4.6 2.1 -1.3 0.21 0.24c8 7 7.7 2.7 -0.24 0.81 0.81c9 2 4.7 2.1 -1.3 0.20 0.24
c10 76 7.5 2.6 26 5.1E-152 9.7E-151c11 12 7.9 2.6 1.6 0.12 0.18c12 0 6.6 2.5 -2.7 8.04E-03 0.038c13 1 6.3 2.4 -2.2 0.029 0.082c14 1 6.2 2.4 -2.2 0.030 0.082c15 0 7.6 2.7 -2.9 4.4E-03 0.028c16 2 5.6 2.3 -1.6 0.12 0.18c17 0 5.8 2.3 -2.5 0.012 0.047c18 0 2.2 1.5 -1.5 0.13 0.18
U 2 16 3.7 -3.8 1.4E-04 1.3E-03
B Cell cycle genes resampling
Cluster Observed Resample (mean)
Resample (sd) z-score p-value FDR
c1 3 0.47 0.67 3.8 1.7E-04 3.3E-03c2 2 0.44 0.65 2.4 0.016 0.15c3 0 0.26 0.50 -0.51 0.61 0.72c4 0 0.59 0.76 -0.78 0.44 0.72c5 0 0.41 0.63 -0.65 0.52 0.72c6 0 0.50 0.70 -0.71 0.48 0.72c7 2 0.64 0.79 1.7 0.086 0.54c8 2 1.1 0.98 0.96 0.34 0.72c9 0 0.66 0.78 -0.84 0.40 0.72
c10 1 1.1 0.98 -0.06 0.95 0.95c11 0 1.1 1.0 -1.09 0.28 0.72c12 0 0.93 0.94 -0.98 0.33 0.72c13 1 0.88 0.91 0.13 0.90 0.95c14 0 0.85 0.90 -0.95 0.34 0.72c15 0 1.1 0.99 -1.1 0.28 0.72c16 1 0.79 0.85 0.25 0.80 0.90c17 0 0.81 0.88 -0.93 0.35 0.72c18 0 0.31 0.55 -0.56 0.57 0.72
U 3 2.2 1.4 0.58 0.56 0.72
D Tulin & Cross 2014, GEX genes resampling
Cluster Observed Resample (mean)
Resample (sd) z-score p-value FDR
c1 0 1.2 1.1 -1.1 0.26 0.50c2 2 1.1 1.0 0.88 0.38 0.51c3 0 0.62 0.78 -0.8 0.43 0.51c4 0 1.5 1.2 -1.2 0.21 0.50c5 1 1.0 1.0 -0.030 0.98 0.98c6 0 1.2 1.1 -1.1 0.26 0.50c7 2 1.6 1.2 0.35 0.73 0.77c8 4 2.6 1.6 0.88 0.38 0.51c9 1 1.6 1.2 -0.50 0.62 0.69
c10 23 2.6 1.6 13 1.2E-38 2.3E-37c11 1 2.7 1.6 -1.1 0.29 0.50c12 0 2.3 1.5 -1.6 0.12 0.40c13 1 2.1 1.4 -0.81 0.42 0.51c14 0 2.1 1.4 -1.5 0.13 0.40c15 0 2.6 1.6 -1.7 0.097 0.40c16 0 1.9 1.3 -1.4 0.15 0.40c17 0 2.0 1.4 -1.5 0.15 0.40c18 0 0.76 0.86 -0.88 0.38 0.51
U 2 5.5 2.2 -1.6 0.11 0.40
C Tulin & Cross 2014, DIV genes resampling
Supplemental Data. Zones et al. (2015). Plant Cell. 10.1105/tpc.15.00498

light dark
G1 S/M G0
DIV
Cluster Locus ID (v5.5)
Gene Symbol
Gene Name (Tulin & Cross 2014)
2 Cre09.g40605 CTP Synthase2 Cre09.g40047 PI4P-5K5 Cre01.g03935 P450-reductase7 Cre06.g27350 ATAPY17 Cre12.g51360 SGT1A8 Cre01.g05085 BSL18 Cre05.g23360 CDKD1;28 Cre10.g42725 PRF5 (profilin)8 Cre15.g63630 TFC-B9 Cre01.g05520 CPL7 GIF310 Cre01.g00925 TOPII10 Cre01.g01525 POLD-cat / EMB278010 Cre01.g01745 POLA2 POLA210 Cre02.g08665 SMC210 Cre04.g21435 POLA1 / ICU210 Cre06.g27025 CDC4510 Cre06.g29300 Primase-L10 Cre07.g31235 POLA3,4/Primase-S10 Cre08.g37255 CDKB1 CDKB1;210 Cre08.g37405 POLD210 Cre10.g46590 CDKA1 CDKA;110 Cre12.g49105 RIR2 RNR210 Cre12.g49295 RIR1 RNR110 Cre12.g51590 TOPBP110 Cre13.g56295 APC6 APC610 Cre10.g45560 ORC1B10 Cre17.g74051 CDC27b11 Cre01.g02920 ESP110 Cre03.g19080 Thym.kinase / ZEU110 Cre04.g22070 AURORA10 Cre07.g34170 MPS110 Cre12.g52550 SPC97_98/GCP210 Cre15.g63470 RECQ410 Cre17.g71590 THY2 thym. synthetase13 Cre09.g39666 DUO3- Cre02.g09511 TFC-E- Cre09.g39865 CACTIN
37 genes
GEX
Cluster Locus ID (v5.5)
Gene Symbol
Gene Name (Tulin & Cross 2014)
1 Cre01.g01920 NOP521 Cre09.g39855 CDC48C1 Cre06.g27825 SRPK42 Cre04.g21230 RAG1 / KAPP 2 Cre06.g27915 Asp-AARS7 Cre02.g07955 DRP2 DRP2B7 Cre16.g67700 HSP70E HSP918 Cre10.g43915 RPT5A8 Cre03.g19975 ORP3A8 Cre08.g37305 ACC210 Cre13.g5618013 Cre13.g58350 TAF216 Cre06.g29050 PI3K-p150 subunit- Cre12.g51075 MED27- Cre01.g04623 SNF2
15 genes
Supplemental Figure 12. Expression patterns of DIV and GEX genes.Heat maps with DIV (top) and GEX (bottom) gene expression patterns with maximum expression for each gene set to 1. Relative time, light and dark phases, and cell cycle stages are indicated above. Cluster membership, gene locus, gene symbol, and gene name from (Tulin and Cross 2014) are presented to the right of heat maps. Shaded genes encode homologs of known cell cycle regulators. Additional data are in Supplemental Data Set 5.
Supplemental Data. Zones et al. (2015). Plant Cell. 10.1105/tpc.15.00498

Supplemental Figure 13. Resorption and reformation of flagella during the cell cycle.The fraction of cells with flagella is plotted together with mitotic index from samples of between 100 and 250 cells per time point. Post-mitotic detection of flagella in the later time points (12-24 hours) was dependent upon daughter cells hatching, and therefore provides an upper estimate for the time of flagella reformation (which necessarily precedes hatching).
12 2400
50
100
Time (h)
Perc
ent fl
agel
late
d
0
50
100
Percent mitotic
replicate 1 replicate 2
Supplemental Data. Zones et al. (2015). Plant Cell. 10.1105/tpc.15.00498

A Cluster membership
1 2 3 4 5 6 7 8 9 10 11 12 13 14 15 16 17 18 U Ʃ
Expressed genes 472 434 250 595 406 488 629 1050 645 1035 1071 899 859 846 1044 769 796 304 2179 14771
Core flagellar/basal body genes 0 2 0 0 1 0 1 5 1 7 39 83 19 21 2 8 0 0 3 192
Cluster Observed Resample (mean)
Resample (sd) z-score p-value FDR
c1 0 6.2 2.4 -2.5 0.012 0.021c2 2 5.7 2.3 -1.6 0.11 0.12c3 0 3.3 1.8 -1.8 0.067 0.075c4 0 7.8 2.7 -2.9 4.0E-03 0.011c5 1 5.3 2.3 -1.9 0.057 0.073c6 0 6.4 2.5 -2.5 0.012 0.021c7 1 8.2 2.8 -2.6 9.7E-03 0.021c8 5 14 3.5 -2.5 0.014 0.021c9 1 8.4 2.8 -2.6 0.008 0.020
c10 7 14 3.5 -1.9 0.065 0.075c11 39 14 3.6 7.0 2.2E-12 2.1E-11c12 83 12 3.3 22 5.5E-105 1.1E-103c13 19 11 3.2 2.4 0.015 0.021c14 21 11 3.2 3.1 1.8E-03 5.7E-03c15 2 14 3.6 -3.3 1.0E-03 3.8E-03c16 8 10 3.1 -0.66 0.51 0.51c17 0 10 3.1 -3.4 7.4E-04 3.5E-03c18 0 3.9 1.9 -2.0 0.043 0.058
U 4 28 4.9 -5.0 5.7E-07 3.6E-06
B Core flagellar/basal body genes resampling
Flagella clusters Other p-value
All expressed genes 3675 11096 -
Flagellar proteome (2+ peptides) 351 254 1.0E-63
Deflagellation response 666 1093 1.2E-29
CiliaCut 117 63 4.5E-57
Core flagellar/basal body genes 162 30 3.0E-66
C Contingency table & Fisher’s ExactTest comparing flagellar gene groups(c11-14) vs other
E Fisher’s Exact Tests for (D)BUG POC Basal body
Axoneme 0.026 3.6E-08 1.2E-06Basal body 8.2E-05 0.76
POC 9.4E-05
11 12 13 14 OtherAxoneme 8 45 16 7 15
Basal body 12 1 2 0 3POC 13 1 0 0 4BUG 7 20 0 2 5
D Contingency table relating clustermembership within flagella cluster group(c11-14) & other clusters in indicated coreflagellar/basal body gene groups
Supplemental Figure 14. Flagellar and basal body gene cluster membership statistics.(A) Table of flagella/basal body gene cluster membership. The number of genes in each cluster (c1-c18) and un-clustered expressed genes (U) are in the first row (Supplemental Data Set 1) and core flagellar/basal body genes in the second row (Supplemental Data Set 6).(B) Resampling statistics for indicated gene sets. Clusters with significantly enriched membership of core flagella/basal body genes are boxed in blue. Mean, standard deviation (sd), significance (z-score, p-value), and false discovery rate (FDR) are shown for each cluster (c1-c18) and un-clustered expressed genes (U).(C) Enrichment test of flagella/basal body genes in clusters c11-c14. Contingency table (left of dashed line) and Fisher’s Exact Test p-values (right of dashed line) comparing cluster membership of flagellar gene groups (FAP genes, deflagellation response genes, CiliaCut genes, and core flagellar/basal body genes) (Supplemental Data Set 7) with a background distribution (all expressed genes) (Supplemental Data Set 1). Genes were classified either as flagellar cluster group members (c11-c14) or members of other gene groups (all other clusters and non-clustered genes).(D-E) Comparison of core flagella and basal body gene subgroup cluster membership distributions to POC and BUG gene cluster membership distributions. (D) Contingency table and (E) Fisher’s Exact Test p-values for cluster membership distribution of core axonemal genes, BUG genes, POC genes, and core basal body genes (Supplemental Data Set 6).
Supplemental Data. Zones et al. (2015). Plant Cell. 10.1105/tpc.15.00498
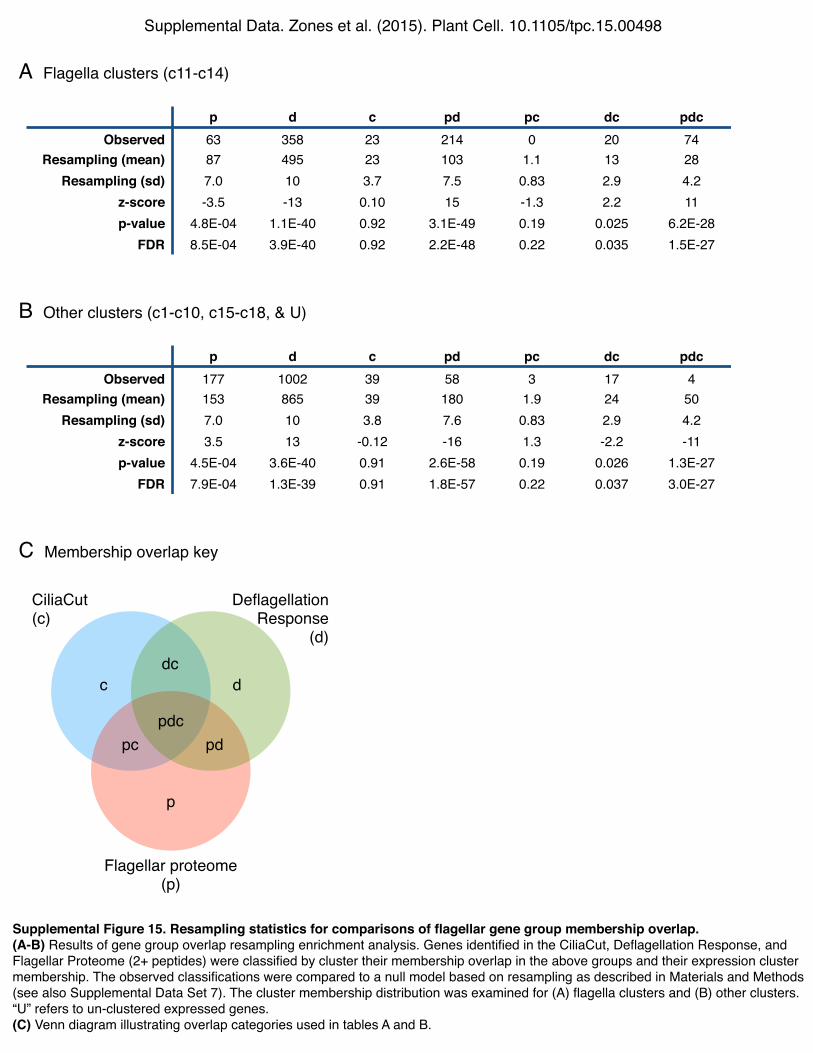
p d c pd pc dc pdcObserved 177 1002 39 58 3 17 4
Resampling (mean) 153 865 39 180 1.9 24 50Resampling (sd) 7.0 10 3.8 7.6 0.83 2.9 4.2
z-score 3.5 13 -0.12 -16 1.3 -2.2 -11p-value 4.5E-04 3.6E-40 0.91 2.6E-58 0.19 0.026 1.3E-27
FDR 7.9E-04 1.3E-39 0.91 1.8E-57 0.22 0.037 3.0E-27
B Other clusters (c1-c10, c15-c18, & U)
p d c pd pc dc pdcObserved 63 358 23 214 0 20 74
Resampling (mean) 87 495 23 103 1.1 13 28Resampling (sd) 7.0 10 3.7 7.5 0.83 2.9 4.2
z-score -3.5 -13 0.10 15 -1.3 2.2 11p-value 4.8E-04 1.1E-40 0.92 3.1E-49 0.19 0.025 6.2E-28
FDR 8.5E-04 3.9E-40 0.92 2.2E-48 0.22 0.035 1.5E-27
A Flagella clusters (c11-c14)
Flagellar proteome(p)
DeflagellationResponse
(d)
c d
pdc
p
dc
pdpc
CiliaCut(c)
C Membership overlap key
Supplemental Figure 15. Resampling statistics for comparisons of flagellar gene group membership overlap.(A-B) Results of gene group overlap resampling enrichment analysis. Genes identified in the CiliaCut, Deflagellation Response, and Flagellar Proteome (2+ peptides) were classified by cluster their membership overlap in the above groups and their expression cluster membership. The observed classifications were compared to a null model based on resampling as described in Materials and Methods (see also Supplemental Data Set 7). The cluster membership distribution was examined for (A) flagella clusters and (B) other clusters. “U” refers to un-clustered expressed genes.(C) Venn diagram illustrating overlap categories used in tables A and B.
Supplemental Data. Zones et al. (2015). Plant Cell. 10.1105/tpc.15.00498

cytoSum(
chloroSum(
mitoSum(
12 2400
10
20
30
40
50
Time (h)
Perc
ent o
f tot
al R
PKM
cytoSum(
chloroSum(
mitoSum(
CytosolcytoSum(
chloroSum(
mitoSum(
ChloroplastcytoSum(
chloroSum(
mitoSum(Mitochondria
Supplemental Figure 16. Ribosomal protein gene transcript contribution to the transcriptome.Total RPKMs for each group of RPGs (cytosol, chloroplast, mitochondria) were plotted as a fraction of total RPKMs at each time point. Additional data are in Supplemental Data Set 8.
Supplemental Data. Zones et al. (2015). Plant Cell. 10.1105/tpc.15.00498

Supplemental Data. Zones et al. (2015). Plant Cell. 10.1105/tpc.15.00498
Supplemental Figure 17. Expression profiles of nuclear genes encoding subunits of photosynthetic complexes.(A-I) Expression estimates (RPKM) for each gene in each of the two experimental replicates for indicated complexes. The dark period is indicated by gray shading. (A) light harvesting complex II; (B) light harvesting complex I; (C) photosystem II; (D) photosystem I; (E) b6f complex; (F) plastid ATPase. The experimental replicate average mRNA abundance for known and putative assembly factors associated with PSII, PSI and b6f are shown in (G) (H) and (I) respectively in red, with the average expression profile of each gene constituting the complex in green. Additional data and complete protein names are in Supplemental Data Set 9.
0 8 16 24 0 8 16 24
0 8 16 24 0 8 16 240 8 16 24 0 8 16 24
0 8 16 24 0 8 16 24
0 8 16 240 8 16 240 8 16 24 0 8 16 24
6
4.5
3
0
3
2
0
2
0
3
1
20
0
10
0
2
0
3
1
4
LHCBM1LHCBM2LHCBM3LHCBM4LHCBM5LHCBM6LHCBM7LHCBM8LHCBM9
PSBP1PSBPQPSBOPSBXPSBRPSBY
PETCPETMPETNPETO
ATPCATPDATPG
PSADPSAEPSAFPSAGPSAHPSAIPSAKPSALPSANPSAO
LHCA1LHCA2LHCA3
LHCA9LHCA8LHCA7LHCA6LHCA5LHCA4
RPK
M (x
1000
)R
PKM
(x10
00)
RPK
M (x
1000
)
A
C
E
B
D
F
replicate 1 replicate 1replicate 2 replicate 2
G I
11.5
1
2
0 84 12 16 200
0.5
1
24
PSII averageTBA1MBB1MBD1TBC2LTO1Cre06.g272700REP27
0 84 12 16 20 240
0.5
1 PSI averageCGL71
0 84 12 16 200
0.5
1
24
b6f averageCCB1CCB2CCB2CCB3CCB4CCS1CCS2CCS5
Time (h)
norm
aliz
ed g
ene
expr
essi
on
Supplemental Figure 17.Expression profiles of nuclear genes encoding subunits of photosynthetic complexes. (A-I) Expression estimates (RPKM) for each gene in each of the two experimental replicates. The dark period is indicated by gray shading. Complexes are shown: (A) light harvesting complex II; (B) light harvesting complex I; (C) photosystem II; (D) photosystem I; (E) b6f complex; (F) plastid ATPase. The experi-mental replicate average mRNA abundance for known and putative assembly factors associated with PSII, PSI and b6f are shown in (G) (H) and (I) respectively in red, the average expression profile of each gene constituting the complex is shown in green. The mRNA abundance of ALB3.1 and ALB3.2, two LHC assem-bly factors (Göhre et al. 2006; Bellafiore 2002), peak at and just prior to the maxima of LHCII subunits respectively. Similarly, peak transcript abundance of CGL71, orthologous to Arabidopsis PYG7, a PSI assembly factor, precedes maximal abundance of that subunit. Conversely, the abundances of cytochrome b6f assembly factor transcripts CCB1-CCS4 (Lezhneva et al. 2008; Kuras et al. 1997) and CCS1,CCS2 and CCS5 were also elevated (Xie et al. 1998; Inoue et al. 1997; Gabilly et al. 2010) in the dark period. Additional data and complete protein names are in Supplementary Data Set 9.
Time (h) Time (h)
Time (h) Time (h) Time (h) Time (h)H
0 8 16 24 0 8 16 24
0 8 16 24 0 8 16 240 8 16 24 0 8 16 24
0 8 16 24 0 8 16 24
0 8 16 240 8 16 240 8 16 24 0 8 16 24
6
4.5
3
0
3
2
0
2
0
3
1
20
0
10
0
2
0
3
1
4
LHCBM1LHCBM2LHCBM3LHCBM4LHCBM5LHCBM6LHCBM7LHCBM8LHCBM9
PSBP1PSBPQPSBOPSBXPSBRPSBY
PETCPETMPETNPETO
ATPCATPDATPG
PSADPSAEPSAFPSAGPSAHPSAIPSAKPSALPSANPSAO
LHCA1LHCA2LHCA3
LHCA9LHCA8LHCA7LHCA6LHCA5LHCA4
RPK
M (x
1000
)R
PKM
(x10
00)
RPK
M (x
1000
)
A
C
E
B
D
F
replicate 1 replicate 1replicate 2 replicate 2
G H I
11.5
1
2
0 84 12 16 200
0.5
1
24
PSII averageTBA1MBB1MBD1TBC2LTO1Cre06.g272700REP27
0 84 12 16 20 240
0.5
1 PSI averageCGL71
0 84 12 16 200
0.5
1
24
b6f averageCCB1CCB2CCB2CCB3CCB4CCS1CCS2CCS5
Time (h)
norm
aliz
ed g
ene
expr
essi
on
Figure S17.Expression profiles of nuclear genes encoding subunits of photosynthetic complexes. Expression estimates (RPKM) for each gene in each of the two experimental replicates. The dark period is indicated by gray shading. Complexes are shown: (A) light harvesting complex II; (B) light harvesting com-plex I; (C) photosystem II; (D) photosystem I; (E) b6f complex; (F) plastid ATPase. The experimental replicate average mRNA abundance for known and putative assembly factors associated with PSII, PSI and b6f are shown in (G) (H) and (I) respectively in red, with the average expression profile of each gene constituting the complex in green.
Time (h) Time (h)
Time (h) Time (h) Time (h) Time (h)
Supplemental Data. Zones et al. (2015). Plant Cell. 10.1105/tpc.15.00498
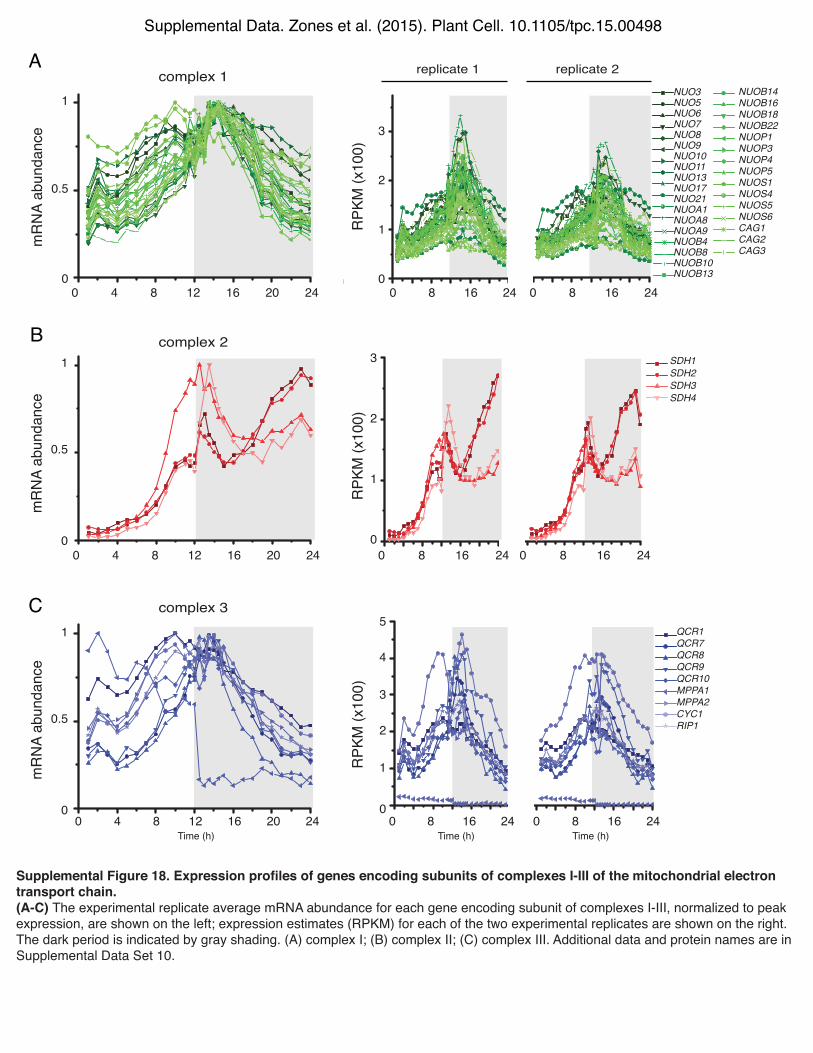
Supplemental Figure 18. Expression profiles of genes encoding subunits of complexes I-III of the mitochondrial electron transport chain.(A-C) The experimental replicate average mRNA abundance for each gene encoding subunit of complexes I-III, normalized to peak expression, are shown on the left; expression estimates (RPKM) for each of the two experimental replicates are shown on the right. The dark period is indicated by gray shading. (A) complex I; (B) complex II; (C) complex III. Additional data and protein names are in Supplemental Data Set 10.
0 84 12 16 20 24 0 8 16 240 8 16 240
0.5
1
mR
NA
abun
danc
e
SDH1SDH2SDH3SDH4
RPK
M (x
100)
3
2
1
0
B
0 84 12 16 20 24 0 8 16 240 8 16 240
0.5
1
mR
NA
abun
danc
e
QCR1QCR7QCR8QCR9QCR10MPPA1MPPA2CYC1RIP1
RPK
M (x
100)
0
5
3
1
C
replicate 1 replicate 2
0 84 12 16 20 24 0 8 16 240 8 16 240
0.5
1
mR
NA
abun
danc
e
RPK
M (x
100)
0
1
2
3
ANUO3NUO5NUO6NUO7NUO8NUO9NUO10NUO11NUO13NUO17NUO21NUOA1NUOA8NUOA9NUOB4NUOB8NUOB10NUOB13
NUOB14NUOB16NUOB18NUOB22NUOP1NUOP3NUOP4NUOP5NUOS1NUOS4NUOS5NUOS6CAG1CAG2CAG3
complex 1
complex 2
complex 3
2
4
Supplemental Figure 18. Expression profiles of genes encoding subunits of complexes I-III of the mitochondrial electron transport chain. (A-C) The experimental replicate average mRNA abundance for each gene encoding subunits of com-plexes I-III, normalized to peak expression, are shown on the left; expression estimates (RPKM) for each of the two experimental replicates are shown on the right. The dark period is indicated by gray shading. (A) complex I; (B) complex II; (C) complex III. Additional data and encoded protein names are inSupplementary Data Set 10.
Time (h) Time (h) Time (h)
Supplemental Data. Zones et al. (2015). Plant Cell. 10.1105/tpc.15.00498
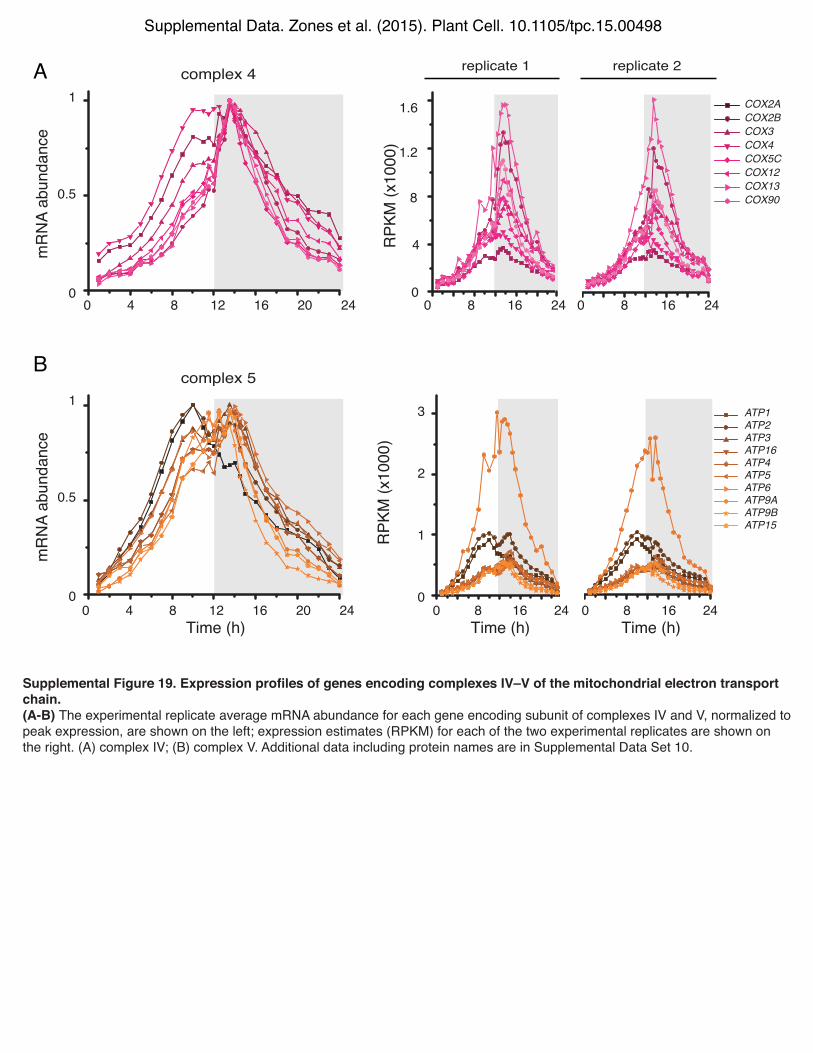
Supplemental Figure 19. Expression profiles of genes encoding complexes IV–V of the mitochondrial electron transport chain. (A-B) The experimental replicate average mRNA abundance for each gene encoding subunit of complexes IV and V, normalized to peak expression, are shown on the left; expression estimates (RPKM) for each of the two experimental replicates are shown on the right. (A) complex IV; (B) complex V. Additional data including protein names are in Supplemental Data Set 10.
0
0.5
1
mR
NA
abun
danc
e
0 84 12 16 20 24 0 8 16 240 8 16 24
3
2
1
0
RPK
M (x
1000
)ATP1ATP2ATP3ATP16ATP4ATP5ATP6ATP9AATP9BATP15
B
replicate 1 replicate 2
0 84 12 16 20 24 0 8 16 240 8 16 240
0.5
1
mR
NA
abun
danc
e
RPK
M (x
1000
)
A1.6
1.2
8
4
0
Time (h) Time (h) Time (h)
COX2ACOX2BCOX3COX4COX5CCOX12COX13COX90
complex 4
complex 5
Supplemental Figure 19. Expression profiles of genes encoding complexes IV–V of the mito-chondrial electron transport chain. (A-B) The experimental replicate average mRNA abundance for each gene encoding subunits of com-plexes IV and V, normalized to peak expression, are shown on the left; expression estimates (RPKM) for each of the two experimental replicates are shown on the right. (A) complex IV; (B) complex V. Addi-tional data including encoded protein names are in Supplementary Data Set 10.
Supplemental Data. Zones et al. (2015). Plant Cell. 10.1105/tpc.15.00498
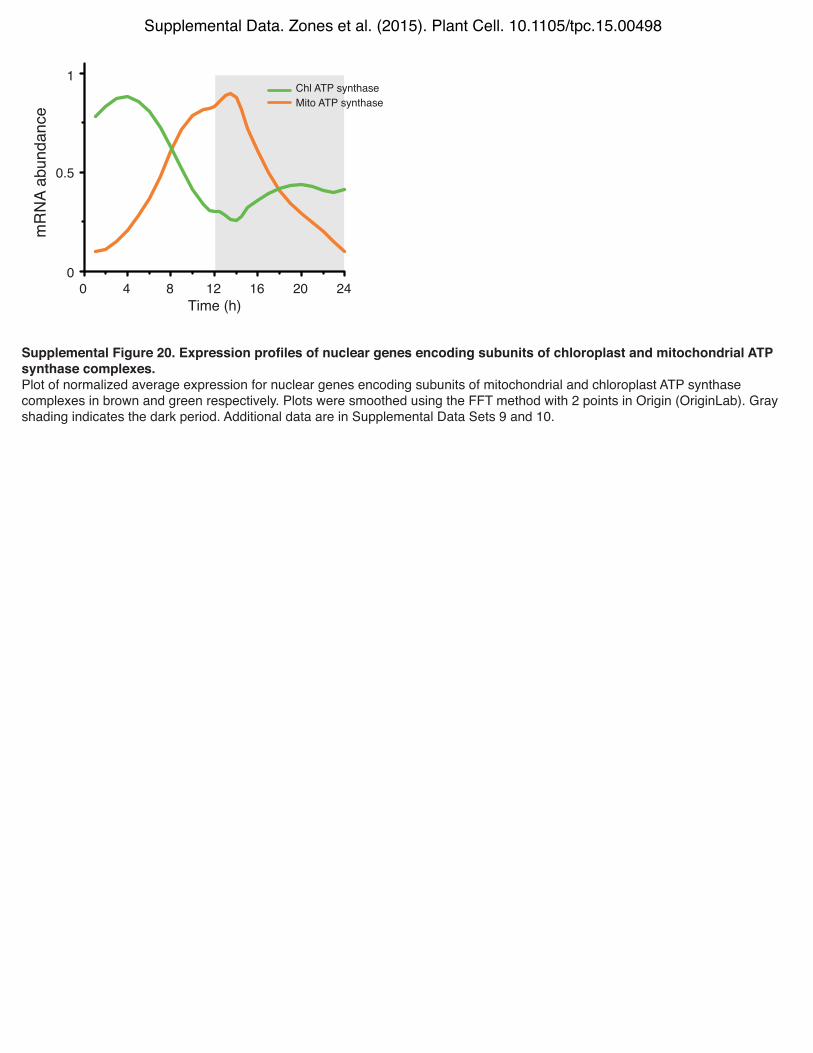
Supplemental Figure 20. Expression profiles of nuclear genes encoding subunits of chloroplast and mitochondrial ATP synthase complexes.Plot of normalized average expression for nuclear genes encoding subunits of mitochondrial and chloroplast ATP synthase complexes in brown and green respectively. Plots were smoothed using the FFT method with 2 points in Origin (OriginLab). Gray shading indicates the dark period. Additional data are in Supplemental Data Sets 9 and 10.
0 84 12 16 20 240
0.5
1
mRN
A ab
unda
nce
Chl ATP synthaseMito ATP synthase
Supplemental Figure 20. Expression profiles of nuclear genes encoding subunits of chloroplast and mitochondrial ATP synthase complexes. Plot of normalized average expression profiles for nuclear genes encoding subunits of the mitochondrial and chloroplast ATP synthase complex in brown and green respectively. Plots were smoothed using the FFT method of signal processing with 2 points in Origin (OriginLab). Shading indicates the dark period. Additional data are in Supplementary Data Sets 9 and 10.
Time (h)

Supplemental Data. Zones et al. (2015). Plant Cell. 10.1105/tpc.15.00498
Supplemental Figure 21. Expression profiles of genes encoding enzymes of tetrapyrrole metabolism.(A) Sequential steps leading rom glutamate to heme and chlorophyll are diagrammed gene name(s) for the enzyme catalyzing each step shown in bold next to each arrow. Chlorophyll and heme derive from a common biosynthetic pathway that branches at protoporphyrin IX which can be converted directly to heme by ferrochelatase or that can continue in the chlorophyll pathway through conversion to Mg-protoporphyrin IX (Lohr et al. 2005). Dedicated pathway branches are color-coded: protoporphyrin IX is shown in pink, heme in purple, chlorophyll in green and chlorophyll catabolism in black. For clarity, the phytochromobilin and siroheme branches are omitted. (B) Plot of normalized average expression for each group of genes color-coded by pathway branch shown in panel (A). Plots were smoothed using the FFT method with 2 points in Origin (OriginLab). The dark period is indicated by gray shading. Additional data are in Supplemental Data Set 11.
glutamate
glutamyl-tRNA
glutamate-1-semialdehyde
5-aminolevulinic acid
porphobilinogen
hydroxymethylbilane
uroporphyrinogen III
coproporphyrinogen III
protoporphyrinogen IX
protoporphyrin IX
heme
Mg-protoporphyrin IX Mg-protoporphyrin IX-MME
divinyl-protochlorophyllide a
divinyl-chlorophyllide a
chlorophyllide a
chlorophylll a
chlorophyllide b
chlorophylll b
GTS1,2
GTR1
GSA1
ALAD1
PBGD1
UROS1
UROD1,2,3
CPX1
PPX1
HEM15
CTH1
POR1
DVR1
CHLG1CHLG1
CHLD
1CH
LH1
CHLH
2CH
LI1
CHLI
2
CHLM
1
CAO
1
CHL1
A
0
0.5
1
0 84 12 16 20
B
mRN
A ab
unda
nce
Time (h)24
Supplemental Figure 21. Expression profiles of genes encoding enzymes of tetrapyrrole metabolism. (A) Enzymes catalyzing each step of the pathway are indicated with gene names beside each arrow. Chlorophyll and heme derive from a common biosynthetic pathway that branches at protoporphyrin IX which can be converted directly to heme by ferrochelatase or that can continue in the chlorophyll pathway through conversion to Mg-protoporphyrin IX (Lohr et al. 2005). Pathway branches are color-coded: protoporphyrin IX is shown in pink, heme in purple, chlorophyll in green and chlorophyll catabolism in black. For clarity, the phytochromobilin and sireoheme branches are omitted. (B) Averaged RPKMs for the two replicates, normalized to their maximum, at each time point are plotted for each of pathway branches. Line colors correspond to pathway branch colors in panel (A). Plots were smoothed using the FFT method of signal processing with 2 points in Origin (OriginLab). The dark period is indicated by gray shading. Additional data are in Supplemental Data Set 11.

Supplemental Data. Zones et al. (2015). Plant Cell. 10.1105/tpc.15.00498
Supplemental Figure 22. Expression profiles of genes encoding LHC-like proteins.(A) Plots of averaged expression for LHC-like genes normalized to maximum expression of each gene. The dark period is indicated by gray shading.(B) Plots of expression estimates (RPKM) for each LHC-like gene in each of the two experimental replicates. The dark period is indicated by gray shading. Additional data including protein names are in Supplemental Data Set 13.
0 84 12 16 20 240
0.5
1
mR
NA
abun
danc
e
A
0 8 16 24 8 16 240
5
2
1RPK
M (x
100)
B replicate 1 replicate 2
ELIP1ELIP2ELIP3ELIP4ELIP5ELIP6ELIP7ELIP8ELIP9
LHCSR1LHCSR3.1LHCSR3.2
ELIP10
PSBS1PSBS2
3
4
Supplemental Figure 22. Expression profiles of genes encoding LHC-like proteins. (A) The experimental replicate average mRNA abundance for each LHC-like gene is shown normalized to the maximum expression. (B) Expression estimates (RPKM) for each LHC-like gene in each of the two experimental replicates. The dark period is indicated by gray shading. Additional data including encoded protein names are in Supple-mental Data Set 13.
Time (h) Time (h) Time (h)

1.00 0.5Scaled expression
Zn depletion
Cu depletionMn depletion Fe depletion
Cd depletion Low CO2High CO2
P depletion N depletion N-Free HSMS depletion Anoxia N-Free HSM + Acetate
light dark
G1 S/M G0
86 genes
A
c1
c2
c8
c7
c11
c15
c17
c9
c3c4
c10
c12
c13
c14
c16
c18
c5
Locus ID (v5.5) Gene SymbolCre06.g300600Cre14.g632176Cre03.g144424Cre04.g229948Cre06.g278136Cre05.g240650 DNJ32Cre06.g275550Cre06.g310500Cre12.g514400Cre13.g568350Cre16.g695600 DNJ10Cre13.g572950 E2FR1Cre01.g052300 E2F1Cre06.g250950Cre08.g361400Cre08.g378450Cre08.g383000Cre09.g391353Cre15.g643700Cre06.g278229Cre07.g349152Cre09.g386753Cre02.g100100Cre07.g330050Cre14.g621050Cre17.g729600Cre11.g467577Cre01.g009650 BUG25Cre02.g091550 EZY18Cre02.g097850Cre03.g152150Cre03.g152450Cre03.g193900Cre06.g249050Cre07.g341800 CGL107Cre11.g481800Cre16.g667900Cre16.g672300Cre16.g672400Cre03.g176651Cre12.g522400Cre12.g550250Cre12.g538801Cre03.g149201Cre12.g557300Cre03.g144747Cre06.g254650Cre01.g000050Cre06.g253250Cre06.g266850Cre06.g275500Cre10.g460400Cre13.g562400Cre13.g567250Cre16.g661650Cre09.g399289Cre02.g079200Cre03.g185950Cre02.g078831Cre06.g289900Cre03.g198800Cre06.g297150Cre09.g387850Cre09.g411600Cre17.g738632Cre02.g110150Cre07.g325738Cre08.g358534Cre09.g393654Cre01.g025050Cre01.g043550Cre10.g421550Cre10.g433350Cre10.g454850Cre12.g502251Cre14.g621172Cre15.g639350Cre16.g686250Cre17.g709800Cre03.g209953Cre05.g241636Cre01.g033900Cre01.g051174Cre06.g285600 MIDCre14.g633789Cre09.g390023 CRR1
10 genes
c14
c2c3c11c6c12
c15c17
Locus ID (v5.5) Gene SymbolCre01.g003376Cre05.g238250Cre03.g163200Cre04.g228400Cre03.g201250Cre02.g103450Cre02.g104700Cre04.g224600Cre05.g242600 CGL106Cre14.g620500
C
B
c1
c2
c8
c7
c15
c17
c6
c3
c10
c12c13
c16
c18
c14
c11
Locus ID (v5.5) Gene SymbolCre02.g109683Cre09.g387150 HSF1Cre12.g556400Cre13.g590350Cre01.g014050Cre07.g353500 CGLD5ACre09.g389750Cre17.g696300Cre07.g319701Cre12.g521150 CGL19Cre05.g243000Cre16.g649433Cre02.g083750Cre06.g268600Cre16.g650400 CPL20Cre06.g278159Cre16.g667150Cre07.g323000 DP1Cre17.g696750Cre04.g231124Cre08.g358532Cre06.g293750Cre12.g516050Cre01.g023100Cre03.g160700Cre03.g160600Cre03.g200431Cre04.g218050Cre06.g304250Cre07.g345350Cre08.g378800Cre09.g413050Cre12.g501600Cre12.g538550Cre14.g620850Cre09.g410450Cre17.g698233Cre03.g212977Cre07.g318050Cre08.g371052Cre01.g010750Cre08.g364400Cre16.g692250Cre14.g617151Cre09.g399067Cre02.g108350Cre03.g193400Cre03.g194950Cre05.g233551Cre07.g335150Cre07.g354500Cre08.g385350Cre10.g438850Cre11.g476250Cre12.g517350 LSD1Cre14.g609350Cre16.g686100Cre11.g467581Cre01.g070932Cre16.g692500Cre17.g746547Cre01.g012200Cre02.g112750Cre02.g113450Cre02.g146629Cre06.g275350Cre06.g291500Cre09.g411950Cre10.g430750Cre16.g677382Cre16.g675100 CPLD53Cre03.g146267
72 genes
light dark
G1 S/M G0
D
23 genes
c8
c13
c9
c14c15
c17
c12
c6
c18
c7
c16
Locus ID (v5.5) Gene SymbolCre02.g109650 GSP1Cre12.g495100 PSR1Cre09.g399552Cre07.g332250Cre12.g523000Cre10.g435450 CPL2Cre07.g353555Cre01.g004600Cre02.g085150Cre14.g631750Cre02.g110550Cre03.g149400Cre06.g278181Cre12.g489000Cre06.g266950Cre07.g321550Cre10.g421021Cre14.g612100Cre17.g738600Cre03.g197100Cre10.g453500Cre01.g034350Cre03.g149350
Supplemental Figure 23. Expression profiles of transcription factor genes.(A-D) Heat maps of differentially expressed transcription factor-encoding genes (TFs). Cell cycle stages, diurnal cycle time, and light and dark phases are indicated above. Maximum expression for each gene was set to 1. Cluster membership (grey boxes), locus identifiers, and gene symbols are shown to the right of each heat map. Colored diamonds (specified in key under panel D) signify up-regulation after treatment in other RNA-Seq experiments (maximum expression ≥ 10 RPKM/FPKM & fold-change ≥ 2). (A) TFs not up-regulated in other experiments; (B) TFs up-regulated in one or more other RNA-Seq experiments; (C) TFs up-regulated after deflagellation; (D) TFs up-regulated in other experiments with two-fold or higher expression than in any diurnal time point. Additional data are available in Supplemental Data Set 16.
Supplemental Data. Zones et al. (2015). Plant Cell. 10.1105/tpc.15.00498

112233445566778899101011111212131314141515161617171818191920202121222223232424252526262727282829293030313132323333343435353636373738383939404041414242434344444545464647474848494950505151525253535454555556565757585859596060616162626363646465656666
AA BB CC DD EE FF GG HH II JJSupplemental Table 1. Illumina read mapping statistics.Output from STAR RNA-Seq mapping software
Sample 1_1 1_2 2_1 2_2 3_1 3_2 4_1 4_2 5_1Total Reads (paired-end, postQC) 7.3E+06 2.9E+07 4.1E+06 9.3E+06 9.2E+06 1.2E+07 5.5E+06 4.2E+07 8.2E+06Total Mapped Reads (paired-end) 6.7E+06 2.6E+07 3.8E+06 8.4E+06 8.4E+06 1.1E+07 5.0E+06 3.8E+07 7.5E+06No Feature 9.9E+04 3.7E+05 4.8E+04 1.1E+05 1.2E+05 1.5E+05 7.1E+04 5.4E+05 1.2E+05Ambiguous 1.7E+03 7.0E+03 1.0E+03 2.4E+03 2.6E+03 3.3E+03 1.7E+03 1.3E+04 2.8E+03Too Low av Qual 0 0 0 0 0 0 0 0 0Not aligned 0 0 0 0 0 0 0 0 0Alignment not unique 5.5E+05 2.6E+06 2.5E+05 7.0E+05 6.7E+05 8.9E+05 4.2E+05 3.1E+06 6.2E+05Percent Mapped Reads 91.04 89.81 92.64 91.13 91.38 90.99 91.01 91.17 90.91Percent No Feature 1.36 1.28 1.17 1.24 1.27 1.29 1.29 1.3 1.5Percent Ambiguous 0.02 0.02 0.02 0.03 0.03 0.03 0.03 0.03 0.03Percent Too Low av Qual 0 0 0 0 0 0 0 0 0Percent Not Aligned 0 0 0 0 0 0 0 0 0Percent Not Unique 8.32 9.89 6.66 8.35 8.01 8.45 8.43 8.22 8.32
Sample 5_2 6_1 6_2 7_1 7_2 8_1 8_2 9_1 9_2Total Reads (paired-end, postQC) 8.6E+06 1.1E+07 2.0E+07 1.5E+07 1.4E+07 1.6E+07 1.9E+07 2.2E+07 6.0E+06Total Mapped Reads (paired-end) 7.8E+06 9.7E+06 1.8E+07 1.4E+07 1.3E+07 1.4E+07 1.7E+07 2.0E+07 5.4E+06No Feature 1.2E+05 1.9E+05 2.7E+05 2.2E+05 2.1E+05 2.3E+05 3.0E+05 4.0E+05 9.6E+04Ambiguous 2.8E+03 5.2E+03 6.7E+03 5.1E+03 4.8E+03 5.6E+03 6.8E+03 7.4E+03 2.4E+03Too Low av Qual 0 0 0 0 0 0 0 0 0Not aligned 0 0 0 0 0 0 0 0 0Alignment not unique 7.1E+05 1.0E+06 1.7E+06 1.2E+06 1.3E+06 1.2E+06 1.8E+06 1.8E+06 5.6E+05Percent Mapped Reads 90.36 88.77 89.94 90.74 89.52 90.52 89.07 90.01 89.03Percent No Feature 1.39 1.72 1.4 1.44 1.44 1.48 1.53 1.81 1.6Percent Ambiguous 0.03 0.05 0.03 0.03 0.03 0.04 0.03 0.03 0.04Percent Too Low av Qual 0 0 0 0 0 0 0 0 0Percent Not Aligned 0 0 0 0 0 0 0 0 0Percent Not Unique 9.09 10.66 9.6 8.58 10.06 8.8 10.52 9.05 10.47
Sample 10_1 10_2 11_1 11_2 11.5_1 11.5_2 12_1 12_2 12.5_1Total Reads (paired-end, postQC) 1.9E+07 7.1E+06 1.7E+07 1.4E+07 1.5E+07 3.9E+07 1.5E+07 1.5E+07 1.0E+07Total Mapped Reads (paired-end) 1.7E+07 6.3E+06 1.5E+07 1.3E+07 1.3E+07 3.5E+07 1.4E+07 1.4E+07 9.3E+06No Feature 3.0E+05 1.2E+05 2.9E+05 2.5E+05 2.9E+05 6.7E+05 2.7E+05 2.5E+05 1.9E+05Ambiguous 6.9E+03 2.5E+03 5.3E+03 4.5E+03 4.7E+03 1.2E+04 5.1E+03 4.6E+03 4.8E+03Too Low av Qual 0 0 0 0 0 0 0 0 0Not aligned 0 0 0 0 0 0 0 0 0Alignment not unique 1.9E+06 6.7E+05 1.3E+06 1.2E+06 1.2E+06 3.3E+06 1.2E+06 1.2E+06 7.9E+05Percent Mapped Reads 88.09 88.95 90.16 89.73 90.16 89.6 90.45 90.32 90.42Percent No Feature 1.61 1.66 1.74 1.74 1.95 1.72 1.75 1.66 1.88Percent Ambiguous 0.04 0.03 0.03 0.03 0.03 0.03 0.03 0.03 0.05Percent Too Low av Qual 0 0 0 0 0 0 0 0 0Percent Not Aligned 0 0 0 0 0 0 0 0 0Percent Not Unique 11.66 10.52 8.95 9.47 8.72 9.65 8.58 8.84 8.47

676768686969707071717272737374747575767677777878797980808181828283838484858586868787888889899090919192929393949495959696979798989999100100101101102102103103104104105105106106107107108108109109110110111111112112113113114114115115116116117117118118119119120120121121122122123123124124125125126126127127128128129129130130131131132132
AA BB CC DD EE FF GG HH II JJSample 12.5_2 13_1 13_2 13.5_1 13.5_2 14_1 14_2 14.5_1 14.5_2Total Reads (paired-end, postQC) 1.8E+07 2.0E+07 3.7E+07 1.6E+07 1.7E+07 2.5E+07 2.7E+07 1.9E+07 8.8E+06Total Mapped Reads (paired-end) 1.6E+07 1.8E+07 3.3E+07 1.5E+07 1.5E+07 2.2E+07 2.4E+07 1.7E+07 7.8E+06No Feature 3.2E+05 3.8E+05 5.6E+05 3.2E+05 3.1E+05 4.8E+05 4.9E+05 3.6E+05 1.7E+05Ambiguous 7.3E+03 1.1E+04 1.3E+04 9.9E+03 8.6E+03 1.5E+04 1.4E+04 1.2E+04 4.7E+03Too Low av Qual 0 0 0 0 0 0 0 0 0Not aligned 0 0 0 0 0 0 0 0 0Alignment not unique 1.5E+06 1.6E+06 3.4E+06 1.3E+06 1.4E+06 2.1E+06 2.4E+06 1.5E+06 8.2E+05Percent Mapped Reads 90.01 90.14 89.3 89.95 89.72 89.77 89.02 89.8 88.73Percent No Feature 1.79 1.92 1.5 1.94 1.9 1.91 1.86 1.9 1.88Percent Ambiguous 0.04 0.05 0.03 0.06 0.05 0.06 0.05 0.06 0.05Percent Too Low av Qual 0 0 0 0 0 0 0 0 0Percent Not Aligned 0 0 0 0 0 0 0 0 0Percent Not Unique 9.06 8.75 10.27 8.95 9.29 9.2 10.19 9.17 10.52
Sample 15_1 15_2 16_1 16_2 17_1 17_2 18_1 18_2 19_1Total Reads (paired-end, postQC) 2.8E+07 1.2E+07 6.9E+06 2.5E+07 1.1E+07 1.3E+07 1.1E+07 1.7E+07 1.1E+07Total Mapped Reads (paired-end) 2.5E+07 1.1E+07 6.1E+06 2.2E+07 9.9E+06 1.2E+07 9.7E+06 1.5E+07 9.3E+06No Feature 5.1E+05 2.2E+05 1.3E+05 4.6E+05 2.0E+05 2.4E+05 1.9E+05 2.8E+05 1.8E+05Ambiguous 1.2E+04 6.7E+03 3.5E+03 1.3E+04 5.6E+03 6.4E+03 5.2E+03 7.0E+03 4.2E+03Too Low av Qual 0 0 0 0 0 0 0 0 0Not aligned 0 0 0 0 0 0 0 0 0Alignment not unique 2.2E+06 1.1E+06 5.8E+05 2.2E+06 1.1E+06 1.3E+06 1.0E+06 1.7E+06 1.0E+06Percent Mapped Reads 90.3 89.17 89.61 89.2 88.69 88.77 88.77 88 88.36Percent No Feature 1.8 1.87 1.83 1.85 1.83 1.77 1.72 1.69 1.7Percent Ambiguous 0.04 0.06 0.05 0.05 0.05 0.05 0.05 0.04 0.04Percent Too Low av Qual 0 0 0 0 0 0 0 0 0Percent Not Aligned 0 0 0 0 0 0 0 0 0Percent Not Unique 8.69 9.99 9.49 9.97 10.63 10.6 10.66 11.67 11.21
Sample 19_2 20_1 20_2 21_1 21_2 22_1 22_2 23_1 23_2Total Reads (paired-end, postQC) 1.6E+07 3.8E+07 9.8E+06 1.4E+07 1.9E+07 1.9E+07 1.2E+07 3.1E+07 2.3E+07Total Mapped Reads (paired-end) 1.4E+07 3.4E+07 8.6E+06 1.2E+07 1.6E+07 1.7E+07 1.1E+07 2.7E+07 2.0E+07No Feature 2.6E+05 6.4E+05 1.6E+05 2.2E+05 3.0E+05 3.0E+05 2.1E+05 5.0E+05 3.6E+05Ambiguous 6.7E+03 1.6E+04 4.2E+03 5.1E+03 7.0E+03 6.9E+03 4.9E+03 1.3E+04 9.4E+03Too Low av Qual 0 0 0 0 0 0 0 0 0Not aligned 0 0 0 0 0 0 0 0 0Alignment not unique 1.7E+06 3.7E+06 1.1E+06 1.4E+06 2.1E+06 1.9E+06 1.4E+06 3.1E+06 2.4E+06Percent Mapped Reads 87.54 88.66 87.44 88.15 86.87 88.09 87.25 88.12 87.83Percent No Feature 1.61 1.68 1.68 1.6 1.62 1.61 1.66 1.62 1.58Percent Ambiguous 0.04 0.04 0.04 0.04 0.04 0.04 0.04 0.04 0.04Percent Too Low av Qual 0 0 0 0 0 0 0 0 0Percent Not Aligned 0 0 0 0 0 0 0 0 0Percent Not Unique 12.34 10.86 12.39 11.59 13.21 11.66 12.66 11.6 12.01
Sample 24_1 24_2Total Reads (paired-end, postQC) 1.2E+07 1.7E+07Total Mapped Reads (paired-end) 1.0E+07 1.5E+07No Feature 2.0E+05 2.7E+05Ambiguous 4.5E+03 6.5E+03Too Low av Qual 0 0Not aligned 0 0Alignment not unique 1.2E+06 1.9E+06Percent Mapped Reads 88.15 87.5Percent No Feature 1.66 1.6Percent Ambiguous 0.04 0.04Percent Too Low av Qual 0 0Percent Not Aligned 0 0Percent Not Unique 11.51 12.41