dead sea study - world banksiteresources.worldbank.org/intredseadeadsea/... · dead sea study red...
TRANSCRIPT

November 2010IL-201280-R10-054A
Best Available Data ReportRevised
in association
with and associates
Dead Sea Study
Red Sea – Dead Sea Water Conveyance Study Program

November 2010IL-201280-R10-054A
Best Available Data ReportRevised
in association
with and associates
Dead Sea Study
Red Sea – Dead Sea Water Conveyance Study Program

Team Leader: Elias E1 Scientific Coordination and Deputy Team Leader: Gavrieli I2 General Coordination: Farber E1, Buzaglo M1 Editor: Esakov S1 Scientific contributions: Gavrieli I2, Lensky N2, Abelson M2, Ganor J3, Oren A4, Brenner S5, Lensky I5, Shalev E2, Yechieli Y2, Reznik I3, Gertman I6, Wells S7, Simon E1, Shahar H1 [1] TAHAL Consulting Engineers Ltd [2] Geological Survey of Israel [3] Ben-Gurion University of the Negev [4] The Hebrew University of Jerusalem [5] Bar Ilan University [6] Israel Oceanographic and Limnological Research [7] Portland State University

Table of Contents Page
Z:\IL\201280\R10.054A\BAD TOC-rev.doc November 24, 2010 i
1. INTRODUCTION ........................................................................................................1 2. DEAD Sea Existing Information ................................................................................1
2.1. Background ...................................................................................................1 2.2. Historical Water Level ....................................................................................4
2.3. Dead Sea Brine Evolution and Chemistry .........................................................5 2.4. Precipitation of Salts.......................................................................................7 2.5. Dead Sea Hydrography ...................................................................................9
2.5.1. Monomictic vs Meromictic .................................................................9 2.5.2. Recent Trends in Salinity and Temperature ........................................ 11 2.5.3. Currents .......................................................................................... 11 2.5.4. Remote Sensing of the Dead Sea Surface ........................................... 11 2.5.4.1. Sea Surface Temperature (SST) ......................................................... 11
2.5.4.2. Total Suspended Matter (TSM) .......................................................... 16 2.6. Energy and Mass Balance .............................................................................. 18
2.7. Life in the Dead Sea ............................................................................................... 19
2.8. Expected Impact due to RSDSC ............................................................................. 11
2.8.1. Modeling of the Dead Sea ........................................................................ 11
2.8.1.1. Non-calibrated 1D-DS-POM scenario runs with freshwater ................. 18 2.8.2. Mineral Precipitation ....................................................................... 11 2.8.2.1. Thermodynamics ............................................................................. 11
2.8.2.2. The factors affecting gypsum precipitation kinetics ............................. 11
2.8.2.3. Nucleation ...................................................................................... 14
2.8.2.4. Crystal Growth ............................................................................... 16
2.8.3. Blooming Potential .......................................................................... 16
3. HYDROGEOLOGY AND SINKHOLES - EXISTING INFORMATION ....................................... 18
3.1. Surface Flows .............................................................................................. 18
3.1.1. Overview ........................................................................................ 18
3.1.2. The Jordan River Inflows ................................................................. 18 3.1.3. The Wadi Arava Inflows .................................................................. 44
3.1.3.1. Wadi Arava Western Sub-Basins ....................................................... 44
3.1.3.2. Wadi Arava Eastern Sub-Basins ........................................................ 44
3.1.3.3. The Total Wadi Arava Dead Sea Inflows ............................................ 44
3.1.4. Wadis and Springs Inflows from the West .......................................... 41 3.1.4.1. Wadis ............................................................................................. 41
3.1.4.2. Springs ........................................................................................... 41
3.1.5. Wadis and Spring Inflows from the East ............................................ 41 3.1.5.1. Wadis ............................................................................................. 41
3.1.6. Direct Rainfall from Above .............................................................. 41
3.1.7. Summary of the Various Dead Sea Inputs ........................................... 41
3.2. Groundwater Inflows .................................................................................... 41
3.2.1. The Hydrogeology West of the Dead Sea ........................................... 41
3.2.2. The Hydrogeology East of the Dead Sea............................................. 44
3.2.3. Physical Groundwater Processes ....................................................... 45

Table of Contents
Page
Z:\IL\201280\R10.054A\BAD TOC-rev.doc November 24, 2010 ii
3.3. Sinkholes .................................................................................................... 54 3.3.1. Sinkholes Information ...................................................................... 54 3.3.2. Formation mechanism of the Dead Sea sinkholes –
Dissolution of 10,000 year old salt layer ............................................. 54 3.3.2.1. Shallow salt layer buried within the Dead Sea fill:
findings from boreholes and seismic refraction ................................... 54
3.3.2.2. Cavities within the salt layer ............................................................. 55
3.3.2.3. Hydrology and groundwater chemistry .............................................. 56
3.3.2.4. Sinkhole lineaments along cryptic, likely active, young faults ............... 58 4. QUALITATIVE PROVISIONAL ASSESSMENT ................................................................. 59
4.1. Task 1: Current Status .................................................................................. 59 4.2. Task 2: No Action ........................................................................................ 61
4.3. Task 3: Base Case Plus ................................................................................. 61 5. REFERENCES ......................................................................................................... 69
5.1. Dead Sea – Existing Information .................................................................... 69
5.1.1. Background .................................................................................... 69
5.1.2. Historical Water Level ..................................................................... 74
5.1.3. Dead Sea Brine Evolution and Chemistry ........................................... 74 5.1.4. Precipitation of Salts ........................................................................ 71 5.1.5. Hydrography ................................................................................... 71 5.1.6. Energy and Mass Balance ................................................................. 74 5.1.7. Life in the Dead Sea ......................................................................... 75 5.1.8. Expected Impact due to RSDSC ........................................................ 77
5.2. Hydrogeology and Sinkholes – Existing Information ........................................ 81 5.2.1. Hydrogeology Information ................................................................ 81 5.2.1.1. Surface Water Hydrology ................................................................. 81 5.2.1.2. Summary of the Various Dead Sea Inputs ........................................... 84 5.2.2. Sinkholes Information ...................................................................... 86
5.3. Additional References................................................................................... 88
List of Tables
Table 1:The composition of Dead Sea water (summer 2002) and a typical
end brine composition (in g/l) ................................................................................ 6
Table 2: The Various Dead Sea Inputs ............................................................................ 43

Table of Contents
Page
Z:\IL\201280\R10.054A\BAD TOC-rev.doc November 24, 2010 iii
List of Figures
Figure 1: The Red Sea - Dead Sea Location Map ......................................................1 Figure 2: Reconstructed Lake Lisan and Dead Sea water levels over the
past 15,000 years ...................................................................................1
Figure 3: The Water Levels of the Dead Sea: 1976-2010 .........................................4 Figure 4: Changes in the Molar Ratios of Na/Cl and Mg/K in the Dead Sea. . .............7 Figure 5: A T-S diagram showing the evolution of the deep the Dead Sea brine
at depth below 100 meters during meromictic (1979-1982) and
holomictic periods 1983-1988. ........................................................................ 11 Figure 6: Averaged quasi-salinity (sigma 25) and temperature of the
Dead Sea Upper Mixed Layer (above 20 m depth) during last
holomictic period ................................................................................... 11
Figure 7: Averaged quasi-salinity (sigma 25) and potential temperature
of the Dead Sea Deep Water Body (below 100 m depth) during
last holomictic period. ............................................................................ 11 Figure 8:. Location of 16 MSG Pixels (gray polygons). ............................................... 14
Figure 9: Diurnal Cycle ...................................................................................... 15 Figure 10: Seasonal Variations of the Diurnal Cycle ............................................... 16 Figure 11: TSM images from MODIS. .................................................................. 17 Figure 12: Aerial photo of the area of pump station P88 .......................................... 18 Figure 13: Schematic representation of the new multicomponent
chemistry-based 1D-DS-POM and the interaction of the various
modules developed for the model with the central code and with
each other. .......................................................................................... 14
Figure 14: a) Calculated surface salinity and b) water level from one year
uncalibrated runs ................................................................................. 15 Figure 15: Computed water levels from uncalibrated CE-QUAL-W2 model
using the incompressible model compared to the compressible model ....... 16
Figure 16: Temperature predictions at 1 m, 10 m, 20 m, and 30 m for
incompressible and compressible model uncalibrated
CE-QUAL-W2 model. ........................................................................... 17 Figure 17: Calculated long-term water levels from 1D-DS-POM uncalibrated
runs with various freshwater inflows. ................................................... 19 Figure 18: Calculated long-term a) surface and b) near-bottom densities
from 1D-DS-POM runs with various freshwater inflows. ........................ 14 Figure 19: Degrees of saturation with respect to gypsum (a) and gypsum
precipitation potentials (b) . .................................................................. 11 Figure 20: Variations in SO42- concentrations with time, illustrating the
determination of the induction time in a batch experiment
with DSF of 70%. . .............................................................................. 15 Figure 21: Decrease in SO42- concentrations with time in a representative
(70% DSF) seeded batch experiment .................................................... 16 Figure 22: Numerical simulations of the expected changes in the case
of Dead Sea level drop. ....................................................................... 46

Table of Contents
Page
Z:\IL\201280\R10.054A\BAD TOC-rev.doc November 24, 2010 iv
Figure 23: Groundwater levels in monitoring boreholes in the Dead Sea
coastal aquifer at different locations and distances from the shoreline ........ 47 Figure 24a: Profile of EC in EG 11 borehole in the Dead Sea coastal aquifer .............. 48
Figure 24b: Profile of EC in Darga 2 borehole in the Dead Sea coastal aquifer ............ 49 Figure 25: Distribution of sinkhole sites along the Dead Sea coast,
updated from aerial photographs from August 2006 ................................. 51 Figure 26: Growth rate (red line) and cumulative number of the sinkholes (black line) 51 Figure 27: Sinkhole lineaments and buried faults . ................................................... 51 Figure 28: A salt core from the En Bokek-1 borehole. .............................................. 55 Figure 29: A photograph from the cavity found in the borehole Mineral-2
at the Shalem site ................................................................................. 56 Figure 30: A schematic hydrogeological section across the elongated cluster of
sinkholes in En-Gedi plantations . .......................................................... 57

Best Available Data Report
RS-DS Water Conveyance Study Program
Z:\IL\201280\R10.054A\BAD_report_revised.doc November 24, 2010 1
1. Introduction
The Red Sea − Dead Sea (RS-DS) Water Conveyance Study Program is investigating the physical, biological and chemical aspects of the effects of mixing Red Sea and Dead Sea waters in the Dead Sea. Within the framework of this program, this is the second of five reports being presented to the World Bank.
This report (Best Available Data) reviews the scientific work and insights gained over the past decades into the evolution from the past to the current state of the Dead Sea. The report includes evaluation of present knowledge gained through long term studies and monitoring. The report includes qualitative provisional assessment of the three tasks (Tasks 1, 2 and 3) based on present knowledge and understanding of the Dead Sea limnology (chemistry, water balance, mineral precipitation etc.) and the adjacent hydrology.
The Best Available Data (BAD) report is divided into three sections; 1) existing information on the Dead Sea, 2) existing hydrogeology and sinkhole information, and 3) qualitative provisional assessment according to the tasks as stated and revised by the World Bank. After the review of the Inception Report (April 2010) and at the request of the World Bank, and not as stated in the Terms of Reference, the target level will be between -433 and not over -406, and the time frame will be expanded to 2035 to 2050 or even 2075 for a 2020 inflow commencement.
2. Dead Sea Existing Information 2.1. Background
The Dead Sea is a hypersaline terminal desert lake located in the Dead Sea rift valley (Fig. 1 on the following page). Geologically, the lake is situated within the large Dead Sea basin which is one of the pull aparts that formed along the Dead Sea rift (Quennell, 1959; Garfunkel and Ben Avraham 1996). The lake’s deepest point (-730 m) is the deepest terrestrial spot on Earth. Presently, the lake’s shoreline is located at about 423 m below mean sea level. The lake shore is thus the lowest exposed surface on Earth. The modern Dead Sea evolved in the early Holocene after a major decline in the water level of Lake Lisan (Fig. 2), the late Pleistocene precursor of the Dead Sea, which occurred some 10,000 to 14,000 years ago (Stein et al., 2010). Whereas in the Late Pleistocene, lake Lisan’s level was around -280 m, the Holocene Dead Sea water level fluctuated around -400 m (Ken-Tor et al., 2004). This latter level is the elevation of the sill dividing the shallow southern basin of the lake from the much deeper northern basin. Higher water levels were attained during rainy periods when the lake extended into the southern basin and the surface water was diluted. Lower levels reflect dry periods, with negative water balance and large area shrinkage, including the drying out of the southern basin. The smaller surface area and higher salinity resulted in a drastic decrease in evaporation which served

Best Available Data Report
RS-DS Water Conveyance Study Program
Z:\IL\201280\R10.054A\BAD_report_revised.doc November 24, 2010 2
to buffer further lake level drops. The high stand of the Dead Sea and the flooding of the southern basin began in the second half of the 19th century reflecting a rainy period. Given the present climate conditions in our region, it is most probable that the Dead Sea would have shrunk to the northern basin even without the present anthropogenic intervention.
Figure 1: The Red Sea - Dead Sea location map

Best Available Data Report
RS-DS Water Conveyance Study Program
Z:\IL\201280\R10.054A\BAD_report_revised.doc November 24, 2010 3
During the 20th century, human intervention in the water balance of the lake has resulted in a rapid decline in the water level. In 1977, the southern basin dried up, but the water level continues to decline at a high rate of about 1 m/yr. This decline is accompanied by other undesired changes in the Dead Sea, such as the development of hundreds of sinkholes around the shore of the lake (Abelson et al., 2003a,b), exposure of large mudflats, dewatering and sediment shrinkage which lead to local ground sinking (Baer et al., 2002) and rapid geomorphological changes, which have resulted in damage to the surrounding infrastructure, mainly to roads and bridges.
Figure 2: Reconstructed Lake Lisan and Dead Sea water levels over the past 15,000 years (Kushnir and Stein, 2010).

Best Available Data Report
RS-DS Water Conveyance Study Program
Z:\IL\201280\R10.054A\BAD_report_revised.doc November 24, 2010 4
2.2. Historical Water Level
During the 20th century, the Dead Sea level has dropped by more than 20 meters (Fig. 3). As previously mentioned, the shallow southern basin dried up and the lake is now confined to the much deeper northern basin. The situation, whereby the lake is limited only to the northern basin is not uncommon in the lake's history, and occurred whenever drier conditions prevailed in the eastern Mediterranean (Bartov et al., 2003).
Figure 3: The water levels of the Dead Sea: 1976-2010 (date from Israel Hydrological Service)
The decline in the Dead Sea level is a manifestation of the negative water balance of the lake, whereby evaporation greatly exceeds inflows. This present negative water balance is attributed primarily to the diversion of freshwater for agricultural and domestic use from the two main sources of the Jordan River. Since the 1960s, water from Lake Kinneret (Sea of Galilee) has been pumped to the Israeli National Water Carrier. Most of the Yarmouk River is diverted by Syria and Jordan to the King Abdullah Canal, with the rest is taken by Israel. Thus, the flow through the Jordan River, which was the single most important water source to the Dead Sea, has been reduced from about 1500 million cubic meters (MCM)/year to less than 150 MCM/year (Salameh and El-Naser, 1999; Al Weshah, 2000), with some estimates running as low as 30 MCM/yr (Friends of the Earth Middle East, 2010). Furthermore, the quality of the water presently flowing in the Jordan has greatly deteriorated, and presently it consists mostly of irrigation return flow, saline groundwater which discharges to the river, and
Years
Leve
l (m
)
-424
-422
-420
-418
-416
-414
-412
-410
-408
-406
-404
-402
-400
-398
1976
1978
1980
1982
1984
1986
1988
1990
1992
1994
1996
1998
2000
2002
2004
2006
2008
2010
Years
Leve
l (m
)
-424
-422
-420
-418
-416
-414
-412
-410
-408
-406
-404
-402
-400
-398
1976
1978
1980
1982
1984
1986
1988
1990
1992
1994
1996
1998
2000
2002
2004
2006
2008
2010

Best Available Data Report
RS-DS Water Conveyance Study Program
Z:\IL\201280\R10.054A\BAD_report_revised.doc November 24, 2010 5
treated and untreated sewage (Farber et al., 2004). Nevertheless, during particularly rainy winters, when the dams on Lake Kinneret and the Yarmouk Rivers have to be opened, large volumes of water flow through the Jordan River. Such flows occurred in winter 1979/1980 and 1991/1992 when the lake level rose by 1.5 and 2 meters, respectively (Beyth et al., 1993). A more moderate rise of 60 cm occurred following the rainy winter of 2002/2003. During such winters the frequency and magnitude of the flash-floods in the rivers draining to the Dead Sea are larger, adding their share to the rise in the water level of the Dead Sea. These dramatic lake level rises, however, are worn-out within two to three years and do not change the more general trend of the declining lake level. The activities of the Israeli and the Jordanian potash industries near the Dead Sea contribute to the decline of the level by artificially increasing the evaporating surface of the remaining lake. These industries together pump 520 MCM of brine from the Dead Sea into the evaporation ponds, located on the otherwise dried southern basin, and return about 240 MCM of concentrated "end brine" back to the lake. Thus, about 30-40 cm/yr of the water level decline of the Dead Sea is due to evaporation in these ponds.
If the current situation continues, the Dead Sea level is expected to continue to decline. In fact, future inflow to the Dead Sea is only expected to decrease further, as more of the water currently flowing into the lake will be captured and diverted to meet growing needs for freshwater. More of the wadis on the eastern escarpment of the Dead Sea Rift are planned to be dammed or have already been dammed (at the time of this report), while the discharge of the major spring system around the lake will probably decrease as water continues to be pumped from the aquifer system. These reduced flows are only partially offset, if at all, by some increase in the rate of groundwater discharge to the lake. This increase is due to the receding base level and the consequent increase in the hydraulic gradient and seaward migration of the brine/freshwater interface (Salameh and El-Naser, 1999, 2000a,b).
2.3. Dead Sea Brine Evolution and Chemistry
The Dead Sea brine evolved from seawater that intruded into the Rift Valley, probably during the Pliocene, and formed the Sedom lagoon (Zak, 1967, Starinsky, 1974, Stein, 2001, Katz and Starinsky, 2009). The shape of the lagoon, which was some 200 km long and only a few km wide, the rapid subsidence of the Rift Valley and the prevailing arid climate gave rise to the deposition of thick layers of evaporitic minerals. These include mainly gypsum and halite with some carnallite and possibly more advanced evaporitic minerals (Zak, 1967). The concentrated brine later percolated into the surrounding limestones and dolomitized a major part of the country rock. This process led to further gypsum precipitation and to the removal of most of the sulfate from the subsurface brine. Since then, the brines are recycled back and forth between the surface and the subsurface, and play a major role in the geochemistry of the lakes that developed

Best Available Data Report
RS-DS Water Conveyance Study Program
Z:\IL\201280\R10.054A\BAD_report_revised.doc November 24, 2010 6
in the Rift during the Pleistocene and Holocene, namely Lake Amora, Lake Lisan (70,000-14,000 yr) and the Dead Sea.
Undiluted Dead Sea water contains about 343 g/l total dissolved salts and has a density of 1.24 kg/l (Table 1). Among the hypersaline lakes, the Dead Sea is unique because of its peculiar Ca-chloride composition [i.e. Ca/(SO4+HCO3)>1]. Divalent cations (Mg + Ca) dominate over univalent cations (Na + K). Cl- and Br- are the dominant anions (99% and 1% of the anion sum, respectively), and concentrations of SO4
2- and HCO3- are very low. The pH of the Dead Sea is about
5.9 (Ben-Yaakov and Sass, 1977).
Table 1: The composition of Dead Sea water (summer 2002) and a typical end brine composition (in g/l).
Na K Ca Mg Cl Br Alkalinity
(as HCO3) SO4 TDS
Dead Sea 34.3 8.0 18.3 47.1 228.6 5.4 0.3 0.4 342.4 End brine 3.7 4.1 35.4 88.4 328.2 10.1 0.3 0.5 470.7
Levels of biologically available nitrogen in the Dead Sea are high. The average concentration of ammonium ions in the water column was reported to be 5.9 mg/l in 1960 and 8.9 mg/l in 1991 (Nissenbaum et al., 1990; Stiller and Nissenbaum, 1999). Nitrate is present in low concentrations only; 20 �g NO3
--N/l in the 1960s, a value that had increased to 200-500 �g/l in 1981 as a result of the anthropogenic pollution of the Jordan River (Stiller and Nissenbaum, 1999). Phosphorus is not abundantly found in the Dead Sea, as its solubility in the lake’s brines is limited. Stiller and Nissenbaum (1999) reported dissolved phosphorus levels of about 35 �g PO4
3--P/l (~2 �M P). Recent analyses, carried out in the framework of recent studies of the RSDSC by a new analytical method (Lazar, personal communication) found concentrations of about 1 �M P. Stiller and Nissenbaum (1999) found that particulate phosphorus was more variable, at 30-50 �g/l. The sediments were suggested to contribute between 30% and 58% to the phosphate input in the Dead Sea water column, the remainder being derived from the Jordan River and flood waters (Nissenbaum et al., 1990; Stiller and Nissenbaum, 1999). Another source of phosphorus to the Dead Sea is dust from the atmosphere. Dust deposition over a three-year period (1997-1999) varied between 25.5-60.5 g/m2.year. The average phosphorus content of this dust was 1.2% (calculated as P2O5), present mainly as apatite. The value was especially high during the winter months (an average of 2.6% for December-February). Thus, between 4 and 10 mmol/m2 of phosphorus may be estimated to enter the Dead Sea annually from atmospheric dust (Singer et al., 2003). However, the bioavailability of this source is not known and was never studied.
Dissolved oxygen levels in Dead Sea water are low. Concentrations measured in the water column in 1987-1989 averaged around 0.8 ml/kg (equivalent to 1 ml/l or 1.4 mg/l) at all depths (Shatkay, 1991; Shatkay et al., 1993).

Best Available Data Report
RS-DS Water Conveyance Study Program
Z:\IL\201280\R10.054A\BAD_report_revised.doc November 24, 2010 7
The large chemical plants on the shores of the now dried basin of the southern Dead Sea (Dead Sea Works and Arab Potash Industry) impact not only on the water level of the Dead Sea, but also on its chemical composition. Potash (KCl) is the primary product of these industries, although magnesium and bromide products are also produced. The industries pump Dead Sea brine from the northern basin into shallow evaporation ponds constructed in the otherwise dry southern basin of the Dead Sea. As the brine evaporates, halite precipitates and at a density of about 1.3 kg/l carnallite (MgKCl3�6H2O) also begins to precipitate. In the factories, the latter is dissolved and potash is produced. About 50% of the volume initially pumped from the Dead Sea is conveyed back to the lake as concentrated "end brine" (TDS: 470-500 g/l; Density: 1.33-1.35 kg/l; Table 1). These brines consist mainly of Mg-Ca-Cl with low Na/Cl and K/Cl ratios of 0.02 and 0.01, respectively. The mixing of these brines, characterized by high Mg/K ratio, has resulted in a slight increase in this ratio in the Dead Sea (Fig. 4). Concurrent with this change is a decrease in the Na/Cl ratio, due primarily to halite precipitation from the Dead Sea, and to a lesser extent to precipitation in the evaporation ponds.
0.22
0.23
0.24
0.25
0.26
0.27
0.28
0.29
1950 1960 1970 1980 1990 2000 2010
Year
Na/
Cl
8.90
9.00
9.10
9.20
9.30
9.40
9.50
9.60
9.70
Mg/
K
Na/ClMg/K
Figure 4: Changes in the molar ratios of Na/Cl and Mg/K in the Dead Sea. The increase in the Mg/K
ratio is due to the harvesting of potassium by the potash industries. The decrease in Na/Cl ratio is due to halite precipitation from the Dead Sea which began in the 1980s. Halite precipitates also in the
evaporation ponds of the potash industries, a process that took place long before it began precipitating in the lake (Gavrieli and Oren, 2004).
2.4. Precipitation of Salts
Since the Dead Sea is a terminal lake, the major natural process that removes dissolved ions from the brine is mineral precipitation. The Dead Sea is presently saturated to oversaturated with respect to aragonite (CaCO3), anhydrite (CaSO4), gypsum (CaSO4·2H2O), and halite (NaCl) (Gavrieli et al., 1989). Kinetic factors which dominate over thermodynamic considerations dictate that gypsum (CaSO4·2H2O), rather than anhydrite is the actual Ca-sulfate mineral that

Best Available Data Report
RS-DS Water Conveyance Study Program
Z:\IL\201280\R10.054A\BAD_report_revised.doc November 24, 2010 8
precipitates from the Dead Sea brine. Prior to the 1979 overturn, the lower water body was saturated with respect to these minerals, whereas the upper water body was undersaturated with respect to halite and saturated to oversaturated with respect to aragonite, gypsum and anhydrite (Neev and Emery, 1967). Aragonite crystallized from the upper water body and settled to the bottom, forming the white laminae of the Dead Sea sediments, whereas gypsum crystallized on exposed and submerged surfaces along the shores. The "whitening" of the Dead Sea surface, which has been described by several observers before the overturn (Bloch et al., 1943; Neev and Emery, 1967), is attributed to spontaneous crystallization of aragonite, possibly with some gypsum, from the surface water. The Dead Sea sediments are thus characterized by alternating laminae of detrital material which precipitated following the winter flooding to the lake and laminae consisting mainly of aragonite with some gypsum which precipitated usually during summer. Similar sediments were also deposited by Lake Lisan, the late Pleistocene precursor of the Dead Sea (Begin et al., 1974), though the Lake Lisan sediments also had thick gypsum layers.
A comprehensive limnological study of the Dead Sea was carried out by Neev and Emery (1967) between the late 1950s and the early 1960s which described massive gypsum precipitation that was occurring from Dead Sea waters during that time. The precipitation of gypsum in the late 1950s was related to the negative water balance. However, by the early 1980s, gypsum accumulation rates were lower by three orders of magnitude compared with the rates recorded by Neev and Emery (1967) even though the negative water balance continued and even worsened. The reduction in gypsum accumulation rates were attributed to the reduction in the natural supply of SO4
2- due to the diversion of freshwater from the lake (Reznik et al., 2009b), the declining SO4/Ca ratio, and the decreasing solubility of gypsum in the brine.
In 1982, halite began to precipitate from the Dead Sea (Steinhorn, 1983), and its precipitation has continued nearly uninterrupted since then (Gavrieli, 1997). A decrease in halite precipitation rate was observed between 1992-3 and 1995. This was due to the 1991-1995 stratification which diluted the upper water body and isolated the lower water body (Beyth et al., 1993; Anati et al., 1995). Massive halite precipitation was restored following the November 1995 overturn. Under the current negative water balance of the lake and increasing salinity, halite will continue to precipitate from the brine. It should be noted that since 1982, any object suspended within the deeper Dead Sea brines was immediately covered by massive halite crystals. A somewhat similar situation existed in the 1960s when gypsum, rather than halite, quickly covered exposed surfaces, although this was limited only to the upper waters. The continuous precipitation of halite from the Dead Sea brine has resulted in a change in its Na/Cl ratio which over the years has slightly decreased (Fig. 4). It was suggested that even if gypsum precipitation still occurs in the Dead Sea, it is masked by the higher quantities of precipitated halite (Herut et al., 1998). In addition to the precipitation in the Dead Sea itself, halite (along with undetected amounts of gypsum) also precipitated in the artificial evaporation ponds constructed at the southern basin of the Dead Sea by the chemical industries.

Best Available Data Report
RS-DS Water Conveyance Study Program
Z:\IL\201280\R10.054A\BAD_report_revised.doc November 24, 2010 9
A comparison between current and 1960 mass of dissolved ions (Reznik et al., 2009b), shows that a significant decrease in Na+ and SO4
2- quantities occurred due to the precipitation of halite and gypsum, respectively. A proportionally smaller decrease was observed for Cl-, which is due to its relatively high concentrations in comparison to Na+ (Gavrieli, 1997). Similarly, Ca2+ concentration is not affected by the precipitation of gypsum because of the high Ca2+/SO4
2- ratio and low precipitation potential. Thus, no measurable change is detected in the weight of dissolved Ca2+ since 1960. Reznik et al. (2009b) estimated that ~ 36x108 ton of halite precipitated from the Dead Sea brine between 1960 and 2008. Assuming that this mass is spread homogeneously on the seafloor, it has by now accumulated to a thickness of ~2.5m. Following the same line of reasoning, it was estimated that 20x106 tons of SO4
2- has precipitated since 1960, resulting in a reduction of ~27% in the mass of dissolved SO4
2- in the lake. If all this mass precipitated as gypsum, ~ 35x106 tons of gypsum precipitated on the seafloor, accumulating to a total thickness of only ~2.5 cm, i.e. 2 orders of magnitude less than the halite accumulation. It should however be noted that the above values represent a maximal thicknesses, since some of the Na+ and SO4
2- were removed from the brine as halite and gypsum that precipitated in the evaporation ponds of the chemical industries.
The increasing Ca2+/SO4
2- ratio and salinity decrease the solubility of gypsum. Reznik et al. (2009b) showed that according to both theoretical considerations and experimental observations, the kinetics of gypsum nucleation and crystal growth are expected to slow down as the solubility decreases.
2.5. Dead Sea Hydrography
2.5.1. Monomictic vs Meromictic
At the time of the first in-depth study of the properties of the Dead Sea water column, conducted in 1959-1960 by the Geological Survey of Israel (GSI) (Neev and Emery, 1967), the lake was stratified (meromictic), and the southern basin was still flooded. A less saline upper water mass (around 300 g/l total dissolved salts, down to a depth of about 40 m) floated on top of a denser lower water mass (332 g/l total dissolved salts). The lower water mass was a layer of “fossil” water that had been isolated at least for several centuries (Steinhorn et al., 1979; Stiller and Chung, 1984). This lower water mass was anoxic, and contained sulfide.
With the increase in salinity of the upper water layers, the pycnocline that had existed during the meromictic state weakened. A complete overturn finally occurred in February 1979 (Beyth, 1980; Steinhorn and Gat, 1983; Steinhorn et al., 1979). The lower anaerobic and sulfide-rich "fossil" water mass ceased to exist, and the water column became homogeneous in composition.
Since 1979, periods of monomictic and meromictic regimes have alternated. In the monomictic state (1982-1991 and 1995-present), stratification develops and

Best Available Data Report
RS-DS Water Conveyance Study Program
Z:\IL\201280\R10.054A\BAD_report_revised.doc November 24, 2010 10
overturn occurs annually (Anati and Stiller, 1991; Gertman and Hecht, 2002). Upper mixed layer (UML) is limited below by a stable pycnocline that develops in spring due to the warming of the upper water layer, or less commonly in late winter due to limited dilution of the water as a result of winter rain floods. During the summer months, the pycnocline is maintained by a stabilizing thermocline (generally located between 25 m and 30 m depth). Surface water temperatures may reach 35�C-36�C, while the temperature of the water mass below the thermocline remains stable in the range of 22�C-23�C. This stabilizing thermocline is large enough to balance the destabilizing halocline that is formed during the summer months as a result of evaporation from UML. Overturn occurs following the autumn-cooling of the UML and the consequent increase in its density. Following Anati and Stiller (1991) and Anati (1997, 1998), these cycles are presented on a temperature-salinity diagram, demonstrating the gradual increase in the salinity and temperature over the years (Fig. 5). For convenience the salinity in the Dead Sea is commonly expressed in the quasi-salinity units of �20 whereby:
�20 = ��20-1000)*1000 [kg m-3]
where �20 is the density at 20�C, calculated from the measured density (�T kg m-3) using the thermal expansion coefficient for the Dead Sea brine (Steinhorn, 1980):
��/�T = -0.4309�0.0005 kg m-3/�C:
The monomictic regime has been interrupted by two short meromictic episodes from 1979-1982 and again from 1992-1995 (Anati, 1997; Anati and Stiller, 1991; Anati et al., 1987; Gavrieli et al., 1999; Gertman and Hecht, 2002; Stiller et al., 1984). This was the result of a massive inflow of fresh water during unusually rainy winters. During the winter of 1980, the surface level rose by almost 1.5 m, and an even more dramatic rise in surface level of nearly 2 m occurred between November 1991 and May 1992, when approximately 1.5x10⁹ m3 of fresh water entered the lake, causing a dilution of the upper 5 m of the water column to about 70% of their previous salinity (Beyth et al., 1993). During the subsequent three years, lake level dropped while the upper water became more saline and the thermocline and halocline deepened, before the overturn took place in 1995 (Anati et al., 1995).

Best Available Data Report
RS-DS Water Conveyance Study Program
Z:\IL\201280\R10.054A\BAD_report_revised.doc November 24, 2010 11
Figure 5: A T-S diagram showing the evolution of the deep the Dead Sea brine at depth below 100 meters during meromictic (1979-1982) and holomictic periods 1983-1988. The diagonal lines denote potential density anomaly from 1000 kg m-3. Open circles denote stratified states, and full circles denote mixed states.
2.5.2. Recent Trends in Salinity and Temperature
The recent trends in salinity and temperature of the Dead Sea are depicted in Figs. 6 and 7. Fig. 6 shows the trends in salinity and temperature of the Dead Sea's upper mixed layer (above 20 m depth) during the last holomictic period (1998-2010). The salinity increase during the inter-annual scale, while an annual cycle exists with a lower salinity, is achieved following the overturn in the winter. An exceptionally low salinity was recorded during the winter of 2003, following large inflows through the Jordan River and a level rise of 65 cm which was accompanied by dilution of the Dead Sea brine. Fig. 7 presents the averaged quasi-salinity and temperature of the Dead Sea deep water body (below 100 m depth) during the last holomictic period (1992-2010). Note that the temperature increased between 1996 to 2002 by 0.2-0.3°C/yr (Hecht and Gertman 2003). Since then, the temperature has remained in the same range between winters and summers (22.5°C-24.2°C). During the same holomictic period, the salinity of the deep water increased annually by about 0.3 kg/m3/yr (Gertman and Hecht 2002), corresponding to a salinity increase of 0.24 g/kg/yr, except for the rainy year of 2003.

Best Available Data Report
RS-DS Water Conveyance Study Program
Z:\IL\201280\R10.054A\BAD_report_revised.doc November 24, 2010 12
Figure 6: Averaged quasi-salinity (sigma 25) and temperature of the Dead Sea Upper Mixed Layer (above 20 m depth) during last holomictic period
Figure 7: Averaged quasi-salinity (sigma 25) and potential temperature of the Dead Sea Deep Water
Body (below 100 m depth) during last holomictic period.
2.5.3. Currents
Little is known about the currents of the Dead Sea. The first systematic survey of currents was performed in 2009-2010 and the observations were performed in the southwestern part of the Dead Sea (Lensky et al., 2010 a,b). The main findings, based upon three short campaigns are as follows:

Best Available Data Report
RS-DS Water Conveyance Study Program
Z:\IL\201280\R10.054A\BAD_report_revised.doc November 24, 2010 13
� Based upon drifters that were carried by horizontal currents at depths of 4-6 m and reported their location and time, an average velocity of 6.3 cm/s was found, with maximum recorded velocity of 18.0 cm/s (95% of the velocity records are below this value). The drifters were forced by a general cyclonic circulation (counterclockwise).
� Data collected by Acoustic Doppler Current Profiler (ADCP) indicate that the current velocity field has a seasonal variation, with a two-layer structure during summer and a vertically uniform velocity field during winter. The two-layer structure is identified by high velocities of up to 14 cm/s at the upper layer, with a sharp decrease of current velocity and reversal of the current direction below the depth of the picnocline of 25 m -30 m (the depths where the density changes rapidly over a short distance). At this deeper layer the maximum current velocity is only 5 cm/s. During winter, the currents are vertically uniform (more than 60 m from surface to bottom) with a maximum of 14 cm/s.
� During weak winds, the geostrophic stream is concentrated in a narrow band, approximately 1 km wide, close to the western shore. In the southwestern bay, an along-shore cyclonic circulation is dominated. Intensification of the north wind (directed southwards) leads to intensification of southward currents along the western shore. At the southern end of the bay the strong wind masks the cyclonic circulation northward along the eastern shores and drifters became stranded along the south shore.
It should be re-emphasized that these data are limited to the southwestern tip of the Dead Sea when collected during short campaigns, and in no way does it represent the bulk behavior of the lake.
2.5.4. Remote Sensing of the Dead Sea Surface 2.5.4.1. Sea Surface Temperature (SST)
Knowledge of the Dead Sea thermal and saline structure is based upon meteorological and hydrological measurements from a single site at a time. Recently, Nehorai et al., 2009 used satellite and in situ data to characterize the spatial and temporal variations of the Dead Sea SST and to explore the causes for these variations. Sequences of almost continuous individual satellite images were transformed into a time series of parameters representing the spatial distribution of SST. Also used were in situ measured bulk SST, wind speed, solar radiation, and water temperature profiles with depth. To apportion pixel coverage of the Dead Sea surface into polygons (Fig. 8), the Theissen polygon method is used (Thiessen, 1911). Analysis of this data set shows strong diurnal (Fig. 9) and seasonal (Fig. 10) variations of the surface and vertical temperature field and the meteorological forcing. The temperature field is heterogeneous after noon, when radiation is high

Best Available Data Report
RS-DS Water Conveyance Study Program
Z:\IL\201280\R10.054A\BAD_report_revised.doc November 24, 2010 14
and wind speed is low and thermal layering develops. The temperature field is homogeneous during the nighttime, when solar radiation is absent and the high wind speed vertically mixes the upper layer (Nehorai et al., 2009).
Figure 8:. Location of 16 MSG pixels (gray polygons). The numbers in the map refer to the following:
1, the Jordan River inlet; 2, the reject brine inlet; 3, En Gedi; 4, the buoy (located at the star). The letters N, C, and S stand for the northern, central, and southern pixels, respectively.
The diurnal cycle is depicted in Fig. 9 and the seasonal cycle is depicted in Fig. 10 on the following pages.

Best Available Data Report
RS-DS Water Conveyance Study Program
Z:\IL\201280\R10.054A\BAD_report_revised.doc November 24, 2010 15
Figure 9: Diurnal cycle of (after Nehorai et al., 2009)
(a) SST; (b) the deviation of the northern, central, and southern pixels from the average (see locations in Fig. 8); (c) the standard deviation of SST; and (d) the wind speed and solar radiation.

Best Available Data Report
RS-DS Water Conveyance Study Program
Z:\IL\201280\R10.054A\BAD_report_revised.doc November 24, 2010 16
Figure 10: Seasonal variations of the diurnal cycle (after Nehorai et al., 2009)
The spatial variations of SST (a & b), and wind speed and solar radiation (c):
(a) standard deviation of SST and (b) deviation of the northern, central, and southern pixels (see locations in Fig. 8) from the average. (c) Wind speed and solar radiation.
2.5.4.2. Total Suspended Matter (TSM)
The information on TSM is derived from radiation reflected by suspended matter at the upper few meters. TSM was calculated using MODIS band 1 (0.645 �m) 250 m data (Miller and Mckee, 2004). The source of the suspended matter is apparently from wave abrasion on the silty shored of the Dead Sea, as can be seen from the "rim" of high TSM content along the Dead Sea shores (red color in Fig. 11). High TSM content is located in the southwest end of the Dead Sea, (Lensky et al., 2010b). This means that suspended matter tends to be trapped in the southwestern tip of the Dead Sea. This was already identified by the naked eye, as demonstrated in Fig. 12, from a photo taken by helicopter above this site.

Best Available Data Report
RS-DS Water Conveyance Study Program
Z:\IL\201280\R10.054A\BAD_report_revised.doc November 24, 2010 17
Figure 11: TSM images from MODIS. Note the high values of TSM (red) in the southwestern part of the Dead Sea at all captures. Note that each frame has its own range of values - i.e., colors are not
comparable.

Best Available Data Report
RS-DS Water Conveyance Study Program
Z:\IL\201280\R10.054A\BAD_report_revised.doc November 24, 2010 18
Figure 12: . Aerial photo of the area of pump station P88, taken from a helicopter on 16 July 2007. Note the brighter turbid appearance of the southern part of the bay due to suspended matter and the
sharp interface with the main water body.
2.6. Energy and Mass Balance
The existing estimations for the water balance of the Dead Sea are widely variable, reflecting the unknown subsurface water inflow, the rate of evaporation and the rate of salt accumulation at the lake bottom. Natural water inflows to the Dead Sea during the first half of the 20th century were estimated to be in the range of 1600-2000 MCM per year (Neumann, 1958; Klein, 1998; Salameh and El-Naser, 1999). The volume of water reaching the Dead Sea today is substantially lower, with estimates varying between <325 MCM/yr (Lensky et al., 2005) to >1000 MCM/yr (Salameh and El-Naser, 1999). The difference (>500 MCM/yr) is due to different estimations of the unobserved subsurface inflow. The suggested higher inflow is based upon a higher estimation of evaporation rate (2 m/yr, from pan evaporation) (Salameh and El-Naser, 1999). A much lower evaporation rate, 1.05 m/yr, was estimated for the Dead Sea based upon an energy balance for the period of 1980s and 1990s (Stanhill, 1994).
Reliable determination of the water balance of hypersaline lakes in general and that of the Dead Sea in particular are more complicated than similar freshwater bodies due to two major factors:
P88
Wadi Ze'elim
P
9

Best Available Data Report
RS-DS Water Conveyance Study Program
Z:\IL\201280\R10.054A\BAD_report_revised.doc November 24, 2010 19
1) Difficulty in determining the amount of evaporated water due to reduced
water activity and rate of evaporation: Evaporation from brine surface is less than that from a freshwater surface because the dissolved salts lower the free energy of the water molecules and hence the saturation vapor pressure above the brine. The activity coefficient of water (H2O), , represents the ratio between vapor pressure above a brine surface and vapor pressure above a freshwater surface at the same temperature (Stumm and Morgan, 1981). The activity of freshwater is =1 by definition, while in hypersaline brines <1 (for the present Dead Sea composition, ~0.67). Accordingly, the rate of evaporation from such water bodies is not equivalent to that from freshwater under similar conditions (Salhotra et al., 1985; Salhotra et al., 1987; Steinhorn, 1991).
2) Difficulty in determining the net water deficit: The decline in the water level of a hypersaline chemically-saturated lake which precipitates salts does not represent the true change in the volume of the lake because the accumulation of the salts effectively raises its floor. The water deficit is therefore larger than it appears from simple level changes.
To resolve the long term evaporation rate and water balance of the Dead Sea, Lensky et al. (2005) adopted the energy budget method, which is considered the preferential technique for long term monitoring (Winter et al., 2003). A somewhat similar but simplified approach was applied to the Dead Sea by Stanhill (1994) and Neumann (1958) utilizing a limited data set. Lensky et al. (2005) formulated a simultaneous determination of the energy, water and salt balances for hypersaline lakes. This approach requires reliable meteorological and limnological data, which is available from a hydro-meteorological buoy in the center of the Dead Sea since 1992. The analysis was performed during 1996-2001 which reflects dry years without exceptional floods. Salt precipitation during this period was calculated to be about 0.1 m/yr (per m2) while the average annual inflow was estimated to be in the range of 265-325 MCM/yr. The mass and energy balances yielded evaporation rate of 1.1-1.2 m/yr. Higher inflows, suggested in previous studies, calls for an increased evaporation rate and are therefore not in line with the energy balance.
2.7. Life in the Dead Sea
Although the presence of indigenous life in the Dead Sea was discovered in 1936, there is very little insight in the types of organisms present in the lake and their dynamics prior to the 1979 overturn of the water column. Quantitative information on the density and vertical distribution of unicellular algae (Dunaliella) and prokaryotes (red halophilic Archaea and different types of Bacteria) is entirely lacking, with the exception of some data collected during 1963-1964. A single record of Dunaliella cell numbers (4x10⁴ cells/ml surface water) suggests algal densities higher than ever recorded since the systematic monitoring of the biology of the lake started in 1980. Numbers of red Archaea

Best Available Data Report
RS-DS Water Conveyance Study Program
Z:\IL\201280\R10.054A\BAD_report_revised.doc November 24, 2010 20
were also quite high in most samples, with densities up to 8-9x10⁶/ml (Kaplan and Friedmann, 1970).
Dense microbial blooms were observed in the Dead Sea in 1980 and in 1992, in both cases triggered by a massive inflow of fresh water from winter floods and from the Jordan River. The unicellular green alga Dunaliella was the sole primary producer in these blooms, and respectively up to 8.8x10³ cells/ml and 1.5x10⁴ cells/ml surface water were counted (Oren and Shilo, 1982; Oren et al., 1995a). Development of algae was followed by dense blooms of red halophilic Archaea (family Halobacteriaceae). Their massive growth (cell numbers up to 1.9x10⁷/ml in 1980 and up to 3.5x10⁷/ml in 1992) led to a reddish coloration of the entire lake, caused by the carotenoid pigments of these organisms (50-carbon bacterioruberin derivatives), and possibly by retinal pigments as well (bacteriorhodopsin) (Oren, 1983a, 1983b, 1985; Oren and Gurevich, 1995). Simulation experiments in the laboratory and in outdoor ponds showed that two conditions must be fulfilled for such microbial blooms to develop in the Dead Sea; the upper water layers must become diluted by at least 10% (by volume) of fresh water, and phosphate must be available (Oren and Shilo, 1985). Phosphorus is the limiting factor for microbial development in the Dead Sea water column, as nitrogen is abundantly available in the form of ammonium. The Dunaliella bloom probably starts in the surface sediments with the germination of thick-walled cells (zygotes?) present there as resting stages (Oren et al., 1995a) as was ascertained in a remote sensing study (Oren and Ben-Yosef, 1997).
The increase in salinity of the upper water layers, followed by renewed overturns of the water column in 1982 and in 1996 starting new holomictic periods, led to the disappearance of the microbial bloom communities. In the period between the two blooms, no Dunaliella cells were observed in the water, and prokaryote numbers and activities were very low (Oren, 1992).
A number of new species of halophilic Archaea, well adapted to life in the high-magnesium brines of the Dead Sea, were isolated from the lake and characterized. These include Halorubrum sodomense isolated during the 1980 bloom (Oren, 1983a), Halobaculum gomorrense from the 1992 bloom (Oren et al., 1995b), and the species Haloarcula marismortui and Haloferax volcanii, isolated before 1980. Different types of bacteria were also recovered from the lake, but the importance of bacteria in the microbial communities in the lake is probably minor.
Some information is available on the type(s) of Archaea that dominated the communities in the lake in different periods. During the 1992 bloom, analysis of polar lipids extracted from the community showed that genera such as Halobacterium, Halorubrum, Haloferax and Haloarcula were probably not among the dominant types (Oren and Gurevich, 1993). More information came from recent metagenomic studies analyzing DNA isolated from samples of the microbial communities collected in 1992 and in 2007. One phylotype, remotely related to the genus Halobacterium, was found to dominate in 1992, while the very sparse community in 2007, collected long after the 1992 bloom had finally declined, was quite diverse, with representatives of the genera Haloplanus,

Best Available Data Report
RS-DS Water Conveyance Study Program
Z:\IL\201280\R10.054A\BAD_report_revised.doc November 24, 2010 21
Halorhabdus, and others (Bodaker et al., 2010). These metagenomic studies confirmed the low importance of bacteria in the Dead Sea microbiota.
The viruses are a rather neglected component of the microbial food chain in the Dead Sea. Halophilic Archaea are host to viruses, and in most aquatic ecosystems the numbers of viruses or virus-like particles exceed the number of prokaryotic cells by at least an order of magnitude. The Dead Sea is no exception. Microscopic enumeration during the time of the decline of the bloom that started in 1992 showed numbers of 107-108 virus-like particles per ml (Oren et al., 1997). What the impact of viruses may be on the dynamics of the microbial communities in the Dead Sea was never ascertained.
An interesting feature of the pre-1979 water column, related to biological phenomena, was the anaerobic nature of the lower water mass below the pycnocline. The anaerobic hypolimnion contained sulfide, and the isotopic composition of this sulfide (enriched in light sulfur isotopes as compared with the sulfate present) indicates the probable origin of this sulfide from bacterial dissimilatory sulfate reduction (Nissenbaum and Kaplan, 1976). In spite of many attempts, the isolation and characterization of sulfate-reducing prokaryotes from the bottom sediments of the Dead Sea never succeeded. However, investigations of anaerobic processes in the bottom sediments of the Dead Sea led to the isolation of several novel types of fermentative bacteria, including Halobacteroides halobius (Oren et al., 1984), Sporohalobacter lortetii (Oren, 1983c), Orenia marismortui (Oren et al., 1987), and the selenate respiring Selenihalanaerobacter shriftii (Switzer Blum et al., 2001).
Since the lake became holomictic in 1979 and oxygen penetrated down to the lake bottom, no anaerobic layer has been observed in the Dead Sea water column. The short meromictic episodes (1980-1982, 1992-1996) did not lead to the formation of an anaerobic hypoliminion, although indications were obtained for a slow consumption of oxygen below the pycnocline (Oren et al., 1995a). Much of the lake bottom is now covered by a solid layer of halite, and therefore any microbial activities in the sediments that may occur below will have very little impact on the properties of the Dead Sea water column. Little or no halite is present in the shallow sediments, but hardly anything is known about any microbiological activities in this environment.
An understanding of the microbiology of the Dead Sea, based mainly on the observations during the 1980 and 1992 microbial blooms in the lake, has been summarized in several review articles (Oren, 1988, 1997, 1999, 2000, 2003).

Best Available Data Report
RS-DS Water Conveyance Study Program
Z:\IL\201280\R10.054A\BAD_report_revised.doc November 24, 2010 22
2.8. Expected Impact due to RSDSC
2.8.1. Modeling of the Dead Sea
Over the last few years, the GSI has been in the process of formulating limnological models for the Dead Sea. The models’ aims are to provide long term forecasts for the evolution of the lake, future trends and quantitative description of the long term changes in the water column structure and composition with and without seawater or freshwater inflows (Gavrieli et al., 2006, Dvorkin et al., 2007). Formulating a limnological model for the Dead Sea is a highly challenging task. The dynamics of any water body is primarily dictated by density differences (aside from winds) and these are therefore the basis for the modeling of such systems. Density differences in natural systems commonly do not exceed a few percent, and are often much smaller, yet are sufficient to drive ocean circulation, stratification, etc. The density difference in the Dead Sea is much larger, and exceeds 20% between the Dead Sea brine and freshwater that discharges into the lake. Such a huge density difference does not exist in marine systems, and the dynamics of mixing such a water body is not available in limnological and oceanographic models. The extremely high density of the Dead Sea brine and its unique composition (Ca-Chloride) requires developing a new equation of state. This equation should take into account the continuous change of the Dead Sea’s composition due to both halite precipitation from the brine and the addition of the end brines from the potash industries (Fig. 13). The change will be much more pronounced once seawater mixes into the Dead Sea. The supply of sulfate from seawater will lead to gypsum precipitation. Thus, a simple equation of state that correlates the salinity of the brine with its density, such as formulated by Anati (1997) for the specific composition of the Dead Sea at the time of measurement, cannot be used in the Dead Sea when considering its long term evolution. Any model that tends to describe such long term evolution must use an equation of state that takes into account the compositional changes of the brine. The effect of chemistry and salt precipitation on the stratification of the Dead Sea is a first order effect that must be taken into account in Dead Sea simulations (Gavrieli et al., 2006). During model runs, once over-saturation is established, the model should "precipitate" the appropriate amount of salt to re-attain saturation with respect to this particular salt. In addition, the amount of salt that precipitates from the brine and accumulates at the bottom of the lake must be recorded. The latter is then translated into volume of salts that raises the seafloor and therefore impacts on the water level of the lake (Lensky et al., 2005).
The Dead Sea models being developed in the GSI (Gavrieli et al., 2002, 2003, 2006, Dvorkin et al., 2007) are the products of modifications to open codes that are within the public domain and are in wide use by the international community. The new models will be multicomponent (include eight ions). These models will

Best Available Data Report
RS-DS Water Conveyance Study Program
Z:\IL\201280\R10.054A\BAD_report_revised.doc November 24, 2010 23
use a unique equation of state, and will include chemistry modules that will determine the degree of saturation of three salts (halite, gypsum and carnallite) and will precipitate the salts when oversaturation is attained. Calibration of the models will be based upon the data set available from the present conditions of the Dead Sea in combination with new insight into the mass and energy balances of the lake. The available data set for such calibration spans the years 1992-2010 (with some gaps), and includes data on the stratification of the water column between 1992 and 1995. It must be emphasized that no data exist for calibrating the model with seawater inflow with respect to the development of stratification and other physical characteristics.
The 1D Dead Sea model is based upon 1D Princeton Oceanographic Model (1D-POM). The 2D Dead Sea model will be based upon is the CE-QUAL-W2 (Cole and Wells, 2008). A 3D Dead Sea model will be based upon 3D Princeton Oceanographic Model (3D-POM).
Following its modification, the new 1D code was termed 1D-DS-POM (Gavrieli et al., 2006). The turbulent closure scheme of the 1D-POM was simplified as outlined in Gavrieli et al. (2006). Initial uncalibrated 1D-DS-POM runs show that each module is well integrated and that the modules work in harmony (Dvorkin et al., 2007). Some of these modules have already been incorporated in the 2D model. However, both models still need to be tested for the basic assumptions and calibrated with the available data.

Best Available Data Report
RS-DS Water Conveyance Study Program
Z:\IL\201280\R10.054A\BAD_report_revised.doc November 24, 2010 24
Figure 13: Schematic representation of the new multicomponent chemistry-based 1D-DS-POM and the interaction of the various modules developed for the model with the central code and with each other. The algorithm and coding of all modules were done in the GSI. The turbulent closure in the
basic 1D-POM was also modified.
The descriptions of the unique features that are incorporated in the 1D-DS-POM are presented in the report of Gavrieli et al. (2006). This model takes into account the following features:
Incorporation of mass and energy balances. A multicomponent model (and not the salinity-based). A new equation of state. Thermodynamics and calculations of the degree of saturation. Salt precipitation.
The importance of salt precipitation in modeling the Dead Sea is shown in Fig. 14, by two (uncalibrated) model runs, with and without halite precipitation. As is evident from the surface salinity, in the run with no salt precipitation the water column overturns at higher salinity and at about forty days earlier. The final salinity is also higher as compared with the salt precipitation runs. It should also be noted that the salinity of the surface water in the run with salt precipitation does not remain constant despite salt precipitation. Rather, it reflects salt precipitation which is determined thermodynamically, and is a function of the composition and temperature of the brine at any given moment.

Best Available Data Report
RS-DS Water Conveyance Study Program
Z:\IL\201280\R10.054A\BAD_report_revised.doc November 24, 2010 25
276
277
278
279
280
281
0 100 200 300
Time, days since 1.1.1998
Sur
face
Sal
inity
, g K
g-1
1D-DS-POM with no salt precipitation
1D-DS-POM with salt precipitation
a.
-412.0
-411.8
-411.6
-411.4
-411.2
-411.0
-410.8
0 100 200 300Time, days since 1.1.1998
Wat
er le
vel,
m
1D-DS-POM with no salt precipitation
1D-DS-POM with salt precipitation
b.
Figure 14: : a) Calculated surface salinity and b) water level from one year uncalibrated runs of 1D-POM-DS with and without thermodynamic salt precipitation.

Best Available Data Report
RS-DS Water Conveyance Study Program
Z:\IL\201280\R10.054A\BAD_report_revised.doc November 24, 2010 26
Unique features of the CE-QUAL-W2 model for the Dead Sea include the following features: Salt precipitation chemistry and prediction of accumulation of halite,
carnallite, and gypsum (same as in the DS-1D-POM). The CE-QUAL-W2 model computes change in cell dimensions as salts accumulate and computes the volume change as a result of precipitation.
New dissolved state variables Na, K, Ca, Mg, Cl, Br, HCO3, and SO4 and the solids halite, carnallite, and gypsum. The solid particles have a range of particle sizes and hence settling velocities. The model computes concentrations in both mass and molality concentrations.
New equation of state (same as in the DS-1D-POM). Evaporation as a function of wind speed, temperature and water activity.
Water activity computed from equilibrium chemistry concepts (same as in the DS-1D-POM).
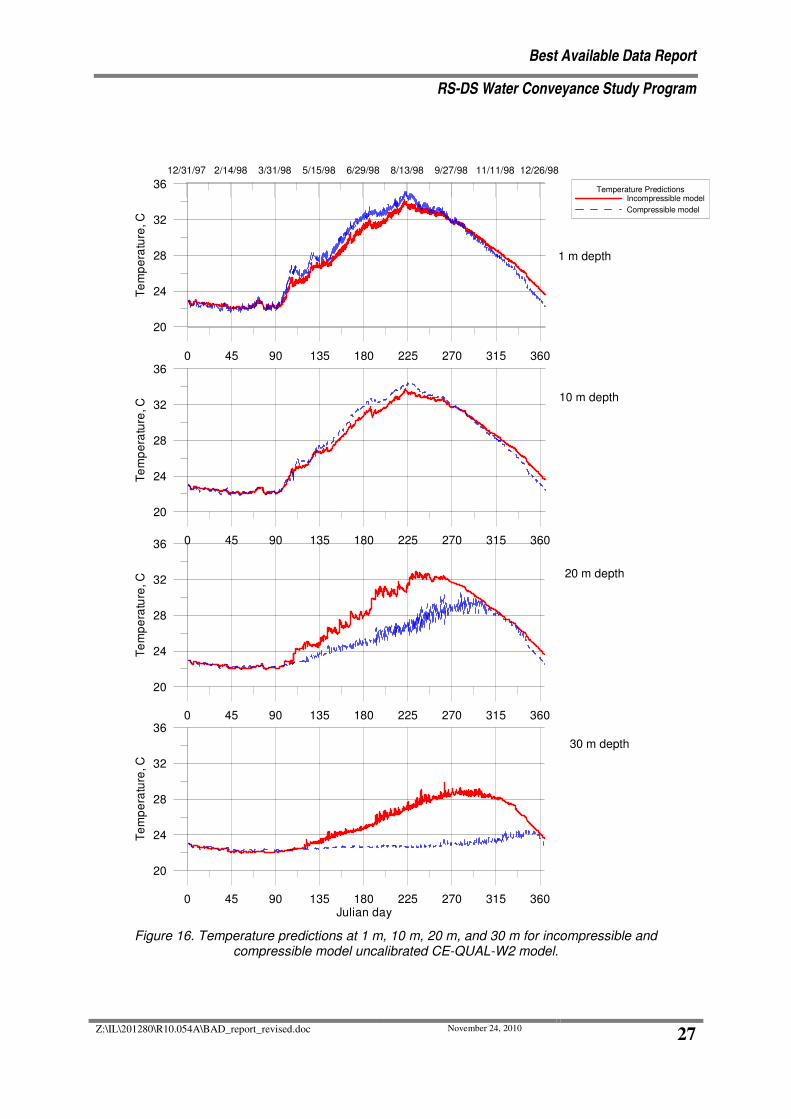
Revised governing equations as a result of compressibility. An uncalibrated model run compared the assumption of compressibility compared to incompressibility is shown in Figs. 15 and 16 for water level and for temperature at various depths (Wells, 2009).
Algae and bacterial dynamics as a function of salinity (or density). The model assumes a Monod type approach for limiting growth as a function of salinity/density.
Revised thermodynamic constants for the Dead Sea, such as latent heat of vaporization and specific heat at constant pressure.
0 25 50 75 100 125 150 175 200 225 250 275 300 325 350 375Julian day
-410.9
-410.8
-410.7
-410.6
-410.5
-410.4
Wat
er le
vel,
m
Water level comparisonIncompressible modelCompressible model
Figure 15: Computed water levels from an uncalibrated CE-QUAL-W2 model using the incompressible model compared with the compressible model illustrating differences arising from the
assumption of compressibility.
Best Available Data Report
RS-DS Water Conveyance Study Program
Z:\IL\201280\R10.054A\BAD_report_revised.doc November 24, 2010 27
0 45 90 135 180 225 270 315 360
20
24
28
32
36
Tem
pera
ture
, C
12/31/97 2/14/98 3/31/98 5/15/98 6/29/98 8/13/98 9/27/98 11/11/98 12/26/98
Temperature PredictionsIncompressible modelCompressible model
0 45 90 135 180 225 270 315 360Julian day
20
24
28
32
36
Tem
pera
ture
, C
0 45 90 135 180 225 270 315 360
20
24
28
32
36
Tem
pera
ture
, C
1 m depth
10 m depth
30 m depth
0 45 90 135 180 225 270 315 360
20
24
28
32
36
Tem
pera
ture
, C
20 m depth
Figure 16. Temperature predictions at 1 m, 10 m, 20 m, and 30 m for incompressible and
compressible model uncalibrated CE-QUAL-W2 model.

Best Available Data Report
RS-DS Water Conveyance Study Program
Z:\IL\201280\R10.054A\BAD_report_revised.doc November 24, 2010 28
2.8.1.1. Non-calibrated 1D-DS-POM scenario runs with freshwater
To attain initial insight on the impact of major changes in the inflow volumes to the Dead Sea, several long term (50 years) hypothetical scenarios with different freshwater inflow volumes were carried out (Gavrieli et al., 2006). The exact results of the simulations (e.g. water level, salinity, composition, temperature) are of lesser importance and cannot be used as a basis for planning since the code is not yet calibrated. It should be noted that since the results presented below were first published, the code was (and still is) being modified to correct for the box-like structure in the previous version and a new remeshing scheme was introduced to ensures full mass conservation (over decades) rather than interpolation.
Input data in all long-term simulations have been the 1998 meteorological data, repeated every year (50 times). All simulations assume the continued operation of the potash industries, which includes pumping of some 525 MCM/yr of Dead Sea brine and the discharge of 240 MCM concentrated end brines to the lake. Simulations begin in 1998 with a freshwater inflow volume of 350 MCM/yr, which is maintained until year 2020, when the inflow volume changes. The simulations then continue for an additional 30 years with different but constant freshwater inflow volumes, ranging between no inflows (0 MCM/yr) and 1500 MCM/year.
Fig. 17 presents the results of water level change over the 50 year runs. During the first 20 years, water level continues to decline at approximately the present daily rate. Following the hypothetical blockage of all inflow volumes in the year 2020, the rate of water level drop is enhanced, in line with the expected response of the lake. Of the runs presented, the closest to stabilizing the level, with some water level rise, is the 1300 MCM/yr run (i.e., an additional freshwater inflow of 950 MCM/yr).

Best Available Data Report
RS-DS Water Conveyance Study Program
Z:\IL\201280\R10.054A\BAD_report_revised.doc November 24, 2010 29
-480
-470
-460
-450
-440
-430
-420
-410
-400
2000 2010 2020 2030 2040 2050
Time, years
Leve
l, m
abo
ve M
SL
0.0 MCM/yr
350 MCM/yr
700 MCM/yr
1100 MCM/yr
1300 MCM/yr
1500 MCM/yr
Figure 17: Calculated long-term water levels from 1D-DS-POM uncalibrated runs with various freshwater inflows. All runs begin with inflow volume of 350 MCM/yr which continues until year 2020, when a new inflow volume is introduced. In all runs the potash industries pump 525 MCM/yr of Dead
Sea brine and discharge 240 MCM/y of concentrated end-brines.
Fig. 18 presents the change in surface and bottom layer densities for these runs. As long as the present conditions are kept constant, surface density continues to rise, and the annual monomictic behavior of the lake is maintained. However, when additional water inflow is allowed into the lake to stabilize the lake level or raise it, long term stratification develops. Once stratification is established, the upper water column becomes progressively less saline. In turn, as more brine is pumped by the potash industry from the concentrated lower water column, its thickness slowly decreases, while density rises. The latter changes in the lower water body are due to pumping by the industries and to the inflow of end brine, some of which sink to the bottom layer, respectively.

Best Available Data Report
RS-DS Water Conveyance Study Program
Z:\IL\201280\R10.054A\BAD_report_revised.doc November 24, 2010 30
1100
1120
1140
1160
1180
1200
1220
1240
1260
1280
1300
2000 2010 2020 2030 2040 2050
Time, years
Den
sity
kg
m-3
0.0 MCM/yr
350 MCM/yr
700 MCM/yr
1100 MCM/yr
1300 MCM/yr
1500 MCM/yr
a.
1235
1240
1245
1250
1255
1260
1265
1270
1275
1280
2000 2010 2020 2030 2040 2050Time, years
Den
sity
, kg
m-3
0.0 MCM/yr
350 MCM/yr
700 MCM/yr
1100 MCM/yr
1300 MCM/yr
1500 MCM/yr
b.
Figure 18: Calculated long-term a) surface and b) near-bottom densities from 1D-DS-POM runs with various freshwater inflows. Note that stratification and dilution of the surface water develop also with inflow volumes that result in a relatively constant water level (1300 MCM/yr) and even in slow water
level decline (1100 MCM/yr). During stratification, the density of the deep brine rises due to the industrial end brines that sink to the lower water layer

Best Available Data Report
RS-DS Water Conveyance Study Program
Z:\IL\201280\R10.054A\BAD_report_revised.doc November 24, 2010 31
The simulations (uncalibrated) with freshwater point to the following three major insights: 1) Stabilizing the water level of the Dead Sea while the industries continue to
operate requires inflow volumes that are beyond the volumes that evaporate from the surface of the lake. The required increased inflows are likely to result in the development of long-term stratification (meromixis) of the water column.
2) Over the long run, stabilizing the water level of the Dead Sea while the industries operate will be accompanied by continuous decrease in surface density (assuming that the industries withdraw their brine from the concentrated lower water column). This non-steady state condition under stable water level is due to the net withdrawal of Dead Sea brine and salts by the chemical industries. Under such a scenario, the water added to the surface layer has to compensate for both evaporation and for brine withdrawal from the deeper waters. The excess inflow water over evaporation will thus have the effect of continuously diluting the surface water. Furthermore, because of the withdrawal, the volume of the lower water will shrink, whereas that of the upper water layer will increase.
3) Due to the dilution of the surface water, rate of evaporation increases with time, thereby increasing net evaporation volumes. Thus, to maintain a constant water level, it will be necessary to continuously increase freshwater inflow volume.
It should be pointed out that stratification develops even in the 1100 MCM/yr run, while water level continues to decline, though at a significantly slower rate. Water level decline in this run is due to the overall excess water removal from the Dead Sea (through direct evaporation plus the industries) over inflow. The stratification develops due to the significant excess freshwater inflow over direct evaporation.
It is re-emphasized that the run results presented above were carried out with an uncalibrated code which has since been further modified. Furthermore, in the above simulations, increased inflow is freshwater, whereas inflow of similar volumes of seawater or reject brine will add salts. This will offset some of the decline in surface salinity of the stratified lake. Better estimates for the impact of increased volumes of fresh and saline inflows will be attained when scenarios will be run with a calibrated and updated model.
2.8.2. Mineral Precipitation
Mixing between the gypsum-saturated Ca-enriched Dead Sea brine and the SO4-rich seawater (or reject brine from a desalinization plant) is bound to result in gypsum precipitation. If the gypsum does not settle quickly to the bottom, it may influence the general appearance of the Dead Sea by "whitening" the surface water. Such a phenomenon is likely to occur if massive nucleation and growth of minute gypsum crystals will occur. "Whitening" of the Dead Sea was first

Best Available Data Report
RS-DS Water Conveyance Study Program
Z:\IL\201280\R10.054A\BAD_report_revised.doc November 24, 2010 32
described by Bloch et al. (1944) who observed that the surface water of the Dead Sea turned milky white as a result of massive precipitation of mainly calcium carbonate (CaCO3). The turbidity gradually decreased over a period of three months until the Dead Sea regained its clearness. If a similar "whitening" phenomenon, though with gypsum precipitate, will accompany the discharge of seawater or desalination plant reject brine to the Dead Sea, and the lake will remain turbid for a prolonged period of time, it will change the appearance of the lake, and may lead to changes in the lake's physical parameters, such as heat balance, albedo and evaporation rate. The duration of the "whitening" events, is likely to depend upon the nucleation and crystal growth kinetics, optical characteristics of the gypsum formed and their settling rate from the surface water.
The two basic processes of precipitation of minerals are: (1) nucleation, by which a new phase is formed, and (2) crystal growth during which the formed nuclei and crystals continue growing. The kinetics of both nucleation and crystal growth depend on numerous parameters, some of which are common to both. In order to better estimate the likelihood of "whitening" by gypsum due to inflow of seawater and/or reject brine from the proposed desalination plant, it is imperative to determine these parameters.
2.8.2.1. Thermodynamics
During the 1980s, in the framework of a proposed Mediterranean - Dead Sea canal, numerous studies were carried out on the mixing of SW with Dead Sea brine and its impact on the lake's physico-chemical properties (e.g., Ben-Yaakov and Katz, 1982, Katz et al., 1981, Krumgalz and Millero, 1982, Krumgalz and Millero, 1983, Levy and Kushnir, 1981, Levy, 1982, Levy, 1984, Mediterranean-Dead Sea Company, 1984). Katz et al. (1981) calculated the degree of saturation with respect to gypsum in mixtures of seawater and Dead Sea brine based upon an empirical solution they developed which yielded an apparent solubility. This approach lead to the understanding that the Dead Sea remains supersaturated with respect to gypsum, and does not reach close to equilibrium conditions as halite does. The empirical approach of Katz et al. (1981) did not account for activity coefficients or ion pair formation and association.
The saturation degrees of minerals in extremely saline waters such as the Dead Sea is commonly calculated using Pitzer's approach (Pitzer, 1979), which takes into account ion pair formation and association (Christoffersen et al., 1979). Pitzer's approach makes use of semi-empirical thermodynamic parameters which were derived from solutions containing a limited number of ion pairs and extrapolated to more complex solutions. Due to the empirical basis of the Pitzer's approach, it is important to validate its predictions when it is used for complex solutions such as Dead Sea brines and mixtures between seawater and Dead Sea brines.

Best Available Data Report
RS-DS Water Conveyance Study Program
Z:\IL\201280\R10.054A\BAD_report_revised.doc November 24, 2010 33
Krumgalz and Millero (1982; 1983) modified Pitzer's empirically derived parameters to suit the unique composition of the Dead Sea. However, since then, due to its negative water balance, the salinity of the Dead Sea has been rising continuously whereas its composition is changing due to salt precipitation and potash extraction (Gavrieli, 1997). Since thermodynamic parameters such as activity coefficients and degrees of saturation depend both on the ionic strength and the solution's ionic composition, the system's thermodynamics was recently reevaluated by Reznik et al. (2009a) using the USGS public PhreeqC code which incorporates the Pitzer's approach (Parkhurst and Appelo, 1999). Reznik et al. (2009a) showed that experimental observations at 25°±0.1°C and PhreeqC calculations of degrees of saturation with respect to gypsum (DSG) and gypsum precipitation potentials (PPT) agree well, over the large range but overall high ionic strength of Dead Sea-seawater mixtures. Preliminary unpublished data indicates that this agreement holds for the entire temperature range of Dead Sea surface water, which varies between 18ºC in winter to 35ºC in summer (Gertman and Hecht, 2002).
Figure 19 shows the expected DSG and PPT of Dead Sea-seawater mixtures at 25°C. For DS-SW mixtures in the temperature range of 15°C-35°C, maximal DSG and PPT values are attained at DS fraction (DSF) of 86%-88% and 69%-73%, respectively, with values increasing with decreasing temperatures. Further decreases in DSF results in lower DSG's and PPT's, until equilibrium (DSG=1) is attained at DSF of 35%-39%. For the DS-concentrated seawater mixtures in the temperature range of 15°C-35°C, maximal DSG and PPT values are attained at DS fraction of 77%-79% and 48%-50%, respectively, with values increasing with decreasing temperatures. Further decreases in DSF results in lower DSG's and PPT's, until equilibrium (DSG=1) is attained at DSF of 8%-10%.
0
0.5
1
1.5
2
2.5
3
0 20 40 60 80 100
(a)
DS-RS DS-CSW
DS%
�� �� -
DS
G- D
egre
e o
f sat
urat
ion
wit
h re
spec
t to
gyps
um
-0.03
-0.02
-0.01
0
0.01
0.02
0.03
0 20 40 60 80 100
(b)
DS-RSDS-CSW
DS%
Pre
cipi
tatio
n po
tent
ial
(mol
gyp
sum
kg
H2O
-1 )
Figure 19: Degrees of saturation with respect to gypsum (a) and gypsum precipitation potentials (b)
calculated by PhreeqC code for of Dead Sea brine and Seawater mixtures at 25ºC (Red) and for Dead Sea and Reject Brine (Blue).
2.8.2.2. The factors affecting gypsum precipitation kinetics
Most studies on the kinetics of gypsum precipitation focused on solutions with relatively low ionic strength, similar to the conditions in the industry (Edinger,

Best Available Data Report
RS-DS Water Conveyance Study Program
Z:\IL\201280\R10.054A\BAD_report_revised.doc November 24, 2010 34
1973; Van Rosmalen et al., 1981; Christoffersen et al., 1982; Cody and Cody, 1989). Furthermore, most of these studies were conducted in solutions that contain equivalent concentrations of Ca2+ and SO4
2- (Smith and Sweett, 1971; Gill and Nancollas, 1979; Kagawa et al., 1981; Van Rosmalen et al., 1981; Christoffersen et al., 1982; Witkamp et al., 1990; He et al., 1994b).
The effects of ionic strength on gypsum nucleation and crystal growth were examined on synthetic solutions only up to 6 M (mol kg H2O-1) (He et al., 1994a; He et al., 1994b), which is still significantly lower than the ionic strength of the Dead Sea brine (10 m) and most of its mixtures between Dead Sea and SW. The effect of the Ca2+ to SO4
2- ratio was examined as well on nucleation kinetics and crystal growth kinetics (Zhang and Nancollas, 1992; Alimi and Gadri, 2004). In both studies, the Ca2+ to SO4
2- ratio was significantly lower than that of the Dead Sea brine. Gypsum precipitation kinetics from Dead Sea and DS-SW mixtures were studied by Levy and Kushnir (1981) and Reznik et al. (2009a). Levy and Kushnir (1981) concluded their preliminary study by generally stating that the kinetics of gypsum precipitation from Dead Sea-seawater mixtures are slow. The results of Levy and Kushnir (1981) were not sufficient to determine a general rate law describing crystal growth kinetics nor to explain the slow kinetics, which are the focus of the present work of Reznik et al. (submitted ) and Reznik et al. (in prep.).
2.8.2.3. Nucleation
The major parameters that affect the rate of nucleation (and therefore the induction time) of a mineral from a specific solutions are: 1) the degree of saturation of the solution with respect to the mineral; 2) the solubility of the mineral in the solution; 3) the interface energy (i.e., the surface tension) between the mineral and the solution; 4) the presence of catalysts and inhibitors (such as antiscalants); and 5) the temperature. The effect of these parameters on the induction time for gypsum nucleation has been determined under variable environmental conditions. Some of the studies presented rate equations that described the dependence of the induction time on various parameters under the experimental conditions. Unfortunately, these rate equations cannot be used to determine the induction time under different environmental conditions (He et al., 1994a; Hasson et al., 2003; Alimi and Gadri, 2004; Barbier et al., 2009).
In a recent preliminary study, Reznik et al. (in prep.) followed the change in SO4
2- concentrations with time in a batch experiment with DSF of 70% (Fig. 2�0). The induction time that was determined for this mixture is about 20 days. For Dead Sea brine, the induction time is not attained even after more than a year. Using laboratory experiments, literature data and the prediction of classic nucleation theory, Reznik et al. (in prep.) is in the process of deriving a new rate law describing the effect of degree of saturation and solubility on the induction time of gypsum at 25°C.

Best Available Data Report
RS-DS Water Conveyance Study Program
Z:\IL\201280\R10.054A\BAD_report_revised.doc November 24, 2010 35
0.02
0.022
0.024
0.026
0.028
0.03
0.032
0.034
1 10 100
Measured
Lower error range
Intial concentration
SO
42- c
once
ntra
tion
(mol
kg
solu
tion-1
)
Time (min)Tind
Figure 20: Variations in SO42- concentrations with time, illustrating the determination of the induction
time in a batch experiment with DSF of 70%. The bars associated with the SO42- concentration
represent an error of ±3%. Data from Reznik et al., in prep.

Best Available Data Report
RS-DS Water Conveyance Study Program
Z:\IL\201280\R10.054A\BAD_report_revised.doc November 24, 2010 36
2.8.2.4. Crystal Growth
Gypsum crystal growth kinetics from mixtures of Dead Sea brine and seawater was recently derived based upon the results of seeded batch experiments (Reznik et al., submitted). The change with time in SO4
2- concentrations in a typical experiment is shown in Fig. 21. Approximated rates that are derived from such experiments provide the basis for a generalized rate law for gypsum precipitation from the various Dead Sea-seawater mixtures. The inner figure is an enlargement of the change of SO4
2- concentrations on the first 0.6 days of the experiment (Reznik et al., submitted).
Figure 21: Decrease in SO4
2- concentrations with time in a representative (70% DSF) seeded batch experiment (•). The solid line connecting the data points are merely drawn to highlight the trends.
2.8.3. Blooming Potential
Much information has already been collected on the factors that may determine the extent of microbial blooms in the Dead Sea after dilution of the upper meters of the water column with Red Sea water. Some of this information was obtained in simple laboratory simulations (Oren and Shilo, 1985), but most work as done in simulations in outdoor mesocosms (900 liters) set up on the grounds of the Dead Sea Works at Sedom. Different scenarios of dilution of Dead Sea water with Red Sea water were simulated and the effect of different manipulations, such as the addition of phosphate and different antiscalant agents commonly used in seawater

Best Available Data Report
RS-DS Water Conveyance Study Program
Z:\IL\201280\R10.054A\BAD_report_revised.doc November 24, 2010 37
desalination plants, were investigated. This series of experiments continues, and in the near future dilution with water desalination refuse brine will be included in the experiments as well. In these experiments, algal and bacterial numbers were monitored, and occasionally other assays were performed, such as pigment analyses, characterization of the microbial communities by means of lipid analyses, and even environmental genomic analysis of the phylotypes present (results expected during the coming months). Much of the results of these analyses have been published in the scientific literature (Gavrieli et al., 2005; Oren et al., 2003, 2004, 2005a, 2009) and in reports of the Geological Survey of Israel (Gavrieli et al., 2002; Oren et al., 2005b, 2006). The results of these experiments can be summarized as follows:
- Microbial blooms, such as those that occurred in the Dead Sea in 1980
and in 1992, can be simulated in outdoor mesocosms. - Dilution of Dead Sea water with at least 10%-15% (by volume) seawater
led to the development of microbial communities resembling those observed in the Dead Sea.
- The extent of the microbial development depended upon the availability of phosphate.
- The higher the extent of dilution, the faster the development of colored microbial communities in the ponds.
- In ponds with which Dead Sea water was diluted with 35%-40% Red Sea water or more and amended with phosphate, Dunaliella developed to densities greatly exceeding those ever reported from the Dead Sea, and the ponds became brightly green within two to three months, before red Archaea and other types of prokaryotes took over.
- In experiments in which blooming ponds were maintained for up to seven to eight years, Dunaliella numbers fluctuated greatly, often with seasonal blooms; densities of red halophilic Archaea generally kept increasing over the years, showing that a microbial bloom, once formed, can remain present in the Dead Sea for many years as long as the physical and chemical conditions (stratification with a relatively shallow diluted layer) will be maintained. These are the kind of conditions that according to the models can be expected when indeed in the future massive amounts of Red Sea water and/or desalination refuse brines will enter the Dead Sea and cause a stable stratification of the water column.
- In ponds with which Dead Sea water was diluted with 35%-40% Red Sea water or more and amended with phosphate, another type of phototrophic microorganism started to appear: unicellular cyanobacteria (Aphanothece – Halothece type), which formed masses of brownish-green material floating on the surface of the pond. Such cyanobacteria have been earlier reported from Dead Sea water-derived brines (Dor and Hornoff, 1985). The large amounts of polysaccharide slime produced by these cyanobacteria greatly increased the viscosity of the brine. This polysaccharide material is not easily degraded and accumulates in the water.

Best Available Data Report
RS-DS Water Conveyance Study Program
Z:\IL\201280\R10.054A\BAD_report_revised.doc November 24, 2010 38
3. Hydrogeology and Sinkholes - Existing Information
3.1. Surface Flows
3.1.1. Overview The surface water inflow to the Dead Sea may be divided into five categories as follows: Jordan River inflows from the North Wadi Arava inflows from the South Wadis and springs inflows from the West Wadis and springs inflows from the East Direct rainfall from above
Each category is separately dealt with in the following chapters based upon the available published reports or authorized published measurements information that refer to the various categories.
3.1.2. The Jordan River Inflows
A series of reports were the basis to present an initial evaluation of the Jordan River inflows to the Dead Sea, which are listed among the references. The major findings based upon these references may be summarized as follows: A. The Jordan River’s mean annual inflows to the Dead Sea without the
Yarmouk Al Wehdeh reservoir and the total volume of the Syrian and Jordanian reservoirs of 205 MCM has been estimated as 394 MCM based upon a database related to the periods 1933/1934 – 1985/1986 (Simon and Mero, 1987).
B. The Jordan River’s mean annual inflows to the Dead Sea at Naharayim without the Yarmouk Al Wehdeh reservoir and the total volume of the Syrian reservoirs of 98 MCM, including the Al Wehdeh reservoir with a volume of 200 MCM and a total volume of the Syrian reservoirs of 165 MCM have been estimated as 86 and 16 MCM, respectively. These findings are based upon a database related to the periods 1933/1934 – 1985/1986. In both scenarios, there is a diversion of about 480,000 m3/day from the Yarmouk River to the Lake Kinneret (Goldstoff et al., 1988).
C. The Jordan River’s mean annual inflows to the Dead Sea without the Yarmouk Al Wehdeh reservoir and the total volume of the Israeli, Syrian and Jordanian reservoirs of 508 MCM is estimated as 247 MCM based upon a database related to the periods 1933/1934 – 1985/1986 (Simon et al., 1995). The abovementioned mean annual inflows include the saline water carrier

Best Available Data Report
RS-DS Water Conveyance Study Program
Z:\IL\201280\R10.054A\BAD_report_revised.doc November 24, 2010 39
diversion to the Lower Jordan River and irrigation return flow annually totaling a volume of 45 MCM.
D. The actual volume of the Yarmouk Al Wehdeh reservoir is 225 MCM with an effective storage volume of 195 MCM annually (Murakami, 1995). Based upon various reports, the Al Wehdeh reservoir started to function from 2006.
E. There would be an increase of 110 MCM for the use of the Lower Jordan River flows between 1995 and 2010 (GTZ, 1996).
F. The Jordan River’s mean annual inflows to Dead Sea as based upon the 1994 Peace Treaty is estimated at 30 MCM (The HARZA JRV Group, 1997).
G. Total reservoir volumes in Jordan were 268 MCM in 2004 (The Hashemite Kingdom of Jordan, Jordan Valley Authority, 2004).
H. The spill to the Dead Sea in most years was estimated as 150 MCM before the Yarmouk Al Wehdeh reservoir construction (Calvo and Ben Zvi, 2005). This study has estimated the net contribution of both sides of the Lower Jordan River.
I. The Lower Jordan River’s mean annual flows to the Dead Sea is estimated as 200 MCM, annually. Syria diverts 200 MCM, Israel diverts 565 MCM, Jordan diverts 290 MCM, the Yarmouk Al Wehdeh reservoir stores 110 MCM (Courcier et al., 2005).
J. The baseflow spill to the Dead Sea was estimated as 35 MCM during the years 2000/01 and 2001/02 (Holtzman et al., 2005).
K. The Lower Jordan River’s mean annual flows to the Dead Sea are between 20 MCM to 30 MCM annually; Syria diverts 315 MCM, Israel diverts 580 MCM, Jordan diverts 290 MCM, West Bank diverts 63 MCM, Total diversions were estimated at 1248 MCM (1953 estimates) and diversions to the Lower Jordan River from the Jordanian side for the years 2005 – 2008 were between 0.18 to 12.78 MCM (Friends of the Earth Middle East, 2010).
L. The data varies from period to period and to researcher depending upon the water utilization from the Jordan River system of that period and the available database.
Preliminary conclusions from the abovementioned findings may be drawn as follows: A. The Lower Jordan River’s mean annual flows to the Dead Sea up to 2000
were estimated to be within the range of 150 – 394 MCM with varying storage volumes in Syria and Jordan within the range of 205 – 508 MCM.
B. The prevailing conditions of larger storage values in the range of 600 MCM and the higher Yarmouk flows diversion rate of about 50 MCM reduce the Lower Jordan River’s mean annual flows to the Dead Sea to be within the range of 20 – 61 MCM. The upper range value is based upon the Goldstoff et al. (1988) estimate of 16 MCM Jordan River mean annual flow in Naharayim

Best Available Data Report
RS-DS Water Conveyance Study Program
Z:\IL\201280\R10.054A\BAD_report_revised.doc November 24, 2010 40
to which 45 MCM of the saline water carrier diversion to the Lower Jordan River and irrigation return flow were added.
For the present study, it has been decided to use an average value of the abovementioned range, i.e., 40 MCM.
3.1.3. The Wadi Arava Inflows
3.1.3.1. Wadi Arava Western Sub-Basins
There are various wadis contributing flash flood flows to Wadi Arava from its western side. The major ones are Wadi Paran, Wadi Nekarot and Wadi Zin. Based upon the Israeli Hydrologic Service’s measurements at various hydrometric stations in the region up to 2009, the total mean annual western sub-basins contribution may be estimated to be in the range of about 7 MCM as an annual average. This value is in an agreement with a former study (Simon and Shahar, 1995) in which the total mean annual western sub-basins’ contribution is estimated to have a value within the range of 5.8 - 7.1 MCM.
3.1.3.2. Wadi Arava Eastern Sub-Basins
There are various wadis contributing flash flood flows to Wadi Arava from its eastern side the major ones being Wadi Padan and Wadi Hur.
Based upon a recent unpublished TAHAL study, the total mean annual eastern sub-basins contribution may be estimated to be within the range of about 3.5 MCM as an annual average. It should be mentioned that there are various Jordanian studies reports relating to the eastern Wadi Arava sub-basins surface water mean annual flows. However there is no separation in these studies between those wadis that contribute to the Dead Sea and those that feed into the Red Sea.
3.1.3.3. The Total Wadi Arava Dead Sea Inflows The present mean annual Wadi Arava Dead Sea inflows may be estimated at about 10 MCM. This value would be reduced in the future due to Jordanian plans to construct dams in some of the wadis.

Best Available Data Report
RS-DS Water Conveyance Study Program
Z:\IL\201280\R10.054A\BAD_report_revised.doc November 24, 2010 41
3.1.4. Wadis and Springs Inflows from the West
3.1.4.1. Wadis Based upon the Israeli Hydrologic Service’s measurements at various hydrometric stations in the region up to the years 2009, the total mean annual contribution of the western wadis may be estimated to be within the range of about 6 MCM as an annual average.
3.1.4.2. Springs
There are three major spring groups that enter the Dead Sea from the west: Zukim, Kane and Samar. There are also some other minor springs that enter the Dead Sea as well.
Based upon the Israeli Hydrologic Service’s measurements of the spring flows of the abovementioned groups, the mean annual flow during the period of 2005 – 2010 was found to be 66 MCM, 10 MCM and 23 MCM, respectively. The other minor springs’ total annual mean flow may be estimated based upon former measurements carried out by TAHAL to be within the range of 15 MCM. That means that the current mean annual total spring flows to the Dead Sea is in the range of 114 MCM. It should be mentioned that there is another estimate of the present Zukim group’s annual mean flow recently prepared by the Palestinian Water Authority (PWA) (Abdelghafour, 2010). The PWA claims that the Zukim group’s annual flows are within the range of 95 - 110 MCM during the period of 2001-2008. This value is much higher than the Israeli Hydrologic Service’s measurements and should be verified by letting both establishments carry out combined measurements at the springs.
3.1.5. Wadis and Spring Inflows from the East
3.1.5.1. Wadis
A series of reports were the basis to present an initial evaluation of the wadis and springs inflows from the east to the Dead Sea. The major findings based upon the these references may be summarized as follows:
A. The major wadis contributing to the Dead Sea from the east are Wadi
Mujib, Wadi Wala and Wadi Zarqa Ma'in. Wadi Hassa is another former source of the Dead Sea, but now it contributes to the Jordanian potash industries and its springs are utilized.
B. There are two dams constructed on Wadi Mujib and Wadi Wala with a storage capacity of 31 MCM (Margane et al., 2008) and 9 and 26 MCM

Best Available Data Report
RS-DS Water Conveyance Study Program
Z:\IL\201280\R10.054A\BAD_report_revised.doc November 24, 2010 42
(Jordan Valley Authority, 2002), which are the existing and future values, respectively.
C. The mean annual Wadi Mujib floods flows are estimated to be in the range of 32 MCM (Al-Mubarak Al-Wesha, 1992) to 71 MCM (GTZ, 2004). Alkhadder et al., (2005) and Al-Kharabsheh and Ta’any (2005) found intermediate values. An average value of about 44 MCM may be recommended at the time of the present report preparation.
D. The mean annual Wadi Mujib springs flows are estimated to be between 15 MCM (Abdulla. and Al-Assa'd, 2005) and 35 MCM (Al-Mubarak and Al-Wesha, 1992). Al- Kharabsheh and Ta’any (2005) found an intermediate value. An average value of about 28 MCM may be recommended at the time of the present report preparation.
E. The mean annual Wadi Wala floods flows are estimated to be between 5 MCM (Ayadi, 2006) and 23 MCM (Jazim, 2005). An average value of about 14 MCM may be recommended at the time of the present report preparation.
F. The mean annual Wadi Zarqa Ma'in springs flows are estimated to be between 20 MCM (Chen et al., 2005) and 23 MCM (Sawarieh et al., 2009). An average value of about 21 MCM may be recommended at the time of the present report preparation.
Preliminary conclusions from the abovementioned findings may be drawn as follows: A. Most of the flood flows of Wadi Mujib and Wadi Wala would be caught by
the existing dams. Only a negligible fraction of the flood flows would be released to arrive at the Dead Sea shore.
B. It is assumed that the Wadi Mujib, Wadi Wala and Wadi Zarqa Ma'in springs flow would reach the Dead Sea shore totaling a mean annual flow of about 50 MCM.
3.1.6. Direct Rainfall from Above
Based upon the limited rainfall around the Dead Sea an annual average of about 75 mm has been estimated to fall over the lake. The present Dead Sea surface area at its elevation of about 423 m below sea level was estimated based upon an elevation-area equation presented by TAHAL (1983). The application of the abovementioned equation yielded a Dead Sea surface area of about 655 km2. Having the estimated Dead Sea surface area and the average direct rainfall over the lake, the rainfall contribution to the Dead Sea water balance is about 49 MCM as an annual mean.

Best Available Data Report
RS-DS Water Conveyance Study Program
Z:\IL\201280\R10.054A\BAD_report_revised.doc November 24, 2010 43
3.1.7. Summary of the Various Dead Sea Inputs
Table 2 summarizes the various inputs contributions of the Dead Sea as mentioned above.
Table 2: The Various Dead Sea Inputs
Category Dead Sea Inflow (MCM)
Jordan River inflows from the North 40
Wadi Arava inflows from the South 10
Wadis and springs inflows from the West 114
Wadis and springs inflows from the East 50
Direct rainfall from above 49
Total 263
3.2. Groundwater Inflows
The Dead Sea lies in the central part of the Syrian-African Rift System. It is located in the lowest topographical-structural segment of the rift, and serves as a drainage basis for all the hydrological systems in its vicinity; both surface and subsurface. The hydrogeology on both sides of the Dead Sea is very different both in the characteristics of the aquifers and in the water flowing through them.
3.2.1. The Hydrogeology West of the Dead Sea
The western catchment area of the Dead Sea is between the water divide on the mountainous backbone and the Dead Sea. Although there is a certain match between the subsurface and the surface water divide, they are not identical (Arad, 1964). The total area of the Judea desert basin is more than 750 km2. The general direction of the groundwater flow in the regional aquifers is to the northeast, towards the Dead Sea. The region is characterized by a desert climate with a small amount of rain, from 100 mm/yr in the vicinity of the Dead Sea to larger amounts (500 mm/yr - 600 mm/yr) with the approach to the Hebron mountain backbone in the west.
The western Dead Sea groundwater system consists of two main aquifers: The Upper Cretaceous Judea Group Aquifer and the Quaternary alluvial coastal aquifer (Arad and Michaeli, 1967; Yechieli, et al., 1995). The coastal aquifer consists mainly of clastic sediments, such as gravel, sand and clay deposited as fan deltas and lacustrine sediments, such as clays, aragonite, gypsum and salts.

Best Available Data Report
RS-DS Water Conveyance Study Program
Z:\IL\201280\R10.054A\BAD_report_revised.doc November 24, 2010 44
The alternations between gravel and clay subdivide the aquifer into several sub-aquifers that differ in their groundwater levels and chemical composition. The transmissivity of the aquifer was estimated in an interference pumping test in Wadi Arugot to be 1500 m2/day (Wollman et al., 2003), yielding a hydraulic conductivity value of 30 m -100 m/day, depending upon the specific thickness of the aquifer which is not known. This aquifer is bounded by normal faults, which set Cretaceous carbonate rocks of the Judea Group against Quaternary alluvial and lacustrine sediments. The recharge of the aquifer is mainly through lateral flow from the Judea Group aquifer, which is replenished in the highlands 10 km -30 km to the west and by flash floods. Direct recharge is negligible because of the arid climate and high evaporation in the Dead Sea region. Due to the scarcity of observation boreholes penetrated into the deeper sub-aquifers, the monitoring of the water levels and the interface location was conducted mainly in the upper sub-aquifer.
3.2.2. The Hydrogeology East of the Dead Sea
The eastern Dead Sea groundwater system consists of three main aquifer systems: The upper aquifer system – Quaternary- Tertiary alluvial coastal aquifer, the Middle aquifer system – Upper Cretaceous carbonate rocks known as Amman-Wadi Sir aquifer, and the lower aquifer system – Lower Cretaceous and older sandy aquifers (JICA, 2001).
The upper aquifer system is similar to the coastal aquifer at the western side of the Dead Sea (see the previous section). The Middle aquifer system forms the most important aquifer in Jordan. Groundwater flow in this aquifer is directed from the recharge area at the high rainfall zones of the highland towards the Dead Sea. The lower aquifer system is composed of two groups, the Ram Disi and the Kurnub Groups that extend over almost all Jordan. Source of recharge of unknown extent may be by downward seepage from overlying aquifers. Groundwater in these aquifers is considered as of fossil origin, recharged at times of higher rainfall.
Hobler et al. (1991) and Schmidt et al. (2002) suggested that under natural conditions the deep aquifer system is being continuously drained to the Dead Sea. The groundwater discharge to the Dead Sea was estimated to be approximately 400 MCM/yr, most of it in the form of undetected discharge.
Contrary to this estimation, Salameh and El-Naser (1999, 2000a,b) argued that the total natural discharge of groundwater on the eastern side from deep aquifers to the Dead Sea is 90 MCM/yr. However, they claim that a high volume of groundwater (~500 MCM/yr) is drained to the Dead Sea due to the rapid drop of the Dead Sea.

Best Available Data Report
RS-DS Water Conveyance Study Program
Z:\IL\201280\R10.054A\BAD_report_revised.doc November 24, 2010 45
3.2.3. Physical Groundwater Processes
The Dead Sea and the adjoining groundwater system are hydraulically interconnected as expressed in a relatively fast (a few days) groundwater level response to level changes of the Dead Sea (Yechieli, et al., 1995). The drop in groundwater level decreases with increasing distance from the shoreline inland (Yechieli et al., 2009). Preliminary measurements imply that, in some locations near the shoreline, the drop is quite similar to that of the Dead Sea, while reaching a dynamic steady state (Kiro et al., 2008), whereas in other locations the groundwater level drop is significantly smaller than that of the Dead Sea (Yechieli et al., 1995). The fresh-saline water interface is also responding to the drop of the sea level and the eastward shift of the Dead Sea shore line, resulting in the fast flushing of the Dead Sea coastal aquifer. Hydrological modeling of the Dead Sea system shows that circulation of saline water continues even during the present fast decrease of the Dead Sea level (Kiro et al., 2008).
The Dead Sea level drop is shown to significantly affect the position of the fresh-saline water interface (Fig. 22b, Kiro et al., 2008) which is consistent with the field observation. The change in groundwater heads (Fig. 23) is a function of the permeability of the aquifer and distance from the sea. Boreholes adjacent to the shoreline exhibited water levels drop close to that of the Dead Sea levels (Fig. 23a). Along the Arugot and Darga alluvial fans, for example, where the sediments are mostly gravel of high permeability, the groundwater level drop was similar to that of the Dead Sea level up to a distance of 700 meters inland (Fig. 23c). In the Ze’elim boreholes, which are located in the alluvial fan of Wadi Zeelim at much larger distance from the shoreline (~4 km), the drop in water level is significantly lower than the drop of the Dead Sea levels (Fig. 23d). Boreholes outside the main stream valleys have shown, in general, smaller water level drops as compared to that of the Dead Sea (i.e. EG-3a and the Tureibe boreholes; Figs. 23b,e). This is explained by their relatively lower permeability being located outside the main alluvial fans. It should be noted that the distance from the monitoring boreholes to the shoreline increase with time due to the retreat of the shoreline, also affecting the hydraulic gradient.

Best Available Data Report
RS-DS Water Conveyance Study Program
Z:\IL\201280\R10.054A\BAD_report_revised.doc November 24, 2010 46
Figure 22: Numerical simulations of the expected changes in the case of Dead Sea level drop. The hydraulic parameters were taken to be similar to those at the Wadi Arugot. The value that represents the fresh-saline water interface in the following graphs is 50% Dead Sea water, which is ~110 g/l Cl. a). Basic simulation of the Dead Sea coastal aquifer showing the fresh and saline water bodies and the interface in between. b). Simulation of the case of a drop in the Dead Sea level by 20 m. After
Kiro et al., 2008

Best Available Data Report
RS-DS Water Conveyance Study Program
Z:\IL\201280\R10.054A\BAD_report_revised.doc November 24, 2010 47
Figure 23: Groundwater levels in monitoring boreholes in the Dead Sea coastal aquifer at different locations and distances from the shoreline (in ~2005; given in parenthesis) along with the Dead Sea level (data from the Hydrological Service of Israel): a. EG-16 (10m), EG-11 (70m), EG-7 (400m), EG-6 (600m), located in Wadi Arugot. b. EG-3a (~900m), located 3 km south from Wadi Arugot. c. Darga 2 (700 m), located in Wadi Darga. d. Zeelim 1 and 2 (~4 km), located in Wadi Zeelim. e. Turiebe – (~500 m), located 10 km north of Wadi Darga.
The location of the fresh-saline water interface was measured with an in situ device of electrical conductivity (EC) which measured the EC in the depth interval between the water table and the bottom of the boreholes (Figs. 24a,b). Usually, the EC values correlate well with the salinity values (Yechieli, 2000). The situation is, however, more complicated in the Dead Sea area. At very high

Best Available Data Report
RS-DS Water Conveyance Study Program
Z:\IL\201280\R10.054A\BAD_report_revised.doc November 24, 2010 48
salinities, higher than half that of the Dead Sea brines, there is no correlation between EC and salinity (Yechieli, 2000). Therefore, the location of the fresh-saline water interface can only be inferred from measurement of EC values below 160 mmho/cm, according to calibration curves given by Yechieli (2000) which provided the relationship between EC and salinity. The EC profiles were conducted for six years in order to examine the response of the interface to change in Dead Sea levels. The conductance of EC profiles was problematic in some of the monitoring boreholes since it requires the insertion of a large device into the 2" pipe. Therefore, in many wells, only monitoring of water levels is available.
EG-11
-425
-424
-423
-422
-421
-420
-419
-418
-417
-416
-41540 60 80 100 120 140 160 180
EC (mS/cm)
Ele
vatio
n (m
)
02/12/2003
07/01/2004
24/02/2004
20/04/2004
13/09/2004
07/11/2004
13/02/2005
08/04/2005
16/10/2005
22/02/2006
25/04/2006
27/08/2006
06/11/2006
25/02/2007
31/10/2007
04/11/2008
07/01/2009
23/02/2009
28/07/2009a
Figure 24a: Profile of EC in EG 11 borehole in the Dead Sea coastal aquifer at a distance of 70
m from the shore line (modified after Kiro et al., 2008). Significant changes in the location of the fresh-saline water interface are observed.

Best Available Data Report
RS-DS Water Conveyance Study Program
Z:\IL\201280\R10.054A\BAD_report_revised.doc November 24, 2010 49
Darga 2
-440
-435
-430
-425
-420
-415
-410
-4050 50 100 150
EC (mS/cm)
Ele
vatio
n (m
)
13/02/2005
18/04/2005
22/02/2006
31/12/2007
25/02/2007
04/11/2008
23/02/2009
28/07/2009
b
Figure 24b: Profile of EC in Darga 2 borehole in the Dead Sea coastal aquifer at a distance of 700 m
from the shore line, showing a small change in the interface depth.
The drop of the Dead Sea level, and the eastward movement of the Dead Sea shoreline, also effects the location of the fresh-saline water interface (Fig. 24). The decline of the Dead Sea is expected to result in a drop in the location of the interface which is to be exhibited in monitoring boreholes by a lowering in EC profiles with time. The EC profiles in boreholes near the Dead Sea, at a distance of ~70 m, indeed show a significant change in the last three to five years (Fig. 24a). On the other hand, no significant change in the interface location was observed in Darga borehole, which is located much farther (about 700 meters) from the shoreline in the alluvial fan of Wadi Darga (Fig. 24b).
In many parts of the Dead Sea coastal area, thermal springs along the Dead Sea were studied mainly for the geochemical and geothermal aspects (Starinsky, 1974; Mazor et al., 1969; Eckstein, 1979). The Hydrological Service of Israel measured the discharge of the hot springs along the western coast for the first time in October 2005, and estimated the total discharge for this area to be 107 m3/yr. The salinity of the springs is 0.164 g/g (Dead Sea – 0.27 g/g), which is about half that of the Dead Sea, and the density is 1.128 g/cm3 (Dead Sea – 1.24 g/cm3). The groundwater level as well as the springs’ location is receding as a result of the Dead Sea recession. Based upon the chemistry of the springs and the Dead Sea, Starinsky (1974) suggested that seawater invaded the Dead Sea basin in the Neogene and underwent evaporation, precipitation of salt, and interaction with the country rocks. The Dead Sea brine chemistry was then continuously altered as a result of the hot spring discharge (Starinsky, 2005). Mazor et al. (1969) suggested that the hot springs’ water is a mix of fresh groundwater and Dead Sea brine. The

Best Available Data Report
RS-DS Water Conveyance Study Program
Z:\IL\201280\R10.054A\BAD_report_revised.doc November 24, 2010 50
springs’ water originated from older lakes whose water level was higher than that of the present Dead Sea (Yechieli et al., 1996; Gavrieli et al., 2001).
While the atmospheric average annual temperature at the Dead Sea is 26.50C (Lensky et al., 2005), the temperature of these hot springs is 410C-440C. The high temperature of the hot springs, which is up to 180C above the ambient temperature, indicates that the groundwater ascends rapidly from a depth of at least 950 m, assuming a geothermal gradient of 190C/km (Eckstein, 1979; Shalev et al., 2007). This is probably an underestimation because the brine may mix with colder freshwater before discharging to the Dead Sea shore. The ascent of the brine occurs through the faults that serve as conduits (Eckstein, 1979; Mazor et al., 1980; Gavrieli et al., 2001).
Shalev and Yechieli (2008) showed that at steady state conditions a fresh/saline mixing zone flow reflects the brine circulation around the Dead Sea. Dead Sea brine sinks through faults, migrates across tilted blocks, and ascends back to the Dead Sea shore with fresh groundwater. Because groundwater flows from high hydraulic head to lower ones, a change of the hydraulic head at the Dead Sea has the ability to reverse the flow. The most profound change in brine discharge is caused by the lake level changes. A recession of the Dead Sea causes a significant increase in both freshwater and brine spring discharge. A rise of the Dead Sea level causes the opposite effect.
3.3. Sinkholes
3.3.1. Sinkholes Information
Collapse-sinkholes started to appear along the Dead Sea coast in Israel and Jordan in the early 1980s. Sinkhole development has significantly accelerated since 2000 with abrupt occurrence of hundreds of sinkholes. This regional-scale collapse is attributed to the rapid decline of the Dead Sea level (~1 m/y) (Arkin, 1993; Arkin and Gilat, 2000; Taqeiddin et al., 2000; Wachs et al., 2000). The decline of the Dead Sea, which exceeds ~30 m since the early 1930s, reflects human activities such as interception of freshwater supply from the Jordan River and the maintenance of large evaporation ponds by the Dead Sea mineral industries in Jordan and Israel. According to recent examination of aerial photographs (Abelson and Gabay, 2009) a total of more than 2500 sinkholes appeared along the Dead Sea’s west coast. These sinkholes are clustered in ~50 sinkhole sites along a narrow coastal strip, ~60 km long and 20 m – 1000 m wide, which stretches from the water line westward (Fig. 25). Each sinkhole site comprises between one and >500 sinkholes. In recent years, the growth rate of the number of sinkholes has increased significantly. Since 2003, this number approaches 200-380 sinkholes

Best Available Data Report
RS-DS Water Conveyance Study Program
Z:\IL\201280\R10.054A\BAD_report_revised.doc November 24, 2010 51
per year (Fig. 26). Consequently, more than 80% of the 2500 Dead Sea sinkholes have occurred since 2000.
Figure 25: Distribution of sinkhole sites along the Dead Sea coast, updated from aerial photographs from August 2006 (Abelson et al., 2007).

Best Available Data Report
RS-DS Water Conveyance Study Program
Z:\IL\201280\R10.054A\BAD_report_revised.doc November 24, 2010 52
Figure 26: Growth rate (red line) and cumulative number of the sinkholes (black line) along the Dead Sea shorelines (updated to December 2008).
The sinkholes tend to develop along lineaments (Raz, 2000; Abelson et al., 2003a; Fig. 27), which can be traced up to ~2 km. The orientations of the sinkhole lineaments are strikingly similar to the orientation of the faults forming the Dead Sea rift. These two observations imply that the sinkhole formation is related to tectonic faults buried in the rift sediments (Abelson et al., 2003a,b). This notion has been strongly supported by seismic reflection and by the absence of spatial relationships between the sinkhole lineaments and surface features, such as coast steps, shape of alluvial fans, etc.

Best Available Data Report
RS-DS Water Conveyance Study Program
Z:\IL\201280\R10.054A\BAD_report_revised.doc November 24, 2010 53
Figure 27: Sinkhole lineaments and buried faults (after Abelson et al., 2003a). (a) A rectified air photograph from 1999 showing the sinkhole site of Shalem (Fig. 25). The sinkholes are aligned sub-
parallel to the local rift-margin faults. (b) Area weighted, rose-diagrams of strikes of major faults on the western margin of the DS rift [Sagy et al., 2003] (cumulative length 322 km), sinkhole lines, and
strikes of the western rift wall segments displayed on a digital shaded relief map [Hall, 1996]. Note the similar bimodal distribution of the various populations, implying a tectonic control on the sinkhole
lines. (c) and (d) Seismic reflection profiles across the Neve Zohar and Hever-south sites, respectively (see Fig. 25 for location) showing prominent discontinuities beneath the sinkhole lines. In Neve Zohar,
a sequence of disturbed layers is bounded by two discontinuities interpreted as faults. The northwesterly discontinuity is beneath the sinkhole line. A seismic reflection profile parallel to the
sinkhole line at this site shows no discontinuity, suggesting that the buried discontinuities/faults are parallel to the sinkhole line.
The lithology in an 80 m deep borehole at Hever-south site is presented in (d); 14C dating from a 27m-deep clay horizon within the salt layer indicates an age of ~10,000 years, suggesting that the
observed offsets shallower than 20 m are younger than 7500 years.
The sinkholes are observed in two main sedimentary environments along the Dead Sea western coast, mud-flats and alluvial fans. The alluvial fans are made of

Best Available Data Report
RS-DS Water Conveyance Study Program
Z:\IL\201280\R10.054A\BAD_report_revised.doc November 24, 2010 54
coarse gravel alternating with fine-grained sediments (silt and clay), whereas the mud flats are mainly fine-grained sediments. The sinkholes in the alluvial fans tend to be much deeper, where single sinkholes sometimes reach a depth of 20 m. In the wet mud plains, the sinkholes are shallower and wider than the sinkholes in the alluvial fans.
3.3.2. Formation mechanism of the Dead Sea sinkholes – Dissolution of 10,000 year old salt layer
Previous studies have shown that the primary cause for collapse sinkholes around the globe is the formation of cavities by dissolution within layers of soluble rocks (e.g., Martinez et al., 1998; Galloway et al., 1999; Neal and Johnson, 2002). At some stage, overlying layers fail to bridge the growing cavities and collapse structures may reach the surface, forming a sinkhole. In order to assess whether the Dead Sea sinkholes are formed by a similar process, the GSI team searched for layers of soluble rock in the upper section of the sedimentary fill of the Dead Sea rift, and investigated groundwater chemistry for potential dissolution. The subsurface setting was explored by seismic refraction, boreholes, and sampling of groundwater from the boreholes. The following subsections review the key observations obtained by this exploration.
3.3.2.1. Shallow salt layer buried within the Dead Sea fill: findings from boreholes
and seismic refraction
Seismic refraction profiles were conducted along most of the Dead Sea coast by the Geophysical Institute of Israel. These data, and 20 boreholes in the vicinity of seven sinkhole sites, indicate that a salt layer, several meters thick, is embedded within the upper part of the sedimentary section along the Dead Sea coast. A typical profile of seismic refraction in the Dead Sea region displays three layers with P-wave velocities of 600-800 m/s, 2000-2300 m/s, and 2900-3600 m/s for the upper to lower layers, respectively. The upper two layers consist of uncemented or unconsolidated alluvial and fluvial sediments. The lower layer, where observed, is the salt layer. This stratigraphy was verified by boreholes in several sites (e.g., Hever-south, Ze'elim, En-Gedi, Shalem, En Bokek, Neve Zohar; Fig. 28), where a solid salt layer was penetrated at depths predicted by the seismic refraction.

Best Available Data Report
RS-DS Water Conveyance Study Program
Z:\IL\201280\R10.054A\BAD_report_revised.doc November 24, 2010 55
Figure 28: A salt core from the En Bokek-1 borehole.
For example, the borehole Hever-2 at the Hever-south site penetrated an 11 m-thick salt layer at a depth of 24 m, as predicted by the refraction profile (Yechieli et al., 2004). The age of the salt layer was found to be ~10,000 years (Yechieli et al., 1993). The salt layer shows a broad range of P-wave velocities, between 2900-3600 m/s, perhaps due to the occurrence of both solid and "crumbly" salt. Accordingly, seismic refraction profiles were used cautiously to identify the extension of the salt layer.
The association between sinkhole occurrence and the subsurface salt layer was corroborated by boreholes in seven sinkhole sites. At all these sites, a salt layer was penetrated at the vicinity of the sinkholes, supporting a dissolution-collapse origin for the Dead Sea sinkholes. In addition, a salt layer has not been found in boreholes north of the Einot Zukim reservation, an area where sinkholes are absent (Fig. 25).
The depth of the top of the salt layer ranges between 20 m and 50 m, and in some locations the thickness of the salt layer exceeds 20 m. It is not yet known whether there is a single salt layer or multiple layers from several stratigraphic units. For this purpose additional dating of the salt layer in several sites is required.
3.3.2.2. Cavities within the salt layer
In two of the seven sinkhole sites examined by boreholes, cavities were encountered in the salt layer (Abelson et al., 2006). At the Hever-south site, one borehole (Hever-1) penetrated an 11 m thick salt layer. A second borehole (Hever 3) drilled 40 m south of Hever-1 encountered a cavity at 23 m - 29 m depth, at the same stratigraphic level as the salt layer found in Hever-1. At the Shalem site (Mineral Beach, Fig. 25) the salt layer was penetrated at a depth of 19 m and a cavity was found at its base, over a depth range between 28 m to 31 m. A

Best Available Data Report
RS-DS Water Conveyance Study Program
Z:\IL\201280\R10.054A\BAD_report_revised.doc November 24, 2010 56
waterproof camera inserted into the cavity through the borehole indicated that the cavity wall is made of coarse-crystal salt (Fig. 29). The diameter of the cavity is larger than the 1.5 m maximum spread of caliper arms. The cavities found in the salt layers support the inference that salt dissolution causes the formation of the Dead Sea sinkholes.
Figure 29: A photograph from the cavity found in the borehole Mineral-2 at the Shalem site (Fig. 25). Note the coarse salt crystals in the cavity wall.
3.3.2.3. Hydrology and groundwater chemistry
Alternating fine-grained (clay and silt) and gravel layers occur in the upper sedimentary section along the Dead Sea coast, forming several sub-aquifers. In some locations (e.g. En Gedi area), the groundwater head in the lower sub-aquifer is higher than in the upper sub-aquifer (Yechieli et al., 2004, 2006), indicating upward flow potential. The groundwater in the lower sub-aquifer beneath the salt layer is much less saline (Cl=15 g/l, 78 g/l in various boreholes in En Gedi area; Fig. 30) than the Dead Sea brine (Cl=210 g/l) (Yechieli et al., 2004, 2006).

Best Available Data Report
RS-DS Water Conveyance Study Program
Z:\IL\201280\R10.054A\BAD_report_revised.doc November 24, 2010 57
Figure 30: A schematic hydrogeological section across the elongated cluster of sinkholes in En-Gedi plantations (Yechieli et al., 2006). The water chemistry in borehole EG-13 exhibits a clear signal for salt dissolution (Na/Cl=0.55). Relatively low saline water was found within the lower sub-aquifer in
EG-7, (Cl=15-78 g/l, as compared to the Dead Sea brine, Cl=220 g/l). This water is confined beneath the salt layer, showing a hydraulic head 5 m higher than the phreatic water level. As in many other sinkhole sites, the lineament over which the sinkholes develop here is found close to the margins of
the salt layer.
Calculations indicate that whereas the Dead Sea brine is saturated with respect to halite, the dilute groundwater is far below saturation and therefore has the potential to dissolve salt. Furthermore, geochemical evidence proves that dissolution of salt does occur. This is best exhibited by the high Na/Cl ratio of groundwater (0.6) from within the cavity in the salt layer in Mineral-2 borehole, compared with the Dead Sea brine (0.25) (Yechieli et al., 2006). The increased Na/Cl ratio reflects dissolution of the salt layer by groundwater consisting of mixed Dead Sea type brine and more diluted groundwater. In Mineral Beach, the source of the fresher groundwater is thermal brine seepage from deep strata. In En Gedi and most other sites, the dilute groundwater is derived from the regional freshwater aquifer recharged in the mountains to the west (Yechieli et al., 2001). The active groundwater flow, which drains to the declining Dead Sea, maintains a continuous flux of undersaturated water through the salt layer, thereby enhancing ongoing dissolution.

Best Available Data Report
RS-DS Water Conveyance Study Program
Z:\IL\201280\R10.054A\BAD_report_revised.doc November 24, 2010 58
3.3.2.4. Sinkhole lineaments along cryptic, likely active, young faults
Almost all sinkhole clusters display a clear linear shape. Comparison between the trends of the sinkhole lineaments, the exposed faults, and the zigzagging rift wall segments shows a striking similarity (Fig. 27). All features show a predominantly bimodal distribution with NE and NW principal directions (Fig. 27b). No relationship is found between sinkhole lineaments and other surface features, such as ancient or current Dead Sea shorelines, or alluvial fans. These observations suggest that sinkhole formation is controlled by faults concealed within the rift fill.
To confirm this linkage between buried faults and sinkhole lines, 10 profiles of seismic reflection were conducted across and along sinkhole lines in six different sites. In the examined sites the sinkhole lineaments were found to overlie prominent discontinuities. For instance, profiles across the sinkhole lines in the Neve Zohar and Hever-south sites (Fig. 27) display clear discontinuities interrupting the reflectors beneath the sinkhole lines that offset young sediments several thousands of years old.
The observed linkage between tectonic faults and sinkholes implies genetic relationships, where beside the presence of salt layer, the formation of sinkholes is strongly affected by the presence of a prominent tectonic fault. Several meters thick aquiclude layers above and below the salt layer [as indicated in several boreholes (Yechieli et al., 1993; Wachs et al., 2000)] may restrict access of the sub-saturated water to the salt layer. The buried tectonic faults may then serve as conduits for the sub-saturated water to percolate to the salt layer through the aquiclude layers, to dissolve the salt layer and promote the development of sinkholes along lineaments parallel to the faults (Abelson et al., 2003b). The ascent of sub-saturated water is possible due to overpressure in the confined aquifers below the salt and clayey layers, which was found to be higher than the upper phreatic aquifer in the boreholes along the Dead Sea coast (Yechieli et al., 2006). The relationship between the Dead Sea and the groundwater in the adjacent coastal aquifer has been studied by Oz et al. (in prep.) for the scenario that the Dead Sea will reform into a meromictic lake. They showed that in some specific cases three water interfaces may develop in the subsurface: 1) between fresh water and Dead Sea water, 2) between the fresh water and the upper layer of the lake, and 3) between the upper layer water that flows into the sediments and Dead Sea water (Fig. 30). The occurrence of these interfaces brings undersaturated water with respect to halite to relatively deep layers and increase the potential for dissolution and sinkholes formation.

Best Available Data Report
RS-DS Water Conveyance Study Program
Z:\IL\201280\R10.054A\BAD_report_revised.doc November 24, 2010 59
4. Qualitative Provisional Assessment The initial assessments for the tasks presented in the following sections were prepared based upon current knowledge and understanding. Therefore, by default, have a wide range of uncertainties. The assessments will be modified later in the forthcoming reports, there will be an attempt to reduce the gap between the presently known and unknown knowledge, and whenever possible sharpen the focus on a quantifiable answer for the required tasks based upon the ongoing studies and various models' simulations.. As mentioned previously, at the request of the World Bank, and not as stated in the Terms of Reference, the target level will be between -433 and not over -406, and the time frame will be expanded to 2035 to 2050 or even 2075 for a 2020 inflow commencement. The suggested changes to the target levels and the timeframe will not affect the information in the qualitative assessment, but will be incorporated into the pending research that will be produced within the coming months. These values will influence the validation and running of the models.
4.1. Task 1: Current Status
Task 1: Current Status: Review the past and current baseline studies/research
related to the limnology of the Dead Sea with particular attention to the recent
efforts by the relevant scientists in modeling the dynamic limnology of the Dead
Sea with special attention to the following specific questions:
1.1 What are the current physical, chemical and biological conditions (including endemic bacteria) of the water in the Dead Sea?
Since the 1980s the Dead Sea is a monomictic lake. The water body overturns every year in early winter and remains vertically homogenous through the winter until early summer when thermohaline stratification develops. The rapid water level drop (1 m/yr over the last decade on average with an increased rate during the past few years) is a manifestation of the negative water balance of the lake. The drop in water level is accompanied by increasing salinity and temperature of the brine at rates of about 0.3 �20/yr and 0.3ºC/yr. See Section 2.5.1 for further details. The Dead Sea is characterized by its Ca-chloride composition and its salinity and density are 343 g/L and 1.24 g/cc, respectively (Table 1). The negative water balance of the lake and its increasing salinity results in the brine attaining saturation to oversaturation with respect to many evaporitic minerals. Halite (NaCl) began precipitating from the lake in 1983 and has been precipitating since

Best Available Data Report
RS-DS Water Conveyance Study Program
Z:\IL\201280\R10.054A\BAD_report_revised.doc November 24, 2010 60
then nearly uninterrupted, accumulating on the seafloor at a rate of about 10 cm/yr. This precipitation keeps the Dead Sea saturated with respect to halite, despite the increasing salinity. Gypsum (CaSO4·2H2O) on the other hand remains oversaturated in the Dead Sea brine and precipitates from the brine at a rate that is two orders of magnitude slower than that of halite (and thus is obscured by halite). The low precipitation rate and oversaturation are due to the low sulfate availability and the kinetics of nucleation and growth. See Sections 2.4 and 2.8.2 for more details. Currently the Dead Sea is nearly devoid of microorganisms. Although it is still possible to track the presence of a small community of Archaea long after the disappearance of microbial blooms in the lake, community densities are extremely low, and biological phenomena have no significant impact on the current properties of the Dead Sea water column. Algae are altogether absent in the waters of the Dead Sea as the salinity is too high for development and survival of Dunaliella. Viable zygotes of Dunaliella can be expected to survive in the sediments. See Sections 2.7 and 2.8.3. The one-dimensional model, 1D-DS-POM code, developed in the GSI for the Dead Sea, though not yet fully calibrated, has succeeded in modeling the current monomictic dynamics of the Dead Sea. Model input includes meteorological data collected from a buoy on the Dead Sea and estimated inflows which are based on the energy and mass (water and salt) balances of the lake. The model also accounts for the industrial pumping and discharge of end-brines from and to the lake, respectively. The model includes thermodynamic modules which "precipitate" halite and gypsum to maintain saturation and oversaturation of the brine, respectively. The effect of accumulation of the salt layer on the water level is also accounted for. See Sections 2.4 and 2.8.2.
1.2 What are the values of the components for the present water balance of the Dead Sea and in particular the values for evaporation and groundwater depletion?
The surface water inflow to the Dead Sea may be divided into five categories as follows: Jordan River inflows from the North, Wadi Arava inflows from the South, wadis and springs inflows from the west, wadis and springs inflows from the east, direct rainfall from above. The estimated inputs of these sources are See Section 3.1: Jordan River inflows from the North - 40 MCM/yr Wadi Arava inflows from the South - 10 MCM/yr Wadis and springs inflows from the West - ~115 MCM/yr Wadis and springs inflows from the East - 50 MCM/yr Direct rainfall from above - ~50 MCM/yr Total - ~265 MCM/yr

Best Available Data Report
RS-DS Water Conveyance Study Program
Z:\IL\201280\R10.054A\BAD_report_revised.doc November 24, 2010 61
Mass and energy balances for the Dead Sea for the years 1996-2001 indicated that the rate of evaporation from the Lake's surface was in the range of 1.1-1.2 m/yr (700-750 MCM/yr), whereas the total inflow volume to the Dead Sea during these years was within the range of 265-325 MCM/yr. This mass and energy balance is based upon assumed pumping and discharge volumes of the chemical industries, which need to be verified in details with the industries. Thus, the majority of inflow volumes can be accounted for as surface inflows from the main springs and wadis draining into the Dead Sea. This leads to the conclusion that the volume of unaccounted groundwater discharging directly to the Dead Sea is minimal (less than a hundred MCM/yr). See Section 3.2.
Much of the groundwater flowing to the Dead Sea discharges as springs close to the shore and flows as surface water to the lake, and is thus considered as observed inflows. The main reason for this flow pattern is the lateral sediments variability in the coastal aquifer. Most of the lake bottom consists of impermeable sediments such as clay, marl, and salt. Permeable sediments (gravel, sand) were deposited only along streams where most of the springs are located. Because the current level of the lake is very low, not many streams reached this level in the past. Therefore, the direct groundwater discharge to the Dead Sea is limited to relatively big streams (Arugot, Darga, Mujib) and is very close to the shore. See Section 3.2.
4.2. Task 2: No Action
Task 2: No Action: Evaluate how the level, water balance and chemistry of the
Dead Sea will evolve in the future in the event that no action is taken with
special attention to the following specific questions:
2.1 How will the current physical, chemical and biological parameters of the Dead Sea water change as the water level continues to decline?
Under the current negative water balance, assuming no changes in inflows, climate and activity of the potash industries, the Dead Sea level in the coming decades is expected to continue to decline at a rate of 1.0-1.2 m/yr. This figure is a good basis for estimating the water level in the coming few decades. Over a longer time scale (>30 yrs), the rate of water level decline will decrease. This decrease will be due to the combination of two factors: 1) decrease in surface area, and 2) decrease in the rate of evaporation due to increasing salinity. Eventually, and assuming that the industries cease to operate within a time scale of several decades, the lake is expected to stabilize at a new water level, about 100 meters below its present level, reflecting an equilibrium between inflows and surface evaporation. The future equilibrium in this scenario is expected to occur

Best Available Data Report
RS-DS Water Conveyance Study Program
Z:\IL\201280\R10.054A\BAD_report_revised.doc November 24, 2010 62
after about 200 years. Under these conditions, the monomictic behavior of the Dead Sea will continue, except following particularly rainy winters with increased inflows that may lead to short meromictic (stratified) periods of up to few years. See Section 2.6. As the lake level declines, the salinity, density and temperature of the Dead Sea will continue to rise while halite will continue to precipitate and accumulate on the lake's floor. Precipitation of halite will cease once lake level (and salinity) stabilizes. Gypsum will also continue to precipitate from the brine, although at a decreasing rate, thereby further increasing the Ca2+ /SO4
2- ratio, and thus reducing its solubility. As the solubility decreases, both the kinetics of nucleation and crystal growth will slow down, resulting in a solution that will maintain increasingly higher degrees of gypsum supersaturation. Maximum DSG (degree of gypsum saturation) will be reached when a new steady state between inflow and evaporation will be attained. From that point in time, DSG values will decrease at a very slow rate, in accordance with precipitation kinetics until the attainment of very close to equilibrium conditions. Carnallite is expected to start precipitating only when the water level will approach -500 m. See Sections 2.3 and 2.8.1. It can be expected that in the event that no action is taken and the Dead Sea will continue to dry out, conditions for life in the lake will become more and more difficult. The ever increasing concentrations of divalent cations and decreasing sodium concentrations will make the Dead Sea waters ever more hostile for life, even to the extent that the brines eventually will become sterile. However, during exceptionally rainy years, when massive volumes of flood waters will enter the lake, and cause a natural dilution of the upper water layers, microbial blooms of algae and bacteria can still be expected to occur, similar to the events observed in 1980 and in 1992. Dunaliella which will bloom first temporarily will color the lake green. The algal bloom will soon be followed by a bloom of red halophilic Archaea. Such red blooms may remain present in the lake as long as density stratification will remain, and is expected to disappear after evaporation will have abolished the diluted surface layer. See Sections 2.7 and 2.8.3.
2.2 How will the parameters for the current water balance, and in particular evaporation and ground water depletion, change with time as the sea level declines and what is the projected decline in water level of the Dead Sea with time through to 2060 if there is no action?
Given the continuous negative water balance of the Dead Sea and the impact of the industries, the salinity of the Dead Sea brine will continue to rise and evaporation will decrease. The exact rate of evaporation will depend upon the salinity of the surface water. Since groundwater discharge is limited to the permeable sediments that are located only along streams and do not appear in the deep lake, it is forecasted that the discharge will not change by much with a continuing level decline. The

Best Available Data Report
RS-DS Water Conveyance Study Program
Z:\IL\201280\R10.054A\BAD_report_revised.doc November 24, 2010 63
groundwater will discharge at springs and flow to the lake as surface water. However, deep groundwater may have the potential to ascend along faults and discharge at the deeper parts of the lake, once water level declines. See Section 3.2.
2.3 What will be the impact of the continuing decline of the Dead Sea surface on the adjacent ground water regime on both sides of the Dead Sea and what will be the projected impact of these changes on the development of sink holes?
If there is no action and the Dead Sea level continuous to drop, sinkhole formation will continue and possibly accelerate. It is expected that many more sinkholes will appear in the existing sites. This will continue until the groundwater level will decline below the salt layer. From this point, no additional sinkholes are expected to form in these sites. However, new sites might appear in areas that are currently submersed. Submersed fault lines have the potential to channel fresh water and form new sinkhole sites. The extent of this process is unclear. In the framework of the present study, a detailed geophysical survey to locate these faults will be performed. The assumption used above is that all of the sinkholes form by dissolution of salt from a specific salt layer at depths of less than 100 meters. Until now all of the sinkhole sites were formed where this layer was found. Under extreme conditions of more than 100 meters of drop of the Dead Sea level, other salt layers could play a role in the sinkhole formation. For example, a salt layer exists in the Masada area at a depth of ~300 m.
4.3. Task 3: Base Case Plus
Task 3: Base Case Plus (Addition of Red Sea water and reject brine from the
desalination process). Identify and assess impacts of adding seawater plus reject
brine (in varying proportions and taking into account any proposed “pilot
schemes”, such as, but not limited to, that envisaged under the Jordan Red Sea
Water Project) to the Dead Sea on the water balance, limnology, chemistry and
micro-biology of the Dead Sea. Based on these findings provide specific
answers to the following questions:
3.1 What will be the necessary annual inflow of Red Sea water and/or reject brine from the water conveyance system to raise the sea water level to a range of Target Levels between -433 m and not over -406 m and for a range of Target Years from 2035 to 2050 or even 2075 assuming inflow commences in year 2020?

Best Available Data Report
RS-DS Water Conveyance Study Program
Z:\IL\201280\R10.054A\BAD_report_revised.doc November 24, 2010 64
Currently, some 700-750 MCM of freshwater evaporates from the Dead Sea surface while an approximate additional 250-300 MCM are evaporated by the chemical industries, which together pump out >500 MCM/yr of Dead Sea brine and discharge back some 250 MCM of end brines. In turn, some 300-350 MCM of water flow into the Dead Sea, suggesting an annual water deficit of >700 MCM (in terms of freshwater). Raising the water level of the Dead Sea is expected to change the Dead Sea from a monomictic to a meromictic lake. Stratification of the water column will develop due to dilution of the surface water by the incoming seawater (or reject brine), which in turn will lead to increased water activity and an increased rate of evaporation. The salinity of the surface water will depend on the salinity of the incoming water. Seawater inflow will result in lower upper water salinity (and thus a higher evaporation rate) when compared with inflow of reject brine of a similar volume. Thus, without fully calibrated models it is not possible to provide figures for the volumes of water needed to raise the Dead Sea level to a specific target level. However, regardless of the nature of water to be introduced to the Dead Sea, it is anticipated that if the water level is to be raised at a constant rate, the volume of water that will be required to maintain this rate will have to be increased with time due to the increasing surface area and evaporation rate.
3.2 What will be the necessary annual inflow of Red Sea water and/or reject brine from the water conveyance to maintain the Target Level once this has been reached for a range of Target Levels from -433 m and not over -406 m?
As long as the Dead Sea chemical industries operate, stabilizing the Dead Sea level at the target level will maintain the long term stratification of the lake, in a process similar to that described above. In fact, stratification is expected to develop even if the target level is the level at which seawater is first introduced (i.e. without level rise). To maintain the target level, the inflowing water has to compensate not only for direct evaporation from the Dead Sea surface but also for the net water loss due to the operation of the chemical industries. The potash industries withdraw more than 500 MCM of Dead Sea brine annually and return about 250 MCM of concentrated end brine. Because of the dilution and change in composition of the surface waters, the industries are expected to withdraw their water from the lower water mass of the stratified Dead Sea. As a result, the lower water body will shrink over the long run, while the thickness of the upper mixed layer will increase. Thus, the salinity and composition of the surface water as well as the rate of evaporation will continue to change with time, although probably at lower rates than during the first phase, when lake level will rise.
3.3 What will be the short and long term impact on the ground water regime on both sides of the Dead Sea, and in particular the saline water/fresh water boundary, for the range of Target Levels discussed above? What will be the

Best Available Data Report
RS-DS Water Conveyance Study Program
Z:\IL\201280\R10.054A\BAD_report_revised.doc November 24, 2010 65
impact on the evolution of sink holes if the Dead Sea is stabilized at different Target Levels through the range of -433 m and not over -406 m?
If the level of the Dead Sea will rise as a result of Red Sea water inflow, the springs along the shores will retreat (and rise) away from the rising waters. However, some time lag is expected between the level change and the response of the fresh/saline interface. During this time lag, which could last for a couple of years, the groundwater discharge will temporarily decrease before recovering to its present values. The long term stratification of the Dead Sea water body might create complex groundwater interfaces. Water from the diluted upper layer might flow into the aquifer and dissolve salt. Therefore, sinkhole formation potential might actually increase. However, such complex flow will not occur in all cases and will depend upon the thickness and on the salinity of the upper layer.
3.4 How will the volumes of inflow of 0.4, 1.0, 1.5 and 2.0 billion cubic metres/year from the Gulf of Aqaba/Eilat affect the physical chemical and biological baseline parameters of the Dead Sea? How will these changes affect stratification of the water, salt precipitation and evaporation?
As outlined above, raising and/or stabilizing the Dead Sea water level to a given target level will lead to stratification of the water column and a change from a monomictic lake, to a meromictic lake. Salinity and density of the surface water is expected to decrease while water level rises and also after the target level has been attained and is stabilized (see above). The time allocated to attain the target level will not only determine the required inflow volume, but also the density and salinity of the brine once this level has been reached. Higher inflow rates will lead to lower salinity and density of the surface water. As outlined below, the lower salinity is likely to promote biological blooming in the surface water. The dissolved salts that will be introduced with the inflow of seawater (or reject brine from desalination) to the upper water column will accumulate there (except for the ions removed as chemical precipitates). With time, this will have the effect of changing the composition of the surface water towards that of evaporated seawater. As outlined above, the interplay between dilution due to the inflow of seawater and the buffering effect on reducing the salinity due to salt accumulation in the upper water column cannot be resolved without proper modeling of the system. Long-term stratification of the water column (meromixis) will not occur if the total inflow volumes to the Dead Sea will not exceed a certain threshold volume. Without running the limnological models, this threshold volume can only be roughly estimated as the volume of water that currently evaporates from the Dead Sea (700-750 MCM/yr). Given the present inflow volume to the Dead Sea of 300- 350 MCM/yr, it is estimated that additional inflow volumes of less than 400

Best Available Data Report
RS-DS Water Conveyance Study Program
Z:\IL\201280\R10.054A\BAD_report_revised.doc November 24, 2010 66
MCM will not lead to meromixis (permanent stratification). It should be kept in mind that these values are only rough estimates, as they do not include the dynamics of the system, nor do they account for salinity, thermodynamics and other effects It should be noted that discharge of relatively small volumes of seawater or reject brine which would not lead to the development of stratification would result in the inflowing water mixing with the entire water column of the Dead Sea. Under such a scenario, the Dead Sea level will continue to drop because of the combined effect of the industrial pumping, and the excess evaporation over total inflow. On the short term (decades?) the impact of seawater inflow on the composition of the lake in this case will be relatively small due to two reasons: 1) smaller inflow volumes imply less inflow of foreign salts to the lake, and 2) mixing will no longer be restricted to the upper water column but will occur within the bulk volume of the Dead Sea, effectively reducing the mixing ratio between seawater and Dead Sea brine. As in all other scenarios, gypsum is expected to precipitate due to the mixing (at smaller quantities due to less sulfate input). Under such conditions, halite is likely to continue to precipitate from the brine, although at a lowered rate.
3.5 What will be the changes in circulation, stratification and layering of the Dead Sea water body due to different rates of Red Sea water and/or reject brine discharge and at a variety of different discharge locations and configurations?
Data on the circulation in the Dead Sea is restricted to the southwestern part of the lake, where initial data was collected for the first time only last year. Therefore, it is not possible to predict how circulation will change due to different discharge locations and configurations.
3.6 What chemical changes will the mixing of the two water types induce? In particular, what will be the probability and impacts of gypsum precipitation and its geochemical appearance (suspension or sedimentation), including time in suspension and areal extent for different discharge locations and configurations?
Inflow of (sulfate-rich) seawater is bound to increase the rate of gypsum precipitation from the Dead Sea, with increasing inflow volumes leading to increased rate of gypsum precipitation. In contrast, once stratification develops and the surface water is diluted, halite which currently precipitates from the Dead Sea will temporarily cease precipitating. Once stratification develops, the change in the overall composition of the Dead Sea brine will mostly be restricted to the upper water column. The lower water body which will no longer be aerated may develop anoxic conditions. Bacterial sulfate reduction may develop in these water with H2S accumulating there. However, it should be noted that experiments at the salinity of the Dead Sea have so far not been able to initiate such sulfate reductions.

Best Available Data Report
RS-DS Water Conveyance Study Program
Z:\IL\201280\R10.054A\BAD_report_revised.doc November 24, 2010 67
Inflow volumes that will not lead to stratification of the water column will have a more limited impact on the chemical composition of the Dead Sea, for the following two reasons: 1) smaller net input of seawater-derived salts to the Dead Sea, and 2) mixing with the entire water column implies more efficient mixing and dilution of the input as compared with mixing only with the upper water column. Gypsum precipitation from the Dead Sea will increase relative to present day rate even if the inflow volumes of seawater will be limited to the extend that stratification will not develop. Under such a scenario, it is possible that halite will continue to precipitate from the Dead Sea although at a lower rate. Based upon the present understanding of the kinetics, it is expected that the average rate of gypsum nucleation and crystal growth in the lake would increase as well. The relative increase in the rate of the two processes is not yet known and it is therefore not possible to assess the possibility of "whitening" of the surface water.
3.7 What biological changes will the mixing of the two water types induce? This would include the probability of any impacts and the intensity, duration and consequences of potential micro-biological blooming for different discharge locations and configurations
Based on the field and laboratory experiments described in Sections 2.7 and 2.8.3 it is predicted that the dilution of the upper layers of the Dead Sea with Red Sea or desalination reject brine may cause dense and highly stable blooms of microorganisms. At least 10%-15% dilution is necessary to trigger the development of such blooms; the exact threshold is yet to be determined. Also the growth rates under different salinities and temperatures are still to be determined. It should be noted that dilution of Dead Sea water with Red Sea water will not only change the overall salinity, but also the ionic composition. The relative concentration of sodium in the upper layers will be increased, and this will make the waters less inhibitory to halophilic microorganisms than the current magnesium- and calcium-dominated brines. Dilution of the upper layers to salinities low enough to support growth of cyanobacteria may lead to the accumulation of masses of cyanobacterial cells floating on the water and excreting massive amounts of refractory polysaccharides. At this stage it cannot be predicted if stratification and presence of microbial communities and algal primary production in the upper water layers will eventually lead to oxygen depletion and accumulation of sulfide by bacterial sulfate reduction in the hypoliminon (lower water column), such as existed prior to 1979 (Nissenbaum and Kaplan, 1976). There is insufficient knowledge about the anaerobic processes (if any) currently occurring in the lake bottom, where the salinity will probably not be influenced to a significant extent by the inflow of less saline seawater. However, even if such sulfide formation does occur it would not reach the surface and will not impact the lake's appearance or environment.

Best Available Data Report
RS-DS Water Conveyance Study Program
Z:\IL\201280\R10.054A\BAD_report_revised.doc November 24, 2010 68
An exception to this would be in the vicinity of the pumping facilities of the industries, which are expected to pump their brine from the lower water layer. If sulfate reduction will occur in the hypolimnion, the industries will also be pumping sulfide which will then impact on the local environment.

Best Available Data Report
RS-DS Water Conveyance Study Program
Z:\IL\201280\R10.054A\BAD_report_revised.doc November 24, 2010 69
5. References
5.1. Dead Sea – Existing Information
5.1.1. Background
Abelson, M., Steinberg, J., Kurzon, I., and Crouvi, O. (2003a). Development of the Dead Sea sinkholes – Detection from aerial photographs between July 2001-November 2002, Geological Survey of Israel, Report GSI/44/2003 (in Hebrew). Abelson, M., Baer, G., Shtivelman, V., Wachs, D., Raz, E., Crouvi, O., Kruzon, I., and Yechieli, Y. (2003b). Collapse-sinkholes and radar interferometry reveal neotectonics concealed within the Dead Sea basin: Geophys. Res. Lett., v. 30, p. 52, doi:10.1029/2003GL017103.
Baer, G., Schattner, U., Wachs, D., Sandwell, D., Wdowinski, S., and Frydman, S. (2002). The lowest place on Earth is subsiding - An InSAR (interferometric synthetic aperture radar) perspective: Geological Society of America Bulletin, 114 (1): 12-23.
Garfunkel, Z. and Ben-Avraham, Z. (1996). The structure of the Dead Sea basin: Tectonophysics, 266:155-176. Ken-Tor, R., Enzel, Y., Agnon, A., and Stein, M. (2004). Late Holocene lake-levels of the Dead Sea. Bull. Geol. Soc. Am., 116(5-6): 555-571; doi: 10.1130/B25286.1
Kushnir, Y. and Stein, M. (2010) The role of North Atlantic SST in Levant-Sahel precipitation variability during the Holocene. Quaternary Science Reviews, in press. Quennell, A.M. (1959). Tectonics of the Dead Sea rift. Proc. 20th International Geological Congress, Mexico, 1956, Associacion de Servicos Geologicos Africanos, 385-403. Stein, M., Torfstein, A., Gavrieli, I., and Yechieli, Y. (2010). Abrupt aridities and salt deposition in the post-glacial Dead Sea and their North Atlantic connection. Quaternary Science Review 29: 567-575.

Best Available Data Report
RS-DS Water Conveyance Study Program
Z:\IL\201280\R10.054A\BAD_report_revised.doc November 24, 2010 70
5.1.2. Historical Water Level
Al Weshah, R. (2000). The water balance of the Dead Sea. Hydrol. Proc. 14: 145-154.
Bartov, Y., Goldstein, S. L., Stein, M., and Enzel, Y. (2003). Catastrophic arid episodes in the Eastern Mediterranean linked with the North Atlantic Heinrich events. Geology 31: 439-442. Beyth, M., Gavrieli, I., Anati, D., and Katz, O. (1993). Effects of the December 1991-May 1992 floods on the Dead Sea vertical structure. Isr. J. Earth Sci. 42:45-47. Farber, E., Vengosh, A., Gavrieli, I., Amer, M., Bullen, T.D., Mayer, B., Holtzman, R., Segal-Rozenhaimer M., and Shavit U. (2004). The origin and mechanisms of salinization of the lower Jordan River. Geochim. Cosmochim. Acta. 68: 1989-2006. Friends of the Earth Middle East, Towards a Living Jordan River (2010). An Environmental Flows Report on the Rehabilitation of the Lower Jordan River.
Salameh, E. and El-Naser, H. (1999). Does the actual drop in the Dead Sea level reflect the development of water sources within its drainage basin? Acta Hydrochim. Hydrobiol. 27: 5-11. Salameh, E. and El-Naser, H. (2000a). Changes in the Dead Sea level and their impacts on the surrounding groundwater bodies, Acta Hydrochim. Hydrobiol., 28: 24-33. Salameh, E. and El-Naser, H. (2000b). The interface configuration of the fresh-/Dead Sea water – Theory and measurements, Acta Hydrochim. Hydrobiol., 28: 323-328.
5.1.3. Dead Sea Brine Evolution and Chemistry
Ben-Yaakov, S. and Sass, E. (1977). Independent estimate of the pH of Dead Sea brines. Limnol. Oceanogr. 22: 374-376.
Gavrieli, I. and Oren A. (2004). The Dead Sea as a dying lake. pp. 287-305 in J. C. J. Nihoul, P. O. Zavialov, and P. P. Micklin (eds). Dying and Dead Seas, Climatic Versus Anthropogenic Causes. Kluwer Academic Publishers, Dordrecht, The Netherlands.

Best Available Data Report
RS-DS Water Conveyance Study Program
Z:\IL\201280\R10.054A\BAD_report_revised.doc November 24, 2010 71
Katz, A. and Starinsky, A. (2009). Geochemical history of the Dead Sea, Aquat. Geochem. 15:159–194.
Lazar, B., personal communication (from Hebrew University) Nissenbaum, A., Stiller, M., and Nishri, A. (1990). Nutrients in pore waters from Dead Sea sediments. Hydrobiologia 197: 83-90.
Shatkay, M. (1991). Dissolved oxygen in highly saline sodium chloride solutions and in the Dead Sea – measurements of its concentration and isotopic composition. Mar. Chem. 32: 89-99. Shatkay, M., Anati, D.A., and Gat, J.R. (1993). Dissolved oxygen in the Dead Sea – seasonal changes during the holomictic stage. Int. J. Salt Lake Res. 2: 93-110. Singer, A., Ganor, E., Dultz, S., and Fische, W. (2003). Dust deposition over the Dead Sea. J. Arid Environ. 53: 41-59.
Starinsky, A. (1974). Relationship between Ca-chloride brines and sedimentary rocks in Israel. PhD dissertation, Hebrew Univ. Jerusalem, 176 pp. (in Hebrew, English Abstr.). Stein, M. (2001). The sedimentary and geochemical record of Neogene – Quaternary water bodies in the Dead Sea Basin – inferences for the regional paleoclimatic history. J. Paleolimnol. 26: 271-282.
Stiller, M. and Nissenbaum, A. (1999). Geochemical investigation of phosphorus and nitrogen in the hypersaline Dead Sea. Geochim. Cosmochim. Acta 63: 3467-3475. Zak, I. (1967). The geology of Mount Sedom. PhD dissertation, Hebrew Univ. Jerusalem, 207 pp. (in Hebrew, English summary).
5.1.4. Precipitation of Salts
Anati, D.A., Gavrieli, I., and Oren, A. (1995). The residual effect of the 1991-1993 rainy winters on the Dead Sea stratification. Isr. J. Earth Sci. 44: 63-70. Beyth, M., Gavrieli, I., Anati, D., and Katz, O. (1993). Effects of the December 1991-May 1992 floods on the Dead Sea vertical structure. Isr. J. Earth Sci. 42:45-47.

Best Available Data Report
RS-DS Water Conveyance Study Program
Z:\IL\201280\R10.054A\BAD_report_revised.doc November 24, 2010 72
Begin, Z.B., Ehrlich, A., and Nathan, Y. (1974). Lake Lisan- the precursor of the Dead Sea. Geol. Surv. Isr. Bull. 63: 30 pp. Bloch, R., Littman, H.Z., and Elazari-Volcani, B. (1943). Occasional whiteness of the Dead Sea. Nature 154: 402-403.
Gavrieli, I. (1997). Halite deposition in the Dead Sea: 1960-1993, pp. 161-170. In: Niemi, T., Ben-Avraham, Z., and Gat, J.R. (eds.), The Dead Sea - the Lake and its Setting. Oxford University Press, Oxford.
Gavrieli, I., Starinsky, A., and Bein, A. (1989). The solubility of halite as a function of temperature in the highly saline Dead Sea brine system. Limnol. Oceanogr. 34: 1224-1234. Herut, B., Gavrieli, I., and Halicz, L. (1998). Coprecipitation of trace and minor elements in modern authigenic halites from the hypersaline Dead Sea brine. Geochimica et Cosmochimica Acta 62: 1587-1598.
Neev, D. and Emery, K.O. (1967). The Dead Sea. Depositional Processes and Environments of Evaporites. Bulletin No. 41, State of Israel, Ministry of Development, Geological Survey, 147 pp.
Reznik, I. J., Gavrieli, I., and Ganor, J. (2009b). Kinetics of gypsum nucleation and crystal growth from Dead Sea brine. Geochimica et Cosmochimica Acta 73: 6218-6230.
Steinhorn, I. (1983). In situ salt precipitation at the Dead Sea. Limnol. Oceanogr. 28: 580-583.
5.1.5. Hydrography
Anati, D.A. (1997). The hydrography of a hypersaline lake, pp. 89-103. In: Niemi, T., Ben-Avraham, Z., and Gat, J.R. (eds.), The Dead Sea - the Lake and its Setting. Oxford University Press, Oxford. Anati, D.A. (1998). Dead Sea water trajectories in the T-S space. Hydrobiologia 381: 43-49.
Anati, D.A. and Stiller, M. (1991). The post-1979 thermohaline structure of the Dead Sea and the role of double-diffusivity. Limnol. Oceanogr. 36: 342-354. Anati, D.A., Stiller, M., Shasha, S., and Gat, J.R. (1987). Changes in the thermo-haline�structure of the Dead Sea. Earth Planet. Sci. Lett. 84: 109-121.

Best Available Data Report
RS-DS Water Conveyance Study Program
Z:\IL\201280\R10.054A\BAD_report_revised.doc November 24, 2010 73
Anati, D.A., Gavrieli, I., and Oren, A. (1995). The residual effect of the 1991-1993 rainy winters on the Dead Sea stratification. Isr. J. Earth Sci. 44: 63-70.
Beyth, M. (1980). Recent evolution and present stage of the Dead Sea brines, pp. 155-166 In: Nissenbaum, A. (ed.), Hypersaline Brines and Evaporitic Environments. Amsterdam, Elsevier Scientific Publushers. Beyth, M., Gavrieli, I., Anati, D., and Katz, O. (1993). Effects of the December 1991 – May 1992 floods on the Dead Sea vertical structure. Israel J. Earth Sci. 42: 45-47.
Gavrieli, I., Beyth, M., and Yechieli, Y. (1999). The Dead Sea - A terminal lake in the Dead Sea rift: a short overview, pp. 121-127 In: Oren, A. (ed.). Microbiology and Biogeochemistry of Hypersaline Environments. CRC Press, Boca Raton, Florida.
Gertman, I. and A. Hecht (2002). The Dead Sea hydrography from 1992 to 2000. J. Mar. Syst. 35:169-181.
Lensky, N., Gertman, I., Rosentraub, Z., Lensky, I., Gavrieli I. and Nehorai R. (2010a). Alternative dumping sites in the Dead Sea for harvested salt from pond 5: Currents in the Dead Sea during summer 2009. GSI report GSI-01-2010. Lensky, N., Gertman, I., Rosentraub, Z., Lensky, I. Gavrieli, I., Calvo, R., and Katz, O. (2010b). Alternative dumping sites in the Dead Sea for harvested salt from pond. 5: Final report. GSI report GSI-05-2010. Miller, R.L. and Mckee, B.A. (2004). Using MODIS Terra 250 m imagery to map concentrations of total suspended matter in coastal waters. Remote Sensing of Environment. 93:259-266. Neev, D. and Emery, K. O. (1967). The Dead Sea Depositional Processes and Environments of Evaporites. Geological Survey of Israel, Bulletin No. 41.
Nehorai, R., Lensky, I. M., Lensky, N. G., and Shiff, S. (2009). Remote sensing of the Dead Sea surface temperature, J. Geophys. Res., 114, C05021, doi:10.1029/2008JC005196.
Steinhorn, I. (1980). The density of the Dead Sea water as a function of temperature and salt concentration. Isr. J. Earth Sci. 29: 191-196. Steinhorn, I. and Gat, J. R. (1983). The Dead Sea. Sci. Amer. 249:102-109.

Best Available Data Report
RS-DS Water Conveyance Study Program
Z:\IL\201280\R10.054A\BAD_report_revised.doc November 24, 2010 74
Steinhorn, I., Assaf, G., Gat, J. R., Nishry, A. Nissenbaum, A., Stiller, M., Beyth, M., Neev, D., Garber, R., Friedman, G. M., and Weiss, W. (1979). The Dead Sea; deepening of the mixolimnion signifies the overture to overturn of the water column. Science 206:55-57. Stiller, M. and Chung, Y. C. (1984). Radium in the Dead Sea: A possible tracer for the duration of meromixis. Limnol. Oceanogr. 29:574-586.
Stiller, M., Gat, J.R., Boumann, N., and Shasha, S. (1984). A short meromictic episode in the Dead Sea: 1979-1982. Verh. Int. Verein Limnol. 22: 132-135. Thiessen, A. H. (1911), Precipitation averages for large areas, Mon. Weather Rev., 39(7): 1082 – 1084.
5.1.6. Energy and Mass Balance
Klein, M. (1998). Water balance of the Upper Jordan River Basin. Water Int. 23: 244-248.
Lensky, N., Dvorkin, Y., Lyakhovsky, V., Gertman, I., and Gavrieli, I. (2005). Water, salt, and energy balance of the Dead Sea. Water Res. Res. 41, doi:10.1029/2005WR004084.
Neumann, J. (1958). Tentative energy and water balances for the Dead Sea. Bull. Res. Counc. of Israel 7G, 137-163.
Salameh, E. and El-Naser, H. (1999). Does the actual drop in the Dead Sea level reflect the development of water sources within its drainage basin? Acta Hydrochim. Hydrobiol. 27: 5-11. Salhotra, A. M., Adams, E. E., and Harleman, D. R. F. (1985). Effect of salinity and ionic composition on evaporation: analysis of the Dead Sea evaporation pans. Water Resour. Res. 21: 1336-1344. Salhotra, A. M., Adams, E. E., and Harleman, D. R. F. (1987). The Alpha, Beta, Gamma of evaporation from saline water bodies. Water Resour. Res. 23: 1769-1774.
Stanhill, G. (1994). Changes in the rate of evaporation from the Dead Sea. Int. J. Climatol. 14: 465-471.

Best Available Data Report
RS-DS Water Conveyance Study Program
Z:\IL\201280\R10.054A\BAD_report_revised.doc November 24, 2010 75
Steinhorn, I. (1991). On the concept of evaporation from fresh and saline bodies. Water Resour. Res. 27: 645-648. Stumm, W. and Morgan, J. J. (1981). Aquatic Chemistry. John Wiley, New York.
Winter, T. C., Buso, D. C., Rosenberry, D. O., Likens, G. E., Sturrock, A. M. J., and Mau, D. P. (2003). Evaporation determined by the energy-budget method for Mirror Lake, New Hampshire. Limnol. Oceanogr. 48: 995-1009.
5.1.7. Life in the Dead Sea
Bodaker, I., Sharon, I., Suzuki, M.T., Reingersch, R., Shmoish, M., Andreishcheva, E., Sogin, M.L., Rosenberg, M., Belkin, S., Oren, A., and Béjà, O. (2010). The dying Dead Sea: comparative community genomics in an increasingly extreme environment. ISME J. 4: 399-407.
Kaplan, I.R. and Friedmann, A. (1970). Biological productivity in the Dead Sea. Part 1. Microorganisms in the water column. Israel J. Chem. 8: 513-528. Nissenbaum A. and Kaplan I. (1976). Sulfur and carbon isotopic evidence for biogeochemical processes in the Dead Sea ecosystem, pp. 309-325 In: Nriagu, J. (ed.). Environmental Biogeochemistry, Ann Arbor Sci., Publ., Ann Arbor, Michigan.
Oren, A. (1983a). Population dynamics of halobacteria in the Dead Sea water column. Limnol. Oceanogr. 28: 1094-1103. Oren, A. (1983b). Halobacterium sodomense sp. nov., a Dead Sea halobacterium with extremely high magnesium requirement and tolerance. Int. J. Syst. Bacteriol. 33: 381-386. Oren, A. (1983c). Clostridium lortetii sp. nov., a halophilic obligately anaerobic bacterium producing endospores with attached gas vacuoles. Arch. Microbiol. 136: 42-48. Oren, A. (1985). The rise and decline of a bloom of halobacteria in the Dead Sea. Limnol. Oceanogr. 30: 911-915. Oren, A. (1988). The microbial ecology of the Dead Sea, pp. 193-229 In: Marshall, K.C. (ed.), Advances in Microbial Ecology, Vol. 10. Plenum Publishing Company, New York. Oren, A. (1992). Bacterial activities in the Dead Sea, 1980-1991: survival at the upper limit of salinity. Int. J. Salt Lake Res. 1: 7-20.

Best Available Data Report
RS-DS Water Conveyance Study Program
Z:\IL\201280\R10.054A\BAD_report_revised.doc November 24, 2010 76
Oren, A. (1997). Microbiological studies in the Dead Sea: 1892-1992, pp. 205-213 In: Niemi, T., Ben-Avraham, Z., and Gat, J.R. (eds.), The Dead Sea - the Lake and its Setting. Oxford University Press, Oxford. Oren, A. (1999). Microbiological studies in the Dead Sea: future challenges toward the understanding of life at the limit of salt concentrations. Hydrobiologia 205: 1-9. Oren, A. (2000). Biological processes in the Dead Sea as influenced by short-term and long-term salinity changes. Arch. Hydrobiol. Spec. Issues Advanc. Limnol. 55: 531-542. Oren, A. (2003). Biodiversity and community dynamics in the Dead Sea: Archaea, bacteria and eucaryotic algae. pp. 117-140 In: Nevo, E., Oren, A., and Wasser, S.P. (eds.), Fungal life in the Dead Sea. A.R.G. Gantner Verlag, Ruggell. Oren, A. and Ben-Yosef, N. (1997). Development and spatial distribution of an algal bloom in the Dead Sea: a remote sensing study. Aquat. Microb. Ecol. 13: 219-223.
Oren, A. and Gurevich, P. (1993). Characterization of the dominant halophilic archaea in a bacterial bloom in the Dead Sea. FEMS Microbiol. Ecol. 12: 249-256.
Oren, A. and Gurevich, P. (1995). Dynamics of a bloom of halophilic archaea in the Dead Sea. Hydrobiologia 315: 149-158.
Oren, A. and Shilo, M. (1982). Population dynamics of Dunaliella parva in the Dead Sea. Limnol. Oceanogr. 27: 201-211. Oren, A. and Shilo, M. (1985). Factors determining the development of algal and bacterial blooms in the Dead Sea: a study of simulation experiments in outdoor ponds. FEMS Microbiol. Ecol. 31: 229-237. Oren, A., Weisburg, W.G., Kessel, M., and Woese, C.R. (1984). Halobacteroides halobius gen. nov., sp. nov., a moderately halophilic anaerobic bacterium from the bottom sediments of the Dead Sea. System. Appl. Microbiol. 5: 58-69. Oren, A., Pohla, H., and Stackebrandt, E. (1987). Transfer of Clostridium lortetii to a new genus Sporohalobacter gen. nov. as Sporohalobacter lortetii comb. nov., and description of Sporohalobacter marismortui sp. nov. System. Appl. Microbiol. 9: 239-246.

Best Available Data Report
RS-DS Water Conveyance Study Program
Z:\IL\201280\R10.054A\BAD_report_revised.doc November 24, 2010 77
Oren, A., Gurevich, P., Anati, D.A., Barkan, E., and Luz, B. (1995a). A bloom of Dunaliella parva in the Dead Sea in 1992: biological and biogeochemical aspects. Hydrobiologia 297: 173-185.
Oren, A., Gurevich, P., Gemmell, R.T., and Teske, A. (1995b). Halobaculum gomorrense gen. nov., sp. nov., a novel extremely halophilic Archaeon from the Dead Sea. Int. J. Syst. Bacteriol. 45: 747-754.
Oren, A., Bratbak, G., and Heldal, M. (1997). Occurrence of virus-like particles in the Dead Sea. Extremophiles 1: 143-149. Switzer Blum, J., Stolz, J.F., Oren, A., and Oremland, R.S. (2001). Selenihalanaerobacter shriftii gen. nov., sp. nov., a halophilic anaerobe from Dead Sea sediments that respires selenate. Arch. Microbiol. 175: 208-219.
5.1.8. Expected Impact due to RSDSC
Alimi, F. and Gadri, A. (2004). Kinetics and morphology of formed gypsum. Desalination 166: 427-434. Barbier, E., Coste, M., Genin, A., Jung, D., Lemoine, C., Logette, S., and Muhr, H. (2009). Simultaneous determination of nucleation and crystal growth kinetics of gypsum. Chemical Engineering Science 64: 363-369.
Ben Yaakov, S. and Katz, A. (1982). Field experiments in mixing Mediterranean water with Dead Sea water. Preliminary report for the period July – Oct 1982. In Hebrew, Rep submitted to the Mediterranean – Dead Sea Co. 87 p.
Bloch, R., Littman, H. Z., and Elazari-Volcani, B. (1944). Occasional whiteness of the Dead Sea. Nature 154: 402-403. Christoffersen, J., Christoffersen, M. R., Van Rosmalen, G. M., and Marchee, W. G. J. (1979). The affinity of crystal growth and dissolution in aqueous solution with special reference to calcium sulphate dihydrate. Journal of Crystal Growth 47: 607-612. Christoffersen, M. R., Christoffersen, J., Weijnen, M. P. C., and Van Rosmalen, G.M. (1982). Crystal growth of calcium sulphate dihydrate at low supersaturation. Journal of Crystal Growth 58: 585-595. Cody, A. M. and Cody, R. D. (1989). SEM and polarization analyzes updating early light microscope studies related to {101} twin formation in gypsum. Journal of Crystal Growth 98: 731-738.

Best Available Data Report
RS-DS Water Conveyance Study Program
Z:\IL\201280\R10.054A\BAD_report_revised.doc November 24, 2010 78
Cole, T. and Wells, S.A. (2008). “CE-QUAL-W2: A Two-Dimensional, Laterally Averaged, Hydrodynamic and Water Quality Model, Version 3.6” Department of Civil and Environmental Engineering, Portland State University, Portland, OR
Dor, I. and Hornoff, M. (1985). Studies on Aphanothece halophytica Fremy from a solar pond: comparison of two isolates on the basis of cell polymorphism and growth responses to salinity, temperature and light conditions. Bot. Mar. 28: 389-398. Dvorkin, Y., Lensky, N.G., Lyakhovsky, V., and Gavrieli, I. (2007). Description and benchmarking of the 1D multi-component chemistry-based model for the Dead Sea. Isr. Geol. Surv. Rep. GSI/15/2007. Edinger, S. E. (1973). An investigation of the factors which affect the size and growth rates of the habit faces of gypsum. Journal of Crystal Growth 18: 217-224. Gavrieli, I. (1997). Halite deposition in the Dead Sea: 1960-1993. pp. 161-170. In: Niemi, T., Ben-Avraham, Z., and Gat, J. R. (eds.), The Dead Sea - the Lake and its Setting, Oxford University Press, Oxford. Gavrieli, I., Lanski, N., Yaari-Gazit, N., and Oren, A. (2002). The impact of the proposed “Peace Conduit” on the Dead Sea. Evaluation of current knowledge on Dead Sea – seawater mixing. The Geological Survey of Israel, Report GSI/23/2002, 42 pp. Gavrieli, I., Bein, A., and Oren A. (2003). The expected impact of the “Peace Conduit". Mitigation and Adaptation Strategies for Global Change. 10(1): 3-22. Erratum: p. 739 and pp. 759-777.
Gavrieli, I., Lensky, N. G., Dvorkin, Y., Lyakhovsky, V., and Gertman, I. (2006). A multi-component chemistry-based model for the Dead Sea: Modification to the 1DPrinceton Ocean Model. Isr. Geol. Surv. Rep. GSI/24/06. Gertman, I. and Hecht, A. (2002). The Dead Sea hydrography from 1992 to 2000. J. Mar. Syst. 35:169-181.
Gill, J. S. and Nancollas, G. H. (1979). The growth of gypsum crystals on barite and calcite. Desalination 29: 247-254.
Hasson, D., Drak, A., and Semiat, R. (2003). Induction times induced in an RO system by antiscalants delaying CaSO4 precipitation. Desalination 157: 193-207.

Best Available Data Report
RS-DS Water Conveyance Study Program
Z:\IL\201280\R10.054A\BAD_report_revised.doc November 24, 2010 79
He, S., Oddo, J. E., and Tomson, M. B. (1994a). The nucleation kinetics of calcium sulfate dihydrate in NaCl solutions up to 6 M and 90°C. Journal of Colloid and Interface Science 162: 297-303.
He, S., Oddo, J. E., and Tomson, M. B. (1994b). The seeded growth of calcium sulfate dihydrate crystals in NaCl solutions up to 6 M and 90ºC. Journal of Colloid and Interface Science 163: 372-378.
Kagawa, M., Sheehan, M. E., and Nancollas, G. H. (1981). The crystal growth of gypsum in an ammoniacal environment. Journal of Inorganic and Nuclear Chemistry 43: 917-920.
Katz, A., Starinsky, A., Taitel-Goldman, N., and Beyth, M. (1981). Solubilities of gypsum and halite in the Dead Sea and in its mixtures with seawater. Limnology and Oceanography 26; 709-716.
Krumgalz, B. S. and Millero, F. J. (1982). Physico-chemical study of the Dead Sea Waters. I. Activity coefficients of major ions in Dead Sea water. Marine Chemistry 11: 209-222. Krumgalz, B. S. and Millero, F. J. (1983). Physico-chemical study of the Dead Sea Waters. III. On gypsum saturation in Dead Sea waters and their mixtures with Mediterranean Sea Water. Marine Chemistry 13: 127-139. Lensky, N., Dvorkin, Y., Lyakhovsky, V., Gertman, I., and Gavrieli, I. (2005). Water, salt, and energy balance of the Dead Sea. Water Res. Res. 41, doi:10.1029/2005WR004084.
Levy, Y. and Kushnir, Y. (1981). Laboratory measurements of nucleation processes and the growth of gypsum in the Mediterranean - Dead Sea mixed brine. Geol. Surv. Isr. Rep. and Weizmann Inst. Sci., 18.
Levy, Y. (1982). Calculations of chemical composition of mixed layers of Mediterranean Sea and Dead Sea water. Geol. Surv. Isr. Rep. MGG/1/82.
Levy, Y. (1984). The influence of the admixture rate of partly evaporated Mediterranean water to the Dead Sea on the properties of gypsum that is formed in the brine. Mediterranean - Dead Sea projects; summary of research and surveys. Mediterranean- Dead Sea Co. 5: 279-282 (in Hebrew). Mediterranean - Dead Sea Company (1984). Mediterranean - Dead Sea projects. Vol. 5, summary of research and surveys. (reports in Hebrew and English). 467.

Best Available Data Report
RS-DS Water Conveyance Study Program
Z:\IL\201280\R10.054A\BAD_report_revised.doc November 24, 2010 80
Oren, A. and Shilo, M. (1985). Factors determining the development of algal and bacterial blooms in the Dead Sea: a study of simulation experiments in outdoor ponds. FEMS Microbiol. Ecol. 31: 229-237.
Oren, A. (2003). Biodiversity and community dynamics in the Dead Sea: Archaea, bacteria and eucaryotic algae. pp. 117-140 In: Nevo, E., Oren, A., and Wasser, S.P. (eds.), Fungal Life in the Dead Sea. A.R.G. Gantner Verlag, Ruggell. Oren, A., Gavrieli, I., Gavrieli, J., Lati, J., Kohen, M., and Aharoni, M. (2004). Biological effects of dilution of Dead Sea water with seawater: implications for the planning of the Red Sea – Dead Sea “Peace Conduit”. J. Mar. Syst. 46: 121-131.
Oren, A., Gavrieli, I., Gavrieli, J., Kohen, M., Lati, J., and Aharoni, M. (2005a). Microbial communities in the Dead Sea – past, present and future. pp. 27-39. In: Gunde-Cimerman, N., Oren, A., and Plemenitaš, A. (eds.). Adaptation to Life at High Salt Concentrations in Archaea, Bacteria, and Eukarya. Springer, Dordrecht. Oren, A., Gavrieli, I, Gavrieli, J., Kohen, M., Lati, J., and Aharoni, M. (2005b). Long term biological simulation experiments of mixing of Dead Sea water with Red Sea water, and the effect of antiscalants on the biology of the Dead Sea. Report GSI/28/2005 - State of Israel, Ministry of National Infrastructures, Geological Survey of Israel, 43 pp. Oren, A., Gavrieli, I., Gavrieli, J., Kohen, M., Lati, M., and Aharoni, M. (2006). Long-term field simulation of algal and archaeal blooms in the Dead Sea. pp. 47-62. In: I. Gavrieli et al., A multi-component chemistry-based model for the Dead Sea: modifications of the 1D Princeton oceanographic model. Report GSI/24/2006, State of Israel, Ministry of National Infrastructures, Geological Survey of Israel. Oren, A., Gavrieli, J., Kohen, M., Lati, J., Aharoni, M., and Gavrieli, I. (2009). Long-term mesocosm simulation of algal and archaeal blooms in the Dead Sea following dilution with Red Sea water. pp. 145-151. In: Oren, A., Naftz, D.L., Palacios, P., and Wurtsbaugh, W.A. (eds.), Saline Lakes around the World: Unique Systems with Unique Values. The S.J. and Jessie E. Quinney Natural Resources Research Library, College of Natural Resources, Utah State University. Parkhurst, D. L. and Appelo, C. A. J. (1999). PHREEQC 2.15 A computer program for speciation, batch-reaction, one-dimensional transport and inverse geochemical calculation. Water- Resources Investigation Report 99-4259. U.S. Geological Survey.

Best Available Data Report
RS-DS Water Conveyance Study Program
Z:\IL\201280\R10.054A\BAD_report_revised.doc November 24, 2010 81
Pitzer, K. S. (1979). Theory, ion interaction approach. In: Pytkowicz, R. M. (ed.), Activity Coefficients in Electrolyte Solutions. CRC Press, Boca Raton, Florida, USA. Reznik, I. J., Ganor, J., Gal, A., and Gavrieli, I. (2009a). Gypsum saturation degrees and precipitation potential from Dead Sea-Seawater mixtures - Implication for the Red Sea - Dead Sea Conduit. Environmental Chemistry 6: 416-423.
Reznik, I. J., Ganor, J., Gruber, C., and Gavrieli, I. (in preparation). Towards the establishment of a general rate law for gypsum nucleation. Reznik, I. J., Gavrieli, I., Antler, G., and Ganor, J. (submitted). Kinetics of gypsum crystal growth from high ionic strength solutions; case study of Dead Sea- seawater mixtures. Submitted to Geochimica et Cosmochimica Acta.
Smith, B. R. and Sweett, F. (1971). The crystallization of calcium sulfate dihydrate. Journal of Colloid and Interface Science 37: 612-618.
Van Rosmalen, G. M., Daudey, P. J., and Marchee, W. G. J. (1981). An analysis of growth experiments of gypsum crystals in suspension. Journal of Crystal Growth 52: 801-811.
�
Wells, S. (2009) “Hydrodynamic Compressible and Incompressible Modeling of the Density Structure and Hydrodynamics of Hypersaline Systems,” Proceedings IAHR 33rd Congress, Vancouver, BC, August 9-14, pp. 4345-4352.]
Witkamp, G. J., Van der Eerden, J. P., and Van Rosmalen, G. M. (1990). Growth of gypsum: I. Kinetics. Journal of Crystal Growth 102: 281-289.
Zhang, J. and Nancollas, G. H. (1992). Influence of calcium/sulfate molar ratio on the growth rate of calcium sulfate dihydrate at constant supersaturation. Journal of Crystal Growth 118: 287-294.

Best Available Data Report
RS-DS Water Conveyance Study Program
Z:\IL\201280\R10.054A\BAD_report_revised.doc November 24, 2010 82
5.2. Hydrogeology and Sinkholes – Existing Information
5.2.1. Hydrogeology Information
5.2.1.1. Surface Water Hydrology
Abdulla, F. and Al-Assa'd, T. (2005). Modeling of groundwater flow for Mujib Aquifer, Jordan, J. of Earth System Science, 115(3):289-297. Alkhaddar, R.M., Sheehy, W.J.S., and Al-Ansari, N. (2005). Jordan water resources, supply and future demand. Water International, 30(3): 294-303. Al-Kharabsheh, A. and Ta’any, R. (2005). Challenges of water demand management in Jordan, Water International, 30(2): 210-219. Al-Mubarak Al-Wesha, R. (1992). Jordan’s water resources – technical perspective. Water International, 17(3): 124-132. Ayadi, Y. H. (2006). Policy and Adaptation in the Jordan Valley, Jordan Valley Authority: Calvo, R. and Ben Zvi, A. (2005). Regional Analysis of the Lower Jordan River Watershed and an Estimate of its Surface Runoff Inflows to the Dead Sea. Geological Survey of Israel. Chen, C., Sawarieh, A., Kalbacher, T., Beinhorn, Wang, W., and Koldiz, O. (2005). A GIS based 3-D hydrosystem model of the Zarqa Ma'in – Jiza Areas in central Jordan, J. of Environmental Hydrology, 13, Paper 4: Courcier, R., Venot, J.P., and Molle, F. (2005). Historical Transformations of the Lower Jordan River Basin (in Jordan), Changes in Water Use and Projections (1950-2025), International Water Management Institute. Friends of the Earth Middle East, Towards a Living Jordan River (2010). An Environmental Flows Report on the Rehabilitation of the Lower Jordan River. Goldstoff, Y., Simon, E., and Karni, M. (1988). Determination of the Available Yarmouk River Streamflows Diversions to Lake Kinneret, TAHAL. GTZ (1996). Middle East Regional Study on Water Supply and Demand Development, Regional Overview, Phase I. GTZ and Ministry of Water and Irrigation (2004). National Water Master Plan for the Hashemite Kingdom of Jordan.

Best Available Data Report
RS-DS Water Conveyance Study Program
Z:\IL\201280\R10.054A\BAD_report_revised.doc November 24, 2010 83
Holtzman, R., Shavit, U., Segal-Rozenhaimer, M., Gavrieli, I., Marei, A., Farber, E., and Vengush, A. (2005). Quantifying ground water inputs along the lower Jordan River, J. Environ. Qual. 34:897-906. Jazim, A.A. (2005). A monthly six-parameter water balance model and its application at arid and semiarid low yielding catchments, Journal King Saud University, Vol. 19, Eng. Sci. (1), pp 65-82. Jordan Valley Authority (2002). Wala Dam. Margane, A., Borgstedt, A., Suban, A., Hajali, Z., Almomani, T., and Hamdan, I. (2008). Delineation of surface water protection zones for the Mujib Dam. Technical Report No. 10: Groundwater Research Management Project, Federal Ministry for Economic Cooperation and Development (BMZ No. 2005.2110.4). Murakami, M. (1995). Managing Water for Peace in the Middle East: Alternative Strategists. The United Nations University. Palestinian Water Authority (PWA) (2010) Abdel-ghafour, D. Al-Fashkha Springs Project as Palestinian Strategic Water Project. Sawarieh, A., Chen, C., Beinhorn, M., Koldiz, O., Salameh, E., and Hoetzl, H. (2009). A GIS Model for Groundwater Flow and Heat Transport in Zarqa Ma'in – Jiza Areas – Central Jordan, The Water of the Jordan Valley, Springer, pp: 371-384: Simon, E. and Mero, F. (1987). Design Streamflows Series of the Lake Kinneret and Jordan River Basins, TAHAL. Simon, E, Oziransky, U., and Mero, F. (1995) Estimate of the Jordan River Streamflows near Gilgal Reservoir Site, TAHAL. Simon, E. and Shahar, H. (1995). The Neot Tamar Dam (Wadi Arava) – Surface Water Survey, TAHAL. The HARZA JRV Group (1997). Jordan Rift Valley Integrated Development Study, Sector Profile, Water Resources. The Hashemite Kingdom of Jordan, Jordan Valley Authority (2004). General Information, The Third Country Training Program for Watershed Resources Management. TAHAL (1983). Mediterranean – Dead Sea Hydroelectric Project, Technical Report No. 3: Hydrological and Limnological Investigations of the Dead Sea.

Best Available Data Report
RS-DS Water Conveyance Study Program
Z:\IL\201280\R10.054A\BAD_report_revised.doc November 24, 2010 84
5.2.1.2. Summary of the Various Dead Sea Inputs
Arad, A. (1964). The geology and hydrogeology of the lower cretaceous of the northern Negev and Judea Mts. Geological Survey of Israel Report HYDRO/3/64. Arad, A. and Michaeli, A. (1967). Hydrogeological investigations in the western catchment of the Dead Sea. Isr. J. Earth Science 16:181-196. Eckstein, Y. (1979). Heat flow and hydrologic cycle: examples from Israel, pp. 88-97. In: Cermak, V. and Rybach, L. (eds.). Terrestrial Heat Flow in Central Europe. Springer-Verlag, Heidelberg. Gavrieli, I., Yechieli, Y., Halicz, L., Spiro, B., Bein, A., and Efron, D. (2001). The sulfur system in anoxic subsurface brines and its implication in brine evolutionary pathways; the Ca-chloride brines in the Dead Sea area, Earth and Planetary Science Letters. 186: 199-213. Hobler, M., Bender, H., Rashdan, J., and Schmidt, G. (1991). Groundwater Resources of Southern Jordan, Bundesanstalt fur Geowissenschaften Und Rohstoffe (BGR) report. JICA (Japan International Cooperation Agency) (2001) The study on water resources management in the Hashemite Kingdom of Jordan. Final report, JICA, Tokyo. Kiro, Y., Yechieli, Y., Shalev, E., Lyakhovsky, V., and Starinsky, A. (2008). Time response of the water table and saltwater transition zone to a base level drop. Water Resources Research, doi:10.1029/2007WR006752. Klein, C. (1961). On the fluctuations of the level of the Dead Sea since the beginning of the 19th century. Hydrological paper no. 7, Ministry of Agriculture, Hydrological Service of Israel. Krumgalz, B.S., Hecht, A., Starinsky, A., and Katz, A. (2000). Thermodynamic constraints on Dead Sea evaporation: Can the Dead Sea dry up? Chem. Geol. 165: 1-11. Lensky, N., Dvorkin, Y., Lyakhovsky, V., Gertman, I., and Gavrieli, I. (2005). Water, salt, and energy balance of the Dead Sea. Water Res. Res. 41, doi:10.1029/2005WR004084. Lensky, N., Gertman, I., Rosentraub, Z., Lensky, I., Gavrieli, I., and Nehorai, R. (2010a) Alternative dumping sites in the Dead Sea for harvested salt from pond 5: Currents in the Dead Sea during summer 2009. GSI report GSI-01-2010.
Best Available Data Report
RS-DS Water Conveyance Study Program
Z:\IL\201280\R10.054A\BAD_report_revised.doc November 24, 2010 85
Lensky, N., Gertman, I., Rosentraub, Z., Lensky, I., Gavrieli, I., Calvo, R., and Katz, O (2010b) Alternative dumping sites in the Dead Sea for harvested salt from pond 5: Final report. GSI report GSI-05-2010. Mazor, E., Rosenthal, E., and Eckstein, Y. (1969). Geochemical tracing of mineral water sources in the southwestern Dead Sea Basin, Israel, Journal of Hydrology, 7: 246-75. Mazor, E., Levitte, D., Truesdell, A.H., Healy, J., and Nissenbaum, A. (1980). Mixing models and ionic geothermometers applied to warm (up to 600C) springs: Jordan rift valley, Israel, Journal of Hydrology, 45: 1-19. Miller, R.L. and Mckee, B.A. (2004). Using MODIS Terra 250m imagery to map concentrations of total suspended matter in coastal waters. Remote Sensing of Environment. 93:259-266. Oz, I., Shalev, E., Yechieli, Y., Gvirtzman, H., and Gavrieli, I. (in preparation). Steady state configuration of Groundwater system adjacent to a long term Meromictic Lake. Salameh, E. and El-Naser, H. (1999). Does the actual drop in Dead Sea level reflect the development of water sources within its drainage basin?, Acta Hydrochim. Hydrobiol., 27: 5-11 Salameh, E. and El-Naser, H. (2000a). Changes in the Dead Sea level and their impacts on the surrounding groundwater bodies. Acta Hydrochim. Hydrobiol., 28: 24-33. Salameh, E. and El-Naser, H. (2000b). The interface configuration of the fresh-/Dead Sea water – Theory and measurements, Acta Hydrochim. Hydrobiol., 28: 323-328. Shalev, E. and Yechieli, Y. (2008) The effect of the Dead Sea level fluctuations on the discharge of the thermal springs, Israel Journal of Earth Sciences, 56: 19-27. Shalev, E., Lyakhovsky, V., and Yechieli, Y. (2007). Is advective heat transport significant at the Dead Sea Basin? Geofluids, 7: 292-300. Schmidt, G., Hobler, M., and Söfner, B. (2002). Investigations on Regional Groundwater Systems in North-East Africa and West-Asia. Proc. Int. Conf. on Aquifer Systems in Arid Zones: Managing Non-Renewable Resources - Tripoli, Libya, Nov. 1999, UNESCO 2002, pp 195-203. Starinsky, A. (1974). Relationship between Ca-chloride brines and sedimentary rocks in Israel [Ph.D. thesis]: (in Hebrew, English summary), Hebrew University, Jerusalem pp. 104.

Best Available Data Report
RS-DS Water Conveyance Study Program
Z:\IL\201280\R10.054A\BAD_report_revised.doc November 24, 2010 86
Starinsky, A. (2005). The Dead Sea basin: The biggest spring discharge in the world, Melach Ha-Aretz, 1, 35-52, (in Hebrew). Wollman, S., Yechieli, Y., Lyakhovsky, V., and Bein, A. (2003). Summary of results for the test pumping in Nahal Arugot, Dead Sea sinkholes project: Stage B. (in Hebrew). Isr. Geol. Surv., Rep. GSI/42/2003, 10 p. Yechieli, Y. (2000). Fresh-saline water interface in the western Dead Sea area. Groundwater 38: 615-623. Yechieli, Y., Ronen, D., Berkovitz, B., Dershovitz, W.S., and Hadad, A. (1995). Aquifer characteristics derived from the interaction between water levels of a terminal lake (Dead Sea) and an adjacent aquifer. Water Resources Research 31(4): 893-902. Yechieli, Y., Ronen, D., and Kaufman, A. (1996). The source and age of groundwater brines in the Dead Sea area, as deduced from 36Cl and 14C, Geochimica et Cosmochimica Acta, 60: 1909-1916. Yechieli, Y., Kafri, U., Wollman, S., Shalev E., and Lyakhovsky, V. (2009). The effect of base level changes and geological structures on the location of the groundwater divide, as exhibited in the hydrological system between the Dead Sea and the Mediterranean Sea. Journal of Hydrology 378: 218-229.
5.2.2. Sinkholes Information
Abelson, M. and Gabay R. (2009). Development of the Dead Sea sinkholes between August 2006 and December 2008 – Detection from aerial photographs, Geological Survey of Israel, Report no. TR-GSI/13/2009 (in Hebrew). Abelson, M., Steinberg J., Kurzon I., and Crouvi O. (2003a). Development of the Dead Sea sinkholes – Detection from aerial photographs between July 2001-November 2002, Geological Survey of Israel, Report GSI/44/2003 (in Hebrew). Abelson, M., Baer, G., Shtivelman, V., Wachs, D., Raz, E., Crouvi, O., Kruzon, I., and Yechieli, Y. (2003b). Collapse-sinkholes and radar interferometry reveal neotectonics concealed within the Dead Sea basin: Geophys. Res. Lett., v. 30, p. 52, doi:10.1029/2003GL017103.
Abelson, M., Yechieli, Y., Crouvi, O., Baer, G., Wachs, D., Bein, A., and Shtivelman, V. (2006). Evolution of the Dead Sea sinkholes, in “New Frontiers in Dead Sea Paleoenvironmental Research”, eds. Y. Enzel, A. Agnon, M. Stein, Geological Society of America, Special Paper, 401: 241-253.

Best Available Data Report
RS-DS Water Conveyance Study Program
Z:\IL\201280\R10.054A\BAD_report_revised.doc November 24, 2010 87
Abelson, M., Geller A., and Alfasi S. (2007). Development of the Dead Sea sinkholes – Detection from aerial photographs between January 2005 and August 2006, Geological Survey of Israel, Technical Report TR-GSI/07/2007 (in Hebrew). Abelson, M. and Gabay, R. (2009) Development of the Dead Sea sinkholes between August 2006 and December 2008 – Detection from aerial photographs, Geological Survey of Israel, Report no. TR-GSI/13/2009 (in Hebrew). Arkin, Y. (1993). “Karstic” sinkholes in alluvial fans: Israel Geological Society, Annual Meeting, Field trip guidebook, p. 71-80. Arkin, Y. and Gilat, A. (2000). Dead Sea sinkholes – an ever-developing hazard: Environ. Geology, 39 (7): 711-722.
Galloway, D., Jones, D.R., and Ingberitsen, S.E. (1999). Land subsidence in the United States: U.S. Geological Survey Circular, 1182, 177p. Martinez, J.D., Johnson, K.S., and Neal, J.T. (1998). Sinkholes in evaporite rocks: American Scientist, 86: 38-51. Neal, J. T. and Johnson, K. S. (2002). McCauley Sinks: A compound breccia pipe in evaporite karst, Holbrook Basin, Arizona, USA: Carbonates and Evaporites, 17; 98-106. Oz, I., Shalev, E., Yechieli, Y., Gvirtzman, H., and Gavrieli, I. (in preparation). Steady state configuration of groundwater system adjacent to a long term Meromictic Lake. Raz, E. (2000). Formation of sinkholes in the Dead Sea area – a surface survey, Geological Survey of Israel, Report GSI/31/2000 (in Hebrew). Sagy, A., Reches, Z., and Agnon, A. (2003). Multiscale 3D architecture and mechanics of the margins of the Dead Sea pull-apart: Tectonics, 22:1004, doi:10.1029/2001TC001323.
Taqieddin S.A., Abderahman, N.S., and Atallah, M. (2000), Sinkhole hazards along the eastern Dead Sea shoreline area, Jordan: a geological and geotechnical consideration: Environmental Geology, 39: 1237-1253. Wachs, D., Yechieli, Y., Shtivelman, V., Itamar, A., Bear, G., Goldman, M., Raz, E., Rybakov, M., and Schattner, U. (2000). Formation of sinkholes along the shore of the Dead Sea – summary of finding from the first stage of research: Geological Survey of Israel, Report GSI/41/2000 (in Hebrew), 49p.

Best Available Data Report
RS-DS Water Conveyance Study Program
Z:\IL\201280\R10.054A\BAD_report_revised.doc November 24, 2010 88
Yechieli, Y., Magaritz, M., Levy, Y., Weber, U., Kafri, U., Woelfli, W., and Bonani, G. (1993). Late Quaternary geological history of the Dead Sea area, Israel. Quaternary Res. 39: 59-67. Yechieli, Y., Kafri, U., Goldman, M., and Voss, C.I. (2001). Factors controlling the configuration of the fresh-saline water interface in the Dead Sea coastal aquifers: synthesis of TDEM surveys and numerical groundwater modeling: Hydrogeology Journal, 9: 367-377. Yechieli, Y., Abelson, M., Bein, A., Shtivelman, V., Crouvi, O., Wachs, D., Baer, G., Calvo, R., and Lykhovsky, V. (2004). Sinkholes along the Dead Sea shore: findings, mechanism, and prediction of trends – Summary report: Geological Survey of Israel, Report no. GSI/21/2004 (in Hebrew, English abstract), 57p. Yechieli, Y., Abelson, M., Bein, A., Crouvi, O., and Shtivelman, V. (2006). Sinkhole "swarms" along the Dead Sea coast: Reflection of disturbance of lake and adjacent groundwater systems, Geological Society of America Bulletin, 118: 1075-1087.
5.3. Additional References
Abelson, M. Kurzon I., Crouvi O., Wachs D., and Yechieli Y. (2002). Development of the Dead Sea sinkholes – Detection from aerial photographs up to 2001: Geological Survey of Israel, Report GSI/30/2002 (in Hebrew with English abstract), pp. 30. Abelson, M., Steinberg J., and Alfasi S. (2005). Development of the Dead Sea sinkholes – Detection from aerial photographs between November 2002 and September 2003, Geological Survey of Israel, Technical Report TR-GSI/07/2005 (in Hebrew). Alpert, P., Shafir, H., and Issahary, D. (1997). Recent changes in the climate at the dead sea - a preliminary study. Climatic Change 37:513-537. Anati, D.A. and Shasha, S. (1989). Dead Sea surface-level changes. Israel J. Earth Sci. 38: 29-32. Anderson, E.R. (1952). Energy budget studies. pp 71-119 In: Water Loss Investigations: Lake Hafner Studies. USGS Prof. Paper. Assouline, S. (1993). Estimation of lake hydrologic budget terms using the simultaneous solution of water, heat and salt balances and a Kalman filtering approach - Application to Lake Kinneret. Water Resource Res. 29:3041-3048. Barenbrug, A.W.T. (1974). Psychrometry and Psychrometric Charts. 3rd edition Cape and Transvaal Printers Ltd., Cape Town, S.A.

Best Available Data Report
RS-DS Water Conveyance Study Program
Z:\IL\201280\R10.054A\BAD_report_revised.doc November 24, 2010 89
Berliand, M. E. and Berliand T.G (1952). Measurement of the effective radiation on the earth with varying cloud amounts (in Russian). Izv. Akad. Nauk. SSSR, Ser. Geofiz. 1. Bignami, F., Marullo, S. Santoletri, R., and Schiano M. E. (1995). Longwave radiation budget in the Mediterranean Sea. J. Geophys.Res. 100:2501-2514. Bowen, I. S. (1926). The ratio of heat losses by conduction and by evaporation from any water surface. Physical Rev. 27:779-787. Brunt, D. (1932). Notes on radiation in the atmosphere. Q. J. R. Meteorol. Soc. 58:389-420. Bunker, A. F. (1976). Computation on surface energy flux and annual air-sea cycle in the North Atlantic Ocean. Mon. Weather Rev. 104:1122-1140. Businger, J. A. (1973). Turbulent Transfer in the Atmospheric Surface Layer. pp. 67-100. In: Haugen, D. A. (ed). Workshop on Micrometeorology. American Meteorological Society. Clark, N. E., Eber, L., Laurus, R. M., Renner, J.A., and Saur J. F. T. (1974). Heat Exchange Between Ocean and Atmosphere in the Eastern North Pacific for 1961-71. NOAA Tech. Rep. NMFS SSRF-682, Washington D.C. Dalin, Y. (1988). Valuation of Expected Floods into the Dead Sea (in Hebrew). N.C.R.D. 10-82:5-24. Efimova, N.A. (1961). On methods of calculating monthly values of net longwave radiation (in Russian). Meteorol. Gigrol. 10:28-33. EPA report. (1984). Proceedings of Stormwater and Water Quality Model Users Group Meeting April 12-13, 1984, EPA-600/9-85-003. Elazari-Volcani, B. (1940a). Studies on the microflora of the Dead Sea. Ph.D. thesis, The Hebrew University of Jerusalem (in Hebrew). Elazari-Volcani, B. (1940b). Algae in the bed of the Dead Sea. Nature 145: 975. Elazari-Volcani, B. (1943). A dimastigamoeba in the bed of the Dead Sea. Nature 152: 301-302. Elazari-Volcani, B. (1944). A ciliate from the Dead Sea. Nature 154: 335-336. Hecht, A. and Gertman, I. (2003). Dead Sea Meteorological Climate. Chapter 4. In: Nevo, E, Oren, A. and Wasser, S. P (eds). Fungal Life in the Dead Sea. A.R.G. Ganter Verlag K.G., 325 p

Best Available Data Report
RS-DS Water Conveyance Study Program
Z:\IL\201280\R10.054A\BAD_report_revised.doc November 24, 2010 90
Itamar, A. and Reizmann Y. (2000). Air photo survey of sinkholes in the Dead Sea, area: Geological Survey of Israel, Current Research, 12: 21-24. JICA (Japan International Cooperation Agency) (1995). The Study on Brackish Groundwater Desalination in Jordan. Kafri U., Goldman M., and Lang B. (1997). Detection of subsurface brine, fresh water bodies and the interface configuration in between by the TDEM method in the Dead Sea Rift, Israel. Environmental Geology, 31: 42-49. Konda, M., Imasato, N., Nishi, K., and Toda T. (1994). Measurements of the sea surface emissivity. J. Oceanogr. 50:17-30. Levy, Y. (1987). The Dead Sea - Hydrographic, geochemical and sedimentological changes during the last 25 years (1959-1984). Geological Survey of Israel, Jerusalem, p 60. Levy, Y. (1992). Modern sedimentation in the Dead Sea, 1982-1989. TR-GSI/7/92, Isr. Geol. Surv., Tech. Prog. Rep. Liu, S.-T. and Nancollas, G. H. (1970). The kinetics of crystal growth of calcium sulfate dihydrate. Journal of Crystal Growth 6: 281-289. Marvin-DiPasquale, M., Oren, A., Cohen, Y., and Oremland, R.S. (1999). Radiotracer studies of bacterial methanogenesis in sediments from the Dead Sea and Solar Lake (Sinai), pp. 149-160 In: Oren, A. (ed.). Microbiology and Biogeochemistry of Hypersaline Environments. CRC Press, Boca Raton, Florida. McNaughton, K. G. and Laubach J. (1998). Unsteadiness as a cause of non-equality of eddy diffusivities for heat and vapor. at the base of an advective inversion. Boundary-Layer Meteorology 88:479-504. Morton, F. I. (1983). Operational estimates of lake evaporation. J. Hydrol. 66:77-100. Nissenbaum, A. (1975). The microbiology and biogeochemistry of the Dead Sea. Microb. Ecol. 2: 139-161.
Oren, A. (1998). The rise and decline of a bloom of halophilic algae and Archaea in the Dead Sea: 1992-1995, pp. 129-138. In: Oren, A. (ed.), Microbiology and Biogeochemistry of Hypersaline Environments. CRC Press, Boca Raton.
Oren, A. and Anati, D.A. (1996). Termination of the Dead Sea 1991-1995 stratification: biological and physical evidence. Israel J. Earth Sci. 45: 81-88.

Best Available Data Report
RS-DS Water Conveyance Study Program
Z:\IL\201280\R10.054A\BAD_report_revised.doc November 24, 2010 91
Oren, A. and Ben-Yosef, N. (1997). Development and spatial distribution of an algal bloom in the Dead Sea: a remote sensing study. Aquat. Microb. Ecol. 13: 219-223.
Oren, A. and Shilo, M. (1981). Bacteriorhodopsin in a bloom of halobacteria in the Dead Sea. Arch. Microbiol. 130: 185-187.
Payne, R. E. (1972). Albedo of the sea surface. J. Atmos. Sci. 29:959-970. Rubin, H. and Atkinson J. (2001). Environmental Fluid Mechanics.728 Marcel Dekker, Inc., New York. Ryan, P. J. and Harleman D. R. F. (1973). An analytical experimental study of transient cooling pond behavior. 161, R. M. Parsons Laboratory, Dept. of Civil Engineering, Massachusetts Institute of Technology, Cambridge, MA. Salameh, E. and Udluft, P. (1985). A hydrodynamic pattern of the central part of Jordan. Geologisches Jahrbuch. Reihe C: Hydrogeologie, Ingenieurgeologie 38:39-53.
Shalev, E., Lyakhovsky, V., and Yechieli, Y. (2006). Salt Dissolution and Sinkhole Formation along the Dead Sea Shore, J. Geophys. Res., 111, doi: 10.1029/2005JB004038. Shtivelman, V., Goldman, M., Ronen, A., and Ezersky, M. (1999). Shallow geophysical surveys in the sinkhole development area at the Nahal Hever site: Geophysical Institute of Israel, Report No. 823/87/98.
Stanhill, G. and Cohen S. (2001). Global dimming: A review of the evidence for a widespread and significant reduction in global radiation with discussion of its probable causes and possible agricultural consequences. Agric. For. Met. 107.
Steinhorn, I. (1981). A hydrographical and physical study of the Dead Sea during destruction of its long-term meromictic stratification. Ph.D. Weizmann Institute of Science, Rehovot, Israel.
Stiller, M., Gat, J. R., and Kaushansky, P. (1997). Halite Precipitation and Sediment Deposition as Measured in Sediment Traps Deployed in the Dead Sea: 1981-1983. In: Niemi, T., Ben-Avraham, Z. and Gat, J.R. (eds). The Dead Sea - the Lake and its Setting. Oxford University Press, Oxford. Swinbank, W. C. (1963). Longwave radiation from clear sky. Q. J. R. Meteorol. Soc. 89:339-348.

Best Available Data Report
RS-DS Water Conveyance Study Program
Z:\IL\201280\R10.054A\BAD_report_revised.doc November 24, 2010 92
Volcani, B.E., (1944). The microorganisms of the Dead Sea. pp. 71-85 In: Papers collected to commemorate the 70th anniversary of Dr. Chaim Weizmann. Collective volume. Daniel Sieff Research Institute, Rehovoth.
Wilber, A. C., Kratz, D. P., and Gupta, S. K. (1999). Surface Emissivity Maps for Use in Satelite Retrievals of Longwave Radiation. NASA/TP-1999-209362, NASA, Hampton, Virginia.
Wilkansky, B. (1936). Life in the Dead Sea. Nature 138: 467. Yechieli, Y., Gavrieli, I., Berkowitz, B., and Ronen D. (1998). Will the Dead Sea die? Geology 26: 755-758.

Appendix – Rejoinder to the Client

Appendix Rejoinder to the Client
Z:\IL\201280\R10.054A\BAD combined rejoinder.docx November 24, 2010 App--1
1. Introduction The following sections deal with the Consultant’s responses (A) to General and Specific Comments (C) raised subsequent to the Panel of Experts [PoE] and the Study Management Unit's [SMU] examination of the Best Available Data Report. The Consultant has taken each comment, and has either incorporated the suggestions into the revised Best Available Data Report or has provided a response relating to the action, item or activity. For ease of differentiation, please note that the Clients’ questions are italicized, whereas the replies from the Consultant are in standard font.
2. Issues Raised by the PoE C1. The BAD Report for the Dead Sea is very well drafted and takes into account all available information applying ‘state of art’ methodology. It is useful in the sense that it describes clearly the impacts of various options at this stage. A1) Every effort was made to include pertinent and up to date information in the report. C2. The section related to climate change impact is less developed and needs additional work. The model used needs further calibration and validation with all existing data. The work on the currents and the geophysical part of the work needs to be completed. Additional calculations should be made and scenarios should be elaborated (i) for immediate or gradual phasing-out of the chemical industry and (ii) for conditions (e.g., concentrations, stock evaluation) to keep the monomictic regime by adding dry salts in the incoming flow. A2) Our work plan is to complete the calibration of the models with the best available data. Once this is done, we will discuss with representatives from the World Bank several relative scenarios to be run. In our proposal, we have not included specific issues of climate change nor did we suggest under what climatic conditions to run the various scenarios (such as average year, arbitrary years). If requested, we could consider the impact of climate change by changing incoming solar radiation, humidity, inflows, etc. However, these parameters will need to be provided by the Client. We wish to emphasize that it is most likely that the "unknowns" that will remain regarding the impact of the proposed RSDSC on the Dead Sea will exceed any unknown in the evolution of the lake due to climate change. C3. Overall, the Feasibility Study tries to answer the question ‘Can we?’ while the Additional Studies provide more insight about ‘Should we?’. The BAD Report should be informed from comments made by PoE on the Inception

Appendix - Rejoinder to the Client
Z:\IL\201280\R10.054A\BAD combined rejoinder.docx November 24, 2010 App-2
Report for the Dead Sea and during the presentation of the BAD at the 5th Steering Committee Meeting (27 July 2010, Jerusalem). A3) Correct, overall the Dead Sea Study is a scientific support for the question of "should we?" Every effort was made to include pertinent and up to date information in each of the reports thus far submitted. C4. (Point 2.1) The assessment according to which the Dead Sea ‘would have shrunk to the Northern basin even without the present anthropogenic intervention’ is very important and should be used as ‘reference condition’ if not as ‘background level’. A4) The assessment is important as a qualitative background. As stated, the level of the Dead Sea during the second half of the the 19th century reflects an exceptionally rainy period and cannot be used as a reference level. Calculation of the exact level of the Dead Sea at this time in a hypothetical scenario of natural inflows over the past decades is outside the scope of tasks requested by the World Bank and will not provide insights into the future of the Dead Sea, since the water balance has completely changed. Our approach is to gather the best available data of the current state of the Dead Sea, use numerical models to simulate the current state, calibrate the models using measured data and then simulate different future scenarios (i.e., World Bank tasks). C5. (Point 2.2) The reference according to which the single most important water source for the Dead Sea was the flow through the Jordan River, which was reduced from 1500 MCM/year to less than 150 MCM/year (according to FoEME to around 30 MCM/year) and its quality also deteriorated from fresh water to agricultural/irrigation return flow and saline ground water, is of key importance. In the same section it is clearly stated that the chemical industry artificially increases evaporation and is responsible for approximately 30-40 cm/year of water level decline. Under the aforementioned conditions, one could have envisaged to study in detail a ‘zero case’ scenario based on the discontinuation of the chemical industries’ operation, according to alternative phasing-out options. A5) This is one of the scenarios that we will be considering. A discussion has been initiated in the Mid Term Report. C6. (Point 2.3) It is noted that the undiluted Dead Sea water content in salts is 343 g/l, which is almost ten times more than the open ocean (~ 35 g/l). This needs to be stressed out more. Similarly, the fact that the pH of the Dead Sea is rather acidic (5.9) while the marine Red Sea water is alkaline (7.8 – 8.1) should be also highlighted. Mixing of the two waters is expected to facilitate precipitation of various chemical species in the Dead Sea.

Appendix - Rejoinder to the Client
Z:\IL\201280\R10.054A\BAD combined rejoinder.docx November 24, 2010 App-3
A6) The overall chemical composition of the Dead Sea has been stated in the current report in Section 2.3 and in Table 1, and has been discussed throughout the text. The mixture of the Dead and Red Seas has not been covered in this report, because the current report focuses on the current state of the Dead Sea and not on future scenarios. This will be discussed in the forthcoming reports. C7. There is some ambiguity on the phosphorus chemistry levels (as described in page 6) and the statement about ‘major contribution of sediments to phosphorus input’, which need clarification. A7) The phosphate concentration in the Dead Sea was recently corroborated by our group to be on the order of 1 µM. However no data is available regarding phosphate input to the Dead Sea or its residence time in the water body. The duration of our study does not allow any study and sampling campaigns regarding these important questions. C8. It is important to understand that the decline of the Na/Cl ratio, which is due to the removal of halite to the sea bottom, has started only recently i.e. in the mid 70’s (see Figure 4). This was a turning point towards the rapid artificial change of the content and ‘synthesis’ of the Dead Sea an effect parallel, and probably equaly significant, to the decline of its surface level. A8) The Dead Sea has experienced salt precipitation in the past as is evident from salt layers that were found accumulated on its bottom prior to the onset of the recent halite precipitation. Such precipitation, which reflects climate changes must have also been accompanied by a decrease in Na/Cl ratio. The ratio might have then increased if some of this salt re-dissolved into the water column following a water level rise and dilution. The present halite precipitation is however due not mainly to climate change but to anthropogenic interventions in the water balance of the lake. C9. (Point 2.4) a) The reduction of the gypsum accumulation rates does not sound logical to be attributed to ‘decreasing solubility’ of gypsum in the brine. b) Furthermore in the same part, it is stated that the increasing Ca²+ S04²- ratio and salinity decrease the solubility of gypsum which the authors suggest as responsible for the slowdown of gypsum nucleation and crystal formation /growth. Since this is based on experimental observations, it is not to be questioned. c) However, it requires some further justification and proof (it is mentioned that it is theoretically expected). d) In general, the change of gypsum nucleation and crystal growth may be attributed to the increase in the ionic strength of the medium rather than on the solubility decrease of gypsum. A9) a) Mineral solubility may be defined as the molal concentration of a mineral that is dissolved in a solution at saturation. For�stoichiometric solutions, the solubility

Appendix - Rejoinder to the Client
Z:\IL\201280\R10.054A\BAD combined rejoinder.docx November 24, 2010 App-4
is equal to the molal concentration of any of the lattice ions, divided by its coefficient in the mineral formula. For non-stoichiometric solutions, the solubility is equal to the lowest amongst these quotients. Accordingly, maximal solubility (at a given ionic strength and composition) is attained when the ratio between the dissolved lattice ions equals that of the mineral. It follows that in the SO4
2--depleted DS-RS mixtures, gypsum solubility is defined as the concentration of SO4
2- at which the brine is saturated with respect to gypsum. It has been suggested that higher solubility allows more impinging growth units which results in faster precipitation kinetics (Brandse et al., 1977; Witkamp et al., 1990; Zhang and Nancollas, 1992; Bosbach et al., 1996; Sheikholeslami and Ong, 2003). b) Increasing Ca2+/SO4
2- ratio and salinity in DS brine and DS-RS mixtures decreases the equilibrium concentration of SO4
2-, and therefore reduces the solubility. Decreasing solubility has been shown to decrease the nucleation and crystal growth kinetics of gypsum, both when the solubility is altered by changing the ionic strength of the solution (He et al., 1994a; He et al., 1994b) and by changing the Ca2+/SO4
2- ratio (Zhang and Nancollas, 1992; Alimi and Gadri, 2004). c) According to the classic nucleation theory, the nucleation kinetics depends upon the solubility of the mineral. In solutions of sparingly soluble substances, the solute particles are relatively distant one from another, and for a high nucleation probability occurring, it is necessary to obtain high supersaturation values (Prieto, 1994). d) Indeed, the ionic strength may change other parameters except solubility. It may lead to changes in the concentrations of the lattice ions, activity coefficients of free ions, lattice cation/anion ratio, aqueous complexes concentrations, saturation state and concentrations of catalysts or inhibitors. C10. (Point 2.5.1) What is explained about the 1979 complete overturn is important since, if the lower anaerobic water was also sulfide-rich, a new stratification may again lead to anoxia and build-up of sulfides and H2S. A10) Reply to comments 10, 15 and 30: Indeed the hypoliminion of the Dead Sea prior to 1979 was anaerobic and contained sulfide. Moreover, isotopic analysis of the sulfate and the sulfide present at the time suggested bacterial dissimilatory sulfate reduction as the source of the sulfide. If indeed anaerobic conditions will be re-established after formation of a new pycnocline and long-term meromictic conditions, theoretically the possibility exists that sulfide will once more be formed. This will not have a direct impact on the environmental conditions in the Dead Sea area. Most freshwater lakes, including Lake Kinneret in Israel, are seasonally stratified and contain sulfide in the lower water layers, produced in the bottom sediments by microbial activity.

Appendix - Rejoinder to the Client
Z:\IL\201280\R10.054A\BAD combined rejoinder.docx November 24, 2010 App-5
Presence of this sulfide will not be evident e.g., by bad smells in the Dead Sea area (beyond the sulfide smell also present locally now because of the presence of exposed sulfur springs in the area); sulfide diffusing upwards will be oxidized (abiotically in the case of the Dead Sea, mainly biotically in non-hypersaline lakes), and will not reach the atmosphere. The only possible environmental and economical impact of sulfide that may accumulate in the deep waters of the Dead Sea will be when deep waters will be pumped up by the potash industries to fill the evaporation ponds at the southern end of the Dead Sea. Sulfide may increase the corrosivity of the (already highly corrosive) brines. To what extent sulfide smells will be noticeable in the area due to this pumping activity cannot easily be predicted. The low pH of Dead Sea water, well below the pK of the H2S/HS- couple, will lead to rapid evaporation to the atmosphere of any sulfide that may be present in the water. The chance that indeed large concentrations of sulfide will accumulate in the deep waters of the Dead Sea is very small, for the following reasons. The salinity of the bottom waters of the Dead Sea is not expected to decrease following the operation of the Red Sea – Dead Sea water conduit. The current salinity (and the biologically unfavorable excess of divalent cations) is too high for even the best salt-adapted sulfate reducing bacteria. Although very slow sulfide formation could be demonstrated in the laboratory in diluted brines + sediments sampled from the lake, this only occurred under highly enriched conditions with suitable electron donors such as lactate, acetate, and possibly hydrogen. Such electron donors are generated in non-hypersaline anaerobic environments by action of fermentative bacteria, but also no great activity of such bacteria can be expected to occur in the deep layers of the Dead Sea, which are too salty also for the best salt-adapted fermentative bacteria and are covered by a solid salt crust. Fermentative bacteria isolated in the past from the Dead Sea sediments (Halobacteroides halobius, Sporohalobacter lortetii, Orenia marismortui) do not function at significant rates in undiluted Dead Sea water media, not even in the presence of excess fermentable substrate. Even when microbial blooms will occur in the upper water layers and dead or live biomass will reach the lower layers, it will take many years before anaerobic conditions will be achieved that theoretically can promote activity of fermentative bacteria and sulfate reducers. This was shown by monitoring of the oxygen concentration in the lower layers following the 1992 microbial bloom in the lake (Oren et al., 1995). C11. (Point 2.5.2) The role of the increasing salinity is clearly shown as determining the density in Figure 7 while temperatures remain rather constant since mid 1990’s. Perhaps this is a useful observation for the assessment of climate change impacts on the sea. A11) In our proposal, we have not included specific issues of climate change nor did we suggest under what climatic conditions to run the various scenarios (such as average year, arbitrary years). If requested, we could consider the impact of

Appendix - Rejoinder to the Client
Z:\IL\201280\R10.054A\BAD combined rejoinder.docx November 24, 2010 App-6
climate change by changing incoming solar radiation, humidity, inflows, etc. However, these parameters will need to be provided by the Client. C12. (Point 2.5.3) Currents need to be studied better and existing data to be further used. A12) Indeed, little data if any is available on currents in the Dead Sea. Without such data it would be impossible to fully 3D model the Dead Sea and the spreading of the inflows into the lake. We have emphasized the importance of collecting such data, have recently ventured into this field, and are developing the methodology and means to do so. C13. (Point 2.5.4.2) The eventual role of wind-transported dry salt as well as salt aerosols is not tackled. A13) This is correct. At this stage we have no indications whether or not wind transported salts have increased in our area. We have not included these aspects in our proposal and are not aware of any data related to this issue. It cannot be expected that such a study can be developed within the time frame allocated to the study. C14. (Point 2.6) It is noteworthy that the comparisons between water and energy balance resulted in evaporation rate of 1.1 -1.2 m/year which correspond to average annual inflows of 265-325 MCM/year and not more as suggested by earlier studies. A14) This statement is discussed in Section 2.6. The first paragraph provides an overview with range of estimations. This paragraph compares the estimations of evaporation from the Dead Sea by the various researchers, with their estimations of the water inflows into the Dead Sea, including the unobserved inflows. The second paragraph delves into the complexities in evaluating the evaporation rate in the Dead Sea as a hypersaline lake. The last paragraph provides the values that have been suggested as most reliable. C15. (Point 2.7) The important issues raised in this point is that the current ‘steady state’ of the sea is unstratified (homomictic) and with no anaerobic layer, whereas in the past we had below the picnocline bacteria reducing sulfur substances to sulfite. Such conditions may reapear if stratification is re-established by allowing Red Sea water and brine to overflow and in particular if algal blooms occur and the organic detritus finds its way to the sea bottom. A15) See A10 for an explanation.

Appendix - Rejoinder to the Client
Z:\IL\201280\R10.054A\BAD combined rejoinder.docx November 24, 2010 App-7
C16. (Point 2.8 2.8.1) The most difficult to calculate with accuracy concerns the constant change of the composition of the brine from the chemical plants and that to be produced from the gradual increase of desalination. Precipitation of salts may complicate calculations too. There is a statement which is both correct and problematic ‘there are no data for the calibration of the model with seawater inflow’. There is, however, no explanation of how this problem is going to be addressed. A16) The quote above refers mostly to the lack of data for the calibration of the development of stratification and other physical characteristics. Modelling the chemical evolution of the lake is less of a problem. The 1D and 2D models include tracing the chemical composition of the brine and include thermodynamic and salt precipitation modules. Thus, modelling the input of seawater or reject water will allow predicting the change in the Dead Sea composition with time and the amount of salts (mainly gypsum) expected to precipitate from the evolving brine under any given stratification scenario. We have inserted a correction on page 23 (Section 2.8.1). C17. (Point 2.8.1) A secondary problem might emerge later on since the Dead Sea models are products of modification of public domain open codes. To whom the new models to be produced will belong? A17) According to the contract signed with the World Bank …." new models and new data developed or gathered under this contract belong to the World Bank." C18. (Point 2.8.1.1, Page 28) Somewhat different figures are given in this part compared to those in other chapters e.g. pumping of some 525 MCM/year is mentioned in page 5 while 400-500 MCM/year are given in Page 28 (where other calculations give 750 MCM/year); or, that the closest figure to stabilizing the level is 1,300 MCM/ year with additional freshwater inflow of 950 MCM/year where somewhat different figures are given in other parts. A18) We assume that you meant " e.g. pumping of some 525 MCM/year is mentioned in page 28 while 400-500 MCM/year are given in Page 5. Thank you for pointing out the inconsistency in the text. We have now estimated 520 MCM for total pump and 240 MCM for the reject brine, and refer to this on page 5 in the report. C19. (Point 2.8.1) A fourth point is that new redox reactions cannot be excluded. A19) Redox conditions will develop in the lower water under long term stratification conditions. The concentration of redox sensitive elements might increase, mainly Fe+2. Indeed, prior to the 1979 overturn, iron concentration in the lower water body was 250 ppb. This may have an impact on the chemical

Appendix - Rejoinder to the Client
Z:\IL\201280\R10.054A\BAD combined rejoinder.docx November 24, 2010 App-8
industries. The role of sulfide under such conditions is discussed in Section 2.7. Redox reactions are not expected to have a major impact on the upper water body or the dynamics of stratification, thus is disregarded in the Dead Sea model. The Dead Sea model has some serious additional components compared with models for simulations of seas and lakes. Adding non-needed complexities to such a model is a disadvantage from our point of view. C20. (Point 2.8.2) It will be interesting to study the impact of ‘seeding’ the water with suitable material e.g. solid particles, gypsum, or other. A20) Reznik et al., (2009) have shown that solid particles other than gypsum barley catalyze the precipitation of gypsum from solution. Seeding the water with gypsum indeed accelerates the precipitation rates significantly. The seeding experiments are discussed in detail in the Mid Term Report in Section 3.7 and mentioned in the present report in Fig. 21. C21. (Point 2.8.2) One issue not examined at all in the Report is the behavior of the interface at the pycnocline which could act as a zone of accumulation of all kinds of ‘light’ particles including organic particles from the surface, particularly if algal blooms take place. In such a case, bacteria (aerobic and, depending on the conditions, cyanobacteria and other species adapted to intermittently anoxic conditions) may become more easily activated at the interface than at the sea bottom. A21) Indeed the possibility exists that the interface may become a zone of increased biological activity. Indications for this were obtained at the end of 1992 – beginning of 1993, when the green alga Dunaliella started to appear near the pycnocline (after an initial bloom in the mixed eplimnion) (Oren et al., 1995). This secondary minor bloom of Dunaliella consisted of active cells and not of dead or inactive biomass that passively sunk to the interface. No such “deep chlorophyll maximum” was observed in the Dead Sea following the 1980 algal bloom. Depending on the depth of the pycnocline to be formed and the availability of light at that depth, renewed stimulation of algal growth may be possible. Cyanobacteria are not likely to develop there, especially as the types of halophilic/halotolerant cyanobacteria that may grow in diluted Dead Sea water contain gas vesicles and tend to float to the surface. Facultatively anoxygenic cyanobacteria that can shift between aerobic growth with oxygen formation and anaerobic growth using sulfide as electron donor are known mostly from benthic systems (surface sediments) and not from communities suspended in the water, and always from systems with salt concentrations far lower than those in the Dead Sea. The possibility that particles of different kinds will accumulate at the interface and cause a local enrichment in organic matter surely exists. As also the salinity is locally lower than that of the salt-saturated deep brines, the interface may

Appendix - Rejoinder to the Client
Z:\IL\201280\R10.054A\BAD combined rejoinder.docx November 24, 2010 App-9
indeed become a zone of increased respiration activity and a local oxygen minimum may develop there. C22. (Point 2.8.2.3) If it takes an hour in the experiment gypsum formation, in real life it may take years. A22) Induction time is expected to be independent of the size of the system. C23. (Point 2.8.2.4) The ‘inner’ figure is not easy to understand. A23) The inner figure is an enlargement of the change of SO4
2- concentrations on the first 0.6 days of the experiment. This has been corrected in the text of Section 2.8.2.4 on page 36 in the paragraph above Fig. 21. C24. (Point 3.3.2.4) Figure 30 is not very clear. A24) The figure now has been revised so that the divisions and borders are clearly defined (refer to page 57). C25. (Point 4.1) The calculations made in Page 61 indicate that either the groundwater discharging is less than 100 MCM/year in comparison to earlier assessments or that the chemical industries pump more than they claim to. Indeed, the authors state that verification is needed and should be done soon. A25) As stated in Section 4.1 (pg. 61), the exact net loss of water due to the industries [Dead Sea Works (DSW) and Arab Potash Company (APC)] needs to be verified. We have no access to data from these industries in the context of this project, and we appeal to the World Bank to request this directly from the DSW and APC. COB in their report suggested a calculation for the net water lost by the two industries. These data are now mentioned in the Mid Term Report and will be further developed in the Draft and Final reports, if we obtain the needed information from the World Bank. C26. (Point 4.2) In that part we have a first approximate estimate of the natural stabilization of the Dead Sea level at -500 m if industries cease to operate in ‘several’ decades. A comparison with the hypothetical case that industries cease operations now, need to be made. A26) Since this is not a realistic scenario, the study's efforts should be focused onto running a limited number of reasonable scenarios. If there is a request by the World Bank, such a scenario could be run.

Appendix - Rejoinder to the Client
Z:\IL\201280\R10.054A\BAD combined rejoinder.docx November 24, 2010 App-10
C27. (Point 4.2) A detailed geophysical survey will be carried out in the framework of the present work to locate the faults. This is extremely important and needs to be better integrated in the work design. It looks essential but, still, cut-off from the rest of the work at the moment. It is not clear how the example of the Masade salt layer at -300 m will affect the sinkholes if the sea level will be at -500 m. A27) The geophysical survey is targeted to the near shore, at areas that are expected to be exposed in the coming years and may be sites for the development of new sinkhole sites. Given our understanding that the sinkholes tend to develop along faults which allow water flow, the survey aims to identify the existence of such faults. C28. (Point 4.3) The quantities for the balance are again slightly different than elsewhere with water deficit >700 MCM/year. By raising the level of the Dead Sea surface, the deficit will increase. A28) This is correct. Stratification and dilution of the surface water will lead to increased evaporation. C29. (Point 4.3.2 to Point 4.3.4) It is concluded that avoiding stratification could prevent a series of detrimental options that are either undesired or unknown yet in detail while, as a ‘solution’, it is proposed to limit the inflow volume to the Dead Sea to additional 400 MCM/year or total 700-750 MCM/year which is roughly balancing evaporation. Another option, which is not examined but would add a lot more salt to the sea, involves adding dry salts from the ‘mountains’ accumulated by the chemical industry around the sea to the incoming Red Sea and brine. To this end, two aspects need to be studied (a) the technical features of transporting and mixing this salt first in a lagoon or cut-off area and (b) if such option is adopted, for how long the existing stock could last. A29) We have not proposed limiting the inflow volume to prevent stratification. Rather we have stated that limiting inflow volume to less than 400 MCM will avoid stratification. If the additional inflows will exceed the above volume, stratification is likely to develop. Indeed under the latter conditions, if the salinity of the inflowing water will be increased by the dissolution of halite, it will likely diminish some of the phenomena mentioned in the Best Available Data report, including increased evaporation rate and magnitude of the biological blooming. On the other hand, the composition of the surface water will also change significantly. Incidentally, the "mountains" of salt exist only by the APC. The Dead Sea Works have not yet begun dredging their salts from pond #5.

Appendix - Rejoinder to the Client
Z:\IL\201280\R10.054A\BAD combined rejoinder.docx November 24, 2010 App-11
C30. (Point 3.5-3.7) The sulfite and H2S option is recognized as highly possible and, despite experimental evidence, it should not be considered so probable. Similarly, the ‘whitening’ option due to gypsum formation and the ‘greening’ or ‘reding’ ones due to algal blooms, are all quite probable.
A30) See the explanation in A10.
3. Issues Raised by the SMU C31) Comments on the Hydrology section. The section contains a series of historical references which can no longer be of use to build upon due to the continuous changes in the water resources utilization patterns. The concluded values are more realistic but still have to be verified in accordance with the current situation. A31) The Best Available Data Report reflects the best available data that could be obtained from the existing literature. The data has been presented as is and conclusions related to the present time have been given in Table 2 (Section 3.1.7). C32) Page 41-Item 3.1.4.2 : The report says that the sum of the total annual springs flows is 114 MCM, but does these total flows go to the Dead Sea? Or what remain after the utilization? A32) The total springs flow refers to the uncontrolled flow. At the moment there is no utilization. C33) ·Page 42-B: The same argument applies for Wadi Mujb,Wadi Wala and Wadi Zarqa which says that a mean annual flow of about 50 MCM would reach the Dead Sea, while our records for the last eight years estimate an average annual value of 15.5 MCM (with zero flow in dry years). A33) The Best Available Data Report considered the 50 MCM mean annual springs' flow of the Wadis Mujib, Wala and Zarqa Ma'in as uncontrolled flows. The records of 15.5 MCM above mentioned are not available. The Consultant had asked (Oct 4th) SMU to forward records of the annual average values for the water flow from the eastern side. If found relevant, water mass balances will be updated. C34) It is important to know that what end up at the Dead Sea are only the uncontrolled flows which couldn't be captured by the storage reservoirs or diversion weirs, in addition to the irrigation and other uses return flows and ground water depletion. These flows vary significantly between dry and wet years, with the dry years are dominating the scene in the last decades. A34) No source could be found that would indicate the year by year flows from the East. It is recommended that the source of these records would be forwarded to the Consultant.

Appendix - Rejoinder to the Client
Z:\IL\201280\R10.054A\BAD combined rejoinder.docx November 24, 2010 App-12
C35) In conclusion, both table 2 page 43 of Tahal B.A.D report and table 3.5 page 3 of Coyne et Bellier Summary B & D draft report, should be revised in order to reach a common view of the Dead Sea water mass balance in accordance with the current prevailing conditions. A35) Table 2 (Section 3.1.7) of the Best Available Data Report has been updated for the Mid Term Report after reviewing the source that refers to the lower springs contribution from the East.
Bibliography
Bosbach, D., Junta-Rosso, J. L., Becker, U., and Hochella, M. F. (1996). Gypsum growth in the presence of background electrolytes studied by Scanning Force Microscopy. Geochimica et Cosmochimica Acta 60, 3295-3304. Brandse, W. P., Vanrosmalen, G. M., and Brouwer, G. (1977). The influence of sodium-chloride on crystallization rate of gypsum. Journal of Inorganic and Nuclear Chemistry 39, 2007-2010. He, S., Oddo, J. E., and Tomson, M. B. (1994a). The Nucleation Kinetics of Calcium Sulfate Dihydrate in NaCl Solutions up to 6 m and 90°C. Journal of Colloid and Interface Science 162, 297-303. He, S., Oddo, J. E., and Tomson, M. B. (1994b). The Seeded Growth of Calcium Sulfate Dihydrate Crystals in NaCl Solutions up to 6 m and 90ºC. Journal of Colloid and Interface Science 163, 372-378. Oren, A., Gurevich, P., Anati, D.A., Barkan, E., and Luz, B. (1995). A bloom of Dunaliella parva in the Dead Sea in 1992: biological and biogeochemical aspects. Hydrobiologia 297: 173-185. Prieto, M., Putnis, A., Fernández-Diaz, L., and López-Andrés S. (1994). Metastability in diffusing-reacting systems. Journal of Crystal Growth 142, 225-235. Reznik, I. J., Gavrieli, I., and Ganor, J. (2009). Kinetics of gypsum nucleation and crystal growth from Dead Sea brine. Geochimica et Cosmochimica Acta 73, 6218-6230. Sheikholeslami, R. and Ong, H.W.K. (2003). Kinetics and thermodynamics of calcium carbonate and calcium sulfate at salinities up to 1.5 M. Desalination 157, 217-234.