deaths from external causes - australian bureau of ... · nhpa national health priority area ......
TRANSCRIPT

37Bibliography . . . . . . . . . . . . . . . . . . . . . . . . . . . . . . . . . . . . . . . . . . .36Glossary . . . . . . . . . . . . . . . . . . . . . . . . . . . . . . . . . . . . . . . . . . . . . .34Explanatory Notes . . . . . . . . . . . . . . . . . . . . . . . . . . . . . . . . . . . . . . . .27Detailed tables . . . . . . . . . . . . . . . . . . . . . . . . . . . . . . . . . . . . . . . . .26List of tables . . . . . . . . . . . . . . . . . . . . . . . . . . . . . . . . . . . . . . . . . . .
A D D I T I O N A L I N F O R M A T I O N
21Selected leading external causes of death . . . . . . . . . . . . . . . . . . . . . . . .20States and territories . . . . . . . . . . . . . . . . . . . . . . . . . . . . . . . . . . . . . .19Remoteness . . . . . . . . . . . . . . . . . . . . . . . . . . . . . . . . . . . . . . . . . . .17Indigenous Australians . . . . . . . . . . . . . . . . . . . . . . . . . . . . . . . . . . . . .14Older adults (65 years and over) . . . . . . . . . . . . . . . . . . . . . . . . . . . . . .13Adults (25–64 years) . . . . . . . . . . . . . . . . . . . . . . . . . . . . . . . . . . . . .11Young adults (15–24 years) . . . . . . . . . . . . . . . . . . . . . . . . . . . . . . . . .
8Children (0–14 years) . . . . . . . . . . . . . . . . . . . . . . . . . . . . . . . . . . . . . .7Sex differences . . . . . . . . . . . . . . . . . . . . . . . . . . . . . . . . . . . . . . . . . .5Overview — the last 5 years (1998–2002) . . . . . . . . . . . . . . . . . . . . . . . . .4Trends in deaths from External causes over the last 30 years (1972–2002) . . . .3Introduction . . . . . . . . . . . . . . . . . . . . . . . . . . . . . . . . . . . . . . . . . . . .
D E T A I L E D I N F O R M A T I O N
2Abbreviations . . . . . . . . . . . . . . . . . . . . . . . . . . . . . . . . . . . . . . . . . . .2Notes . . . . . . . . . . . . . . . . . . . . . . . . . . . . . . . . . . . . . . . . . . . . . . . .
page
C O N T E N T S
NewIssue
E M B A R G O : 1 1 . 3 0 A M ( C A N B E R R A T I M E ) F R I 6 F E B 2 0 0 4
DEATHS FROM EXTERNALCAUSES
A U S T R A L I A
3320.01 9 9 8 T O 2 0 0 2
! For further informationabout these and relatedstatistics, contact theNational Informationand Referral Service on1300 135 070.
I N Q U I R I E S
w w w . a b s . g o v . a u

The data used in this publication are made available to the Australian Bureau of Statistics
(ABS) from the data from the Registrar of Births, Deaths and Marriages in each state and
territory. The ABS compiles the data and codes causes of death to the International
Statistical Classification of Diseases and Related Health Problems, Tenth Revision
(ICD-10). The ICD-10 prescribes that when a death is attributed to an External cause, the
event leading to the death should be assigned a code from Chapter XX, External causes
of morbidity and mortality (V01-Y98) as well as a code to indicate the nature of the
resulting condition. Most often, the condition is classifiable to Chapter XIX of ICD-10,
Injury, poisoning and certain other consequences of External causes (S00-T98).
AB O U T TH I S PU B L I C A T I O N
Western AustraliaWA
VictoriaVic.
TasmaniaTas.
standardised mortality ratioSMR
South AustraliaSA
QueenslandQld
Northern TerritoryNT
New South WalesNSW
National Health Priority AreaNHPA
International Classification of Diseases 10th RevisionICD-10
Department of Health and Family ServicesDHFS
AustraliaAust.
Australian Institute of Health and WelfareAIHW
Australian Capital TerritoryACT
Australian Bureau of StatisticsABSAB B R E V I A T I O N S
De n n i s T r e w i n
Au s t r a l i a n S t a t i s t i c i a n
2 A B S • DE A T H S FR O M EX T E R N A L CA U S E S • 3 3 2 0 . 0 • 1 9 9 8 T O 2 0 0 2
N O T E S

This publication presents an overview of deaths from External causes in Australia. Deaths
are presented on a year of registration basis. It is part of a series of publications on
mortality produced by the Australian Bureau of Statistics. Deaths from External causes
(commonly called deaths from accidents and injury) are caused by environmental events
and circumstances that lead to injury, poisoning and other adverse effects (International
Statistical Classification of Diseases, tenth revision). The most common External causes
of death are Intentional self-harm, Transport accidents, Accidental poisoning, Falls, and
Accidental drowning.
For most parts of this publication, five years of deaths data have been used for analysis
(deaths registered from 1998 to 2002) rather than data for a single registration year. This
has enabled more detailed analysis than would be possible using data from the latest
available registration year alone.
From 1998 to 2002 External causes of death were the leading cause of death of those
aged under 55 years. Injury Prevention and Control (including fatal and non fatal injury)
has been identified as one of seven National Health Priority Areas (NHPA). The NHPAs
were defined by the Commonwealth and state and territory governments as chronic
diseases with potential for health gains, and those that pose a significant burden of
disease. The NHPA initiative involves focusing public attention and health policy to
developing strategies to improve health outcomes in these areas (Australian Institute of
Health and Welfare (AIHW) & Department of Health and Family Services (DHFS), 1997).
The National Public Health Partnership Group in its National Injury Prevention Plan
2001–2003 identified males, children, young males, those aged 65 years and older (with
particular reference to falls), those in rural and remote areas, Indigenous Australians, and
those who are socioeconomically disadvantaged as particular population groups at risk of
injury (National Public Health Partnership Group, 2001). Injury mortality of these groups
(with the exception of those who are socioeconomically disadvantaged) is examined in
detail in this publication. Socioeconomic status and mortality has been researched by
Mathers (1994), who provides a detailed examination of mortality and socioeconomic
status. Australian research conducted by Jolly, Moller and Volkmer (1993), Glover, Harris
and Tennant (1999) and Page, Morrell and Taylor (2002) provides further information
about socioeconomic status and External causes of death.
As well as the immense personal cost, the incidence of injury creates significant financial
burden. The direct medical costs of injury in 1994 alone were calculated as $2,607 million
(AIHW & DHFS, 1998). While the burden of injury is great, significant opportunities exist
to prevent deaths from injury compared to other causes of death. In order for
prevention policy to be well informed, statistics about injury deaths which are accurate
and detailed must be provided. This report supplements those produced by other
organisations involved in injury research, such as AIHW, the National Injury Surveillance
Unit (an AIHW collaborative centre) at Flinders University, The Accident Research Centre
at Monash University and The Injury Research Centre at the University of Western
Australia.
I N T R O D U C T I O N
A B S • DE A T H S FR O M EX T E R N A L CA U S E S • 3 3 2 0 . 0 • 1 9 9 8 T O 2 0 0 2 3
I N T R O D U C T I O N

(a) Age Standardised Rate, deaths per 100,000 persons.(b) Includes V02-V04, V07-V09, V12-V14, V19-V79, V803-V806, V810-V811, V820, V821, V83-V88, V890, V892, V899.(c) Includes Accidental poisoning X40-X49, Event of undetermined intent Y10-Y19 and Drugs, medicaments and biological substances causing adverse effects in therapeutic use Y40-Y59.
Source: Australian Institute of Health and Welfare 2003, Australian long term trends in mortality workbooks.
Canberra: AIHW.
1972 1978 1984 1990 1996 2002
rate(a)
0
10
20
30 Motor vehicle accidents(b)FallsAccidental poisoning(c)Suicide
TRENDS IN EXTERNAL CAUSES OF DEATH, Age Standard i sed Rates (a) —1972–20021
Deaths from External causes have decreased markedly over the last 30 years in Australia.
The age standardised death rates from selected leading External causes of death from
1972 to 2002 are displayed below. Before 1991, the leading cause of deaths from External
causes was Motor vehicle accidents. After 1991, the death rate from Motor vehicle
accidents became lower than the death rate from Intentional self-harm (suicide), which
remained relatively constant, except for an increase during 1997 and 1998. Rates of death
from Accidental poisoning have gradually risen over the last 30 years, with a marked
increase between 1998 and 2000. Death rates from Falls have remained relatively
constant over the past 30 years, though the last five years have seen a slight increase.
DE A T H S FR O M EX T E R N A L
CA U S E S , TH E LA S T 30
YE A R S
4 A B S • DE A T H S FR O M EX T E R N A L CA U S E S • 3 3 2 0 . 0 • 1 9 9 8 T O 2 0 0 2
T R E N D S O V E R T H E L A S T 3 0 Y E A R S ( 1 9 7 2 – 2 0 0 2 )

There were 40,370 deaths registered in the years 1998 to 2002 which had an External
cause as the underlying cause of death. A further 26,118 had External causes listed as an
associated cause of death (External causes contributed to the death, but not as the
underlying cause).
Complications of medical and surgical care were largely recorded not as the underlying
cause of death, but as an associated cause. The majority of these deaths (10,692 out of
14,316) were of those aged 65 years and over. Accidental exposure to other and
unspecified factors was also a prevalent associated cause of death for those aged 65 years
and over. Other accidental threats to breathing (includes Accidental suffocation,
strangulation and hanging as well as other causes, see Explanatory Notes) was an
associated cause in 3,430 deaths (all ages).
There were 2,454 deaths for which Accidental poisoning and exposure to noxious
substances was recorded as an associated cause. These deaths largely had an underlying
cause in the category of Mental and behavioural disorders due to psychoactive substance
use (F10-F19). These deaths were largely comprised of persons in the 20–44 year age
group.
AS S O C I A T E D CA U S E S OF
DE A T H
The leading External causes of death in Australia over the five-year period of 1998–2002
are displayed below. Intentional self-harm (suicide) caused the highest number of deaths
(12,312) of all the External causes. Transport accidents were the next highest External
cause of death (9,923). Of all Transport accidents causing death, those injuring car
occupants caused the highest number of deaths.1 Accidental exposure to other and
unspecified factors2 caused 4,527 deaths over 1998–2002. The number of deaths caused
by Accidental exposure to other and unspecified factors was largely comprised of
persons aged 65 years and over. Accidental poisoning by and exposure to noxious
substances was the underlying cause of 3,779 deaths.
UN D E R L Y I N G CA U S E OF
DE A T H
A B S • DE A T H S FR O M EX T E R N A L CA U S E S • 3 3 2 0 . 0 • 1 9 9 8 T O 2 0 0 2 5
O V E R V I E W — T H E L A S T 5 Y E A R S ( 1 9 9 8 – 2 0 0 2 )
2 Accidental exposure to other and unspecified factors is often used to classify the cause of death where thereis a Fracture, but the cause is uncertain (for example, it would appear there had been a Fall, but this could notbe confirmed). This category may be used when the coroner has found that the death was from External causes,but no further decision has been made.
1 It should be noted that while this report contains information on transport deaths, it does not containinformation about the level of use of transport vehicles. Therefore, conclusions about which transport vehiclescause more deaths relative to level of use cannot be drawn from this publication.

(d) Includes X40-X49.(e) For this category, the External cause occurred one year or more
before the death.
— nil or rounded to zero (including null cells)(a) Crude Rate, deaths per 100,000 persons.(b) Accidents and Injury.(c) Includes Accidental suffocation, strangulation and hanging as well as
other causes (see Explanatory Notes).
6080.50.30.7480157323Sequelae of external causes of morbidity and
mortality(e)
14 3160.60.70.6615329286Complications of medical and surgical care171.61.12.11 511528983Assault
912.95.320.512 3122 5489 764Intentional self-harm6 9054.75.73.84 5272 7341 793Accidental exposure to other and unspecified factors2 4543.92.35.63 7791 1222 657
Accidental poisoning by and exposure to noxioussubstances(d)
450.50.40.6477176301Exposure to smoke, fire and flames3 4301.10.81.51 092363729Other accidental threats to breathing(c)
901.30.62.01 249290959Accidental drowning and submersion300.70.11.265671585Exposure to inanimate mechanical forces
7522.92.63.32 8131 2381 575Falls
255.43.67.35 2121 7533 459Car occupant injured in transport accident—1.10.12.21 094691 025Motorcycle rider injured in transport accident31.81.12.61 7605311 229Pedestrian injured in transport accident
10810.45.615.29 9232 6907 233Transport accidents
26 11842.226.058.640 37012 52127 849External causes of morbidity and mortality(b)
512 232674.4640.6708.7645 846309 009336 837All Causes of Death
no.rateraterateno.no.no.
PersonsPersonsFemalesMalesPersonsFemalesMales
ASSOCIATEDCAUSEOF DEATHUNDERLYING CAUSE OF DEATH
EXTERNAL CAUSES OF DEATH, Al l Persons —number and rate(a) —1998– 20022
6 A B S • DE A T H S FR O M EX T E R N A L CA U S E S • 3 3 2 0 . 0 • 1 9 9 8 T O 2 0 0 2
O V E R V I E W — T H E L A S T 5 Y E A R S ( 1 9 9 8 – 2 0 0 2 ) continued
(a) Crude Rate, deaths per 100,000 persons.(b) Accidental poisoning by and exposure to noxious substances.
Intentional self-harm
Transport accidents
Accidental exposure to other and
unspecified factors
Accidental poisoning(b)
Falls
rate(a)
0
5
10
15
20
25 MalesFemales
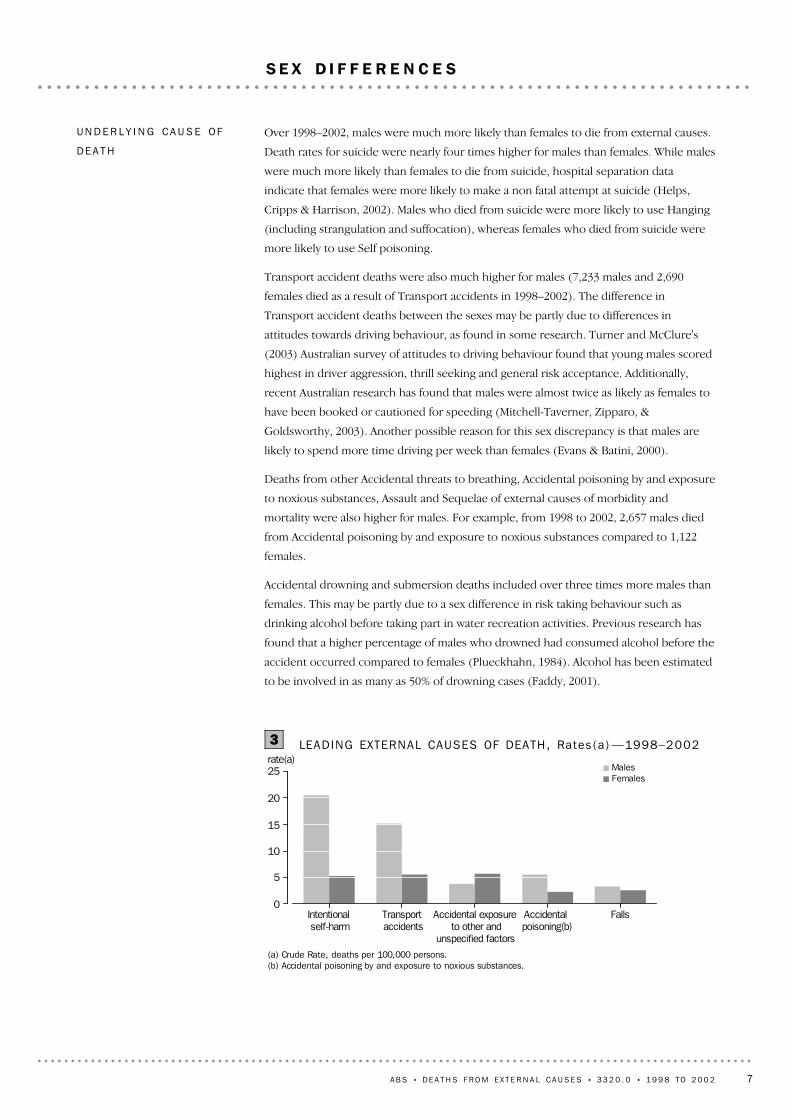
LEADING EXTERNAL CAUSES OF DEATH, Rates (a) —1998–20023
Over 1998–2002, males were much more likely than females to die from external causes.
Death rates for suicide were nearly four times higher for males than females. While males
were much more likely than females to die from suicide, hospital separation data
indicate that females were more likely to make a non fatal attempt at suicide (Helps,
Cripps & Harrison, 2002). Males who died from suicide were more likely to use Hanging
(including strangulation and suffocation), whereas females who died from suicide were
more likely to use Self poisoning.
Transport accident deaths were also much higher for males (7,233 males and 2,690
females died as a result of Transport accidents in 1998–2002). The difference in
Transport accident deaths between the sexes may be partly due to differences in
attitudes towards driving behaviour, as found in some research. Turner and McClure's
(2003) Australian survey of attitudes to driving behaviour found that young males scored
highest in driver aggression, thrill seeking and general risk acceptance. Additionally,
recent Australian research has found that males were almost twice as likely as females to
have been booked or cautioned for speeding (Mitchell-Taverner, Zipparo, &
Goldsworthy, 2003). Another possible reason for this sex discrepancy is that males are
likely to spend more time driving per week than females (Evans & Batini, 2000).
Deaths from other Accidental threats to breathing, Accidental poisoning by and exposure
to noxious substances, Assault and Sequelae of external causes of morbidity and
mortality were also higher for males. For example, from 1998 to 2002, 2,657 males died
from Accidental poisoning by and exposure to noxious substances compared to 1,122
females.
Accidental drowning and submersion deaths included over three times more males than
females. This may be partly due to a sex difference in risk taking behaviour such as
drinking alcohol before taking part in water recreation activities. Previous research has
found that a higher percentage of males who drowned had consumed alcohol before the
accident occurred compared to females (Plueckhahn, 1984). Alcohol has been estimated
to be involved in as many as 50% of drowning cases (Faddy, 2001).
UN D E R L Y I N G CA U S E OF
DE A T H
A B S • DE A T H S FR O M EX T E R N A L CA U S E S • 3 3 2 0 . 0 • 1 9 9 8 T O 2 0 0 2 7
S E X D I F F E R E N C E S

Further to the 1,501 deaths which had External causes recorded as the underlying cause
of death, there were 323 deaths which had External causes recorded as an associated
cause of death (the External cause was mentioned on the death certificate as a
contributing cause, but not the underlying cause). Most of these (214) had
Complications of medical and surgical care recorded as an associated cause of death.
There were also a large number of deaths (101) with an associated cause of Other
accidental threats to breathing.
AS S O C I A T E D CA U S E OF
DE A T H
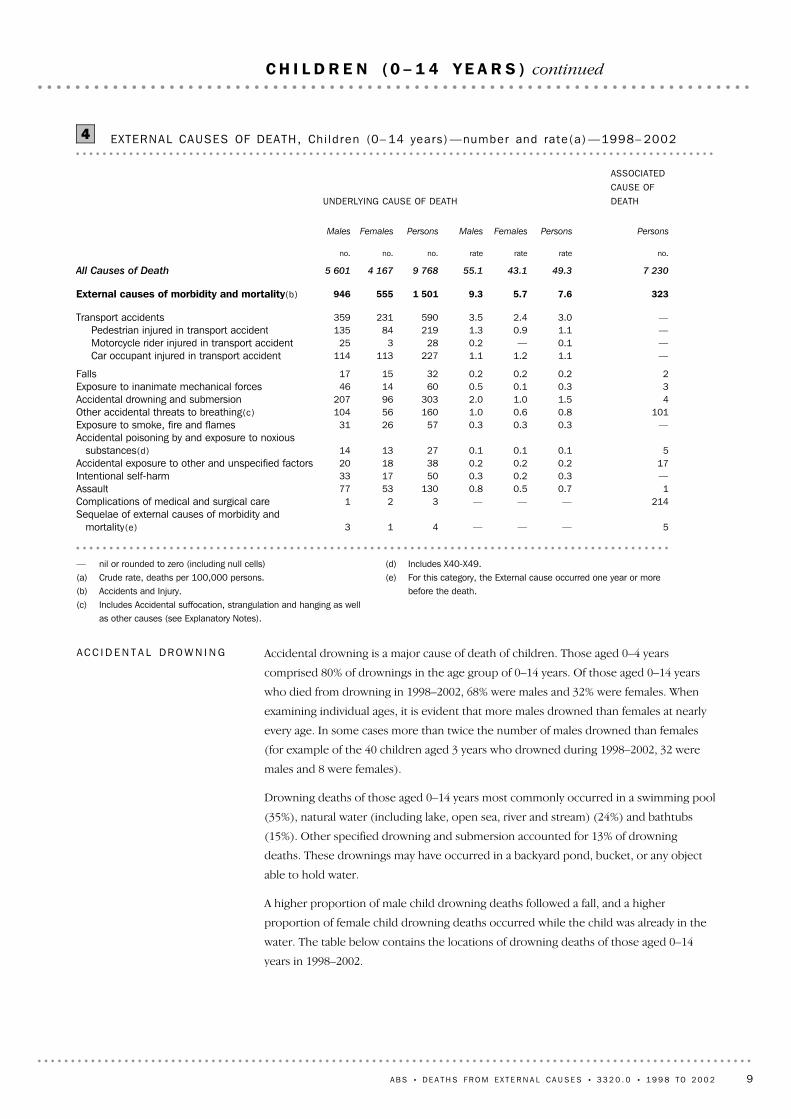
Over the five-year period from 1998–2002, there were 1,501 deaths registered of
0–14-year-old children where the underlying cause of death was an External cause. The
numbers and rates of deaths from External causes of those aged 0–14 years for
1998–2002 are displayed in table 4.
Transport accidents were the most common External cause of death of those aged
0–14 years. Deaths of pedestrians were particularly high for those aged 0–14 years, and
nearly equal to the number of deaths of car occupants. The rate of pedestrian deaths was
higher for males. The New South Wales (NSW) Child Death Review Team (2002) found
that a significant number of pedestrian accidents causing death of a toddler occurred
when the toddler was playing in the vicinity of vehicles without the driver or supervising
adult being aware of their location.
Accidental drowning was another significant cause of death in this age group, accounting
for 3.1% of all deaths of those aged 0–14 years and 20% of deaths from External causes of
those aged 0–14 years. Falls accounted for a relatively small number of accidental deaths
(32) of those aged 0–14 years. Accidental poisoning by and exposure to noxious
substances caused 27 deaths of children aged 0–14 during 1998–2002.
In the age group of 0–14 years, a large number of deaths had Other accidental threats to
breathing as the underlying cause of death (160). This category includes a variety of
causes of death such as Accidental suffocation, strangulation, hanging; Inhalation of
gastric contents and Inhalation and ingestion of food and other objects causing
obstruction to the respiratory tract (this category excludes deaths from Asthma (J45).
Again there was a large discrepancy between the sexes: for those aged 0–14 years the
rate of male deaths caused by Other accidental threats to breathing was significantly
higher than the rate of female deaths from this cause (1.0 and 0.6 respectively).
A large number of deaths of those aged 0–14 years was caused by Assault (130). Assault
was the fourth highest External cause of death of children aged 0–14 years. Age specific
death rates with Assault as the underlying cause were much higher for those aged 0–4
years than those aged 5–9 years and 10–14 years (see Detailed tables, page 32).
Intentional self-harm (suicide) caused 50 deaths of those aged 0–14 years between 1998
and 2002. These were predominantly in the 10–14 year age group.
UN D E R L Y I N G CA U S E OF
DE A T H
8 A B S • DE A T H S FR O M EX T E R N A L CA U S E S • 3 3 2 0 . 0 • 1 9 9 8 T O 2 0 0 2
C H I L D R E N ( 0 – 1 4 Y E A R S )
Accidental drowning is a major cause of death of children. Those aged 0–4 years
comprised 80% of drownings in the age group of 0–14 years. Of those aged 0–14 years
who died from drowning in 1998–2002, 68% were males and 32% were females. When
examining individual ages, it is evident that more males drowned than females at nearly
every age. In some cases more than twice the number of males drowned than females
(for example of the 40 children aged 3 years who drowned during 1998–2002, 32 were
males and 8 were females).
Drowning deaths of those aged 0–14 years most commonly occurred in a swimming pool
(35%), natural water (including lake, open sea, river and stream) (24%) and bathtubs
(15%). Other specified drowning and submersion accounted for 13% of drowning
deaths. These drownings may have occurred in a backyard pond, bucket, or any object
able to hold water.
A higher proportion of male child drowning deaths followed a fall, and a higher
proportion of female child drowning deaths occurred while the child was already in the
water. The table below contains the locations of drowning deaths of those aged 0–14
years in 1998–2002.
AC C I D E N T A L DR O W N I N G
(d) Includes X40-X49.(e) For this category, the External cause occurred one year or more
before the death.
— nil or rounded to zero (including null cells)(a) Crude rate, deaths per 100,000 persons.(b) Accidents and Injury.(c) Includes Accidental suffocation, strangulation and hanging as well
as other causes (see Explanatory Notes).
5———413Sequelae of external causes of morbidity and
mortality(e)
214———321Complications of medical and surgical care10.70.50.81305377Assault
—0.30.20.3501733Intentional self-harm170.20.20.2381820Accidental exposure to other and unspecified factors
50.10.10.1271314Accidental poisoning by and exposure to noxious
substances(d)
—0.30.30.3572631Exposure to smoke, fire and flames1010.80.61.016056104Other accidental threats to breathing(c)
41.51.02.030396207Accidental drowning and submersion30.30.10.5601446Exposure to inanimate mechanical forces20.20.20.2321517Falls
—1.11.21.1227113114Car occupant injured in transport accident—0.1—0.228325Motorcycle rider injured in transport accident—1.10.91.321984135Pedestrian injured in transport accident—3.02.43.5590231359Transport accidents
3237.65.79.31 501555946External causes of morbidity and mortality(b)
7 23049.343.155.19 7684 1675 601All Causes of Death
no.rateraterateno.no.no.
PersonsPersonsFemalesMalesPersonsFemalesMales
ASSOCIATEDCAUSE OFDEATHUNDERLYING CAUSE OF DEATH
EXTERNAL CAUSES OF DEATH, Ch i ld ren (0– 14 years ) —number and rate(a) —1998– 20024
A B S • DE A T H S FR O M EX T E R N A L CA U S E S • 3 3 2 0 . 0 • 1 9 9 8 T O 2 0 0 2 9
C H I L D R E N ( 0 – 1 4 Y E A R S ) continued

— nil or rounded to zero (including null cells)
144217161326Unspecified drowning and submersion133913121327Other specified drowning and submersion1236991327Drowning and submersion following fall into natural water123515141021Drowning and submersion while in natural water237018172653Drowning and submersion following fall into swimmingpool123512111224Drowning and submersion while in swimmingpool
13——13Drowning and submersion following fall into bathtub144318171326Drowning and submersion while in bathtub
10030310096100207Accidental drowning and submersion (W65-W74)
%no.%no.%no.
PERSONSFEMALESMALES
LOCAT ION OF DROWNING DEATHS, Chi ld ren (0– 14years ) —1998– 20025
AC C I D E N T A L DR O W N I N G
continued
10 A B S • DE A T H S FR O M EX T E R N A L CA U S E S • 3 3 2 0 . 0 • 1 9 9 8 T O 2 0 0 2
C H I L D R E N ( 0 – 1 4 Y E A R S ) continued

There were 5,889 deaths of 15–24-year-olds where the underlying cause of death was an
External cause. A further 570 deaths had External causes recorded as an associated cause
of death (External cause was mentioned on the death certificate as a contributing cause,
but not the underlying cause). For most of these (410) Accidental poisoning by and
exposure to noxious substances was listed as an associated cause. The majority of these
cases had a Mental and behavioural disorder due to substance use (F10-F19) listed as the
underlying cause. Other accidental threats to breathing was a significant associated cause
of death, with an additional 114 deaths recorded as an associated cause, whereas only 93
were recorded as underlying cause.
AS S O C I A T E D CA U S E OF
DE A T H
Transport accidents accounted for 31% of all deaths of those aged 15–24 years. Accidents
causing death where a car occupant was injured were particularly high. Deaths of
motorcycle riders were also higher in this age group. Of those aged 15–24 years, more
motorcycle riders died than pedestrians. As with other age groups, many more males
than females aged 15–24 years were killed in Transport accidents. This may be explained
by the tendency of males to engage in risk taking behaviours (Turner & McClure, 2003).
Hewitt (cited by National Health and Medical Research Council, 1996) has found that
male risk taking behaviour is at the greatest frequency among 20–24-year-olds, followed
by 25–34-year-olds, and then 16–19-year-olds. This may suggest part of the reason for the
high numbers of Transport accident deaths among those aged 15–24 years.
TR A N S P O R T AC C I D E N T S
Deaths from External causes were a major cause of death of those aged 15–24 years.
Over 1998–2002, deaths from External causes constituted 70% of all deaths of those aged
15–24 years. Of all deaths of females aged 15–24 years, 59% were from External causes,
whereas 75% of all deaths of males aged 15–24 years were from External causes. As seen
in the table below, Intentional self-harm (suicide) and Transport accidents comprised
the majority of deaths from External causes for this age group.
Suicide was a significant cause of death for those aged 15–24 years, accounting for 22%
of all deaths in this age group. Males were much more likely to commit suicide, with 81%
of the suicides of those aged 15–24 years being males.
For those aged 15–24 years, Accidental poisoning by and exposure to noxious substances
also caused a large number of deaths. There were 457 male deaths and 161 female
deaths with an underlying cause of Accidental poisoning by and exposure to noxious
substances. Drowning was also higher for males, with 125 male drowning deaths
compared to 22 female drowning deaths of those aged 15–24 years. Falls accounted for
94 deaths in this age group, 77 of which were of males.
Assault was a notable cause of death of those aged 15–24 years, accounting for 3.0% of all
deaths. Again, males were over represented in this category.
UN D E R L Y I N G CA U S E OF
DE A T H
A B S • DE A T H S FR O M EX T E R N A L CA U S E S • 3 3 2 0 . 0 • 1 9 9 8 T O 2 0 0 2 11
Y O U N G A D U L T S ( 1 5 – 2 4 Y E A R S )

(d) Includes X40-X49.(e) For this category, the External cause occurred one year or more
before the death.
— nil or rounded to zero (including null cells)(a) Crude rate, deaths per 100,000 persons.(b) Accidents and injury.(c) Includes Accidental suffocation, strangulation and hanging as well
as other causes (see Explanatory Notes).
80.10.10.216412Sequelae of external causes of morbidity and
mortality(e)
133———532Complications of medical and surgical care31.91.52.325398155Assault
—13.95.422.11 8203471 473Intentional self-harm130.30.20.5401030Accidental exposure to other and unspecified factors
4104.72.56.9618161457Accidental poisoning by and exposure to noxious
substances(d)
20.30.10.435827Exposure to smoke, fire and flames1140.70.21.2931578Other accidental threats to breathing(c)
171.10.31.914722125Accidental drowning and submersion20.60.11.179772Exposure to inanimate mechanical forces
—0.70.31.2941777Falls
—12.46.717.91 6234311 192Car occupant injured in transport accident—2.40.44.431826292Motorcycle rider injured in transport accident—2.30.83.830654252Pedestrian injured in transport accident319.79.229.82 5745911 983Transport accidents
57045.020.468.75 8891 3084 581External causes of morbidity and mortality(b)
7 52063.834.492.28 3572 2126 145All Causes of Death
no.rateraterateno.no.no.
PersonsPersonsFemalesMalesPersonsFemalesMales
ASSOCIATEDCAUSE OFDEATHUNDERLYING CAUSE OF DEATH
EXTERNAL CAUSES OF DEATH, Young Adu l ts (15– 24 years ) —number and rate(a) —1998–20026
12 A B S • DE A T H S FR O M EX T E R N A L CA U S E S • 3 3 2 0 . 0 • 1 9 9 8 T O 2 0 0 2
Y O U N G A D U L T S ( 1 5 – 2 4 Y E A R S ) continued

(d) Includes X40–X49.(e) For this category, the External cause occurred one year or more
before the death.
— nil or rounded to zero (including null cells)(a) Crude rate, deaths per 100,000 persons.(b) Accidents and Injury.(c) Includes Accidental suffocation, strangulation and hanging as well
as other causes (see Explanatory Notes).
2460.40.20.722449175Sequelae of external causes of morbidity and
mortality(e)
3 2760.20.20.21216358Complications of medical and surgical care102.01.32.71 024326698Assault
717.57.227.88 9171 8397 078Intentional self-harm3310.50.30.827479195Accidental exposure to other and unspecified factors
1 7885.73.28.12 8928262 066Accidental poisoning by and exposure to noxious
substances(d)
120.40.30.622571154Exposure to smoke, fire and flames8400.80.31.340787320Other accidental threats to breathing(c)
591.20.52.0635126509Accidental drowning and submersion100.90.11.643431403Exposure to inanimate mechanical forces931.40.62.3726151575Falls
75.03.36.72 5388441 694Car occupant injured in transport accident—1.40.22.772239683Motorcycle rider injured in transport accident—1.50.72.2753188565Pedestrian injured in transport accident3610.14.815.45 1461 2353 911Transport accidents
5 83642.419.765.121 5895 01716 572External causes of morbidity and mortality(b)
87 847238.9171.8306.1121 72043 78777 933All Causes of Death
no.rateraterateno.no.no.
PersonsPersonsFemalesMalesPersonsFemalesMales
ASSOCIATEDCAUSE OFDEATHUNDERLYING CAUSE OF DEATH
EXTERNAL CAUSES OF DEATH, Adu l ts (25– 64 years ) —number and rate(a) —1998– 20027
Over the 5-year-period from 1998–2002 there were 21,589 deaths registered for
25–64-year-old persons where the underlying cause of death was an External cause. A
further 5,836 deaths had External causes recorded as an associated cause of death (the
External cause was mentioned on the death certificate as a contributing cause, but not
the underlying cause of death). Most of these had Complications of medical and surgical
care (3,276) and Accidental poisoning by and exposure to noxious substances (1,788) as
an associated cause of death.
AS S O C I A T E D CA U S E OF
DE A T H
Deaths from External causes accounted for 18% of all deaths of those aged 25–64 years.
The rate of death from Intentional self-harm (suicide) was very high for this age group at
18 per 100,000 persons. As with other age groups, males aged 25–64 years were much
more likely to die from suicide than females of the same age with rates of 28 and
7 respectively.
Accidental poisoning by and exposure to noxious substances was the underlying cause of
death in 2892 deaths of those aged 25–64 years, with over double the number of males
than females who died of this cause.
UN D E R L Y I N G CA U S E OF
DE A T H
A B S • DE A T H S FR O M EX T E R N A L CA U S E S • 3 3 2 0 . 0 • 1 9 9 8 T O 2 0 0 2 13
A D U L T S ( 2 5 – 6 4 Y E A R S )

There were 11,372 deaths of those aged 65 years or older where the underlying cause of
death was an External cause. A further 19,385 deaths had External causes recorded as an
associated cause of death (External cause was mentioned on the death certificate as a
contributing cause, but not the underlying cause). Most of these (10,692) were where
Complications of medical and surgical care was listed as an associated cause. In almost all
of the cases where Complications of medical and surgical care was included on the death
certificate, it was listed as an associated cause. Accidental falls and Accidental exposure to
other and unspecified factors were frequently listed associated causes of death for those
aged 65 years and over.
AS S O C I A T E D CA U S E
External causes of death accounted for a relatively small proportion of all deaths of those
aged 65 years and over (2.2%). Many more deaths occurred as a result of Falls and
Accidental exposure to other and unspecified factors (includes fractures unspecified; see
discussion below) than of Transport accidents. The rate of death from Intentional
self-harm (suicide) for those aged 65 years and older was similar to that of all persons.
Overall there was little difference between numbers of deaths from External causes
between males and females for those aged 65 years and over. However, for some specific
causes of death there was variation between males and females. For example, more
females than males died from Falls and Accidental exposure to other and unspecified
factors and more males than females died from Transport accidents and suicide.
UN D E R L Y I N G CA U S E OF
DE A T H
14 A B S • DE A T H S FR O M EX T E R N A L CA U S E S • 3 3 2 0 . 0 • 1 9 9 8 T O 2 0 0 2
O L D E R A D U L T S ( 6 5 Y E A R S A N D O V E R )
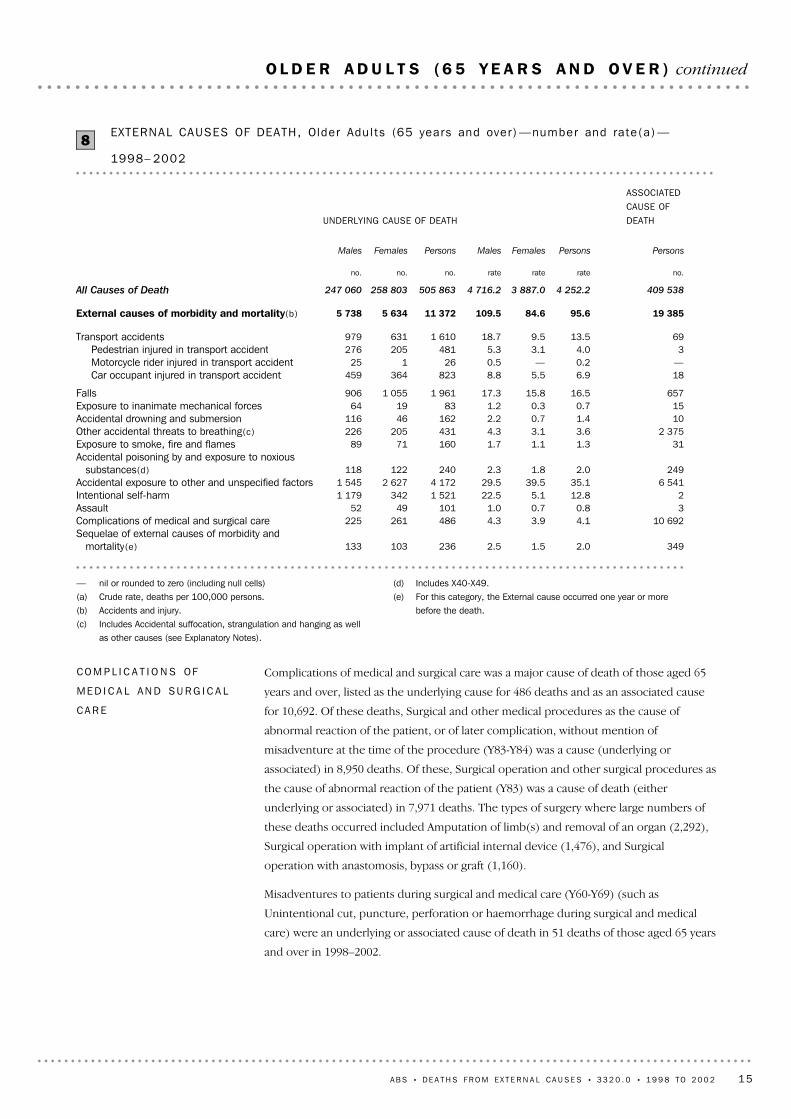
Complications of medical and surgical care was a major cause of death of those aged 65
years and over, listed as the underlying cause for 486 deaths and as an associated cause
for 10,692. Of these deaths, Surgical and other medical procedures as the cause of
abnormal reaction of the patient, or of later complication, without mention of
misadventure at the time of the procedure (Y83-Y84) was a cause (underlying or
associated) in 8,950 deaths. Of these, Surgical operation and other surgical procedures as
the cause of abnormal reaction of the patient (Y83) was a cause of death (either
underlying or associated) in 7,971 deaths. The types of surgery where large numbers of
these deaths occurred included Amputation of limb(s) and removal of an organ (2,292),
Surgical operation with implant of artificial internal device (1,476), and Surgical
operation with anastomosis, bypass or graft (1,160).
Misadventures to patients during surgical and medical care (Y60-Y69) (such as
Unintentional cut, puncture, perforation or haemorrhage during surgical and medical
care) were an underlying or associated cause of death in 51 deaths of those aged 65 years
and over in 1998–2002.
CO M P L I C A T I O N S OF
ME D I C A L AN D SU R G I C A L
CA R E
(d) Includes X40-X49.(e) For this category, the External cause occurred one year or more
before the death.
— nil or rounded to zero (including null cells)(a) Crude rate, deaths per 100,000 persons.(b) Accidents and injury.(c) Includes Accidental suffocation, strangulation and hanging as well
as other causes (see Explanatory Notes).
3492.01.52.5236103133Sequelae of external causes of morbidity and
mortality(e)
10 6924.13.94.3486261225Complications of medical and surgical care30.80.71.01014952Assault212.85.122.51 5213421 179Intentional self-harm
6 54135.139.529.54 1722 6271 545Accidental exposure to other and unspecified factors2492.01.82.3240122118
Accidental poisoning by and exposure to noxioussubstances(d)
311.31.11.71607189Exposure to smoke, fire and flames2 3753.63.14.3431205226Other accidental threats to breathing(c)
101.40.72.216246116Accidental drowning and submersion150.70.31.2831964Exposure to inanimate mechanical forces
65716.515.817.31 9611 055906Falls
186.95.58.8823364459Car occupant injured in transport accident—0.2—0.526125Motorcycle rider injured in transport accident34.03.15.3481205276Pedestrian injured in transport accident
6913.59.518.71 610631979Transport accidents
19 38595.684.6109.511 3725 6345 738External causes of morbidity and mortality(b)
409 5384 252.23 887.04 716.2505 863258 803247 060All Causes of Death
no.rateraterateno.no.no.
PersonsPersonsFemalesMalesPersonsFemalesMales
ASSOCIATEDCAUSE OFDEATHUNDERLYING CAUSE OF DEATH
EXTERNAL CAUSES OF DEATH, Older Adu l ts (65 years and over ) —number and rate(a) —
1998– 20028
A B S • DE A T H S FR O M EX T E R N A L CA U S E S • 3 3 2 0 . 0 • 1 9 9 8 T O 2 0 0 2 15
O L D E R A D U L T S ( 6 5 Y E A R S A N D O V E R ) continued

— nil or rounded to zero (including null cells)(a) Includes X58-X59.(b) This table contains numbers of deaths where the underlying cause of death was Accidental exposure to other and
unspecified factors and where a code for nature of injury was also recorded. There could be more than one nature ofinjury code recorded per death (for example, Injuries to the head and Injuries to the thorax). Therefore, the sum of thecomponents of Chapter XIX (nature of injury) will not equal the total deaths for Chapter XIX. See paragraphs 2 and 3 ofExplanatory Notes.
(c) Includes S00-T98.Note: There were two deaths with Accidental exposure to other and unspecified factors reported as the underlying cause,
but no cause reported from Chapter XIX Injury, poisoning and certain other consequences of external causes.
341 403Frostbite, poisonings and toxic effects—1Burns and corrosions122Effects of foreign body entering through natural orifice4149Injuries to unspecified part of trunk, limb or body region121Injuries involving multiple body regions
—10Injuries to the ankle and foot266Injuries to the knee and lower leg
733 046Injuries to the hip and thigh—13Injuries to the wrist and hand135Injuries to the elbow and forearm4160Injuries to the shoulder and upper arm
10402Injuries to the abdomen, lower back, lumbar spine and pelvis5223Injuries to the thorax272Injuries to the neck5218Injuries to the head
1004 170CHAPTER XIX Injury, poisoning and certain other consequences of
external causes(c)
%no.
ACCIDENTAL EXPOSURE TOOTHER AND UNSPECIFIEDFACTORS(a)
ACCIDENTAL EXPOSURE TO OTHER AND UNSPECIF IED FACTORS (a) , Nature of In ju r ies(se lec ted) (b ) —Older Adu l ts (65 years and over ) —1998– 20029
A large number of deaths of those aged 65 years and over were attributed to the
underlying cause of Accidental exposure to other and unspecified factors (4,172). For a
further 6,541 deaths, this was an associated cause. Accidental exposure to other and
unspecified factors is often used to code the death where there is a fracture, but the
cause is uncertain (for example it would seem that there had been a fall, but this could
not be confirmed). This code may also be used when the coroner has found that the
death was from External causes, but no further decision has been made.
Where Accidental exposure to other and unspecified factors was coded as the underlying
cause of death, Injuries to the hip and thigh (S70-S79) (mainly fracture of femur) were
commonly recorded on the death certificate of those aged 65 years and over. Causes of
death in the category of Frostbite, poisonings and toxic effects were frequently reported
as associated causes where the underlying cause of death was Accidental exposure to
other and unspecified factors (1,403 deaths). The main associated cause of death in the
category of Frostbite, poisonings and toxic effects was Certain early complications of
trauma (T79), an associated cause in 838 deaths of those aged 65 years and over where
the underlying cause was Accidental exposure to other and unspecified factors.
AC C I D E N T A L EX P O S U R E
TO OT H E R AN D
UN S P E C I F I E D FA C T O R S
16 A B S • DE A T H S FR O M EX T E R N A L CA U S E S • 3 3 2 0 . 0 • 1 9 9 8 T O 2 0 0 2
O L D E R A D U L T S ( 6 5 Y E A R S A N D O V E R ) continued

Table 11 shows Standardised Mortality Ratios (SMR). These are calculated as the ratio of
observed deaths to expected deaths. The SMR provides a relative assessment of the
health status of a particular population by comparing the actual number of deaths for
that population to the expected number of deaths that would have occurred if that
population had the same mortality experience as the reference (or standard) population.
Expected deaths in this publication were calculated by applying standard death rates for
Australia (persons) for 2000–2002 to experimental Indigenous 2001 estimates, for the
five states or territories where coverage of Indigenous deaths is deemed acceptable
(NSW, Qld, SA, WA, and NT). The standard rates were also applied to 2001 estimated
resident populations for the total Australian population. These rates were applied in 5
year age groups from 0–4 years to 75 years and over. For comparison, the SMR for
persons in Australia (all states/territories) is 1.0. Rates from only one standard population
(persons) have been used for the calculations, so SMRs for males and females are able to
be compared in this case.
(b) Accidents and Injury.(c) Includes Accidental suffocation, strangulation and hanging as well as
other causes (see Explanatory Notes).
— nil or rounded to zero (including null cells)(a) Includes data from NSW, Qld, SA, WA and NT only, where coverage of
Indigenous deaths is deemed acceptable.
0.11570.1323—10.425Sequelae and supplementary factors of external cause0.13290.12860.290.14Complications of medical and surgical care0.25280.39832.1892.0114Assault0.82 5482.99 7641.9806.7374Intentional self-harm0.92 7340.51 7930.5210.528Accidental exposure to other and unspecified factors0.41 1220.82 6571.0421.374
Accidental poisoning by and exposure to noxioussubstances
0.11760.13010.4150.316Exposure to smoke, fire and flames0.13630.27290.5201.268Other accidental threats to breathing(c)0.12900.39590.5231.054Accidental drowning and submersion—710.25850.150.421Exposure to inanimate mechanical forces
0.41 2380.51 5750.3120.422Falls
0.61 7531.03 4591.5642.4136Car occupant injured in transport accident—690.31 025——0.29Motorcycle rider injured in transport accident
0.25310.41 2291.3551.797Pedestrian injured in transport accident0.92 6902.17 2333.21345.0281Transport accidents
4.112 5218.327 84910.946020.01 118External causes of morbidity and mortality(b)
100.0309 009100.0336 837100.04 202100.05 602All Causes of Death
%no.%no.%no.%no.
FemalesFemalesMalesMalesFemalesFemalesMalesMales
TOTAL AUSTRALIAN POPULATIONINDIGENOUS POPULATION(a)
EXTERNAL CAUSES OF DEATH, Ind igenous Popu la t ion and Tota l Aust ra l ian Popu la t ion —
1998– 200210
Deaths from External causes are a leading cause of death for both Indigenous and
non-Indigenous persons; however, proportionally, they account for substantially more
deaths in the Indigenous population. Deaths data for Indigenous persons are based on
records from New South Wales, Queensland, South Australia, Western Australia and the
Northern Territory combined, jurisdictions determined as having sufficient Indigenous
deaths coverage.
UN D E R L Y I N G CA U S E OF
DE A T H
A B S • DE A T H S FR O M EX T E R N A L CA U S E S • 3 3 2 0 . 0 • 1 9 9 8 T O 2 0 0 2 17
I N D I G E N O U S A U S T R A L I A N S

Reasons for high rates of Indigenous injury mortality are complex and have been the
subject of much research. Harrison and Moller (1994) suggest that, amongst other
factors, alcohol plays a significant role in the high rate of injury of Indigenous Australians
particularly with regard to Motor vehicle accidents and injuries to pedestrians. The high
speed of travel on rural roads, general socioeconomic disadvantage, and the
consequences of social disruption, are also suggested as factors which may contribute to
high Indigenous rates of death from External causes.
For a more extensive discussion of Indigenous mortality and coverage issues see The
Health and Welfare of Australia's Aboriginal and Torres Strait Islander Peoples (ABS &
AIHW, 2003. ABS cat. no. 4704.0, AIHW Cat. No. IHW11) and Deaths, Australia 2002
(ABS cat. no. 3302.0).
(a) Standardised mortality ratio, the ratio of observed to expected deaths.(b) Includes data from NSW, Qld, SA, WA and NT only, where coverage of Indigenous deaths is deemed acceptable.(c) Accidents and Injury.
1.00.71.37.36.58.1Assault1.00.41.62.40.94.0Intentional self-harm1.00.51.52.11.42.9Transport accidents
1.00.61.42.61.53.7External causes of morbidity and
mortality(c)
PersonsFemalesMalesPersonsFemalesMales
TOTAL AUSTRALIANPOPULATION
INDIGENOUSPOPULATION(b)
SMR (a) , Selec ted Externa l causes of death —2000– 200211
Table 11 shows that Indigenous males in particular experience a substantial proportion
of deaths from External causes. After adjusting for differences in age structure, there
were 3.7 times as many male Indigenous deaths from External causes as would be
expected, if total Australian rates for persons are applied to the Indigenous population.
In comparison, there were only 1.4 times as many deaths as expected for males from the
total population.
UN D E R L Y I N G CA U S E OF
DE A T H continued
18 A B S • DE A T H S FR O M EX T E R N A L CA U S E S • 3 3 2 0 . 0 • 1 9 9 8 T O 2 0 0 2
I N D I G E N O U S A U S T R A L I A N S continued

2.419 413 240458 520Total
45.4178 47581 002Very remote12.4324 32140 161Remote
5.32 013 563105 875Outer regional2.34 025 89592 988Inner regional1.112 870 986138 494Major cities
%no.no.
Indigenous
Percentage
Total Australian
Population
Indigenous
Population
ESTIMATED RESIDENT POPULAT ION, By remotenessst ruc tu re —200113
(a) Standardised Mortality Ratio, ratio of observed to expected deaths. For comparison, the SMR for persons (Australia) is 1.0.
MajorCities
Inner Regional
Outer Regional
Remote Very Remote
SMR(a)
0
1
2
3
4 MalesFemales
SMR (a) DEATHS FROM EXTERNAL CAUSES, Remotenessareas —2001
12
When considering the standardised mortality ratio (SMR) for deaths from External causes
for different remoteness groups, it is clear that the SMR increases substantially (especially
for males) with increasing remoteness. The trend for females is less evident, but still
apparent. These results are consistent with other health research and support the
proposition that "people living in rural and regional Australia have many health
disadvantages compared to their urban counterparts" (AIHW, 1998).
Many factors have been suggested as contributing to health disadvantage in rural and
remote areas, including geographic isolation, shortage of and lack of access to health
services, socioeconomic disadvantage, Indigenous health needs, lower road quality and
greater exposure to injury, especially in farming and mining industries (AIHW, 1998).
It is important to note, however, that the proportion of Indigenous deaths may impact
on the association between mortality and remoteness (Coorey, 2003). For example, the
following table indicates that 45% of the population in the very remote category is
Indigenous. The very high SMRs for males in very remote areas may in fact reflect the
high proportion of Indigenous persons in these areas. Indigenous death rates from
External causes are known to be very high compared to the total population (ABS, 2003).
For further information about remoteness and mortality see AIHW (2003) Rural,
Regional and Remote Health: a study on mortality; AIHW Cat. No. PHE 45.
ST A N D A R D I S E D
MO R T A L I T Y RA T I O S
A B S • DE A T H S FR O M EX T E R N A L CA U S E S • 3 3 2 0 . 0 • 1 9 9 8 T O 2 0 0 2 19
R E M O T E N E S S
(d) Includes X40-X49.(e) For this category, the External cause occurred one year or
more before the death.
(a) Age Standardised Rates, deaths per 100,000 persons.(b) Accidents and injury.(c) Includes Accidental suffocation, strangulation and hanging as
well as other causes (see Explanatory Notes).
0.50.20.70.70.70.40.70.40.5Sequelae of external causes of morbidity and
mortality(e)
0.70.72.70.70.80.80.80.60.6Complications of medical and surgical care1.60.47.71.31.51.71.61.21.7Assault
12.811.121.113.913.813.514.911.312.1Intentional self-harm4.95.25.54.95.13.75.85.24.4Accidental exposure to other and unspecified factors3.93.93.63.84.23.23.34.93.7
Accidental poisoning by and exposure to noxioussubstances(d)
0.50.33.01.30.40.60.40.40.5Exposure to smoke, fire and flames1.11.71.11.31.51.31.40.81.1Other accidental threats to breathing(c)1.31.23.01.61.50.91.51.01.4Accidental drowning and submersion0.70.21.31.60.70.70.80.60.6Exposure to inanimate mechanical forces3.03.88.04.83.11.63.91.93.4Falls
5.44.415.45.16.16.35.55.15.1Car occupant injured in transport accident1.10.61.80.91.41.21.21.21.0Motorcycle rider injured in transport accident1.80.96.21.51.71.91.61.81.9Pedestrian injured in transport accident
10.47.328.511.411.611.110.69.79.6Transport accidents
42.436.589.548.445.940.647.138.940.3External causes of morbidity and mortality(b)
688.7632.4969.5762.6664.1688.8701.1673.7690.2All Causes of Death
rateraterateraterateraterateraterate
Aust.ACTNTTas.WASAQldVic.NSW
EXTERNAL CAUSES OF DEATH, State and Ter r i to r y —Age Standard ised Rates (a ) —1998– 200214
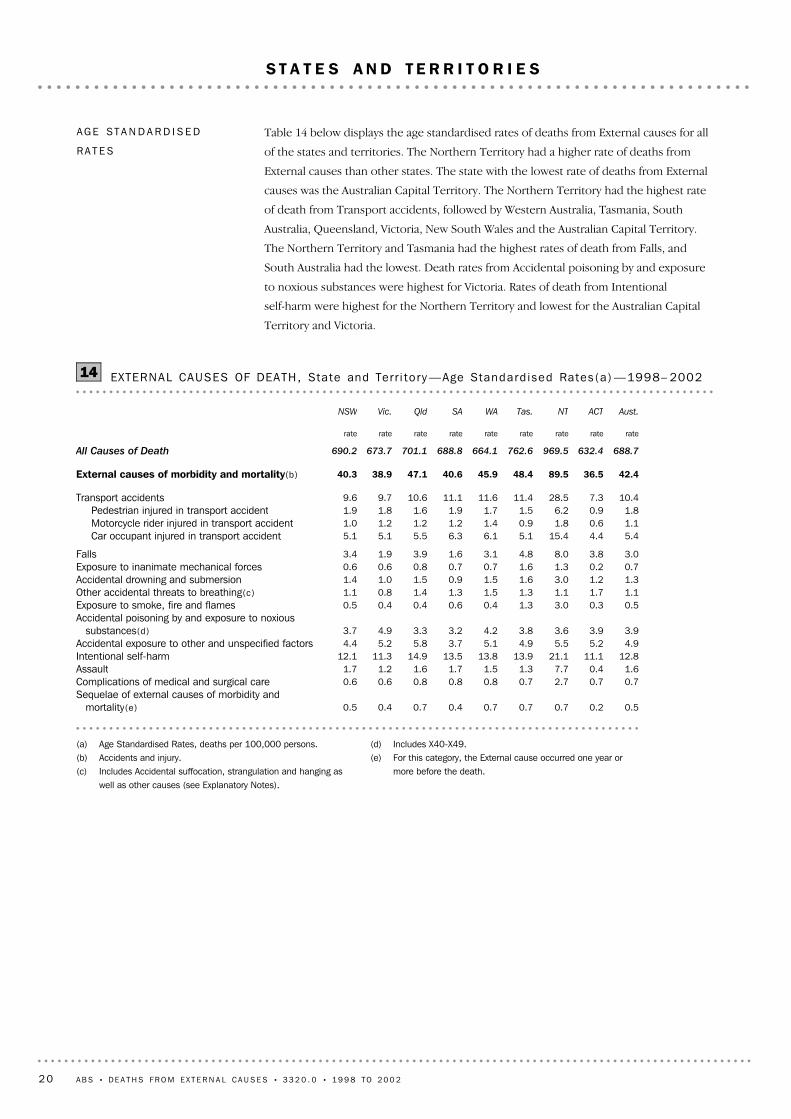
Table 14 below displays the age standardised rates of deaths from External causes for all
of the states and territories. The Northern Territory had a higher rate of deaths from
External causes than other states. The state with the lowest rate of deaths from External
causes was the Australian Capital Territory. The Northern Territory had the highest rate
of death from Transport accidents, followed by Western Australia, Tasmania, South
Australia, Queensland, Victoria, New South Wales and the Australian Capital Territory.
The Northern Territory and Tasmania had the highest rates of death from Falls, and
South Australia had the lowest. Death rates from Accidental poisoning by and exposure
to noxious substances were highest for Victoria. Rates of death from Intentional
self-harm were highest for the Northern Territory and lowest for the Australian Capital
Territory and Victoria.
AG E ST A N D A R D I S E D
RA T E S
20 A B S • DE A T H S FR O M EX T E R N A L CA U S E S • 3 3 2 0 . 0 • 1 9 9 8 T O 2 0 0 2
S T A T E S A N D T E R R I T O R I E S

(a) Includes (V01-V99).(b) Age Specific Rate, deaths per 100,000 persons.
5–9 15–19 25–29 35–39 45–49 55–59 65–69 75–79 85+ andover
Age group (years)
rate(b)
0
10
20
30
40 MalesFemalesPersons
TRANSPORT ACCIDENTS (a) , Age Spec i f i c Rates (b ) —bysex —1998–2002
16
Overall, high rates of Transport accident deaths occurred for those aged 15–19 years,
20–25 years and 25–29 years during 1998–2002. This trend was more pronounced for
males than females. As discussed earlier, an increase in risk taking behaviour is one
possible factor increasing the likelihood of fatal Transport accidents of young adults
(particularly males). Death rates decreased through older age groups, and then
increased for those aged 65 years and over. The increase in death rates from Transport
accidents in older age groups was more pronounced for males.
TR A N S P O R T AC C I D E N T S
Age Specif ic Rates
(a) Accidents and Injury, includes V01-Y98.(b) Age Specific Rate, deaths per 100,000 persons.
5–9 15–19 25–29 35–39 45–49 55–59 65–69 75–79 85 andover
Age group (years)
rate(b)
0
100
200
300
400
500 MalesFemalesPersons
EXTERNAL CAUSES OF MORBID ITY AND MORTAL ITY (a) , AgeSpec i f i c Rates —1998–2002
15
Over 1998–2002, age specific death rates of External causes of death increased at the age
group of 15–19 years. Rates decreased through older age groups, and then increased for
those aged 70 years and over.
Males and females had similar trends of age specific rates of deaths from External causes.
In childhood, death rates from External causes were even between the sexes. From the
age group of 15–19 years, death rates for males increased more so than for females.
AL L EX T E R N A L CA U S E S
Age Specif ic Rates
A B S • DE A T H S FR O M EX T E R N A L CA U S E S • 3 3 2 0 . 0 • 1 9 9 8 T O 2 0 0 2 21
S E L E C T E D L E A D I N G E X T E R N A L C A U S E S O F D E A T H
During 1998–2002, Injuries to the head and thorax (chest region) and Injuries to
multiple body regions were the most common injuries causing death for Transport
accidents.
Where a car occupant was killed in an accident, Injuries to the head and Injuries to
multiple body regions were likely to be reported as associated causes of death. Those
injured in Pedestrian accidents and Air transport accidents were more likely to have
Injuries to multiple body regions as a cause of death than those injured in any other
Transport accidents. Pedal cyclists and those injured in Water transport accidents were
more likely to sustain Injuries to the head as a cause of death, compared with those
injured in other types of Transport accidents.
There was variation among age groups as to the types of injuries listed as a cause of
death for Transport accidents. Those aged 0–14 years were more likely to sustain Injuries
to the head as a cause of death in Transport accidents. Those aged 65 years and over
were more likely to sustain Injuries to the thorax and Injuries to multiple body regions
where there was a Transport accident causing death. A table containing types of
Transport accidents and nature of injuries causing death, by age group is included in the
Detailed tables, see page 27.
Nature of Injury
(a) Age Specific Rate, deaths per 100,000 persons.(b) Includes V01-V99.
5–9 15–19 25–29 35–39 45–49 55–59 65–69 75–79 85 andover
Age group (years)
rate(a)
0
5
10
15
20
25 Transport accidents(b) Pedestrian injured in transport accident Motorcycle rider injured in transport accident Car occupant injured in transport accident
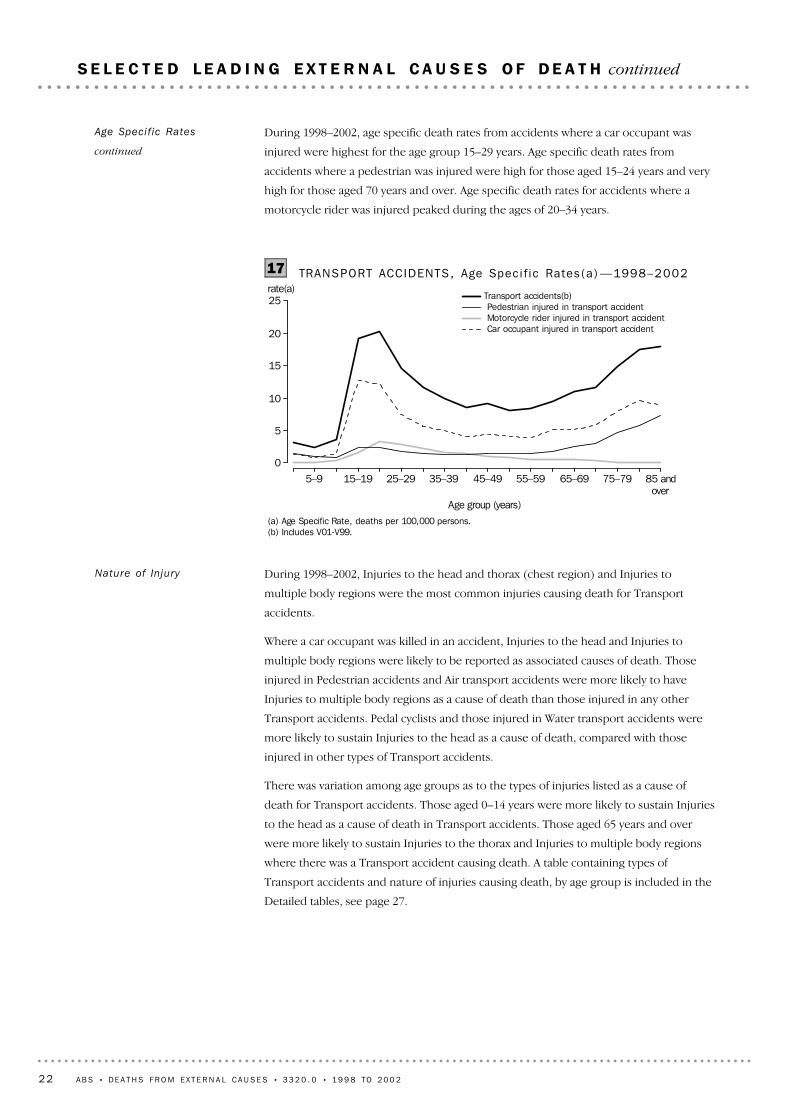
TRANSPORT ACCIDENTS, Age Spec i f i c Rates (a ) —1998–200217
During 1998–2002, age specific death rates from accidents where a car occupant was
injured were highest for the age group 15–29 years. Age specific death rates from
accidents where a pedestrian was injured were high for those aged 15–24 years and very
high for those aged 70 years and over. Age specific death rates for accidents where a
motorcycle rider was injured peaked during the ages of 20–34 years.
Age Specif ic Rates
continued
22 A B S • DE A T H S FR O M EX T E R N A L CA U S E S • 3 3 2 0 . 0 • 1 9 9 8 T O 2 0 0 2
S E L E C T E D L E A D I N G E X T E R N A L C A U S E S O F D E A T H continued

Over 1998–2002, age specific death rates from Assault were higher for those aged 0–4
years and 5–9 years than for those aged 10–14 years. Age specific rates then increased
and remained stable throughout older age groups.
Trends in age specific death rates for Intentional self-harm (suicide) were different
between the sexes. For females, the age specific death rate for suicide was highest in the
age group of 25–44 years.
For males, death rates from suicide were substantially higher for those aged 20–39 years
than for most other age groups. Age specific death rates were also very high for elderly
males. Of all males, those aged 85 years and over had the highest rate of death from
suicide in 1998–2002.
The NSW Health Department Centre for Mental Health (2000) stated, in its report on
suicides in NSW, that older people who attempted suicide were more likely to die than
younger people who attempted suicide. This report also noted that more older males
were more likely to make a non-fatal suicide attempt than older females. Conversely, for
younger age groups, females were more likely to make a non-fatal suicide attempt
resulting in hospitalisation than males (Helps, Cripps & Harrison, 2002).
I N T E N T I O N A L SE L F - HA R M
AN D AS S A U L T
Age Specif ic Rates
(a) Includes V00-V99.(b) This table contains numbers of deaths where the underlying cause of death was coded to the category Transport accidents, and
where a code for nature of injury was also recorded. There could be more than one nature of injury code recorded per death (forexample, Injuries to the head and Injuries to the thorax). Therefore, the sum of the components of Chapter XIX (nature of injury) willnot equal the total deaths for Chapter XIX. See paragraphs 2 and 3 of Explanatory Notes.
(c) Includes S00-T98.(d) Includes S10-S19, S30-S99, T08-T98.(e) Includes V10-V19, V30-V39, V50-V89, V98-V99.Note: There were 218 deaths registered where transport accident was identified as the underlying cause of death, but no cause was
recorded in Chapter XIX Injury, poisoning and certain other consequences of external cause.
4263773014081 118Other transport accidents(e)591612540233Air and space transport accidents
2207934244Water transport accidents1 7401 9991 2752 1105 101Car occupant injured in transport accident
3594242774211 076Motorcycle rider injured in transport accident606738109196Pedal cyclist injured in transport accident
4698243117231 737Pedestrian injured in transport accident
3 3333 8592 2363 8459 705Transport accidents(a)
no.no.no.no.no.
Other injuries,
poisoning and
consequences
of external
cause(d)
Injuries
to
multiple
body
regions
Thorax
injuries
Head
injuries
Chapter
XIX Injury,
poisoning
and other
consequences
of external
causes(c)(b)
TRANSPORT ACCIDENTS (a) , natu re of in ju r ies (b ) —al l persons —1998– 200218
A B S • DE A T H S FR O M EX T E R N A L CA U S E S • 3 3 2 0 . 0 • 1 9 9 8 T O 2 0 0 2 23
S E L E C T E D L E A D I N G E X T E R N A L C A U S E S O F D E A T H continued

Death rates from Falls were clearly highest for those aged 70 years and over. In
comparison, death rates from Falls were very low for those aged under 50 years.
AC C I D E N T A L FA L L S
Age Specif ic Rates
(a) Includes poisoning by motor vehicle gases.
11.51 41413.133411.11 080Other methods of Intentional
self-harm
1.82254.01031.2122Drowning and submersion9.81 2042.87111.61 133Firearm
43.35 32936.091845.24 411Hanging, strangulation and
suffocation
33.64 14044.01 12230.93 018Self poisoning(a)
100.012 312100.02 548100.09 764Intentional self-harm
%no.%no.%no.
PersonsFemalesMales
INTENT IONAL SELF- HARM, Method by sex —1998– 200220
The most common methods of suicide causing death were Hanging, strangulation and
suffocation and Self poisoning. Males were more likely than females to commit suicide by
Hanging, strangulation and suffocation and using Firearms, and females were more likely
to use Self poisoning.
Method of Suic ide
(a) Includes X60-X84.(b) Includes X85-Y09.(c) Age Specific Rate, deaths per 100,000 persons.
5–9 15–19 25–29 35–39 45–49 55–59 65–69 75–79 85 andover
Age group (years)
rate(c)
0
10
20
30
40 Intentional self-harm, MalesIntentional self-harm, FemalesAssault, MalesAssault, Females
INTENT IONAL SELF-HARM (a) AND ASSAULT (b) , Age Spec i f i c Rates (c ) —1998–200219
24 A B S • DE A T H S FR O M EX T E R N A L CA U S E S • 3 3 2 0 . 0 • 1 9 9 8 T O 2 0 0 2
S E L E C T E D L E A D I N G E X T E R N A L C A U S E S O F D E A T H continued

(a) This table contains numbers of deaths where the underlying cause of death was coded to the category Fall, and wherea code for nature of injury was also recorded. There could be more than one nature of injury code recorded per death(for example, Injuries to the head and Injuries to the hip and thigh). Therefore, the sum of the components of ChapterXIX (nature of injury) will not equal the total deaths for Chapter XIX. See paragraphs 2 and 3 of Explanatory Notes.
Note: There were 62 deaths registered where accidental fall was identified as the underlying cause of death, but there wasno cause listed in Chapter XIX Injury, poisoning and certain other consequences of external causes.
8.523511.02103.025Certain early complications of trauma16.645822.14234.235Injuries to the hip and thigh10.228010.019210.588Injuries to the thorax57.41 58052.61 00568.5575Injuries to the head
100.02 751100.01 912100.0839CHAPTER XIX Injury, poisoning and certain other
consequences of external causes
%no.%no.%no.
All Persons
65 years
and over0–64 years
FALLS, Nature of in ju r ies (se lec ted) (a ) —By age group —1998– 200222
Where a Fall was reported as the underlying cause of death, the most common injuries
reported as a cause of death were Injuries to the head. Of those aged under 65 years
who had a Fall as the underlying cause of death, 69% had Injuries to the head reported
as a cause of death, compared to 54% of those aged 65 years and over who died as the
result of a Fall. Of those aged 65 years and over who died as a result of a Fall, 22% had
Injuries to the hip and thigh reported as a cause of death compared to only 4% of those
aged under 65 years who died as a result of a Fall.
Nature of Injury from Fal l
(a) Includes W00-W19.(b) Age Specific Rate, deaths per 100,000 persons.
5–9 15–19 25–29 35–39 45–49 55–59 65–69 75–79 85 andover
Age group (years)
rate(b)
0
20
40
60
80 MalesFemalesPersons
FALLS (a) , Age Spec i f i c Rates (b ) —1998–200221Age Specif ic Rates
continued
A B S • DE A T H S FR O M EX T E R N A L CA U S E S • 3 3 2 0 . 0 • 1 9 9 8 T O 2 0 0 2 25
S E L E C T E D L E A D I N G E X T E R N A L C A U S E S O F D E A T H continued

324 External causes of death, 1998–2002, Age Specific Rates, Persons . . . . . .303 External causes of death, 1998–2002, Age Specific Rates, Females . . . . . .282 External causes of death, 1998–2002, Age Specific Rates, Males . . . . . . . .271 Transport accidents by age groups, injuries causing death . . . . . . . . . . .
DE T A I L E D TA B L E S
page
26 A B S • DE A T H S FR O M EX T E R N A L CA U S E S • 3 3 2 0 . 0 • 1 9 9 8 T O 2 0 0 2
L I S T O F T A B L E S

(d) Includes S10-S19, S30-S99, T08-T98.(e) Includes V10-V19, V30-V39, V50-V89, V98-V99.Note: There were 218 deaths registered where Transport accident was identified as
the underlying cause of death, but no cause was recorded in Chapter XIX Injury,poisoning and certain other consequences of external cause.
(a) Injuries listed on any part of the death record, thus there could be more thanone injury recorded for each death.
(b) Includes V00-V99.(c) Number of deaths where an injury causing death was reported. Includes
S00-T98.
391 1244713640726342143347Other Injury, poisoning and certain other consequences of external cause361 036339638692332072941Injuries involving multiple body regions23650277824429211291014Injuries to the thorax351 012247133597432705174Injuries to the head
1002 8671002921001 803100627100144
CHAPTER XIX Injury, poisoning and certain other consequences of external
causes(c)
O T H E R TR A N S P O R T AC C I D E N T S (e)
27469301413021920602349Other Injury, poisoning and certain other consequences of external cause478245023951380471402964Injuries involving multiple body regions183112097211561338920Injuries to the thorax4272336172362654613868148Injuries to the head
1001 737100477100740100301100218
CHAPTER XIX Injury, poisoning and certain other consequences of external
causes(c)
PE D E S T R I A N IN J U R E D IN A TR A N S P O R T AC C I D E N T
341 7403629135871325093169Other Injury, poisoning and certain other consequences of external cause391 99941334411 026375842454Injuries involving multiple body regions251 2753730225618203171738Injuries to the thorax412 11024195409845079063141Injuries to the head
1005 1011008071002 4871001 582100224
CHAPTER XIX Injury, poisoning and certain other consequences of external
causes(c)
CA R OC C U P A N T IN J U R E D IN A TR A N S P O R T AC C I D E N T
343 33336568361 8163178328165Other Injury, poisoning and certain other consequences of external
cause(d)
403 85942669422 0983793127159Injuries involving multiple body regions232 23630477241 203194841272Injuries to the thorax403 84528438371 846481 19862363Injuries to the head
1009 7051001 5761005 0301002 510100586
CHAPTER XIX Injury, poisoning and certain other consequences of external
causes(c)
A L L TR A N S P O R T AC C I D E N T S (b)
%no.%no.%no.%no.%no.
ALLPERSONS
65 YEARSAND OVER
25–64YEARS
15–24YEARS
0–14YEARS
TRANSPORT ACCIDENTS, In ju r ies caus ing death(a ) —By age group —1998– 20021
A B S • DE A T H S FR O M EX T E R N A L CA U S E S • 3 3 2 0 . 0 • 1 9 9 8 T O 2 0 0 2 27

(b) Age Specific Death Rates, deaths per 100,000 persons.(c) Accidents and Injury.(d) Surgical and other medical procedures as the cause of
abnormal reaction of the patient, or of later complication,without mention of misadventure at the time of theprocedure.
— nil or rounded to zero (including null cells)(a) Three external causes of death (with age specific rates of less
than 0.1) were not shown in this table. These were: Otherand unspecified transport accidents (V98-V99), Medicaldevices associated with adverse incidents in diagnostic andtherapeutic use (Y70-Y82) and Supplementary factors relatedto causes of morbidity and morality classified elsewhere(Y90-Y98).
0.60.50.50.30.30.10.1——Sequelae of external causes of morbidity and
mortality
0.60.50.50.30.30.10.1——Sequelae and supplementary factors of external
cause (Y85-Y98)
0.1——0.1—————Surgical and other medical procedures(d)—————————
Misadventures to patients during surgical andmedical care
0.1————————Drugs, medicaments and biological substances
causing adverse effects in therapeutic use
0.2——0.1—————Complications of medical and surgical care
(Y40-Y84)
0.10.10.20.20.10.1———Legal intervention and operations of war0.91.11.31.10.90.2——0.1Event of undetermined intent2.83.33.43.42.72.00.30.61.4Assault
28.831.935.034.929.914.60.9——Intentional self-harm32.536.440.039.633.616.81.30.61.6Other external causes of mortality (X60-Y36)
0.70.60.60.70.50.40.2—0.4Accidental exposure to other and unspecified
factors
0.1————————Overexertion, travel and privation8.010.513.714.510.83.00.20.10.2
Accidental poisoning by and exposure tonoxious substances
0.20.10.10.10.20.10.10.10.1Exposure to forces of nature0.10.1—0.1———0.1—Contact with venomous animals and plants—0.1———————Contact with heat and hot substances
0.70.50.50.50.50.30.10.30.5Exposure to smoke, fire and flames0.60.40.60.70.50.40.10.10.1
Exposure to electric current, radiation andextreme ambient air temperature andpressure
1.21.11.62.01.31.00.30.22.6Other accidental threats to breathing1.91.72.32.62.21.50.50.85.0Accidental drowning and submersion—0.10.10.10.20.1——0.1Exposure to animate mechanical forces
1.41.61.71.01.30.90.50.30.6Exposure to inanimate mechanical forces1.71.21.61.81.60.80.10.10.3Falls
16.418.022.824.219.18.52.22.09.8
Other external causes of accidental injury
(W00-X59)
0.40.60.60.40.40.1—0.1—Air and space transport accidents0.60.40.80.80.50.20.10.10.1Water transport accidents1.00.91.01.31.51.70.40.20.2Other land transport accidents—————0.1———Bus occupant injured in transport accident
0.80.71.00.60.30.10.10.1—Occupant of heavy transport vehicle injured in
transport accident
0.30.50.50.60.70.60.1——Occupant of pick-up truck or van injured in
transport accident
5.16.78.211.218.017.71.40.81.2Car occupant injured in transport accident———0.10.1————
Occupant of three-wheeled motor vehicleinjured in transport accident
2.73.13.95.65.83.00.60.1—Motorcycle rider injured in transport accident0.30.30.20.40.40.70.80.3—Pedal cyclist injured in transport accident1.91.82.52.93.83.71.11.21.8Pedestrian injured in transport accident
13.115.118.823.931.727.94.62.73.3Transport accidents (V01-V99)
62.870.082.188.184.753.38.15.414.7External causes of morbidity and mortality
(V01-Y98)(c)
rateraterateraterateraterateraterate
40–44
years
35–39
years
30–34
years
25–29
years
20–24
years
15–19
years
10–14
years
5–9
years
0–4
years
EXTERNAL CAUSES OF DEATH (a) , Age Spec i f i c Rates (b ) —Males —1998– 20022
28 A B S • DE A T H S FR O M EX T E R N A L CA U S E S • 3 3 2 0 . 0 • 1 9 9 8 T O 2 0 0 2
(b) Age Specific Death Rates, deaths per 100,000 persons.(c) Accidents and Injury.(d) Surgical and other medical procedures as the cause of
abnormal reaction of the patient, or of later complication,without mention of misadventure at the time of the procedure.
— nil or rounded to zero (including null cells)(a) Three external causes of death (with age specific rates of less
than 0.1) were not shown in this table. These were: Other andunspecified transport accidents (V98-V99), Medical devicesassociated with adverse incidents in diagnostic and therapeuticuse (Y70-Y82) and Supplementary factors related to causes ofmorbidity and morality classified elsewhere (Y90-Y98).
7.03.52.02.11.91.30.90.61.2Sequelae of external causes of morbidity and
mortality
7.03.52.02.11.91.30.90.61.2
Sequelae and supplementary factors of external
cause (Y85-Y98)
10.67.22.02.82.00.60.40.20.1Surgical and other medical procedures(d)0.30.2—0.1———0.1—
Misadventures to patients during surgical andmedical care
1.50.81.10.60.30.3——0.1Drugs, medicaments and biological substances
causing adverse effects in therapeutic use
12.48.63.13.52.30.90.50.30.1
Complications of medical and surgical care
(Y40-Y84)
——————0.1——Legal intervention and operations of war0.80.30.20.30.20.40.20.40.5Event of undetermined intent1.00.80.21.11.41.92.02.02.4Assault
36.626.621.920.420.118.118.622.624.4Intentional self-harm38.427.722.321.821.720.520.825.027.3Other external causes of mortality (X60-Y36)
216.556.820.96.42.61.30.91.00.5Accidental exposure to other and unspecified
factors
0.50.20.10.20.1————Overexertion, travel and privation5.42.72.01.91.92.12.13.65.1
Accidental poisoning by and exposure tonoxious substances
3.11.70.50.40.50.10.20.20.1Exposure to forces of nature—0.20.1—0.1——0.10.1Contact with venomous animals and plants
2.10.30.20.10.2—0.1—0.1Contact with heat and hot substances4.43.02.21.20.70.60.40.90.7Exposure to smoke, fire and flames—0.20.10.30.10.40.40.40.3
Exposure to electric current, radiation andextreme ambient air temperature andpressure
19.18.94.02.01.50.90.90.91.1Other accidental threats to breathing3.12.43.32.11.31.42.02.31.4Accidental drowning and submersion0.30.20.40.10.2———0.1Exposure to animate mechanical forces2.31.30.91.01.31.61.92.01.5Exposure to inanimate mechanical forces
88.025.715.810.15.35.23.22.82.2Falls344.7103.650.425.716.013.912.414.213.3
Other external causes of accidental injury
(W00-X59)
——0.40.60.70.61.00.70.9Air and space transport accidents0.30.50.20.50.80.60.70.70.5Water transport accidents2.32.71.91.92.21.61.60.71.0Other land transport accidents——0.20.20.1—0.1——Bus occupant injured in transport accident——0.10.10.10.30.30.50.8
Occupant of heavy transport vehicle injured intransport accident
0.30.30.30.30.60.30.30.30.4Occupant of pick-up truck or van injured in
transport accident
14.713.810.46.76.35.54.34.85.9Car occupant injured in transport accident0.3———0.1———0.1
Occupant of three-wheeled motor vehicleinjured in transport accident
—0.30.20.60.70.60.91.21.7Motorcycle rider injured in transport accident0.50.20.50.60.40.30.40.30.3Pedal cyclist injured in transport accident
13.48.46.23.33.42.41.92.12.2Pedestrian injured in transport accident31.726.220.214.915.412.411.411.313.9Transport accidents (V01-V99)
434.2169.698.068.157.249.046.051.455.9External causes of morbidity and mortality
(V01-Y98)(c)
rateraterateraterateraterateraterate
85 years
and over
80–84
years
75–79
years
70–74
years
65–69
years
60–64
years
55–59
years
50–54
years
45–49
years
EXTERNAL CAUSES OF DEATH (a) , Age Spec i f i c Rates (b ) —Males —1998– 2002 co n t i n u e d2
A B S • DE A T H S FR O M EX T E R N A L CA U S E S • 3 3 2 0 . 0 • 1 9 9 8 T O 2 0 0 2 29
(b) Age Specific Death Rates, deaths per 100,000 persons.(c) Accidents and Injury.(d) Surgical and medical procedures as the cause of abnormal reaction of
the patient, or of later complication, without mention of misadventure atthe time of the procedure.
— nil or rounded to zero (including null cells)(a) Three external causes of death (with age specific rates of less than 0.1)
were not shown in this table. These were: Other and unspecifiedtransport accidents (V98-V99), Medical devices associated with adverseincidents in diagnostic and therapeutic use (Y70-Y82) andSupplementary factors related to causes of morbidity and moralityclassified elsewhere (Y90-Y98).
0.20.20.20.10.10.1———Sequelae of external causes of morbidity and mortality0.20.20.20.10.10.1———Sequelae and supplementary factors of external cause (Y85-Y98)
0.10.10.1——————Surgical and other medical procedures(d)0.1————————Misadventures to patients during surgical and medical care0.10.10.1——————
Drugs, medicaments and biological substances causing adverseeffects in therapeutic use
0.20.20.10.10.1———0.1Complications of medical and surgical care (Y40-Y84)
—————————Legal intervention and operations of war0.50.40.40.50.30.2———Event of undetermined intent1.21.71.91.72.01.10.20.31.2Assault8.48.17.67.46.04.80.5——Intentional self-harm
10.110.29.99.68.46.10.80.31.2Other external causes of mortality (X60-Y36)
0.30.40.20.20.20.20.10.20.3Accidental exposure to other and unspecified factors—————————Overexertion, travel and privation
4.43.43.53.43.31.70.10.10.2Accidental poisoning by and exposure to noxious substances—————————Exposure to forces of nature—————————Contact with venomous animals and plants—————————Contact with heat and hot substances
0.30.20.20.10.10.20.10.10.6Exposure to smoke, fire and flames————0.1————
Exposure to electric current, radiation and extreme ambient airtemperature and pressure
0.20.20.30.30.30.20.10.11.5Other accidental threats to breathing0.40.30.40.40.30.40.20.32.5Accidental drowning and submersion——————0.1—0.1Exposure to animate mechanical forces
0.20.20.10.10.10.20.1—0.3Exposure to inanimate mechanical forces0.30.30.20.20.40.20.10.20.2Falls6.25.04.94.84.73.01.01.05.8Other external causes of accidental injury (W00-X59)
0.10.10.10.2—0.1———Air and space transport accidents0.1——0.10.10.1———Water transport accidents0.20.30.30.40.71.00.30.20.2Other land transport accidents—————————Bus occupant injured in transport accident—0.1—0.1———0.1—Occupant of heavy transport vehicle injured in transport accident
0.10.1—0.10.20.10.1——Occupant of pick-up truck or van injured in transport accident2.93.23.13.75.97.51.30.81.4Car occupant injured in transport accident—————————
Occupant of three-wheeled motor vehicle injured in transportaccident
0.20.10.20.20.60.20.1——Motorcycle rider injured in transport accident0.10.1—0.10.10.1———Pedal cyclist injured in transport accident0.60.80.60.50.90.80.60.81.3Pedestrian injured in transport accident4.24.84.45.38.59.92.41.92.9Transport accidents (V01-V99)
20.920.419.519.921.719.04.23.310.0External causes of morbidity and mortality (V01-Y98)(c)
rateraterateraterateraterateraterate
40–44
years
35–39
years
30–34
years
25–29
years
20–24
years
15–19
years
10–14
years
5–9
years
0–4
years
EXTERNAL CAUSES OF DEATH (a) , Age Spec i f i c Rates (b ) —Females —1998– 20023
30 A B S • DE A T H S FR O M EX T E R N A L CA U S E S • 3 3 2 0 . 0 • 1 9 9 8 T O 2 0 0 2

(b) Age Specific Death Rates, deaths per 100,000 persons.(c) Accidents and Injury.(d) Surgical and medical procedures as the cause of abnormal reaction of the
patient, or of later complication, without mention of misadventure at thetime of the procedure.
— nil or rounded to zero (including null cells)(a) Three external causes of death (with age specific rates of less than 0.1)
were not shown in this table. These were: Other and unspecified transportaccidents (V98-V99), Medical devices associated with adverse incidents indiagnostic and therapeutic use (Y70-Y82) and Supplementary factorsrelated to causes of morbidity and morality classified elsewhere(Y90-Y98).
6.22.20.60.50.60.50.20.20.1Sequelae of external causes of morbidity and mortality6.22.20.60.50.60.50.20.20.1Sequelae and supplementary factors of external cause (Y85-Y98)
7.24.51.91.31.40.60.30.20.1Surgical and other medical procedures(d)—0.10.10.10.1——0.1—Misadventures to patients during surgical and medical care
2.41.90.71.00.30.2——0.1Drugs, medicaments and biological substances causing adverse
effects in therapeutic use
9.76.62.82.41.90.70.40.30.3Complications of medical and surgical care (Y40-Y84)
—————————Legal intervention and operations of war0.6—0.30.40.20.40.20.40.4Event of undetermined intent0.21.10.60.80.80.80.60.90.9Assault5.16.14.55.34.95.46.06.86.6Intentional self-harm5.97.25.56.56.06.66.88.18.0Other external causes of mortality (X60-Y36)
205.050.416.75.31.40.80.30.30.2Accidental exposure to other and unspecified factors0.7—0.10.10.10.2———Overexertion, travel and privation3.02.01.31.61.92.02.42.63.3Accidental poisoning by and exposure to noxious substances1.70.90.70.20.2—0.1——Exposure to forces of nature—0.3—0.1—————Contact with venomous animals and plants
0.80.80.10.2—0.1———Contact with heat and hot substances2.51.50.91.00.30.50.30.40.3Exposure to smoke, fire and flames—0.1——0.10.1———
Exposure to electric current, radiation and extreme ambient airtemperature and pressure
10.84.32.11.40.90.70.50.40.3Other accidental threats to breathing0.50.31.60.50.40.80.50.70.7Accidental drowning and submersion0.10.1—0.1—0.1———Exposure to animate mechanical forces0.60.50.30.20.10.10.10.10.1Exposure to inanimate mechanical forces
62.123.39.46.32.91.91.40.60.7Falls287.884.633.117.08.37.25.85.25.7Other external causes of accidental injury (W00-X59)
———0.10.20.10.10.10.2Air and space transport accidents————0.10.1—0.1—Water transport accidents
0.80.60.60.80.30.30.40.30.2Other land transport accidents0.10.10.1——0.1—0.1—Bus occupant injured in transport accident—————————Occupant of heavy transport vehicle injured in transport accident——0.20.10.20.20.1—0.1Occupant of pick-up truck or van injured in transport accident
6.37.16.25.04.04.63.33.42.8Car occupant injured in transport accident—0.1———————
Occupant of three-wheeled motor vehicle injured in transportaccident
————0.10.1—0.10.2Motorcycle rider injured in transport accident0.1—0.1—0.10.1—0.1—Pedal cyclist injured in transport accident4.64.23.52.81.61.31.10.70.7Pedestrian injured in transport accident
11.912.110.78.76.56.65.24.84.3Transport accidents (V01-V99)
321.4112.752.835.223.321.518.318.618.3External causes of morbidity and mortality (V01-Y98)(c)
rateraterateraterateraterateraterate
85 years
and over
80–84
years
75–79
years
70–74
years
65–69
years
60–64
years
55–59
years
50–54
years
45–49
years
EXTERNAL CAUSES OF DEATH (a) , Age Spec i f i c Rates (b ) —Females —1998– 2002 co n t i n u e d3
A B S • DE A T H S FR O M EX T E R N A L CA U S E S • 3 3 2 0 . 0 • 1 9 9 8 T O 2 0 0 2 31

(b) Age Specific Death Rates, deaths per 100,000 persons.(c) Accidents and Injury.(d) Surgical and other medical procedures as the cause of
abnormal reaction of the patient, or of later complication,without mention of misadventure at the time of theprocedure.
— nil or rounded to zero (including null cells)(a) Three external causes of death (with age specific rates of less
than 0.1) were not shown in this table. These were: Otherand unspecified transport accidents (V98-V99), Medicaldevices associated with adverse incidents in diagnostic andtherapeutic use (Y70-Y82) and Supplementary factors relatedto causes of morbidity and morality classified elsewhere(Y90-Y98).
0.40.30.30.20.20.1———Sequelae of external causes of morbidity and
mortality
0.40.30.30.20.20.1———Sequelae and supplementary factors of external
cause (Y85-Y98)
0.1—0.10.1—————Surgical and other medical procedures(d)—————————
Misadventures to patients during surgical andmedical care
0.10.1———————Drugs, medicaments and biological substances
causing adverse effects in therapeutic use
0.20.10.10.1—————Complications of medical and surgical care
(Y40-Y84)
——0.10.10.1————Legal intervention and operations of war0.70.70.90.80.60.2——0.1Event of undetermined intent2.02.52.62.52.31.50.30.41.3Assault
18.519.921.221.118.19.80.7——Intentional self-harm21.223.224.824.521.211.61.00.51.4Other external causes of mortality (X60-Y36)
0.50.50.40.50.30.30.10.10.3Accidental exposure to other and unspecified
factors
—————————Overexertion, travel and privation6.26.98.68.97.12.40.10.10.2
Accidental poisoning by and exposure tonoxious substances
0.10.10.10.10.1—0.1——Exposure to forces of nature—————————Contact with venomous animals and plants—————————Contact with heat and hot substances
0.50.40.40.30.30.20.10.20.5Exposure to smoke, fire and flames0.30.20.30.40.30.20.1—0.1
Exposure to electric current, radiation andextreme ambient air temperature andpressure
0.70.70.91.20.80.60.20.22.1Other accidental threats to breathing1.11.01.41.51.31.00.40.53.8Accidental drowning and submersion—0.1—0.10.10.1——0.1Exposure to animate mechanical forces
0.80.90.90.60.70.50.30.20.4Exposure to inanimate mechanical forces1.00.70.91.01.00.50.10.10.2Falls
11.311.513.814.512.05.81.61.57.9
Other external causes of accidental injury
(W00-X59)
0.30.40.30.30.20.1———Air and space transport accidents0.30.20.40.40.30.20.10.1—Water transport accidents0.60.60.70.81.11.30.30.20.2Other land transport accidents—————0.1———Bus occupant injured in transport accident
0.40.40.50.30.20.1—0.1—Occupant of heavy transport vehicle injured in
transport accident
0.20.30.30.30.40.30.1——Occupant of pick-up truck or van injured in
transport accident
4.04.95.67.412.112.71.40.81.3Car occupant injured in transport accident————0.1————
Occupant of three-wheeled motor vehicleinjured in transport accident
1.41.62.12.93.31.60.3——Motorcycle rider injured in transport accident0.20.20.10.20.30.40.40.1—Pedal cyclist injured in transport accident1.31.31.51.72.42.30.81.01.5Pedestrian injured in transport accident8.69.911.614.520.319.13.52.33.1Transport accidents (V01-V98)
41.745.150.653.953.736.56.24.312.4External causes of morbidity and mortality
(V01-Y98)(c)
rateraterateraterateraterateraterate
40–44
years
35–39
years
30–34
years
25–29
years
20–24
years
15–19
years
10–14
years
5–9
years
0–4
years
EXTERNAL CAUSES OF DEATH (a) , Age Spec i f i c Rates (b ) —Persons —1998– 20024
32 A B S • DE A T H S FR O M EX T E R N A L CA U S E S • 3 3 2 0 . 0 • 1 9 9 8 T O 2 0 0 2
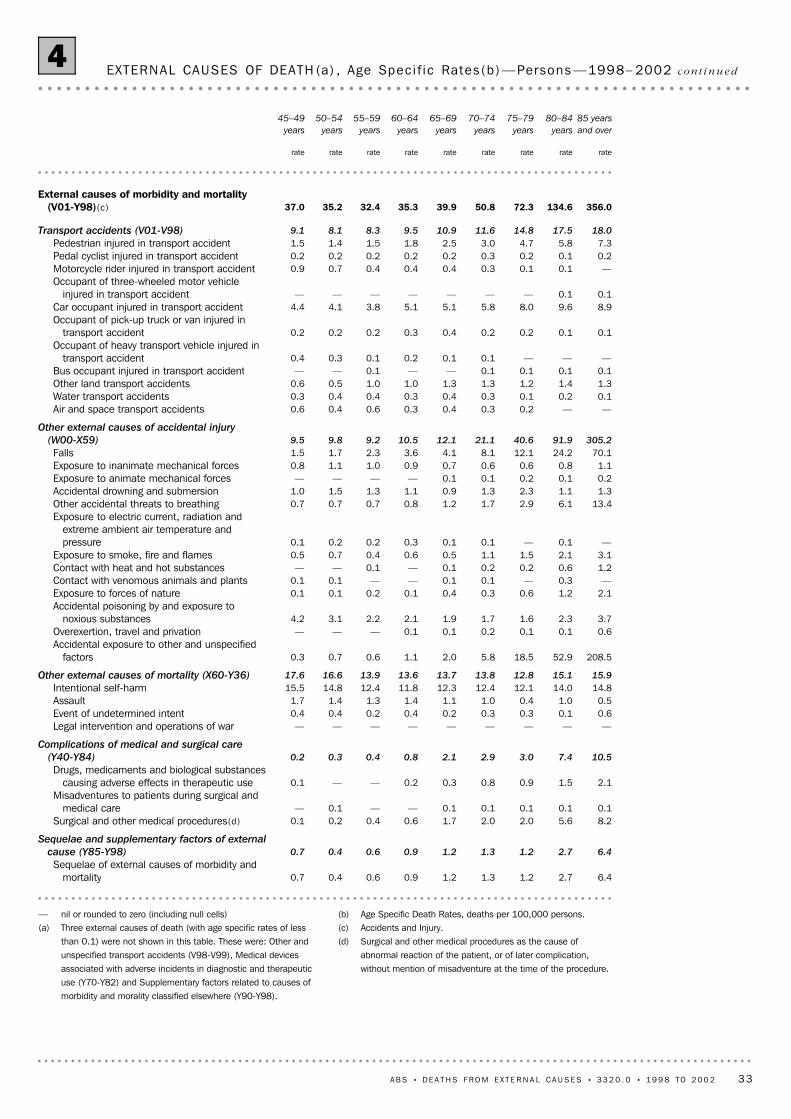
(b) Age Specific Death Rates, deaths per 100,000 persons.(c) Accidents and Injury.(d) Surgical and other medical procedures as the cause of
abnormal reaction of the patient, or of later complication,without mention of misadventure at the time of the procedure.
— nil or rounded to zero (including null cells)(a) Three external causes of death (with age specific rates of less
than 0.1) were not shown in this table. These were: Other andunspecified transport accidents (V98-V99), Medical devicesassociated with adverse incidents in diagnostic and therapeuticuse (Y70-Y82) and Supplementary factors related to causes ofmorbidity and morality classified elsewhere (Y90-Y98).
6.42.71.21.31.20.90.60.40.7Sequelae of external causes of morbidity and
mortality
6.42.71.21.31.20.90.60.40.7
Sequelae and supplementary factors of external
cause (Y85-Y98)
8.25.62.02.01.70.60.40.20.1Surgical and other medical procedures(d)0.10.10.10.10.1——0.1—
Misadventures to patients during surgical andmedical care
2.11.50.90.80.30.2——0.1Drugs, medicaments and biological substances
causing adverse effects in therapeutic use
10.57.43.02.92.10.80.40.30.2
Complications of medical and surgical care
(Y40-Y84)
—————————Legal intervention and operations of war0.60.10.30.30.20.40.20.40.4Event of undetermined intent0.51.00.41.01.11.41.31.41.7Assault
14.814.012.112.412.311.812.414.815.5Intentional self-harm15.915.112.813.813.713.613.916.617.6Other external causes of mortality (X60-Y36)
208.552.918.55.82.01.10.60.70.3Accidental exposure to other and unspecified
factors
0.60.10.10.20.10.1———Overexertion, travel and privation3.72.31.61.71.92.12.23.14.2
Accidental poisoning by and exposure tonoxious substances
2.11.20.60.30.40.10.20.10.1Exposure to forces of nature—0.3—0.10.1——0.10.1Contact with venomous animals and plants
1.20.60.20.20.1—0.1——Contact with heat and hot substances3.12.11.51.10.50.60.40.70.5Exposure to smoke, fire and flames—0.1—0.10.10.30.20.20.1
Exposure to electric current, radiation andextreme ambient air temperature andpressure
13.46.12.91.71.20.80.70.70.7Other accidental threats to breathing1.31.12.31.30.91.11.31.51.0Accidental drowning and submersion0.20.10.20.10.1————Exposure to animate mechanical forces1.10.80.60.60.70.91.01.10.8Exposure to inanimate mechanical forces
70.124.212.18.14.13.62.31.71.5Falls305.291.940.621.112.110.59.29.89.5
Other external causes of accidental injury
(W00-X59)
——0.20.30.40.30.60.40.6Air and space transport accidents0.10.20.10.30.40.30.40.40.3Water transport accidents1.31.41.21.31.31.01.00.50.6Other land transport accidents0.10.10.10.1——0.1——Bus occupant injured in transport accident———0.10.10.20.10.30.4
Occupant of heavy transport vehicle injured intransport accident
0.10.10.20.20.40.30.20.20.2Occupant of pick-up truck or van injured in
transport accident
8.99.68.05.85.15.13.84.14.4Car occupant injured in transport accident0.10.1———————
Occupant of three-wheeled motor vehicleinjured in transport accident
—0.10.10.30.40.40.40.70.9Motorcycle rider injured in transport accident0.20.10.20.30.20.20.20.20.2Pedal cyclist injured in transport accident7.35.84.73.02.51.81.51.41.5Pedestrian injured in transport accident
18.017.514.811.610.99.58.38.19.1Transport accidents (V01-V98)
356.0134.672.350.839.935.332.435.237.0External causes of morbidity and mortality
(V01-Y98)(c)
rateraterateraterateraterateraterate
85 years
and over
80–84
years
75–79
years
70–74
years
65–69
years
60–64
years
55–59
years
50–54
years
45–49
years
EXTERNAL CAUSES OF DEATH (a) , Age Spec i f i c Rates (b ) —Persons —1998– 2002 co n t i n u e d4
A B S • DE A T H S FR O M EX T E R N A L CA U S E S • 3 3 2 0 . 0 • 1 9 9 8 T O 2 0 0 2 33

1 The data used in this publication are made available to the ABS from the Registrar of
Births, Deaths and Marriages in each state and territory. The ABS compiles the data and
codes the causes of death to the International Statistical Classification of Diseases and
Related Health Problems, Tenth Revision (ICD-10).
2 The ICD-10 prescribes that when a death is attributed to an External cause, the event
leading to the death should be assigned a code from Chapter XX, External causes of
morbidity and mortality (V01-Y98) (see below) as well as a code to indicate the nature of
the resulting condition. Most often, the condition is classifiable to Chapter XIX of
ICD-10, Injury, poisoning and certain other consequences of External causes (S00-T98).
3 If the External cause was determined to be the underlying cause of death (or the
main cause of death), the resulting condition or injury is listed as an associated cause of
death. For example, if a patient dies of head injuries resulting from a car accident, the
underlying cause of death is coded to Chapter XX, External causes of morbidity and
mortality (Transport Accident). The resulting condition (head injuries) is coded from
Chapter XIX Injury, poisoning and certain other consequences of External causes, as an
associated cause of death. There may be more than one resulting injury from the
External cause.
4 Accidental Poisoning as reported in the section Trends over the last 30 years
included the codes of Accidental poisoning by and exposure to noxious substances
(X40-X49), Event of undetermined intent (Y10-Y19) and drugs, medicaments and
biological substances causing adverse effects in therapeutic use (Y40-Y59). In all other
sections of this report, Accidental Poisoning by and Exposure to noxious substances
(X40-X49) was reported alone.
5 Other accidental threats to breathing (W75-W84) includes the following causes:
Accidental suffocation and strangulation in bed, Other accidental hanging and
strangulation, Threat to breathing due to cave-in, falling earth and other substances,
Inhalation of gastric contents, Inhalation and ingestion of food causing obstruction of
respiratory tract, Inhalation and ingestion of other objects causing obstruction of
respiratory tract, Confined to or trapped in a low-oxygen environment, Other specified
threats to breathing and Unspecified threat to breathing.
6 The table below displays ICD-10 codes for Chapter XX, External causes of morbidity
and mortality (V01-Y98).
EX P L A N A T O R Y NO T E S
34 A B S • DE A T H S FR O M EX T E R N A L CA U S E S • 3 3 2 0 . 0 • 1 9 9 8 T O 2 0 0 2
E X P L A N A T O R Y N O T E S

7 All age standardised death rates in this publication have been calculated using the
2001 Estimated Resident Population for Australia (persons) as the standard population.
Y90-Y98Supplementary factors related to causes of morbidity and mortality
classified elsewhere
Y85-Y89Sequelae of external causes of morbidity and mortalityY85-Y98Sequelae and supplementary factors of external causeY83-Y84
Surgical and other medical procedures as the cause of abnormalreaction of the patient, or of later complication, without mention ofmisadventure at the time of the procedure
Y70-Y82Medical devices associated with adverse incidents in diagnostic and
therapeutic use
Y60-Y69Misadventures to patients during surgical and medical careY40-Y59
Drugs, medicaments and biological substances causing adverse effectsin therapeutic use
Y40-Y84Complications of medical and surgical careY35-Y36Legal intervention and operations of warY10-Y34Event of undetermined intentX85-Y09AssaultX60-X84Intentional self-harmX60-Y36Other external causes of mortalityX58-X59Accidental exposure to other and unspecified factorsX50-X57Overexertion, travel and privationX40-X49Accidental poisoning by and exposure to noxious substancesX30-X39Exposure to forces of natureX20-X29Contact with venomous animals and plantsX10-X19Contact with heat and hot substancesX00-X09Exposure to smoke, fire and flames
W85-W99Exposure to electric current, radiation and extreme ambient air
temperature and pressure
W75-W84Other accidental threats to breathingW65-W74Accidental drowning and submersionW50-W64Exposure to animate mechanical forcesW20-W49Exposure to inanimate mechanical forcesW00-W19FallsW00-X59Other external causes of accidental injuryV98-V99Other and unspecified transport accidentsV95-V97Air and space transport accidentsV90-V94Water transport accidentsV80-V89Other land transport accidentsV70-V79Bus occupant injured in transport accidentV60-V69Occupant of heavy transport vehicle injured in transport accidentV50-V59Occupant of pick-up truck or van injured in transport accidentV40-V49Car occupant injured in transport accidentV30-V39Occupant of three-wheeled motor vehicle injured in transport accidentV20-V29Motorcycle rider injured in transport accidentV10-V19Pedal cyclist injured in transport accidentV01-V09Pedestrian injured in transport accidentV01-V99Transport accidents
V01-Y98CHAPTER XX External causes of morbidity and mortality
ICD-10
codeEx t e r na l Cause s of Dea th desc r i p t i o n
EXTERNAL CAUSES OF DEATH DESCRIPT ION AND ICD– 10 CODEEX P L A N A T O R Y NO T E S continued
A B S • DE A T H S FR O M EX T E R N A L CA U S E S • 3 3 2 0 . 0 • 1 9 9 8 T O 2 0 0 2 35
E X P L A N A T O R Y N O T E S continued
The cause which is deemed to have started the morbid train of events which has led todeath. There must always be an underlying cause. If only one cause is listed above theline on the death certificate then this will be the underlying cause.
Underlying cause of death
The remoteness classification used in this publication is the Australian StandardGeographical Classification (ASGC) 2001 Remoteness structure which is based on theAccessibility/Remoteness Index of Australia (ARIA) in which remoteness is defined on thebasis of road distance from any point to the nearest town.
Remoteness
The ratio of the actual number of deaths in the population under study and the numberof deaths which would have occurred if the population under study had experienced theage-specific death rates of the standard population (see also standardised death rate, theindirect method).
Standardised mortality ratio(SMR)
Standardised death rates enable the comparison of death rates between populations withdifferent age structures by relating them to a standard population. The ABS standardpopulations relate to the years ending in 1 (e.g. 2001). The current standard populationis all persons in the 2001 Australian population. All Age Standardised Death Rates in thispublication have been calculated using the 2001 Estimate Resident Population forAustralia (Persons) as the standard population. They are expressed per 100,000 persons.There are two methods of calculating standardised death rates:! The direct method — this is used when the populations under study are large and the
age-specific death rates are reliable. It is the overall death rate that would haveprevailed in the standard population if it had experienced at each age the death ratesof the population under study; and
! The indirect method — this is used when the populations under study are small andthe age-specific death rates are unreliable or not known. It is an adjustment to thecrude death rate of the standard population to account for the variation between theactual number of deaths in the population under study and the number of deathswhich would have occurred if the population under study had experienced theage-specific death rates of the standard population.
Standardised death rate
All causes listed on the death certificate (either above or below the line), including,therefore, both the underlying cause as well as all associated causes. For example,Diabetes as a multiple cause would refer to all instances in which Diabetes is listedsomewhere on the death certificate.
Multiple cause of death
The crude death rate is the average number of deaths (registered per year over the5-year-period 1998–2002) per 100,000 estimated resident population at 30 June 2000.
Crude death rate
Any cause listed on the death certificate other than the underlying cause. Each deathrecord may have many associated causes which may have contributed to the death butwere not judged to be the underlying cause of death. Nature of injury codes, pre-existingconditions and manifestations of complications of surgery are examples of causes whichmay be recorded as associated causes of death.
Associated cause of death
Age-specific death rates within this publication are the average number of registereddeaths per year over the 5-year-period (1998–2002) at a specified age per 100,000 of theestimated resident population of the same age, at the mid-point of the year 2000 (whichis the mid-point of the 5-year-period 1998–2002).
Age specific death rate
36 A B S • DE A T H S FR O M EX T E R N A L CA U S E S • 3 3 2 0 . 0 • 1 9 9 8 T O 2 0 0 2
G L O S S A R Y

Australian Bureau of Statistics (ABS), 2001, Australian Standard Geographical
Classification (ASGC), cat. no. 1216.0, ABS, Canberra.
Australian Bureau of Statistics (ABS), 2002, Deaths, Australia 2002, cat. no. 3302.0,
Canberra.
Australian Bureau of Statistics (ABS) and Australian Institute of Health and Welfare
(AIHW), 2003, The Health and Welfare of Australia's Aboriginal and Torres
Strait Islander Peoples. ABS cat. no. 4704.0, AIHW Cat. No. IHW11, ABS,
Canberra.
Australian Institute of Health and Welfare (AIHW), 2003, Australian long term trends
in mortality workbooks, AIHW, Canberra.
AIHW, 1998, Health in Rural and Remote Australia. Canberra: AIHW.
AIHW, 2003, Rural, regional and remote health: a study on mortality.
AIHW Cat. No. PHE 45.Canberra: AIHW (Rural Health Series no. 2).
AIHW & Department of Health and Family Services (DHFS) 1997, First report on
National Health Priority Areas 1996, Canberra: AIHW & DHFS.
AIHW & DHFS, 1998, National Health Priority Areas Report, Injury Prevention and
Control, Canberra: AIHW & DHFS.
Coory M, 2003, Can a mortality excess in remote areas of Australia be explained by
Indigenous status? A case study using neonatal mortality in Queensland,
Australian and New Zealand Journal of Public Health 27(4): pp.425–427.
Department of Health and Aging, 2002, Online, An overview of the National Health
Priority Areas Initiative,
http://www.health.gov.au/pq/nhpa/index.htm#overview. Last modified
30 September 2002, Accessed 10/9/2003.
Evans, J & Batini, C, 2000, Online, Community Attitude Monitor, Office of Road Safety,
Western Australia,
http://www.officeofroadsafety.wa.gov.au/Research/community_attitude_monitor
/index.html. Accessed 10/12/2003.
Faddy, S, 2001, Drowning and near-drowning - the physiology and pathology,
Australian Journal of Medical Science, 22(1): pp.4–13.
Glover, J, Harris, K, Tennant, S, 1999, A Social Health Atlas of Australia (second edition).
Public Health Information Development Unit, University of Adelaide, South
Australia.
Helps, Y, Cripps, R & Harrison, J, 2002, Hospital separations due to injury and
poisoning, Australia 1999–2000, Canberra: AIHW.
Jolly, D, Moller, J, & Volkmer, R, 1993, The socio-economic context of child injury in
Australia. Journal of Paediatric Child Health, 29, pp.438–444.
Mathers, C, 1994, Health differentials among adult Australians aged 25–64 years, AGPS:
Canberra.
Mitchell-Taverner, P, Zipparo, L, & Goldsworth, J, 2003, Survey on Speeding and
Enforcement, Australian Transport Safety Bureau, Consultants Report Series.
Canberra: Australian Transport Safety Bureau.
National Public Health Partnership Group, 2001, National Injury Prevention Plan.
Priorities for 2001–2003. Canberra: AGPS
The NSW Health Department Centre for Mental Health, 2000, Suicide in NSW: We Need
to Know More. The NSW Suicide data report, Sydney.
A B S • DE A T H S FR O M EX T E R N A L CA U S E S • 3 3 2 0 . 0 • 1 9 9 8 T O 2 0 0 2 37
B I B L I O G R A P H Y
National Health and Medical Research Council, 1996, Unintentional injury in young
males 15 to 29 years, Canberra: AGPS.
NSW Child Death Review Team, 2002, 2001-2002 Report. NSW Commission for Children
and Young People, Sydney.
Page, A, Morrell, S & Taylor, R, 2002, Suicide differentials in Australian males and
females by various measures of socio-economic status, 1994–1998, Australian
and New Zealand Journal of Public Health 26 (4), pp.318–324.
Plueckhahn, V, 1984, Australian Alcohol/Drug Review, 3(2): pp.93–97.
Turner, C & McClure, R 2003, Age and Gender differences in risk- taking behaviour as
an explanation for high incidence of motor vehicle crashes as a driver in
young males, Injury Control and Safety Promotion 10 (3), pp.123–130.
38 A B S • DE A T H S FR O M EX T E R N A L CA U S E S • 3 3 2 0 . 0 • 1 9 9 8 T O 2 0 0 2
B I B L I O G R A P H Y continued


Subscription Services, ABS, GPO Box 2796Y, Melbourne Vic 3001
POST
03 9615 7848FAX
1300 366 323PHONE
ABS subscription services provide regular, convenient andprompt deliveries of ABS publications and products as theyare released. Email delivery of monthly and quarterlypublications is available.
W H Y N O T S U B S C R I B E ?
Client Services, ABS, GPO Box 796, Sydney NSW 2001POST
1300 135 211FAX
1300 135 070PHONE
Data already published that can be provided within fiveminutes will be free of charge. Our information consultantscan also help you to access the full range of ABSinformation—ABS user pays services can be tailored toyour needs, time frame and budget. Publications may bepurchased. Specialists are on hand to help you withanalytical or methodological advice.
I N F O R M A T I O N S E R V I C E
For the latest figures for National Accounts, Balance ofPayments, Labour Force, Average Weekly Earnings,Estimated Resident Population and the Consumer PriceIndex call 1900 986 400 (call cost 77c per minute).
DIAL-A-STATISTIC
For current and historical Consumer Price Index data, call1902 981 074 (call cost 77c per minute).
CPI INFOLINE
A range of ABS publications is available from public andtertiary libraries Australia-wide. Contact your nearest libraryto determine whether it has the ABS statistics you require,or visit our web site for a list of libraries.
LIBRARY
www.abs.gov.au the ABS web site is the best place tostart for access to summary data from our latestpublications, information about the ABS, advice aboutupcoming releases, our catalogue, and Australia Now—astatistical profile.
INTERNET
F O R M O R E I N F O R M A T I O N . . .
© Commonwealth of Australia 2004Produced by the Australian Bureau of Statistics
ISBN 0 642 47916 X2332000001977
RRP $23.00
33
20
.0
•
DE
AT
HS
F
RO
M
EX
TE
RN
AL
CA
US
ES
, A
US
TR
AL
IA
•
19
98
to 2
00
2