debt and deficits - boston university · the total national debt figure sounds very high, but we...
TRANSCRIPT

Debt and Deficits: Economic and Political Issues
by Nathan Perry
Global Development And Environment Institute Tufts University
Medford, MA 02155 http://ase.tufts.edu/gdae
A GDAE Teaching Module on Social and Environmental
Issues in Economics
1
Copyright © 2014 Global Development And Environment Institute, Tufts University.
Copyright release is hereby granted for instructors to copy this module for instructional purposes.
Students may also download the module directly from http://ase.tufts.edu/gdae.
Comments and feedback from course use are welcomed:
Global Development And Environment Institute
Tufts University
Medford, MA 02155
http://ase.tufts.edu/gdae
E-mail: [email protected]
Nathan Perry is Assistant Professor at Colorado Mesa University
and Visiting Research Fellow at the Tufts University Global Development and
Environment Institute
2
DEBT AND DEFICITS: ECONOMIC AND POLITICAL ISSUES
I. THE BUDGET
Introduction
"A national debt, if it is not excessive, will be to us a national blessing."
-Alexander Hamilton
Since 2008, political and economic buzzwords like "national debt" and "budget
deficit" and even "European Austerity" have become commonplace in the media. Debate
over how to deal with debt and deficits has become a major economic and political issue,
both in the U.S. and other countries. As of 2014, the U.S. national debt stood at over $17
trillion dollars, or over $54,000 per U.S. resident.
What is the national debt and how did it get so high? What will the national debt
to do jobs, or to economic growth? Will foreign countries stop buying U.S. debt? Is it
possible to get rid of the debt, and what are the consequences? How are Europe's debt
issues different from those of the United States? Can the solution for the United States
work for the rest of the world? Or is it possible that debt is not that important? How
these questions are answered and how the solutions are implemented over the next
several years will have immediate effects on fiscal policy, as well as effects on short run
and long run growth prospects.
Economics is a social science that draws from history, political science, and an
assortment of other fields in order to understand the world. To understand the role of
deficits and debt in our society, this module will address specific economic questions,
and will also present the historical and political contexts. This background is important
for making appropriate decisions on policies to respond to deficits and debt.
Understanding the Budget
There is an important distinction between a budget deficit and total debt. The
national debt is the total amount borrowed and owed by the federal government. A
budget deficit is the yearly accrual of debt, or how much expenditures exceed revenues
on a yearly basis. Conversely, a budget surplus is how much revenues exceed
expenditures on a yearly basis. Another way to think of this is that debt is a stock (i.e.,
accumulation) variable, and deficit is a flow (i.e., change) variable, with the flow of
deficits adding to the stock of debt. Figure 1 illustrates revenues and expenditures since
1980.
NOTE − terms denoted in bold face are defined in the KEY TERMS AND
CONCEPTS section at the end of the module.

3
Figure 1. U.S. Revenues and Expenditures 1980-2012
Source: Whitehouse.gov
A budget deficit occurs when the government expenditures are greater than the
revenues it receives. This can arise from either a shortfall of revenue, an increase in
expenditures, or both. Figure 2 illustrates sources of U.S. government revenue. Income
taxes are the largest source of revenue at 46%, with social insurance taxes such as the
FICA tax (Federal Insurance Contributions Act) second at 35% of revenues. Corporate
taxes are 10% of the total, and excise and other taxes contribute another 3% and 6%
respectively.
Figure 3 illustrates government expenditures, or what the Federal government
spends its money on. Social Security and Defense (military spending) each take up 20%
of the budget, with non-defense discretionary spending at 18% of the budget. Other
important spending programs are Medicaid (healthcare for the poor) at 8% and Medicare
(healthcare for the elderly) at 16%. Income security consists of unemployment insurance,
TANF (Temporary Assistance to Needy Families), Foster Care, food stamps, and several
other smaller programs that don't belong in one of the other categories and totals 11% of
spending. These programs are part of the social safety net, which all U.S. citizens have
access to if they meet eligibility requirements. The final 7% is made of Retirement and
Disability, and "Other Programs," which is everything else.
Government spending is divided up into what is called discretionary and
mandatory spending. Discretionary spending is optional, and can be implemented at
any time, as long as Congress approves the bill without a presidential veto. In Figure 3
this primarily includes defense spending and non-defense discretionary spending. This is

4
different from mandatory spending, which is spending that is built into the budget and
required by law. Examples of mandatory spending are Social Security and Medicare.
Figure 2. 2012 Revenue Sources Figure 3. 2012 Government Expenditures
Source: Whitehouse.gov, table 2.1
There is another important way the budget is divided; off budget expenditures and
on budget expenditures. Off budget expenditures are government funded programs that
are exempt from the normal budgeting process because they have their own sources of
funding separate from congressional appropriation. Social Security and Medicare are the
two primary off budget items. On budget expenditures are everything else that relies on
general revenue from Congress, such as military spending or spending on Federal
Highways. Each of these depend on Congress approving the budget every year.
Off budget and on budget expenditures are added to obtain the yearly total
expenditure numbers. On budget expenditures may generate either a surplus or a deficit,
depending on whether they are larger or smaller than their funding sources. For example,
Social Security runs a deficit in years when the total collected in social security taxes is
less than the total paid out from this program to retirees.1
1 Social security taxes are 6.2% on employees and 6.2% on employers, for a total of 12.4% up to a
maximum wage base level ($117,000 in 2014).
5
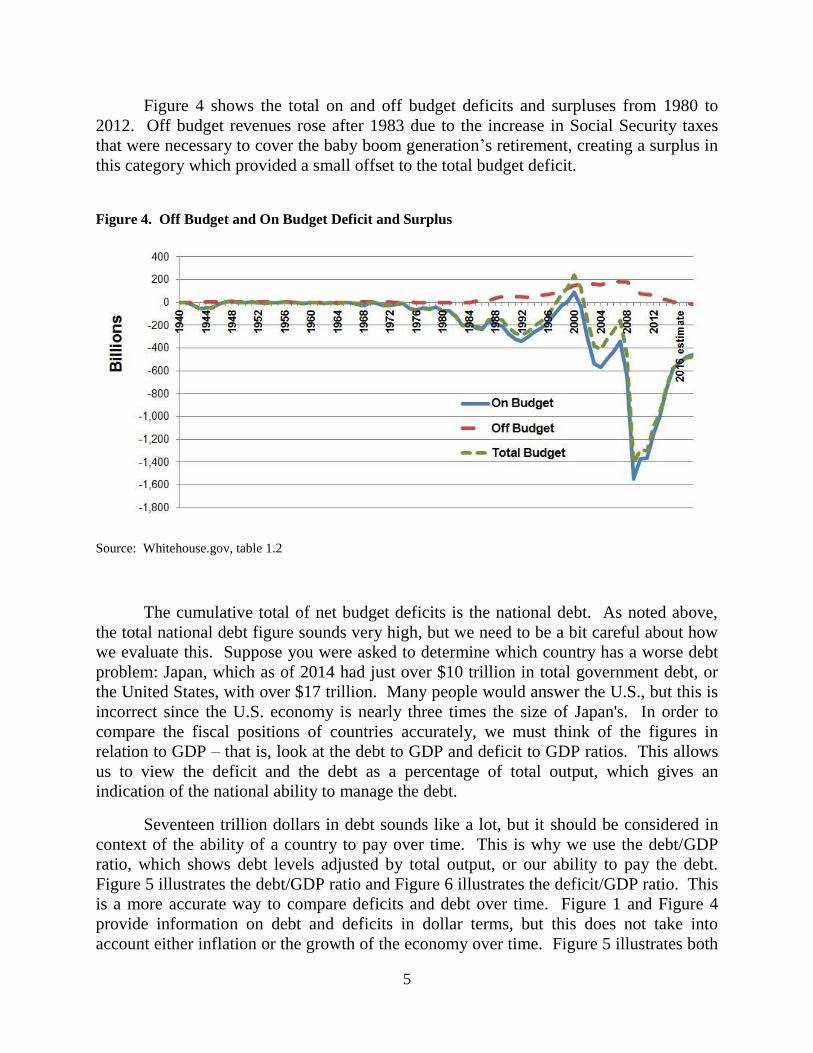
Figure 4 shows the total on and off budget deficits and surpluses from 1980 to
2012. Off budget revenues rose after 1983 due to the increase in Social Security taxes
that were necessary to cover the baby boom generation’s retirement, creating a surplus in
this category which provided a small offset to the total budget deficit.
Figure 4. Off Budget and On Budget Deficit and Surplus
Source: Whitehouse.gov, table 1.2
The cumulative total of net budget deficits is the national debt. As noted above,
the total national debt figure sounds very high, but we need to be a bit careful about how
we evaluate this. Suppose you were asked to determine which country has a worse debt
problem: Japan, which as of 2014 had just over $10 trillion in total government debt, or
the United States, with over $17 trillion. Many people would answer the U.S., but this is
incorrect since the U.S. economy is nearly three times the size of Japan's. In order to
compare the fiscal positions of countries accurately, we must think of the figures in
relation to GDP – that is, look at the debt to GDP and deficit to GDP ratios. This allows
us to view the deficit and the debt as a percentage of total output, which gives an
indication of the national ability to manage the debt.
Seventeen trillion dollars in debt sounds like a lot, but it should be considered in
context of the ability of a country to pay over time. This is why we use the debt/GDP
ratio, which shows debt levels adjusted by total output, or our ability to pay the debt.
Figure 5 illustrates the debt/GDP ratio and Figure 6 illustrates the deficit/GDP ratio. This
is a more accurate way to compare deficits and debt over time. Figure 1 and Figure 4
provide information on debt and deficits in dollar terms, but this does not take into
account either inflation or the growth of the economy over time. Figure 5 illustrates both

6
total debt as a percentage of GDP and public debt as a percentage of GDP. (Public debt
subtracts the debt that government owes to itself. This will be explained in detail in
section 4.2.)
Figure 5. Debt/GDP
Source: Whitehouse.gov
Figure 6. Deficit/GDP
Source: Whitehouse.gov

7
Who Is Responsible For The Deficit?
People sometimes tend to place disproportionate blame or credit on the President
when it comes to matters relating to the budget deficit. According to the U.S.
Constitution, it is Congress that approves spending bills; the President only has veto
power. Many policies for which Congress is essentially responsible, such as tax rates,
spending bills, and economic policies that affect tax revenue, can all have a large impact
on the budget. Of course, Presidents can influence Congressional decision-making, and
as we will see have often promoted particular budget approaches, including some that
have tended to increase the deficit.
There are other factors that affect the budget besides our elected officials' policy.
One is the effect of the business cycle on both revenue and expenditures. The portion of
the deficit that is caused by fluctuations in the business cycle is called the cyclical deficit.
Deficits can be caused by a fall in tax revenue or an increase in expenditures. Taxable
revenue generally falls during a recession because income is falling due to job losses or
profits falling. In an economic boom, these revenues increase because of job growth and
profit growth and can reduce the deficit. Look back at the graph in figure 1, and notice
how far revenues fell after the recession that began in 2008. Structural deficits, in
contrast, are deficits that exist when the economy is at full capacity. A structural deficit
indicates that even at full employment, spending is too high or revenue collection too low
to balance the budget.
During recessions it is likely that expenditures will growth faster than revenues, in
part because in recessions a number of government expenditures automatically increase
due to automatic stabilizers, such as unemployment benefits and Medicaid programs.
There is less demand for these programs during an economic boom when unemployment
is lower, so automatic stabilizer expenditures fall during a boom.
Expenditures may also increase in a recession because of discretionary fiscal
policy. During recessions, it is common to have some sort of spending bill to stimulate
economic activity. In the recession of 2001, President Bush pushed a program of tax
rebate checks which was meant to increase consumer spending. In 2009, President
Obama passed the American Economic Recovery Act which had a mix of infrastructure
spending and tax cuts intended to increase aggregate demand. A famous example of
spending during a recession is the New Deal programs passed by President Roosevelt in
the 1930's that put American workers to work at a time when unemployment was as high
as 25%.
At the trough of a recession, government revenue is normally at its lowest point
and expenditures tend to be higher, and vice versa in an economic boom. This is one of
the reasons that government budgets were balanced during the tech stock boom in 1998,
and that budget deficits were so large in 2009 during the worst part of the financial crisis-
induced recession.

8
Perfectly balancing the budget over the business cycle would entail cutting
expenditures, including automatic stabilizers, when people rely on these programs the
most. We all pay taxes for unemployment insurance and expect to receive it when we
need it, and the duration of unemployment insurance is often extended during severe
recessions. On the revenue side, raising taxes is also not advisable during a recession
because it would hurt consumer spending power when the economy needs it most. A
policy of running surpluses during good economic times and running deficits in bad
economic times is called “countercyclical policy.”
How Does Government Borrow?
Government issues debt by selling treasury bonds. Treasury bonds are sold at
different maturities, or times until the debt contract expires. The Federal Government
sells 30 year bonds, 10 year bonds, and a host of shorter term bonds. Each year the
Treasury Department pays out interest on the bonds to meet their obligations. When the
bond matures, the government pays back the original amount of the bond. If the
government does not have cash or excess revenue to pay off the bond, or if it has
different budget priorities, the debt is "rolled over"; that is, new debt is issued to pay
expiring debt.
A simple analogy is a house loan. Suppose that a family owes $300,000 on their
new house with a mortgage payment of $1,500 a month, and that is what the family
budgets for. This family does not consider whether they can afford $300,000 in
payments, they ask if they can afford $1,500. The Federal Government is similar in this
regard, as the debt obligation is the cost of paying interest payments on the bonds. The
combination of interest and principal payments is called debt service. If servicing the
bond payments becomes too high, the debt becomes a large part of the budget. Because
of this, interest rates are very important to the cost of running a deficit. If the interest
rates on bonds are low, then issuing and servicing debt becomes cheap. If interest rates
are high, then issuing and servicing newly issued bonds can become more expensive.
Discussion Questions
1) Many people confuse the deficit and the national debt. What is difference, and
what is the actual relationship between the two?
2) Why was the budget deficit in 2009 so large? (See Figure 6.) Was this a revenue
or an expenditure issue, or both? Explain.

9
II. THEORIES OF DECIFITS
Classical Theory of Deficits
What effects do deficits have on the economy? Economists have different views
on this question. According to the classical theory of deficits, budget deficits have the
effect of increasing current consumption by government or consumers, but this is
counterbalanced by a fall in investment. By definition, if consumption rises then savings
must fall. A fall in savings raises interest rates, which then reduces investment. The
phenomenon by which budget deficits increase interest rates and reduce investment is
called crowding out.
This can be shown by the loanable funds model presented in Figure 7 below. The
supply curve in this model represents savings. As interest rates rise, people are more
likely to save. The demand curve represents the demand for investment funds. It has a
downward slope because as interest rates increase, assuming other economic factors are
constant, businesses generally want to invest less.
Suppose government borrows money to run a budget deficit. This would shift the
demand for loanable funds out. This has the effect of raising the interest rate, which
makes investment more expensive.
Figure 7. Supply and Demand for Loanable Funds

10
Point A is the initial equilibrium in the model, and Q1 represents the quantity of
loanable funds available to private business. When government runs a deficit, they
borrow money from the loanable funds market. This shifts the demand from Demand1 to
Demand2, and pushes the interest rate, which represents the cost of borrowing, up. Now
private business has to borrow at a higher interest rate, and as a result they borrow less.
This reduction in business demand for investment, shown on the graph as the difference
between Q1 and Q3, is the amount of crowding out. Now that government is borrowing,
they have crowded out private business by increasing the interest rate from i1 to i2, and
reduced the quantity that business will be willing to borrow from Q1 to Q3.
In the classical model, the loanable funds market, if left to itself, would balance
out savings and investment, thereby keeping the economy at or close to full employment.
There would be no need for government deficit spending, and such spending would be
counterproductive because the crowding out effect means that the effect of deficit
spending would be to shift funds from investment to government consumption. For this
reason, classically-oriented economists generally oppose government deficit spending.
Keynesian Theory of Deficits
Keynesian economists see the issue differently. In his celebrated work "The
General Theory," John Maynard Keynes acknowledged the potential impact of crowding
out. However, he did not believe that an economy would experience full crowding out if
there were slack in the economy. Keynes argued that the economy would experience
only partial crowding out, with practically no crowding out at times of deep recession.
There are several facets to this argument. The first is that the savings and
investment decisions are not only dependent on the rate of interest. Keynes argued that
the investment decision is a function of not only interest rates, but primarily expectations
of future profit. Expectations of future profit, which are calculated by business people,
are based on a number of factors, including what Keynes called "animal spirits," or the
state of mind or emotional psychology of the investor. In good economic times or on the
upswing in a business cycle, businesses purchase capital goods because their profits are
high and their attitude toward the future is also positive. At the bottom of a business
cycle, businesspeople are negative about economic prospects and their profit margins are
low, so they do not invest.
This is the opposite of how businesses would invest if businesses only cared about
the cost of borrowing (interest rate), and ignored future expectations. At the peak of a
business cycle, interest rates are generally high because people would rather invest in
stocks or more lucrative savings options, rather than bonds which generally yield less, so
sellers of bonds must offer a higher rate of return. At the bottom of a business cycle
interest rates are often low because people become risk averse and want safe U.S.
treasury bonds, enabling the government to sell bonds with low rates of return. In other
11
words, the interest rate is not the only variable driving investment. Even if government
spending increased interest rates, this would not necessarily decrease investment if
businesses had a positive view of economic prospects.
A second argument relates to the multiplier. If there is slack in the economy, and
if government spending has positive multiplier effects, then the total impact of spending
can outweigh any loss of investment due to the higher interest rates. This means that
government spending can increase total output, which can have positive effects on
investment because of profit expectations.
When government spending creates more investment, this is called crowding in.
During the Great Depression, economists at the time believed that as the economy got
worse and as investment and consumption fell, people would buy treasury bonds to be
safe, pushing yields down. This fall in interest rates would then increase investment,
bringing the economic system back to full-employment equilibrium (as in the classical
model shown in Figure 7).
Keynes argued that this might not happen for two reasons. First, as described
above, investment is not just a function of interest rates but a function of how future
profit opportunities are perceived. Second, people have the option to hoard money,
finding other places to put it (such as under the mattress), instead of investing in
productive activities, which are perceived as risky. Banks can also hoard money simply
by not investing it. Because of this Keynes argued that the economy could be stuck in a
potentially permanent low level equilibrium, with no adjustment mechanism, and would
need governments to run deficits, spend money, and replace the lost investment spending
with government spending until investor and consumer confidence returned.
A third argument is also related to positive multiplier effects. A multiplier effect
larger than 1.0 means that if government spending increases by $1 billion dollars, the
total effect on the economy will be larger, say $2 billion dollars (indicating a multiplier of
2). This can be explained with a story: Suppose government increases spending by
building new roads. The construction workers are now paid an income, and they spend
this income at Target. Since Target now has an increase in demand, they hire more
workers, and those workers, with their new income, spend their money at Seven Eleven.
This process continues until the government spending of $1 billion dollars has increased
GDP by $2 billion dollars.
With the spending multiplier increasing income, in a Keynesian world the
effective money supply would also increase, as more investors seek loans and banks
provide them. This is called endogenous money. If the money supply increases as
income increases, then there will be no crowding out effects, because a new supply of
money has been created endogenously by the banking system to support the increase in
demand for borrowing.

12
Since crowding out depends on a shortage of money (loanable funds), in a
Keynesian endogenous money world, there can be no crowding out. You can think of
this as an investor going to a bank and asking for a loan. The bank can use its cash
reserves to grant the loan, or issue commercial paper (a short term corporate bond) to
raise the funds to meet the demand for loans. Ultimately this is only constrained by
1) the world supply of savings, which is not really a constraint in a world where a "global
savings glut" exists or 2) the ability of an economy to generate demand. In this system
there is never a shortage of money or loanable funds, so crowding out is simply not an
issue.
For these reasons, Keynesian economists often support deficit spending, especially
in times of recession. They argue that at such times the beneficial multiplier effects of
increased spending far outweigh any concerns about crowding out. At times when the
economy is in a boom, there is no need for deficit spending, and crowding out may
become more of a factor. This leads Keynesians to advocate countercyclical policy, as
described earlier.
Discussion Questions
1) Summarize the differences between the neo-classical theory of deficits and the
Keynesian theory of deficits. What are the policy implications of each theory?
2) Do you think that deficit spending can sometimes be a good thing? What would
be the implications of never running a government deficit?
III. HISTORY OF DEBT AND DEFICITS
The Creation of the U.S. National Debt
The creation of the national debt was crucial to the success of the newly formed
United States after the Revolutionary War. Alexander Hamilton played perhaps the most
important role in the creation of the national debt. Hamilton argued that the Federal
Government should take on the war debt that states accrued during the revolutionary war.
This was a hotly debated issue because many of the revolutionary debt holders were
wealthy merchants in large cities, who had purchased the debt far below par value, some
for as little as 10 percent of the face value of the bond. James Madison and others saw
this as unfair speculation and tried to undercut the speculators by paying the current debt
holders part of the debt and the original holders the rest.
Alexander Hamilton, who was appointed the first secretary of the treasury in 1789,
helped defeat Madison's plan, and sought to use government debt not just as a source of
borrowing, but to create a liquid market with a more flexible money supply. Hamilton
saw that not paying off the war debts would anger wealthy citizens of the newly formed

13
United States, while issuing new debt to pay off state debts would ensure a vested
financial interest from the wealthy in the success of the new country. He created the first
national debt based on tax revenue from the tariff law of 1789. A treasury bond became a
promise to pay back with interest in the future, financed by tariffs, which were the
primary source of income for the new government. Banks holding government bonds
could issue bank notes backed by the bonds. These bonds could also serve as collateral
for bank loans, which would improve the ability of farmers, industry, and banks to take
out a loan and invest in their businesses.
Hamilton anticipated that a strong, liquid, functioning debt market, made more
liquid and supported by U.S. treasury bonds, would instill faith in foreign lenders and
allow the U.S. government and businesses access to foreign lending. All this was
dependent on their credit rating, which in turn was dependent on the U.S. repaying its
promised debts. Hamilton's first sign of success came when European governments
starting buying U.S. treasury bonds during the French revolution period (1792-1812) and
the ensuing wars. By 1794 the U.S. had one of the highest credit ratings in the European
world.
Table 1: Founding Fathers Debt and Deficit Arguments
Reasons for the National Debt
(Hamilton)
Reasons Against the National Debt
(Jefferson and Adams)
Allows new debts to fund projects A balanced budget amendment would
restrain excessive spending
Kept political stability in a country known
for tax rebellions by spreading the debt
payments over several generations and not
increasing taxes on one
Thought politicians would create
bureaucracy that would be dependent on
government money and debt
Bonds served as a steady source of income
for elderly who bought them Increase in debt is a tax on future citizens
Provided commercial banks and insurance
companies with liquid secondary reserves,
and an asset that businesses could use to
secure loans
The ability to issue debt gives the Federal
Government more power
Gave debt holders a vested interest in the
United States succeeding
Debt favored the rich who owned
government bonds
Established a secondary market for bonds
which accelerated the creation of other
financial asset markets such as corporate
equities (stocks) and corporate bonds
Allowed excessive money creation, above
the true value of gold and silver
Hamilton's national debt plans were opposed by many, including Thomas
Jefferson and John Adams. Jefferson argued that people in office were politicians, not

14
statesmen, and would create bureaucracy that would be dependent on government money
and debt. Jefferson did not like the power that Hamilton's plan brought to the Federal
government, and wanted a balanced budget amendment to prevent congress from
borrowing. John Adams famously quipped that "every dollar of a bank bill that is issued
beyond the quantity of gold and silver in the vaults represents nothing, and is therefore a
cheat upon somebody." Despite these counterarguments, Hamilton's debt plan was
successful and facilitated a highly functional financial system of borrowing, credit, and
investment that helped to spur growth in the early years of the United States and
continues to this day. Even Thomas Jefferson, who opposed the national debt, could not
have made the Louisiana Purchase without it several years later.
The Great Depression, Macroeconomics, and the Deficit
Once the national debt had been established, it continued to play a significant role
in financing government expenditures, including in times of war such as the Civil War.
The role of budget deficits and government debt in the economy changed significantly
after 1929, when the great stock market crash helped to push the United States and the
rest of the world into a depression. Before 1930, the Federal government ran a surplus 92
times and a deficit 46 times. From 1931-2011, the federal government would run a
deficit 73 years, and a surplus for 7 years. What caused this dramatic change in
government behavior?
First, the Great Depression brought a drastic drop in tax revenues. Efforts by the
Hoover administration (1928-1932) to increase tax revenues by imposing a tariff on
imported goods (Smoot-Hawley) and increasing income taxes only served to hurt the
economy further. Franklin Roosevelt ran as a president who would balance the budget,
but when he entered office in 1933, the pragmatic Roosevelt decided to run deliberate
budget deficits in order to avoid repeating the mistakes of the Hoover administration.
By 1933, unemployment was spiraling out of control at a rate of 25%, and
Roosevelt had to do something about it both to fix the economy and avoid the fates of
fascist Italy and Germany, as well as communist Russia, all of whose political revolutions
were in large part caused by economic disaster. Roosevelt decided to institute the New
Deal, an array of programs designed to get people back to work. These New Deal
programs added structural deficits to the already existing cyclical deficits.
These policies were further encouraged by a paradigm shift in economic thinking.
In 1936, John Maynard Keynes published the “The General Theory of Employment,
Interest, and Money,” in which he argued that government should play an active role in
helping the economy out of a recession. Keynes argued that it was possible to stay in a
state of disequilibrium for decades, and that while an economy might adjust in the long
run on its own, "in the long run we are all dead." By this he meant that simply waiting
for the economy to recover would lead to unacceptable economic damage.

15
Keynes advocated deficit spending in the form of fiscal policy and monetary
policy that would induce spending and economic activity. Governments should run
deficits during bad economic times, and balance the budget during good times. In many
ways the New Deal was exactly what Keynes was describing, although Keynes believed
that to get the economy out of a depression, spending would have to increase well beyond
the 5% of GDP that was spent during the 1930's.
Many Keynesians argue that the New Deal was simply not enough spending to
create the economic activity necessary to pull the U.S. out of the depression. When the
U.S. entered WWII, the economy began to see the effect of the type of spending Keynes
advocated. Wartime spending approached 30% of GDP in 1943 (considerably increasing
aggregate demand) and created strong multiplier effects. Young men leaving for war
overseas reduced the workforce and lowered the unemployment rate to almost zero. By
1946, the debt/GDP ratio would be 121%.
The Modern Period
From the end of WWII to the late 1970's, budget deficits averaged 0.8% of GDP,
with the highest budget deficit in 1976 at 4.2% of GDP. Economic stagnation in the
1970's changed this pattern. The 1980's represented a turning point in the economy and
especially in the budget. In 1982, Reagan introduced changes to Social Security due to
the rising costs of the program. The result was a relatively large increase in taxes to
cover the expected retirement of the baby boom generation. This is the reason for the
increase in off budget revenues in the early 1980's (see Figure 4).
On budget revenues were a different story. Reagan inherited a budget deficit of
2.7% of GDP in 1980, and by 1983 that deficit had risen to 6% of GDP, and only
significantly fell to 3.2% in 1987. Budget deficits during the Reagan period averaged
over 4%. The deficits were a combination of decreased revenues and increased
expenditures. On the revenue side, the economic recovery act (ERA) of 1981 cut income
and corporate taxes, which reduced revenues. On the expenditure side, military spending
doubled from 1980 to 1988 to compete with Soviet spending with the intention of ending
the Cold War.
The emphasis of the 1981 ERA was cutting taxes for upper income earners. This
tax cut and the theory behind it have been given several names, including
"Reaganomics," "trickle-down economics", and "supply side economics." This theory
has two basic tenets: one that draws from an old economic theory, and one that was
relatively new. The first tenet follows the basic classical model of growth. The classical
model of growth in its simplest form shows that as savings increase, investment
increases, which leads to growth. An increase in savings lowers interest rates, which
reduces the cost of investment, and spurs investment. Investment means the purchase of

16
capital goods, or the expansion of business. As business is expanded, jobs are created,
which is how wealth is supposed to trickle down to the average worker.
According to this theory, taxes should be cut for the people who have the highest
marginal propensity to save. This is the opposite of the Keynesian position stated earlier.
Keynesians argue that tax cuts for lower-income people would lead to economic stimulus
due to their higher marginal propensity to consume. But the classical approach favors tax
cuts for the wealthy, on the theory that they are likely to save more and thus promote
productive investment. In addition, cutting taxes on higher incomes and on investment
returns should increase the incentive to work and invest.
This argument was connected to deficits using what is known as the "Laffer
Curve," named after its inventor, economist Arthur Laffer. Figure 8 illustrates the Laffer
Curve, which plots government revenue on the Y axis and the tax rate on the X axis. The
idea is that there is an optimal tax rate that maximizes government revenue. To illustrate,
let us begin with two extreme examples. Supposing that the tax rate is 100 percent of
income, how much would you work? Probably not at all unless you were forced to, and
as a result government would not receive any tax revenue. What if the tax rate was zero
percent? You might work a lot, but government would not receive any revenue this way
either.
Figure 8. Laffer Curve
Following Laffer’s theory, Reagan argued that the 70 percent top tax rate in 1981
was too high in that it discouraged people from working. He argued that if that rate were
lowered, government revenue would not fall because of lower tax rates, but rather would
17
increase because workers would have an incentive to work more hours. The increase in
productive work would, at least in theory, more than offset the revenue lost per dollar
earned (in economic terms, they would be “revenue neutral” or “revenue positive”). In
terms of the Laffer curve, this implied that the economy was on the right-hand side of the
curve to start with, such that reducing the tax rate t would lead to an increase in overall
government revenue.
Politically, this was an effective argument because it allowed the traditional fiscal
conservatives to agree to a tax cut, with theoretical support that this tax cut would not
increase the budget deficit. In practice, the Reagan tax cuts were not revenue neutral but
instead created the largest deficits since WWII. Revenue did not rise with tax cuts as
Reagan predicted. Reagan's budget advisor David Stockman admitted in The Triumph of
Politics, the Inside Story of the Reagan Revolution that the revenue projections showing
tax cuts causing revenue increases were largely fabricated in order to push the bill
through Congress.
Despite this outcome, the same argument was used again during the George W.
Bush administration in 2001. Once again, the administration suggested that tax cuts
would create so much growth, and therefore taxable revenue, that they would not increase
deficits. And once again, the actual effect of sweeping tax cuts was persistent deficits.
This experience has led most economists to conclude that under most circumstances tax
cuts lead to lower, not higher, revenues.
Many economists and political scientists argue that deficits during the Reagan and
Bush administration were actually intentional, and part of a broader political-economic
strategy called "starve the beast." This concept is based on the premise that government
is generally inefficient, and that private markets can take care of everything more
efficiently than the government can. Thus fiscal and monetary policies should be
designed to limit government’s role.
The strategy proceeds as follows: A large tax cut is passed, supported by the
argument that it will cause an increase in revenue. In fact the tax cut leads to higher
deficits, so the president goes to the American people and gives the voters a choice: to
raise taxes (which is never popular), or to cut spending. The hope is that faced with a
deficit "crisis," the American voter is likely to vote for a cut in social spending rather than
an increase in taxes. By creating a budget deficit, you intentionally "starve the beast,"
forcing government spending to fall.
Policy Responses to Deficits
Facing deficits inherited from the Reagan Administration, Congress passed a bill
in 1990, signed by President George H.W. Bush, requiring all spending increases to be
matched by spending decreases or tax increases. This system was called PAYGO, and

18
was intended to keep budget deficits from increasing. Despite PAYGO, the 1991
recession along with the first Iraq war pushed deficits to an average of 4% of GDP by
1992. The Clinton administration continued the PAYGO policy, and also pushed through
a tax increase. Higher taxes, coupled with an economic boom and the accompanying
increase in government revenue began to balance budgets. On the expenditure side, the
end of the Cold War allowed the Federal government to lower military expenditures,
often described as a "peace dividend."
The last three years of the Clinton administration were surplus years, as was the
first year of the G.W. Bush administration. Then deficits jumped to 3.5 percent by 2003.
What series of events cause this to happen? There were four main reasons why the
country's fiscal balance changed from surplus to deficit.
1) The stock market decline of 2000-2002, resulting from the bursting of the “dot-
com bubble”. In what Federal Reserve Chairman Alan Greenspan called
"irrational exuberance," stock investors and speculators had bid up the price of
technology companies well beyond a sustainable value. When there was no one
left willing to buy, prices started to fall drastically. The preceding five years had
seen massive revenue boosts from the stock market boom. These revenues fell
sharply after the dot-com bubble popped.
2) The bursting of the dot-com bubble pushed the U.S. into recession, causing
revenue to fall even further.
3) The Bush tax cuts of 2001 and 2003 caused a further decline in revenue.
4) An increase in military spending occurred due to the Iraq war.
5) There was also an increase in non-defense spending on programs such as Medicare
Part D, an expansion of Medicare to cover drug prescriptions.
During the first Obama administration, deficits rose further. What caused the
jump in deficit? These were primarily a result of the very severe recession of 2007-9.
President Obama took office in January 2009, roughly 13 months after the start of the
recession. The recession was caused by a financial crisis resulting from a bubble in the
real estate market, which eventually translated through mortgage-backed securities and
other housing related securities into a broader financial bubble and crisis. Tax revenue
fell from 2.5 trillion dollars in 2008 to 2.1 trillion in 2009. As is normal in a recession,
expenditures increased due to automatic stabilizers.
In addition, discretionary policy took the form of significant expenses for bank
bailouts, and a $787 billion fiscal policy package (the American Recovery and
Reinvestment Act of 2009). The combination of recession, higher automatic stabilizer
expenses, expanded government spending to stimulate the economy, together with the
existing Bush tax cuts and costs of the wars in Iraq and Afghanistan, led to the highest
deficits since World War Two, about 10% of GDP.
But as the economy began to recover, deficits fell again. The temporary
government stimulus plan expired, automatic stabilizer expenses fell, and revenues

19
started to increase. In addition, some areas of government spending were subject to
cutbacks, and some of the Bush tax cuts for higher-income groups were allowed to
expire. By 2013, the deficit had fallen to about 4% of GDP.
Table 2: Deficit Average for Post-Great Depression Presidents
President Deficit average
Roosevelt I -5%
Roosevelt II -2.2%
Roosevelt III -17.9%
Roosevelt/Truman -5.6%
Truman +.15%
Eisenhower I -.47%
Eisenhower II -.57%
Kennedy/Johnson -.9%
Johnson -1.17%
Nixon -1.02%
Nixon/Ford -2.27%
Carter -2.4
Reagan I -4.3%
Reagan II -4.1%
Bush Senior -4%
Clinton I -2.6%
Clinton II +1.0
G.W. Bush I -1.7%
G.W. Bush II -2.2%
Obama (2009-2012
average)
-8.7%
Source: Whitehouse.gov
Discussion Questions
1) Explain the importance of the creation of the U.S. national debt and briefly describe
its role in U.S. history. Why have some political leaders favored, and others opposed,
deficits and a national debt?
2) In recent decades deficits seem to have become standard practice in the U.S. What
events led to this happening? What led to the brief period of surpluses around 1999-2000
(refer to Figure 6), and why did the budget then go back into deficit?
20
IV. GOVERNMENT DEBT
What Are the Problems With Government Debt?
Most economists agree that some government debt is necessary and not harmful to
an economy, but opinions change when debt levels rise. What are some of the problems
that can arise as a result of too much government debt? The first is that debt has to be
repaid, and this repayment comes in the form of interest payments on bonds.2 This is
called debt servicing, and is part of the yearly government budget.
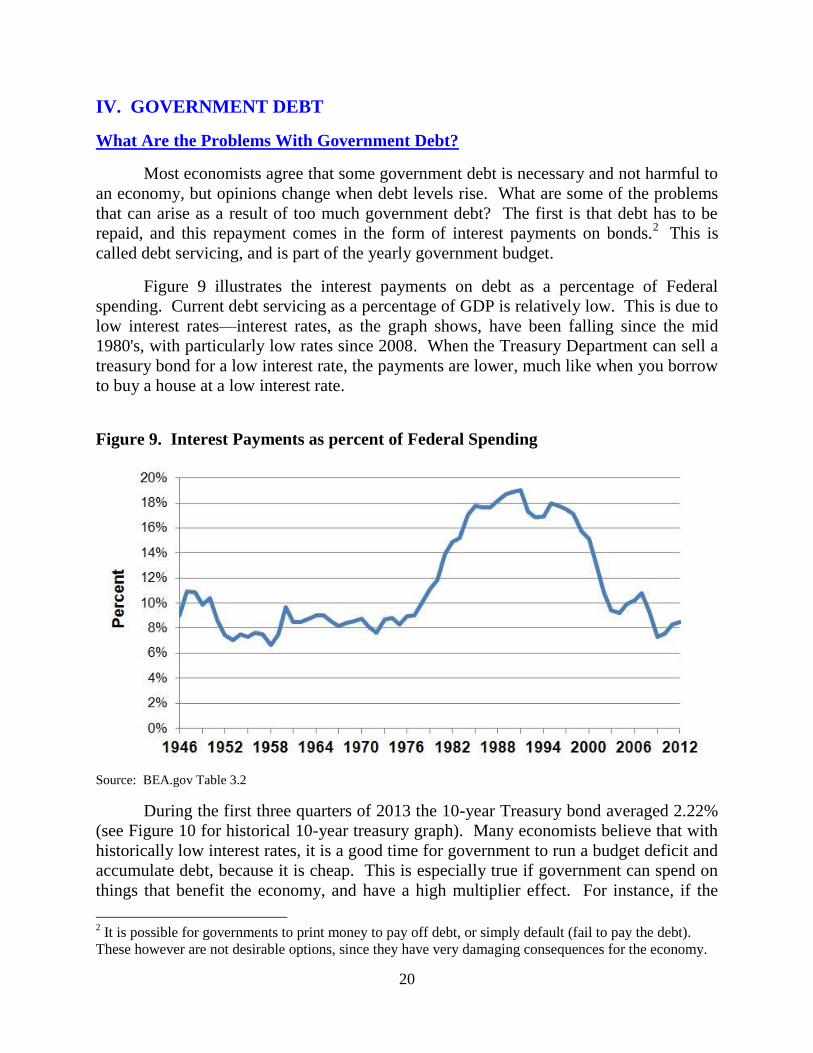
Figure 9 illustrates the interest payments on debt as a percentage of Federal
spending. Current debt servicing as a percentage of GDP is relatively low. This is due to
low interest rates—interest rates, as the graph shows, have been falling since the mid
1980's, with particularly low rates since 2008. When the Treasury Department can sell a
treasury bond for a low interest rate, the payments are lower, much like when you borrow
to buy a house at a low interest rate.
Figure 9. Interest Payments as percent of Federal Spending
Source: BEA.gov Table 3.2
During the first three quarters of 2013 the 10-year Treasury bond averaged 2.22%
(see Figure 10 for historical 10-year treasury graph). Many economists believe that with
historically low interest rates, it is a good time for government to run a budget deficit and
accumulate debt, because it is cheap. This is especially true if government can spend on
things that benefit the economy, and have a high multiplier effect. For instance, if the
2 It is possible for governments to print money to pay off debt, or simply default (fail to pay the debt).
These however are not desirable options, since they have very damaging consequences for the economy.

21
government spending multiplier for infrastructure spending is 2, then 100 billion in
deficit spending would create 200 billion in total economic activity. With low interest
rates the revenue gain from the multiplier effect is likely to be larger than the cost of
future debt payments, making the net gain positive (see Box 1).
Figure 10. 10-Year Treasury Rate
Source: St. Louis Federal Reserve Bank
The second issue with accumulating too much debt is that borrowers, both
domestic and international, may at some point start to believe that the debt cannot be
repaid. In this situation, investors who do not like the additional risk will sell the bonds,
driving their price down and their yield up.3 When the government issues new debt, it
must pay a much higher interest rate, making borrowing more expensive. In extreme
cases, it is possible that nobody will be willing to buy the newly issued debt.
3 There is an inverse relationship between a bond’s price and its yield. The yield is the percentage return
an existing bond promises at a given price. It depends on the bond’s interest rate at inception. So, given a
fixed interest rate on a specific bond, the higher the price of the bond, the lower its yield. If, for example,
a 10 year Treasury bond has a face value of $1,000 with a 5 percent interest rate (i.e., paying $50/year),
buying the bond at $800 would result in a yield of $50/$800 = 6.25%, while buying the same bond for
$1200 instead yields $50/$1,200 = 4.17%.

22
Box 1: Deficit Spending to Maximize the Multiplier Effect
Mark Zandi, economist at Moody's, testified before Congress in 2008 about his
empirical multiplier calculations, shown in Table 3 below. According to
Keynesian theory, deficit spending in a recession can replace falling investment
and promote recovery. If used correctly, government spending can employ
people, which gets them spending money, which would then employ more
workers who spend money. If the goal in a recession is to maximize the
efficiency of government spending, what should government spend money on?
Table 3
Tax Cuts Multiplier
Nonrefundable Lump-Sum Tax Rebate 1.02
Refundable Lump-Sum Tax Rebate 1.26
Temporary Tax Cuts
Payroll Tax Holiday 1.29
Across the Board Tax Cut 1.03
Accelerated Depreciation 0.27
Permanent Tax Cuts
Extend Alternative Minimum Tax Patch 0.48
Make Bush Income Tax Cuts Permanent 0.29
Make Dividend and Capital Gains Tax Cuts
Permanent
0.37
Cut Corporate Tax Rate 0.30
Spending Increases
Extend Unemployment Insurance Benefits 1.64
Temporarily Increase Food Stamps 1.73
Issue General Aid to State Governments 1.36
Increase Infrastructure Spending 1.59
Keynes argued that in general the multiplier is highest when counter-
recessionary money goes to those who have the highest marginal propensity to
consume (mpc). This means spending should go to those who are unemployed or
who are poor, because those without much income generally spend every penny
of it. Zandi's multiplier calculations illustrate this, with unemployment benefits,
temporary food stamps, aid to state governments (to prevent layoffs), and
infrastructure spending all having high multiplier effects.
Keynesian theory also suggests spending money on schools, parks, and
roads to both employ people who need work and to build things that improve
society. This is why infrastructure spending was an important part of the 2009
Obama stimulus package. The lowest multiplier effects are associated with
entities with the lowest mpc, such as cutting the corporate tax rate and extending
the Bush tax cuts. These policies get less "bang for the buck," and are supply-
side policies that are not expected to increase spending in the short run.
Source: U.S. House Committee on Small Business, July 24th, 2008.
https://www.economy.com/mark-zandi/documents/Small%20Business_7_24_08.pdf.
23
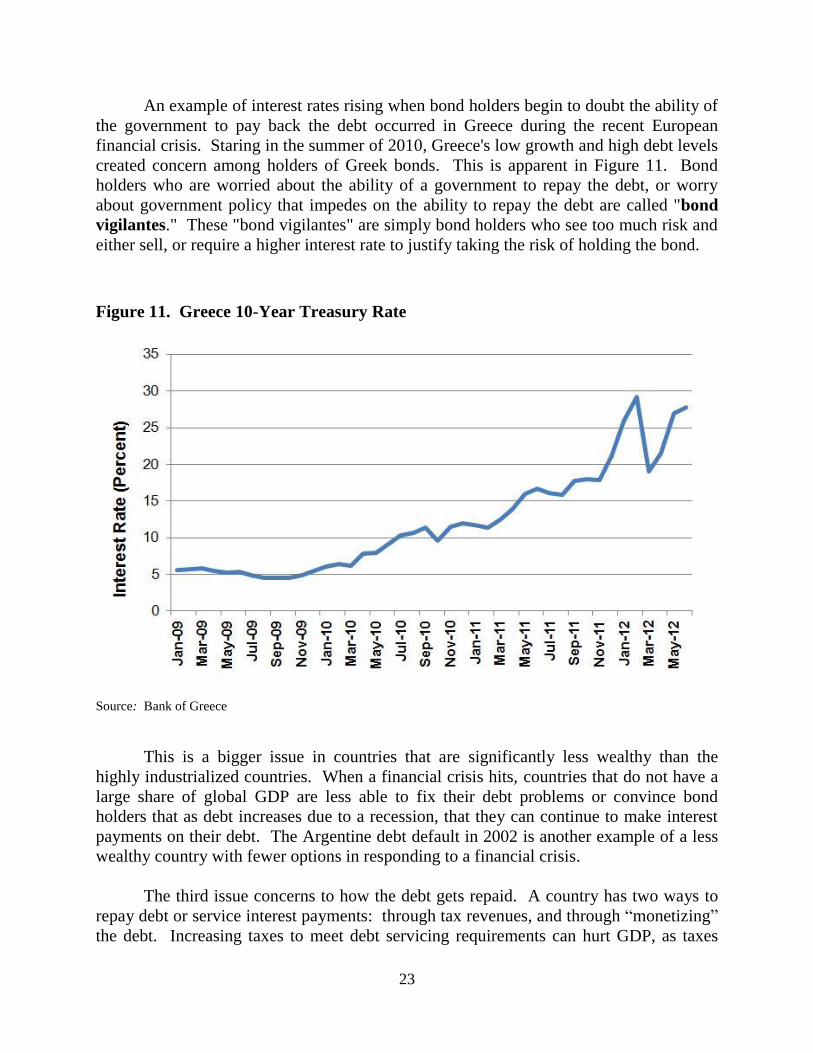
An example of interest rates rising when bond holders begin to doubt the ability of
the government to pay back the debt occurred in Greece during the recent European
financial crisis. Staring in the summer of 2010, Greece's low growth and high debt levels
created concern among holders of Greek bonds. This is apparent in Figure 11. Bond
holders who are worried about the ability of a government to repay the debt, or worry
about government policy that impedes on the ability to repay the debt are called "bond
vigilantes." These "bond vigilantes" are simply bond holders who see too much risk and
either sell, or require a higher interest rate to justify taking the risk of holding the bond.
Figure 11. Greece 10-Year Treasury Rate
Source: Bank of Greece
This is a bigger issue in countries that are significantly less wealthy than the
highly industrialized countries. When a financial crisis hits, countries that do not have a
large share of global GDP are less able to fix their debt problems or convince bond
holders that as debt increases due to a recession, that they can continue to make interest
payments on their debt. The Argentine debt default in 2002 is another example of a less
wealthy country with fewer options in responding to a financial crisis.
The third issue concerns to how the debt gets repaid. A country has two ways to
repay debt or service interest payments: through tax revenues, and through “monetizing”
the debt. Increasing taxes to meet debt servicing requirements can hurt GDP, as taxes

24
can reduce both consumption and investment. Debt can only be repaid if the budget is
balanced or running a surplus, and even in this scenario paying off the total debt can take
some time. Cutbacks in government spending, also needed to balance the budget, can
depress the economy further. This painful process has caused extreme political conflict
in Greece and other highly indebted nations.
Monetizing the debt means, in effect, printing money. To monetize the debt, the
Treasury department would sell Treasury bonds. The Federal Reserve would buy these
Treasury bonds, and the Treasury would pay interest on the debt. The Federal Reserve
would return the interest on the debt to the Treasury, less operating expenses. Since
Congress does not control the Federal Reserve, this is how government can in effect
“print money” to pay off debt.
Many economists believe that monetizing the debt raises the threat of creating
inflation because of the increase in money supply. However, other economists believe
that a small increase in inflation can be a positive thing for the economy because in a
depressed economy inflationary forces can counter the threat of deflation—falling prices
that can further depress business activity.
The option of monetizing the debt, however, is only open to countries that control
the currency in which their debt is denominated. It was not available to Greece, whose
debt was in euros, nor to Argentina, whose debt was primarily in dollars.
Who Owns the Debt?
Figure 12 illustrates that while one third of the U.S. debt is held by entities located
outside the country, the larger part is owned by U.S. citizens—in some cases directly, as
individuals, but more often through citizens' ownership interests in social security,
pension funds, state and local governments, and the Federal Reserve. While national and
international insurance companies and banks are also holders of U.S. debt, the reality is
that we actually owe most of the debt to ourselves!
The category accounting for the highest percentage of government debt (aside
from the foreign countries in aggregate) is the so-called "intra-government debt," which
is the social security trust fund and the Medicare trust fund, both “off- budget” items that
have their own sources of funding. These funds buy treasury bonds as a way to gain risk-
free revenue for the trust fund. The Federal Reserve holds 11% of outstanding treasury
bonds as part of its policy of conducting open market operations.4 Pension funds and
4 “Open market operations” is the name given to the process of the Federal Reserve buying and selling
short term debt to manipulate and control the Federal Funds rate. The Federal Funds rate is the rate at
which banks borrow from other banks to meet their overnight reserve requirements.

25
mutual funds each own 5% of the debt. U.S. Treasury bonds give people looking to retire
a safe, risk free return that is a part of almost every retirement portfolio.
Foreign entities own 33% of the debt; an exact itemization by country is found in
Table 4. Table 4 lists the largest holders of U.S. debt as a percentage of the total debt. It
shows that China is the largest holder of treasury bonds internationally holding 7.3% of
U.S. debt, followed closely by Japan at 6.9%. Oil exporters rank third, because countries
that sell oil in dollars use the same dollars to buy treasury bonds to maintain their dollar
liquidity and safely store their excess savings.
Figure 12. Debt Ownership 2012
Source: www.fms.treas.gov/bulletin/b2012_2ofs.doc
International Comparisons of Debt/GDP ratios
Although in absolute terms the U.S. debt is by far the highest in the world, it is a
different story when we consider debt relative to GDP. Table 5 illustrates international
debt/GDP ratio comparisons.

26
Table 4: Largest Holders of U.S. Treasury Bonds as a Percentage
of Total U.S. Debt 2012
Largest Foreign Holders of U.S.
Treasury Bonds
Percentage of Total U.S.
Treasury Bonds
China 7.3%
Japan 6.9%
Oil Exporters 1.6%
Brazil 1.5%
Caribbean Banking Centers 1.6%
Taiwan 1.2%
Russia 1.0%
Switzerland 1.1%
Rest of World 11.1%
Source: http://www.treasury.gov/resource-center/data-chart-center/tic/Documents/mfhhis01.txt
Table 5. Debt/GDP Ratios
Year Canada France Germany Italy Japan United
Kingdom
United
States
2006 70.4 71.2 69.8 116.7 166.7 46.0 66.4
2007 66.7 73.0 65.6 112.1 162.4 47.2 67.0
2008 71.2 79.3 69.8 114.6 171.2 57.4 75.9
2009 82.4 91.2 77.4 127.7 188.8 72.4 89.7
2010 84.0 95.8 86.8 126.5 192.7 81.9 98.3
2011 87.8 98.6 87.2 119.7 205.5 97.9 102.7
2012 92.8 102.4 87.3 128.1 219.1 97.2 103.6
Source: www.oecd.org
Japan has had a very high debt to GDP ratio, resulting from depressed economic
conditions starting in the 1990's, and currently has a debt to GDP ratio of 219%.
Japanese bonds are still bought and traded, and Japan is not on the edge of disaster. Italy
is second in this list with 128.1%, followed by the United States as 108.6%. Notice how
debt levels in the U.S. skyrocketed from 2007 to 2011 as a result of the recession. As
government revenue fell and expenditures increased, the government accrued more debt
to bridge the difference.

27
Discussion Questions
1) What does it mean that most of the U.S. debt is owned by its own citizens? Who
is buying this debt, for what reason, and are they likely to continue doing so?
2) What are the advantages and disadvantages of having a government debt? Does
the debt pose immediate dangers to the economy? How does the answer differ for
different countries such as the U.S. Greece, and Japan?
V. POLITICAL ECONOMY OF DEFICITS
U.S. Global Hegemony and Global Imbalances
Generally, in the bond market the riskier an asset becomes the higher the yield on
the bond. But is there a point where investors will simply refuse to buy newly issued
debt? This is improbable but possible, at which point the government will simply not be
able to borrow (see Box 2). This is especially unlikely in the United States, which has
the world's biggest economy, the largest tax base, and can monetize the debt without
constraints. There is an apparently insatiable demand for U.S. treasury bonds because of
the role that the U.S. and the dollar play in the world economy. The U.S. is what is
known as a "global hegemon," which means that the U.S. is the dominant military and
economic power in the world.
Because of the economic dominance of the U.S. and its currency, countries around
the world are forced to store dollars for international transactions, such as the trade of
goods, the purchase of oil and other commodities that are priced in dollars, as well as for
exchange rate intervention and manipulation of their own currency. For this reason most
countries have a large stockpile of dollar reserves. But instead of just holding dollars
they hold treasury bonds, which are liquid, dollar denominated assets that bring a small
return. Thus the high demand for U.S. dollars creates a high demand for U.S. treasury
bonds.
The U.S. is one of the few countries that can sell all of its bonds in its own
currency. This gives the United States the advantage of being able to run large budgets
deficits and still be seen as a safe, risk-free investment. In fact, if the U.S. stopped
issuing treasury bonds, the world financial system, which is dollar based and dollar
reliant, would have to change significantly.
28
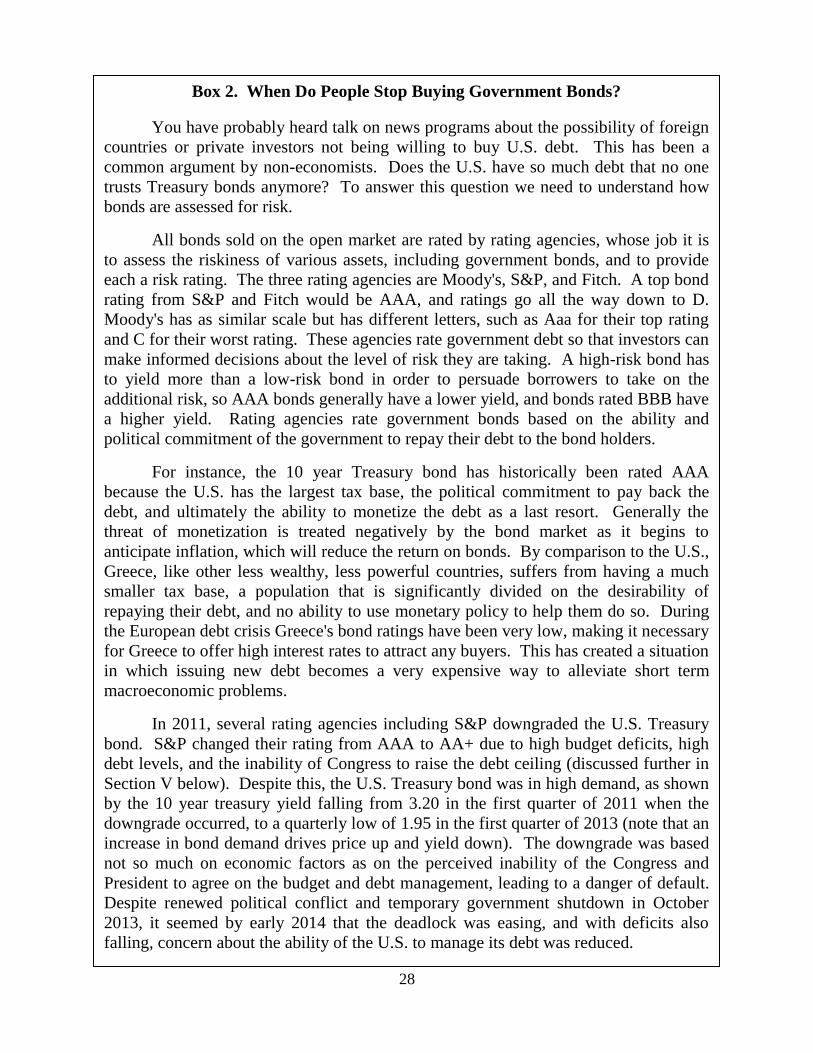
Box 2. When Do People Stop Buying Government Bonds?
You have probably heard talk on news programs about the possibility of foreign
countries or private investors not being willing to buy U.S. debt. This has been a
common argument by non-economists. Does the U.S. have so much debt that no one
trusts Treasury bonds anymore? To answer this question we need to understand how
bonds are assessed for risk.
All bonds sold on the open market are rated by rating agencies, whose job it is
to assess the riskiness of various assets, including government bonds, and to provide
each a risk rating. The three rating agencies are Moody's, S&P, and Fitch. A top bond
rating from S&P and Fitch would be AAA, and ratings go all the way down to D.
Moody's has as similar scale but has different letters, such as Aaa for their top rating
and C for their worst rating. These agencies rate government debt so that investors can
make informed decisions about the level of risk they are taking. A high-risk bond has
to yield more than a low-risk bond in order to persuade borrowers to take on the
additional risk, so AAA bonds generally have a lower yield, and bonds rated BBB have
a higher yield. Rating agencies rate government bonds based on the ability and
political commitment of the government to repay their debt to the bond holders.
For instance, the 10 year Treasury bond has historically been rated AAA
because the U.S. has the largest tax base, the political commitment to pay back the
debt, and ultimately the ability to monetize the debt as a last resort. Generally the
threat of monetization is treated negatively by the bond market as it begins to
anticipate inflation, which will reduce the return on bonds. By comparison to the U.S.,
Greece, like other less wealthy, less powerful countries, suffers from having a much
smaller tax base, a population that is significantly divided on the desirability of
repaying their debt, and no ability to use monetary policy to help them do so. During
the European debt crisis Greece's bond ratings have been very low, making it necessary
for Greece to offer high interest rates to attract any buyers. This has created a situation
in which issuing new debt becomes a very expensive way to alleviate short term
macroeconomic problems.
In 2011, several rating agencies including S&P downgraded the U.S. Treasury
bond. S&P changed their rating from AAA to AA+ due to high budget deficits, high
debt levels, and the inability of Congress to raise the debt ceiling (discussed further in
Section V below). Despite this, the U.S. Treasury bond was in high demand, as shown
by the 10 year treasury yield falling from 3.20 in the first quarter of 2011 when the
downgrade occurred, to a quarterly low of 1.95 in the first quarter of 2013 (note that an
increase in bond demand drives price up and yield down). The downgrade was based
not so much on economic factors as on the perceived inability of the Congress and
President to agree on the budget and debt management, leading to a danger of default.
Despite renewed political conflict and temporary government shutdown in October
2013, it seemed by early 2014 that the deadlock was easing, and with deficits also
falling, concern about the ability of the U.S. to manage its debt was reduced.
29
The United States established its hegemonic position in the aftermath of World
War II. Since the early 1980's the global imbalance problem has accelerated and has
created several important problems in the United States and the world. One of the causes
of the global imbalance problem, specifically with trade deficits, is that since the 1970's
the U.S. manufacturing base has eroded. This has happened for several reasons,
including lower labor costs abroad and a strong demand for the U.S. dollar. A strong
dollar makes U.S. goods more expensive to the rest of the world, but makes foreign
imports cheaper. This less expensive foreign competition has added to the erosion of the
U.S.'s manufacturing base and is one of the reasons that foreign goods such as Chinese
imports are so cheap. The strong dollar also hurts U.S. exporters by making their goods
more expensive on world markets. As a result of these factors, the U.S. has run trade
deficits for almost 30 years.
Because U.S. manufacturers saw diminishing profit opportunities, the U.S.
economy gradually moved towards finance and services sector activities. Because the
U.S. does not export what it used to, it runs a large trade deficit, which means that the
U.S. is buying more than it is selling. The U.S. funds that gap by borrowing cheaply
from other nations, which contributes to the budget deficit. When other countries collect
dollars from the goods they sell to the U.S., they simply fund the purchases by buying
Treasury bonds with those dollars. This has allowed to U.S. to run both trade deficits and
budget deficits for the last 30 years. The cost has been accumulated debt and the erosion
of the manufacturing sector in the U.S.
This is part of what is called the problem of "global imbalances." Global
imbalances are the sustained existence of large current account deficits in one country
and large current account surpluses in another country. If one country continually runs a
current account deficit, it must be financed from either increased domestic savings, or in
the case of the United States, borrowing from other countries in the form of Treasury
bonds. The way we keep track of the financing flows is through the capital account. The
capital account shows the net financial flows of stocks, bonds, loans, foreign direct
investment (FDI), and reserves for a particular country.
The United States has a large current account deficit, which is financed through a
large capital account surplus, which means the U.S. borrows from foreigners to buy more
than it sells. Other countries like China have large current account surpluses due to the
nature of their export driven economy. The United States buys much of what China
produces. China takes that money and buys U.S. treasury bonds, allowing the U.S. to run
large budget deficits.
Because so many countries, including China, are dependent on the U.S. buying its
exports, because the U.S. is used to buying low priced imports, and because of the
international demand for the U.S. dollar, this system of global imbalances is likely to
persist and potentially worsen. Many economists see this as one of the fundamental
issues in the world economy today.

30
Austerity vs. Expansion: The Debate over the Deficit in the U.S.
Since the financial crisis and budget shortfalls brought about by the world
recession, the political debates in countries across the world have centered around
austerity vs. fiscal expansion. Austerity is a policy of deficit cutting that reduces public
expenditures to balance the budget, whereas fiscal expansion is the policy of increasing
budget deficits using Keynesian fiscal policy principles to alleviate short term economic
problems. Austerity measures are often undertaken in the context of falling revenues, or
during difficult economic times.
This has been an important political debate in the United States and in the rest of
the world, with conservatives generally arguing for the cutting of social programs to
balance the budget. Liberals generally argue for the expansion of social services in bad
economic times because that is when the demand is highest for services such as
unemployment, health programs, and general assistance programs. Keynesians argue that
when private spending falls government must increase spending to close the gap and
prevent the economy from further weakening. This fiscal stimulus can encourage
business and consumer optimism and shift out aggregate demand. Reducing government
spending, however, has the opposite effect. This can be seen in terms of the basic
macroeconomic equation:
Y = C + I + G + (X-M)
where Y is GDP, C is consumption, I is investment, G is government spending, and (X-
M) is net exports. In a recession, investment and consumption are both falling due to
decreased business expectations for businesses and high unemployment rates for
consumption. If both C and I are falling, and (X-M) is difficult to control, the only option
left to stabilize GDP is government spending. If government spending were also cut, that
would mean that C, I, and G would be falling at the same time! This would cause a
drastic reduction in aggregate demand, pushing the economy further into a recession.
The debate over austerity has been between those who believe that it is essential to
improve fiscal balance, even in bad economic times, and those who argue that promoting
economic recovery is more important, and may actually be more effective in lowering
budget deficits in the medium to long term, due to increased tax revenues from a growing
economy.
European Sovereign Debt Crisis
The European sovereign debt problem developed in a similar way to the 2008
financial crisis in the United States. A real estate bubble and excess bank leverage and
speculation caused a financial collapse when real estate prices could no longer sustain

31
themselves. Governments, forced with the choice of complete financial collapse or the
bailout of banks with public money, chose the latter.
The recession resulting from the financial crisis caused government revenues to
fall and expenditures to rise, increasing the deficit and debt levels. Austerity policies
then reduced demand further, worsening recessionary conditions. European governments
have been faced with problems similar to the U.S., including falling tax revenues,
increased expenditures, and a continued banking crisis, but Europe has been slower to
recover. Some argue that this slow recovery is a result of austerity policies in Europe, in
contrast to stimulative policies in the U.S. European deficits are shown in Figure 13.
Figure 13. European Budget Deficits
Source: www.oecd.org
There is a significant difference between the financial crisis, recession, and deficit
issues faced by the United States compared to the members of the European Union. The
European Union has a monetary union that conducts monetary policy for every country
collectively, but not a fiscal union that would allow similar coordination of Keynesian,
austerity, or other such policies. European countries conduct fiscal policy independently,
but must maintain a budget deficit of less than 3% of GDP and debt/GDP ratio of less
than 60% in order to meet the entry requirements for membership in the European

32
Union.5 The United States has no membership requirements to uphold and can run the
deficits necessary to boost short term aggregate demand. Because of this agreement,
members of the European Union have intense political pressure to impose austerity
measures to keep deficits and debt down.
The United States also has the privilege of having dollar hegemony, as well as a
Federal Reserve that is not accountable to other countries, and has a dual mandate to fight
both inflation and unemployment. The U.S. has the ability to employ countercyclical
fiscal policy and to use monetary policy such as lower interest rates and quantitative
easing to try to spur economic activity. The European Central Bank (ECB), in contrast, is
responsible for monetary policy that affects many countries, and has been focused on
fighting inflation, not promoting economic recovery.
Monetary policy that is good for Italy may not be good for Germany. For
instance, suppose Italy has high unemployment and Germany has low unemployment. If
the ECB lowered interest rates for everyone it would benefit Italy, but might burden
Germany's strong economy with inflation. Because of this the European Central Bank
follows a singular mandate to control inflation and avoid country favoritism, but it has
done relatively little to stem extremely high rates of unemployment, especially in the
Southern European countries: Spain, Portugal, Italy, and Greece.
When deficits started to increase as a result of recessionary forces, bondholders
became increasingly worried about the low growth rates in countries like Spain, Italy,
Portugal, Greece, and Ireland. These bondholders are those who were defined above as
"bond vigilantes." As a result of what bond holders perceived as danger of default,
potential buyers required a higher yield to compensate for the risk on government bonds.
This made issuing and rolling over debt very expensive, which added to the fiscal
problems of these countries.
Low growth rates and high debt/GDP ratios mean that countries may not be able to
pay back their debt. Many countries find that the only means of lowering interest rates is
to impose austerity to balance the budget. This can initiate a vicious cycle, because as
austerity is imposed, growth rates worsen, which accelerates the risk and inhibits the
ability of the government to raise revenue and pay interest on debt.
Austerity measures have created extensive social unrest, particularly in Greece
from 2010-2012 as many voters reacted negatively to social programs being cut while
public money was used to bail out banks due to the financial crisis. Many citizens would
rather see their country default on their debt than have retirement pension and social
programs cut as a result of a banking crisis for which they were not responsible.
5 This is according to the European Union’s Stability and Growth Pact.

33
Balanced Budget Amendment and PAYGO
Currently it is not legally required for the U.S. Congress to balance the budget.
This means that Congress has the ability to run deficits as it sees fit. Since the creation of
the Constitution there has been discussion about creating a constitutional amendment to
prohibit Congress from running deficits. Before 1929, deficits generally only existed
during wartime, so there was no political will to enact an amendment. Since the Great
Depression and the "invention" of macroeconomics, deficit spending has been
commonplace in the U.S. and around the world. The first attempt at a constitutional
amendment came in 1936, as an effort to curb New Deal deficit spending.
A constitutional amendment seems to become politically popular every time
deficits get too large. Proponents of a balanced budget amendment argue that it would
force Congress to keep the budget balanced, and would prevent potentially inflationary
effects of deficit spending. The negative outcome would be that the Federal Government
could not use countercyclical policy to fight recessions.
Most states have a balanced budget amendment and have the disadvantage of
having to cut services and government employees during a recession. Often the Federal
Government will provide state aid to allow states to minimize the cost cutting in an
attempt to prevent the economy from getting worse. A balanced budget amendment
would impose these same constraints upon the Federal Government.
Under a balanced budget amendment, when a recession hits and revenue falls
because of less tax collection, the Federal Government would be forced to cut services
and spending when people need it most. A balanced budget amendment essentially
imposes austerity on the Federal Government. One potential benefit of a balanced budget
amendment would be that government cannot imprudently run deficits in good economic
times, which can have an inflationary effect by shifting out the aggregate demand curve
to the right, pushing prices higher.
Another option that does not require a constitutional amendment, and that has
been used in the past is the PAYGO, or “Pay As You Go” system. As described above in
Section 3, PAYGO requires new spending to be offset either by other spending cuts or by
new revenues. PAYGO was instituted in 1990 during the George H.W. Bush
administration and continued during the Clinton administration, but abandoned during the
George W. Bush administration as a result of recession and tax cuts which led to rising
budget deficits. PAYGO was enacted again by a Democratic Congress in 2007, but as
the 2007-9 recession hit, PAYGO once again became unrealistic. Since PAYGO seems
ineffective and a balanced budget amendment seems too drastic, the debate over how to
limit deficits continues, often with great political acrimony.

34
Deficit Projections and Solutions
Every year the Congressional Budget Office creates budget forecasts based on
economic trends, expiring or new tax laws, and off-budget program projections, in order
to forecast the future fiscal needs of the country. The Congressional Budget Office
forecasts are widely used to help Congress and other interested parties make decisions
about government budgets.
The CBO estimates that by 2015 the deficit will reach 2% of GDP, which is below
the historical average of 3.1% over the past 40 years. Much of this reduction in the
deficit is due to the recovery of the business cycle. However, deficits are expected to stay
relatively high after 2015 due to several long term trends.
Figure 14. CBO Deficit Projections
Source: CBO Updated Budget Projections: Fiscal Years 2013 to 2023 (May 2013)
http://www.cbo.gov/publication/44195
The CBO identifies four primary reasons that the deficits will increase, assuming
that major laws or the budget do not change. The four factors are an aging population,
rising health care costs, an expansion of federal subsidies for health insurance, and
growing interest payments on the federal debt. Three of these four factors are health care
related, which illustrates the importance of health care in any budgetary reforms. As the
baby boom generation gets older, a significant portion of the population will have higher
health care costs. General health care costs have been rising faster than other costs which
strains programs like Medicaid, Medicare, and even Social Security. Recent health care
reforms (the Affordable Health Care Act of 2010), have allocated more spending to
health care to try to cover the current 50 million (approximately) uninsured U.S. citizens,
but have also included some cost controls.

35
Box 3: You Cut the Budget
Using several budget cutting plans, the New York Times put together a "deficit
puzzle" that allows people to try to cut the deficit themselves. It's easy to talk about
balancing the budget, but anything you cut affects someone or some governmental
organization. So what's it going to be? Try to think about your political constraints, and
how groups of voters will view you. Do your budget cuts hurt people? Do they affect
your electability?
The puzzle was made in 2010, so as time passes the numbers will change. But the
ideas of what to cut, and the problems involved in cutting them will not. What would you
do? The interactive puzzle can be viewed here:
http://www.nytimes.com/interactive/2010/11/13/weekinreview/deficits-graphic.html
When debt levels increase, political pressure intensifies to balance the budget.
After the 2008 financial crisis ballooned the fiscal deficits of the U.S., in 2010 President
Obama commissioned a non-partisan budget committee whose responsibility it was to
provide deficit reduction solutions. The committee was called the National Commission
on Fiscal Responsibility and Reform, also known as the Simpson-Bowles plan after the
two people who ran the commission, and is summarized below in six points:6
1) Reduce discretionary spending by $200 billion per year by reducing defense
procurement by 15%, closing one third of overseas bases, eliminate all earmarks from
congressional bills, and cut the Federal workforce by 10%.
2) Increase revenues by $100 billion per year through an increase in the Federal
gasoline tax of $0.15 per gallon, and the elimination of deductions and exemptions
from the tax code.
3) Lower healthcare costs by capping Medicaid.
4) Reduce Social Security costs by raising the retirement age and increasing the
income exemption cap on social security taxes (currently you do not pay social
security over $106,800 on your income).
5) Eliminate farm subsidies, military federal pensions, and student loan subsidies.
6) Cut the corporate tax rate to 26% from 35%, and lower and simplify the income tax
brackets.
The plan was not approved by Congress due to the large cuts to entitlement
spending and the disagreement over raising tax revenues, closing loopholes, and cutting
corporate and income tax rates.
6 http://www.fiscalcommission.gov/sites/fiscalcommission.gov/files/documents/TheMomentofTruth
12_1_2010.pdf

36
Debt Ceiling, Fiscal Cliff, and Budget Sequestration
In recent years the debt ceiling has become an important economic and political
topic. A debt ceiling is a restriction on the amount of national debt that can be issued by
the Treasury department. Since Congress authorizes spending through legislation, the
debt ceiling does not restrict deficits or Congress’s ability to spend; it only restricts the
Treasury Department’s ability to pay for the expenditures that have already been
incurred. In 2011, Congress was unable to reach an agreement to raise the debt ceiling
due to concerns about deficit spending and political deadlock between a Republican
House and a Democratic President and Senate.
This near default on U.S. treasury debt resulted in a downgrade of the U.S. credit
rating (see Box 2) and had the potential to cause domestic and international financial
turmoil. Congress finally raised the debt limit with the Budget Control Act of 2011
which delayed the debt ceiling until December 31st, 2012. This date became known as
the fiscal cliff, a combination of tax rate increases (mainly the expiration of the Bush tax
cuts) and decreases in government spending, which according to the Congressional
Budget Office would have potentially led to renewed recession.
The fiscal cliff solution came in the form of the American Taxpayer Relief Act of
2012, which was enacted January 2nd 2013. The act made several changes to the tax
code, including:
1) Individuals making over $400,000 ($450,000 for married couples) had their tax
rate increased from 35% to the pre-Bush levels of 39.6%.
2) The top marginal tax rate on long term capital gains increased to 20% from the
Bush levels of 15%.
3) The top marginal tax rate on dividends, which had pre-Bush levels of 39.6%, were
instead increased from Bush levels of 15% to 20%.
4) The elimination of deductions for higher income earners.
5) The estate tax increased from 35% to 40% over the value of $5,120,000.
When President Obama signed the Budget Control Act of 2011 to avert the debt
ceiling crisis, part of this act required a "super committee" be formed to provide deficit
reduction legislation to reduce the deficit by $1.2 trillion over 10 years. The super
committee was unable to agree on a final proposal which activated another part of the
Budget Control Act requiring automatic cuts to kick in across the board (both in defense
spending and domestic spending) if new legislation was not created. These automatic
across-the-board cuts are known as budget sequestration. The "sequester", as it become
known, began in March of 2013 and has been a source of economic and political tension
due to its indiscriminate nature. In late 2013, lawmakers reached a budgetary agreement
that relaxed some parts of the sequester.

37
Conclusion
Policy makers face difficult decisions in the coming years in dealing with deficit
and debt related issues. All of the policy decisions imply tradeoffs that make simple
solutions more complicated than they seem. To reduce the deficit now means imposing
austerity programs that hurt current GDP and economic recovery. Expanding debt
indefinitely means a higher percentage of spending in the future goes to servicing the
debt, which could result in higher taxes.
Each member of Congress has their own political constrains and constituents’
issues to take into account, which adds to the difficulty of creating a bi-partisan deficit
and debt solution plan. These are some of the reasons that as of early 2014, no clear short
or long term solution has yet emerged to the debt and deficit issues; indeed there is not
even a clear consensus on the extent of the problem. Fortunately, the rapid reduction in
the deficit during 2013 lessened the economic and political pressures associated with
these issues. Economic analysis, as presented in the discussion above, suggests that the
debt and deficit problem are both manageable and solvable as long as policy makers take
a long term perspective in their legislation and that they are willing to compromise.
Discussion Questions
1) Explain how global imbalances are in part caused by the U.S. dollar being used as the
world reserve currency. What are the advantages and disadvantages this gives to the
U.S.?
2) In your opinion, is the austerity debate about economics or about politics? Explain
how the austerity debate could be largely political. Make sure to include all arguments
from the section.
3) What are the fundamental differences between the ability of the U.S. to handle the
financial crisis and the European Union to handle the crisis? Why does this put extra
pressure on Europe for austerity?

38
KEY TERMS
austerity: a policy of deficit cutting that reduces public expenditures and/or raises taxes
to balance the budget
automatic stabilizers: programs of government spending that automatically increase
during downturns in the business cycle
budget deficit: the total amount at a given time that the Federal Government has
borrowed and still owes
budget sequestration: automatic cuts to Federal spending
budget surplus: the amount by which revenues exceed expenditures in a given year
countercyclical policy: the budgeting strategy where deficits are run in bad economic
times and surpluses are run in good economic times, ideally balancing the budget over
several years
crowding out: a reduction in the availability of private capital resulting from federal
government borrowing to finance budget deficits
crowding in: the process by which government spending increases expectations of the
economy due to multiplier effects, thereby inducing investment
cyclical deficits: the portion of the deficit that is caused by fluctuations in the business
cycle
current account: consists of the trade deficit or surplus (exports minus imports), factor
income (earnings on foreign investments minus payments made to foreign investors), and
cash transfers
capital account: shows the net financial flows of stocks, bonds, loans, foreign direct
investment (FDI), and reserves for a particular country
debt ceiling: a restriction on the amount of national debt that can be issued by the
Treasury department
debt service: the combination of interest and principal repayment on a debt
discretionary spending: spending that requires an appropriations bill from congress
39
endogenous money: an economic theory stating that the money supply is determined
within the economic system, and not solely by the Central Bank
fiscal expansion: a policy of increasing budget deficits to alleviate short term economic
problems
fiscal cliff: an increase in tax rates and a decrease in government spending due to the
Budget Control Act of 2011, modified by the American Taxpayer Relief Act of 2012
global hegemon: the dominant military and economic power in the world
global imbalances: the existence of large current account deficits and large current
account surpluses in different parts of the world, which many economists believe to be
unsustainable
mandatory spending: spending on existing programs that are required by law such as
Social Security and Medicare
monetize the debt: when a central bank buys government debt as it is issued (equivalent
to printing money)
multiplier effect: the aggregate effect of a change in an economic variable on total
output
national debt: the total amount borrowed and owed by the Federal Government
off budget expenditures: government funded programs that are exempt from the normal
budgeting process because they have their own sources of funding separate from
congressional appropriation
on budget expenditures: all federal expenditures that rely on general tax revenue subject
to congressional approval each year
structural deficits: the portion of the deficit (or surplus) that results from tax and
spending policy dictated by the president and Congress at their discretion

40
REVIEW QUESTIONS
1) What is the difference between the national debt and a deficit?
2) What is the difference between discretionary spending and mandatory spending?
3) What is the difference between off budget and on budget expenditures? Provide
examples of each.
4) What years were debt/GDP levels the highest in the United States? What years were
the lowest?
5) What years were deficits/GDP the highest in the United States? What years were the
lowest?
6) What is a cyclical deficit? What is a structural deficit? How are they different?
7) What is crowding out? How specifically does crowding out happen? Explain.
8) What is crowding in?
9) What is endogenous money? How does this relate to crowding out?
10) What was Hamilton's vision for the U.S. national debt? Why did he feel it was so
important?
11) What was the opposing view of Jefferson, Adams, and Madison? How did they
argue against the creation of a national debt?
12) What was the New Deal, and how did it relate to deficit spending?
13) What are the two aspects of Reaganomics?
14) Describe the “starve the beast” strategy. Do you think this would be an effective
strategy for reducing government spending?
15) What are the 4 reasons that the surplus of the Clinton administration turned into a
deficit in the following Bush administration?
16) Summarize some of the problems with government debt.
17) Refer to Box 1. What are the benefits of running budget deficits?
18) Why did Greece's bond rates get so high after 2010?
19) What does it mean to monetize the debt?
20) According to Table 4, who had the highest debt/GDP ratio in 2012?

41
21) What is a global hegemon?
22) When did the U.S. become the global hegemon?
23) What is austerity? What is fiscal expansion? How are they at odds?
24) According to the Simpson-Bowles plan, what are the six broad ideas for cutting
deficits over the next 10 years?
25) What are the pros and cons to a balanced budget amendment?
26) What is the debt ceiling? What is the fiscal cliff? How are they related?
EXERCISES
1) List the percentage of each given government expenditure:
Expenditure Percentage
Social Security
Defense
Non-Defense
Medicare
Income Security
Medicaid
Retirement and Disability
2) What is countercyclical policy, and how can government use it to both balance the
budget and combat economic recession?
3) Suppose country A had government debt of 12 trillion dollars, and country B had a
government debt of 8 trillion dollars. Is it correct to say that country A has the worse
debt problem? Why or why not?
4) Draw a business cycle graph and show in general what happens to interest rates at
different points in the cycle. Assume that everything else in the economy is held
constant.
5) During the 2008-2010 recession, budget deficits were very high yet interest rates were
low. According to crowding out theory, interest rates should be rising as a result of high
budget deficits. What other factors may affect interest rates in a recession besides a
budget deficit?

42
6) True or False:
a) Alexander Hamilton though that a national debt would provide aristocratic
bondholders with a financial incentive for the U.S. to succeed as a nation.
b) James Madison was strongly in favor of repaying revolutionary war debt.
c) The U.S. Government almost always ran budget deficits before 1929.
d) In 1933, Franklin D. Roosevelt ran on a platform of budget deficits to help the
economy.
e) George W. Bush balanced the budget during his presidential tenure (2000-2008).
7) Refer to Table 2, showing surplus or deficit levels since the Great Depression, to
identify the Presidential terms with the highest deficits, and also the brief periods of
surplus. What do you think accounts for these variations?
8) Draw and the label a Laffer curve. Now use the graph to explain the argument that
cutting taxes can actually increase government revenue. What are some problems with
this analysis?
9) Who was the global hegemon before the U.S.? This will require you to do some
reading or internet searches outside of this module.
10) Refer to Box 3, and complete the NY Times exercise by balancing the budget. In 2-
3 paragraphs, explain what you cut, why you cut it, and what the potential political fallout
will be (remember, you have to get re-elected). What groups will you anger? Who are
you hurting economically?