debt, bankruptcy risk, and corporate tax sheltering nse working paper debt, bankruptcy risk, and...
TRANSCRIPT

WP/14/2014
NSE WORKING PAPER
Debt, Bankruptcy Risk, and Corporate Tax
Sheltering
Akanksha Jalan, Jayant R. Kale, and Costanza Meneghetti
December 2014

2
NSE Working Paper
Debt, Bankruptcy Risk, and Corporate Tax Sheltering
Prepared by Akanksha Jalan, Jayant R. Kale, and Costanza Meneghetti*
December 2014
Abstract
We examine the effect of bankruptcy risk and leverage on corporate incentives to shelter
income from taxes. We derive the optimal level of sheltering for a levered firm in a two-date,
single-period model in which a firm‘s perquisite-consuming manager with an equity stake in
the firm maximises her/his payoff. The theory predicts that sheltering relates negatively to
bankruptcy risk, leverage, and the manager‘s bankruptcy costs, and it relates positively to the
manager‘s equity stake in the firm. Moreover, the theory predicts that the negative relation
between leverage and sheltering becomes weaker as the manager‘s equity stake increases.
Our empirical tests provide evidence that is consistent with these theoretical predictions.
Leverage and bankruptcy risk relate negatively to sheltering, whereas greater managerial
ownership increases sheltering and weakens the negative sheltering-leverage relation.
Further, we show that the negative effects of bankruptcy risk and debt on sheltering are
stronger for riskier firms and weaker for larger, better governed, more profitable firms, and
for firms that are in the public eye. We show that while a change in bankruptcy law in 2005
that enhanced creditor rights in the event of bankruptcy decreased the sheltering levels, it
weakened the negative sheltering-leverage relation. Finally, our analysis indicates that tax
sheltering reduces firm value.
*
Akanksha Jalan (corresponding author) is at the Indian Institute of Management Bangalore, Bannerghatta
Road, Bangalore – 560076, India; e-mail: [email protected]. Jayant R. Kale is the Philip R. McDonald
Chair and Professor of Finance, D‘Amore-McKim School of Business, Northeastern University, Boston, MA –
02115; e-mail: [email protected]. Costanza Meneghetti is at the Department of Finance, West Virginia University,
Morgantown – 26506; e-mail: [email protected]. This research was supported in part by the National
Stock Exchange, Mumbai, India under the Commissioned Research Initiative. We acknowledge the helpful
comments received from Vikas Agarwal, Rajesh Aggarwal, Lixin Huang, Chip Ryan, Baozhang Yang, and the
seminar participants at Georgia State University and the Indian Institute of Management Bangalore. The views
expressed in the paper are those of the authors and do not necessarily reflect the opinion of the National Stock
Exchange of India Ltd.

3
Debt, Bankruptcy Risk, and Corporate Tax Sheltering
Any one may so arrange his affairs that his taxes shall be as low as possible; he is not
bound to choose that pattern which will best pay the Treasury; there is not even a
patriotic duty to increase one's taxes.
Judicial Opinion, Judge Learned Hand, Helvering v.
Gregory, 69 F.2d 809, 810-11 (2d Cir. 1934)
Over and over again courts have said that there is nothing sinister in so arranging
one's affairs as to keep taxes as low as possible. Everybody does so, rich or poor; and
all do right, for nobody owes any public duty to pay more than the law demands:
taxes are enforced exactions, not voluntary contributions.
Judicial Opinion, Judge Learned Hand,
Commissioner v. Newman, 159 F2d 848 (1947)
1. Introduction
The incentive to avoid paying income taxes is understandable since more than a third of a
firm‘s profits could potentially be taken away by the state through taxes. Over the last two
decades, U.S. corporations have turned their tax departments into active profit centres with
annual targets for effective tax rates and tax savings (Clark et al., 2000; Hollingsworth,
2002); therefore, determining ways to shelter income in order to avoid taxes is the primary
activity of these departments. Theoretical papers that examine a firm‘s optimal level of
income sheltering (e.g., Slemrod, 2004; Desai and Dharmapala, 2009) typically consider an
all-equity firm that offsets the tax benefits of sheltering with the expected costs of sheltering.
Sheltering activities need not necessarily be deemed illegal by regulatory authorities.
Therefore, the expected costs of sheltering are determined by the probability of detection, the
potential penalties if found guilty, and the loss of reputation and prestige. In this paper, we
consider a levered firm and examine the role of bankruptcy risk on the determination of its
level of tax sheltering. The rationale is that when firms enter bankruptcy (or possibly even
simply experience financial distress), they are subject to greater scrutiny by creditors,
regulators, and even the media, which should reveal sheltering activities. We propose that
bankruptcy risk acts as a deterrent to the sheltering of income from taxes.
A firm‘s bankruptcy risk can increase if it takes on more debt in its capital structure and/or
invests in assets that generate riskier cash flows. In order to assess the effects of both these
aspects of bankruptcy risk, we theoretically and empirically examine how a firm‘s level of
sheltering relates to the level of debt in its capital structure as well as to its probability of
default. We extend the existing theoretical frameworks that model an all-equity firm by

4
considering a levered firm, which enables us to introduce bankruptcy risk into the analysis;
we show that greater bankruptcy risk may be associated with a firm‘s optimal level of
sheltering. In addition to affecting a firm‘s sheltering level through bankruptcy risk, there are
other ways in which the presence of risky debt in the firm‘s capital structure can affect its
ability to shelter income. First, interest payments on debt reduce taxable income and thereby
reduce the incentive to shelter income. Second, since the benefits of sheltering do not accrue
in bankruptcy, there are fewer states in which the firm can shelter income. Third, since
creditors such as banks and institutional debtholders monitor the activities of a firm, the
ability of the firm to shelter income is likely to be reduced. We attempt to include bankruptcy
risk and these aspects of debt financing in our theoretical and empirical analyses.
We derive the optimal level of sheltering for a firm with a given level of debt in a simple
two-date, single-period model in which a firm manager with an equity stake in the firm
maximises her/his payoff. The debt in the firm is risky; therefore, bankruptcy is possible. We
assume that bankruptcy is more costly to the manager since she/he bears additional personal
and possibly non-pecuniary costs if the firm goes bankrupt. Further, only the manager
observes the true cash flow; others observe only the cash flow that is reported by the
manager.
We assume that the manager determines ex ante the optimal amount to shelter in the next
period. This assumption is reasonable since shelters are sophisticated financial products that
require considerable time to materialise and generate benefits. The sheltering decision is
made before the cash flows are realised; moreover, outsiders (including debtholders) observe
only the reported cash flows that have been reduced by sheltering. Therefore, greater
sheltering increases the number of states in which the firm is bankrupt. Further, all sheltering
activities would be revealed if the firm went bankrupt, and all the benefits from sheltering
would be lost.1
The firm‘s manager owns an equity stake in the firm. Thus, she/he can shelter income from
taxes, which would benefit all the shareholders; however, she/he can also divert part of the
sheltered income for her/his sole use. We assume that diversion by the manager happens only
out of sheltered income and that bankruptcy is more costly to the manager. Therefore, on the
1 There are several reasons to assume that it is difficult for the manager or the firm to retain the benefits of
sheltering in a state of bankruptcy. First, in bankruptcy, all payments to the firm‘s executives become subject to
the approval of the bankruptcy court. Further, since the IRS is a senior claimant on the assets of the bankrupt
firm, taxes shown to be ―evaded‖ must be returned to the IRS, i.e., there can be no waiver of such dues. Second,
anecdotal evidence indicates that bankrupt or financially troubled firms (e.g., Enron) are subject to greater
scrutiny; therefore, it is likely that tax avoidance activities will be revealed.
5
one hand, the manager would want to shelter more in order to be able to divert more; on the
other hand, she/he must shelter only up to the point where the risk of bankruptcy is not too
high. Thus, the optimal sheltering level chosen by the manager is a trade-off between the
costs associated with the increased likelihood of bankruptcy and her/his benefits in the form
of tax savings (accruing to her/him because she/he owns equity) as well as diverted income.
We show that the optimal level of sheltering decreases with the level of debt as long as the
increase in the likelihood of bankruptcy is sufficiently high. Further, we show that the
optimal level of sheltering in a levered firm increases with the manager‘s equity ownership
only as long as the increase in the likelihood of bankruptcy is not too high. An increase in the
manager‘s personal costs in bankruptcy, however, unconditionally reduces tax sheltering. We
obtain these three results in a setting with minimal restrictions on a firm‘s cash flow
distribution. We then assume that the firm‘s cash flows are uniformly distributed, which
allows us to explicitly determine the optimal sheltering level and demonstrate a key result of
our paper, namely, that an increase in bankruptcy risk reduces the optimal level of sheltering.
Further, we show that increasing the manager‘s equity stake in the firm weakens the effect of
debt on sheltering. In other words, the negative relation between debt and sheltering becomes
less negative as the manager‘s equity ownership increases.
We test all the predictions of our theory on a large sample of U.S. firms over the period
1986–2012; we find the results are largely consistent with our predictions. We find that the
level of sheltering relates negatively with leverage and the manager‘s bankruptcy costs;
however, it increases with the alignment incentives of the firm‘s CEO. Further, our analysis
indicates that, in general, tax sheltering activities reduce firm value.
Our theoretical framework assigns a crucial role to bankruptcy risk, and our empirical
analysis includes a number of tests to validate this role. Since leverage may affect sheltering
through channels others than bankruptcy risk, we construct a variable that measures a firm‘s
bankruptcy risk more directly, namely, a firm‘s probability of default using the method
proposed in Bharath and Shumway (2008). In support of our framework, we find strong
evidence of a negative relation between sheltering and the probability of default. In further
support of the importance of bankruptcy risk, we find that the negative effects of the
probability of default and debt on sheltering are significantly amplified in firms that have
riskier cash flows. Additionally, we find that the negative leverage-sheltering relation is
weaker for larger, better governed, and more profitable firms as well as for firms that are in
the public eye.

6
The negative effects of leverage and the probability of default on sheltering are robust to
alternative measures of sheltering and leverage as well as to the inclusion of firm and
industry fixed effects to control for endogeneity arising from time-invariant unobserved
variables. To show that these relations are also robust to corrections for endogeneity arising
from time-varying unobserved variables, simultaneity of leverage and tax sheltering, and
reverse causality, we show that they hold in a quasi-natural experimental setting that uses
changes in the U.S. Bankruptcy Code, i.e., the Bankruptcy Abuse Prevention and Consumer
Protection Act (BAPCPA) of 2005. This Act heightened the scrutiny of firms in
distress/bankruptcy and increased creditor power, which improved creditors‘ expected cash
flows during bankruptcy. We argue that the passage of the BAPCPA produced two effects.
First, greater scrutiny brought about by the Act had the direct effect of reducing tax sheltering
by firms. Our empirical tests offer strong support for this hypothesis as we find a significant
decline in the level of sheltering in the years after the BAPCPA was passed (henceforward,
―post-BAPCPA years‖).
Second, we hypothesise that since the BAPCPA improved the value of creditors‘ claims
during bankruptcy, it reduced the creditors‘ incentives to monitor firms. The underlying
rationale is that creditors are much more concerned about the value of a firm‘s assets during a
state of bankruptcy than during non-bankruptcy. Thus, by improving their claims during
bankruptcy, the BAPCPA reduced the creditors‘ incentives to monitor firms. In support of
this hypothesis, we find that while the BAPCPA reduced the level of sheltering, it also
weakened the efficacy of debt as a monitoring mechanism. We show that the negative
relation between leverage and sheltering became less negative in the post-BAPCPA years.
Further, we find that the negative relation between the probability of default and sheltering is
unaffected by the passing of the BAPCPA. Since the probability of default is less likely to be
linked to monitoring, this finding offers (indirect) support for our hypothesis that the
creditors‘ incentive to monitor was lower after the BAPCPA was passed.
The term tax sheltering has specific connotations in our setting. Hanlon and Heitzman (2010)
define tax avoidance to be a continuum of activities that enable corporations to reduce taxes.
At one extreme of this continuum are perfectly legal activities (such as the purchase of tax-
exempt bonds); at the other end, are egregiously abusive tax-saving transactions (such as the
use of prohibited tax-shelter products, transfer mispricing etc.), which will certainly result in
fines and penalties if detected by the IRS. The activities that we refer to as tax sheltering fall
between these two extremes. These activities are generally based on a weaker set of facts and

7
are often undertaken after a rigorous reading of the tax laws. Therefore, it is a priori not clear
whether these activities will be deemed illegal or even detected.2
The main contribution of our paper is to highlight the roles of bankruptcy risk and corporate
leverage as significant determinants of tax sheltering. Additionally, we explicitly consider a
manager‘s incentives to divert a portion of the sheltered income for personal consumption. To
the best of our knowledge, there is no theoretical paper that considers both these aspects.
Slemrod (2004) was one of the first theoretical papers to highlight the need for analysing the
corporate tax avoidance decision in an agency-theoretic framework; however, this study did
not consider the role of debt.3 Desai et al. (2007) presented a theoretical framework to explain
the cross-sectional variation in managerial diversion. Since they modelled an all-equity firm,
they could not offer insights into the effects of bankruptcy and shareholder-bondholder
agency problems on tax aggressiveness. While Joulfaian‘s working paper (2011) di include
debt in the analysis, it ignored the shareholder-bondholder agency problem. Desai and
Dharmapala (2009) analysed tax avoidance as a function of the efficacy of a firm‘s corporate
governance; however, they did so from the perspective of all-equity firms alone.
Our empirical analysis contributes to the existing literature in two ways. First, we are not
aware of any empirical study that considers the role of bankruptcy risk in tax sheltering. Ours
is likely the first study to show that there is a negative relation between tax sheltering and
bankruptcy risk as measured by a firm‘s probability of default. Second, prior empirical
studies generally included leverage only as a control variable to explain the cross-sectional
determinants of tax avoidance/aggressiveness; therefore, there is only indirect evidence about
how the presence of debt affects sheltering.4 Further, the existing evidence is mixed. For
example, Rego and Wilson (2012) found that firms with high leverage ratios are associated 2 Corporate tax shelters are examples of tax aggressiveness. The U.S. Government Accountability Office defines
abusive tax shelters as ―very complicated transactions promoted to corporations and wealthy individuals to
exploit tax loopholes and provide large, unintended tax benefits.‖ The IRS detects such a shelter only after it has
been used by many and has resulted in significant reduction in tax collection. 3 Following Slemrod (2004), Chen and Chu (2005) studied corporate tax evasion and showed that when
avoidance is costly to the manager, the optimal wage contract of the principal-agent framework turns out to be
inefficient. Crocker and Slemrod (2005) used a costly state falsification framework and demonstrated that
penalties on tax evasion imposed directly on the tax manager are more effective in curbing evasion that those
imposed on the firm. 4 Hasan et al. (2013), however, considered a rather different aspect of the relation between leverage and tax
avoidance. Their study showed that firms that have higher levels of tax avoidance incur a higher cost for bank
debt. While the negative effect of debt on tax avoidance that we show is not inconsistent with the finding
reported in Hasan et al. (2013), our approach differs from theirs in an important way. We propose and
empirically show that higher leverage results in lower tax aggressiveness, whereas Hasan et al. (2013) implicitly
assumed the opposite direction of causality. While these two approaches are not mutually exclusive, we believe
that a firm‘s capital structure is likely to be a long-term decision whereas tax avoidance decisions will vary from
period to period. In other words, it is more likely that the managers take decisions related to tax avoidance
activities taking the firm‘s leverage for granted.

8
with lower effective tax rates, which is consistent with higher tax avoidance. Wilson (2009)
and Lisowsky (2010), on the other hand, provided evidence that tax shelter firms are
associated with lower leverage ratios. Our empirical findings add several empirical insights to
this strand of literature. First, we provide strong evidence for a negative relation between tax
sheltering and leverage. Second, by showing that the negative leverage-sheltering relation is
weaker for high-risk firms, we highlight the importance of bankruptcy risk as a channel by
which leverage affects sheltering.
Our study also contributes to the literature that examines the relationship between corporate
governance and tax avoidance.5 Following Slemrod (2004), there were several papers on the
interaction of firm-level corporate governance with the decision to avoid taxes (e.g., Desai
and Dharmapala, 2006; Desai et al., 2007; Armstrong et al., 2012; Rego and Wilson, 2012).
Citing examples of firms such as Enron, Parmalat, and Tyco, researchers have argued that
strong complementarities exist between tax avoidance and managerial rent-seeking
behaviour. The cost of indulging in one reduces the cost of the other (Desai, 2005; Desai and
Dharmapala, 2006; Desai et al., 2007). Desai and Dharmapala (2009) addressed the issue of
whether tax avoidance activities advance shareholders‘ interests. They argued that while tax
avoidance may enhance shareholder value by saving tax outflows, such savings may be offset
by higher opportunities for managerial diversion of the firm‘s resources. Further, they
suggested that better-governed firms are more likely to be able to retain the benefits of tax
avoidance. Their empirical tests support the hypothesis that tax avoidance enhances firm
value only in well-governed firms. This is consistent with Wilson‘s (2009) finding that the
benefits of engaging in tax shelters accrue only to the shareholders of well-governed firms.
Some researchers propose that firms, like individuals, differ in their preferences for
undertaking risky tax avoidance, and they have stressed the need to identify the determinants
5 The link between tax avoidance and corporate governance dates back to the year 1909, when corporate income
tax was introduced in the U.S. One of the key reasons for introducing the new tax on corporate income was to
address corporate governance issues. There were concerns that corporations would not provide accurate
financial information to shareholders as there was a marked absence of effective corporate governance
mechanisms. Since tax returns had to be filed on a regular basis, the verification of a firm‘s true income became
much easier (at that time, tax returns were public documents). President William Taft, in his June 16, 1909
speech on the introduction of corporate taxation said, ―Another merit of this tax (the federal corporate excise
tax) is the federal supervision which must be exercised in order to make the law effective over the annual
accounts and business transactions of all corporations. While the faculty of assuming a corporate form has been
of the utmost utility in the business world, it is also true that substantially all of the abuses and all of the evils
which have aroused the public to the necessity of reform were made possible by the use of this very faculty. If
now, by a perfectly legitimate and effective system of taxation, we are incidentally able to possess the
Government and the stockholders and the public of the knowledge of the real business transactions and the gains
and profits of every corporation in the country, we have made a long step toward that supervisory control of
corporations which may prevent a further abuse of power.‖

9
of tax avoidance (Slemrod, 2004; Hanlon and Heitzman, 2010). Our study contributes to this
literature by highlighting the role of leverage as an important determinant of tax aggressive
behaviour.
Our findings on the relation between managerial equity ownership on tax sheltering add to
the literature by highlighting the importance of debt in this relationship. Desai and
Dharmapala (2006) found that higher incentive compensation reduces tax avoidance and that
this relationship is driven primarily by poorly governed firms. This is in contrast to the
findings of Hanlon et al. (2005) and Rego and Wilson (2012), who reported a positive
association between equity risk incentives and tax aggressiveness but found no variation in
terms of firm-level corporate governance. Armstrong et al. (2012) provided evidence that a
CEO‘s equity risk incentives are positively associated with tax avoidance primarily in the
right tail of the tax avoidance distribution. Our findings add to this literature by showing that
the negative leverage-sheltering relation is weaker when the CEO has greater alignment
incentives; further, alignment incentives appear to have no effect on sheltering in the absence
of debt.
Finally, our empirical results contribute to the literature on the role of debt as a monitoring
mechanism. Debt helps to discipline management because default allows creditors the right to
force the firm into bankruptcy (Harris and Raviv, 1990). Prior studies have shown that while
bankruptcy is costly to the firm (Ang et al., 1982; Altman, 1984; Lawless and Ferris, 1997;
Altman and Hotchkiss, 2006), it is ―costlier‖ to the manager because she/he bears non-
pecuniary costs (Gilson, 1989; Gilson and Vetsuypens, 1993; Hotchkiss, 1995; Ayotte and
Morrison, 2009). Some studies examined the monitoring role of debt and debtholders‘
involvement in firm governance (Gilson, 1989; Gilson and Vestyupens, 1993; Kroszner and
Strahan, 2001; Nini et al., 2012). Our finding that the presence of debt is associated with
lower levels of tax sheltering identifies another aspect of the monitoring role of debt.
The rest of this paper is organised as follows: Section 2 presents the model, Section 3
discusses the data sources, Section 4 presents the univariate statistics, Section 5 summarises
the empirical results, and Section 6 offers some concluding remarks.
2. The Model
Consider an all-equity firm that has access to an investment opportunity that requires an
investment of I at time t = 0, which we assume must be raised through debt with face value

10
D. The debt must be repaid at time t = 1, when the payoffs from the investment are realised
and the firm ceases to exist. Debt is risky since the payoff y may not be sufficient to repay the
debt in full. For simplicity and given the single-period framework, we assume that default
leads to bankruptcy and necessarily implies liquidation under Chapter 7 of the U.S.
Bankruptcy Code, and that reorganisation under Chapter 11 is not feasible. All agents are risk
neutral, and the risk-free rate is zero.
The stochastic payoff from investing I is y, which has a cumulative distribution function F(.)
and a density function f(.). We assume that the cash flow y from the project is uniformly
distributed over the interval [(a – θ), (a + θ)], where a is the expected value and θ the
dispersion parameter. For (a – θ) < y < (a + θ), the density function f(.) is 1/θ, the cumulative
density function F(y ≤ x) is [x - (a - θ)]/θ, and the hazard function h(x) is 1/{(a + θ) - x}. We
assume that D < (a - θ), so that without sheltering, the firm never defaults. Further, we
assume that the true payoff y is observable to the manager alone. This is an important
assumption; without it, the manager will not have the incentive to shelter income from taxes
and/or divert funds for personal consumption because these activities will be readily detected.
This assumption is common in models of agency (Grossman and Hart, 1982) and the
literature on tax avoidance (Crocker and Slemrod, 2005; Desai and Dharmapala, 2006; Desai
et al., 2007). Additionally, we assume that all the other agents (shareholders, debtholders, and
the taxing authority) observe only the income that the manager reports. This assumption
implies that bankruptcy occurs when the reported income is lower than the promised
repayment to the debtholders.
The presence of corporate taxation at the rate t reduces the payoff to equity, which creates
incentives to shelter some part of the firm‘s taxable income. Let S denote the dollar amount to
be sheltered at time t = 1, and assume that it is determined by the manager at time t = 0 based
on her/his expectations of the future cash flow y and the probability of bankruptcy. Once the
payoff y is realised at t = 1, the manager shelters the amount S and uses the remaining cash
flow (y - S), which is the reported income, to pay the debtholders. In other words, the firm
goes bankrupt if and only if DSy .6 Thus, the cumulative density function F(y ≤ S + D) =
[(S + D) - (a - θ)]/θ represents the probability that the firm goes bankrupt. Since only the
reported income (y - S) is available for paying the bondholders, sheltering increases the
number of states in which the firm is bankrupt.
6 We note here that our results hold good if we define s as a proportion of y.

11
The extant literature (e.g., Desai et al., 2007) generally assumes that sheltering is detected
with some probability, and if it deemed to be illegal, entails costs in the form of penalties. We
assume that sheltering is detected and deemed illegal with probability 1,0 . We further
assume that if caught sheltering, the firm has to give back all the sheltered amount and pay a
penalty that is proportional to the sheltered amount; the penalty is defined as spP FF * ,
where 1,0Fp . Further, the manager has to pay a penalty spP MM * , where 1,0Mp .
Since our objective is to examine the effect of bankruptcy risk on sheltering, we sharpen the
focus on bankruptcy by assuming that sheltering is detected with certainty and that the
benefits of sheltering are lost if a firm declares bankruptcy. In other words, when the firm
enters bankruptcy, the subsequent scrutiny by tax authorities identifies sheltering with
certainty. As a result, the sheltered income needs to be used to pay the unpaid taxes (due to
sheltering) and any failure-to-pay penalties that the tax code may impose. The loss of
sheltering proceeds in the bankruptcy state imposes a cost on sheltering as sheltering
increases the number of states in which the firm goes bankrupt and sheltering benefits are
lost. In other words, the benefits of sheltering exist only in the non-bankruptcy states (if the
firm is not caught sheltering).7 In order to keep the analysis simple enough to draw inferences
regarding optimal sheltering, we assume that in bankruptcy, after paying back taxes and the
failure-to-pay penalties, there is nothing left over from the detected sheltered income to pay
the debtholders.
We assume that the manager is a shareholder in the firm and owns a fraction λ of the firm‘s
equity, with 0,1 . While the manager‘s interests are partly aligned with those of the
shareholders, as argued in the extant literature (e.g., Desai et al., 2007), she/he has the
opportunity and the incentive to divert a part of the sheltered income to her/his personal
advantage and share only the remaining sheltered income with the outside shareholders. We
assume that diversion takes place out of the sheltered income only.8 Let k be the fraction of
sheltered income that the manager chooses to divert, with 0,1k . We assume that the
7 In view of the greater scrutiny into the financial transactions of firms that file for bankruptcy, this assumption
is reasonable. There is anecdotal evidence (Enron and Tyco) that the tax avoidance activities of financially
troubled corporations are revealed due to increased investigations. After the initiation of the bankruptcy process,
the IRS is a claimant on the assets of the firm. Further, taxes that can be proved to have been evaded can be
recovered in full. 8 Our assumption is different from that of Desai et al. (2007), who allowed for the possibility of diversion out of
the true payoff, which also has the effect of reducing the taxable income.
12
manager incurs a non-monetary cost B (where B > 0) in case the firm goes bankrupt, in
addition to the penalty ( MP ) she/he has to paid if caught sheltering.9
In the above setting, the manager chooses s that maximises the following:
1
111dyyfSpBdyyf
SpSptDy
SkkStDSyVE
DS
a
M
a
DS MF
M
(1)
In our setting, λ, a, θ, k, D, γ, pF, pM, and B are exogenously given and constant.10
Solving Equation (1) for the first-order condition yields the expression in Equation (2) for the
optimal level of sheltering.11
tppktk
aDpBppktkDa
FM
MMF
112
1S*
(2)
Our objective is to determine the relation between the level of debt and sheltering as
measured by S*. The presence of risky debt in the capital structure can reduce or increase the
level of sheltering; we show that the direction of the relation depends on how increased
sheltering affects the probability of bankruptcy. Since debt reduces the number of (non-
bankruptcy) states in which the owner-manager can benefit from sheltering, the manager has
the incentive to shelter more in the non-bankruptcy states, which suggests a positive relation
between debt and S*. However, the greater likelihood of bankruptcy resulting from higher
debt implies a higher probability that the manager bears the cost B and loses her/his part of
the sheltering benefits. This possibility implies a negative relation between S* and the level
of debt. Further, since higher debt implies greater tax shields, higher leverage should reduce
the manager‘s incentives to resort to costly tax avoidance activities (Graham and Tucker,
2006). Increasing sheltering increases the probability of bankruptcy in which the manager not
only risks losing what she/he could have earned in the non-bankrupt state but also incurs non-
pecuniary costs (B).
Using Equation (2), we formalise the relation between the optimal level of sheltering (S*) and
the level of debt (D) in Proposition 1 (all proofs are included in Appendix A).
9 For the sake of simplicity, we assume B > P.
10 For simplicity of computation, we allow for tax shields on the entire amount of debt D, rather than on the
interest component alone. In unreported results, we confirm that our results hold good when we assume that
only the interest is tax deductible. 11
It is easy to show that the second-order condition for a maximum is also satisfied (see Appendix A).

13
Proposition 1: The relation between the optimal level of sheltering (S*) and the debt level
(D) is always negative.
Intuitively, a higher level of sheltering (S) increases the probability that the firm ends up
bankrupt. In bankruptcy, the manager loses her/his stake in the firm as well as the amount
she/he managed to divert, and sustains a personal cost (B). Thus, it is in the manager‘s best
interests to avoid bankruptcy by reducing the sheltering activities when the firm‘s debt
burden is high.
Proposition 2 establishes the relation between S* and the manager‘s share in the firm‘s
equity.
Proposition 2: If ktp
kt
F
, then the relation between the optimal level of sheltering
(S*) and the manager‘s share in the firm‘s equity is negative.
One would expect the relation between the level of sheltering and the manager‘s share in
equity to be positive since a higher share in ownership results in better alignment of the
manager‘s and the shareholders‘ interests, giving the manager more incentives to enhance the
firm‘s value by reducing the total tax outflows. However, Proposition 2 shows that when the
probability of getting caught—and thereby the risk of losing the benefits from sheltering and
of having to pay a penalty—is high enough, the relation between S* and λ is actually negative.
Next, we investigate the relation between sheltering and the manager‘s bankruptcy costs (B).
Proposition 3: The relation between the optimal level of sheltering (S*) and the probability
of being caught (γ) is always negative.
The higher the probability of being caught in illegal sheltering activities, the higher is the
expected cost of the penalties as well as the probability of losing the benefits from sheltering.
Thus, the probability of being caught is a deterrent to sheltering activities.
Proposition 4: The relation between the optimal level of sheltering (S*) and the manager‘s
non-monetary bankruptcy cost (B) is always negative.
The intuition underlying Proposition 4 is that the non-monetary cost (B) makes bankruptcy
more expensive for the manager, which gives her/him the incentive to reduce sheltering in
order to avoid bankruptcy.

14
Proposition 5: The relation between sheltering and the level of debt becomes more positive
(less negative) when the manager‘s equity ownership in the firm is higher iff ktp
kt
F
.
Notice that if the condition from Proposition 5 is met, the relation between the manager‘s
equity stake and S* is negative (Proposition 2).
Proposition 6: The relation between the optimal level of sheltering (S*) and a is always
positive.
Note that as a decreases, ceteris paribus, the firm has a greater probability of going bankrupt
for a given level of debt. Thus, Proposition 6 offers a direct link between bankruptcy risk and
the firm‘s incentive to shelter income from taxes.
Proposition 7: The relation between the optimal level of sheltering S*
and θ is always
positive.
Interpreting Proposition 7 is difficult in the case of uniform distribution because an increase
in θ has two connotations: an increase in the upper limit for the cash flow or an increase in
variance. The former effect should imply an increase in sheltering since there is more income
to shelter. An increase in variance would generally imply both an increase in the upper bound
for the cash flow as well as an increase in the probability of bankruptcy. However, these two
effects will affect sheltering in entirely opposite directions—a higher upper bound will
increase sheltering, while greater probability of bankruptcy will decrease sheltering.
2.1. Empirically Testable Predictions
Our theoretical framework offers the following predictions, which we test on data in the
subsequent sections.
Prediction 1: Proposition 1 shows that under certain parameter restrictions, the level of
sheltering should be decreasing in the level of debt.
Prediction 2: By Proposition 2, for given parametric restrictions, sheltering should be
decreasing in the manager‘s ownership in the firm‘s equity.
Prediction 3: Proposition 3 suggests a negative relation between the level of sheltering
and the probability that the firm‘s sheltering activities will be caught and
punished.

15
Prediction 4: Proposition 4 suggests a negative relation between the level of sheltering
and the manager‘s non-pecuniary costs in bankruptcy.
Prediction 5: Under certain parametric conditions, the relation between the level of
sheltering and debt becomes more positive as the manager‘s ownership
in the firm increases (Proposition 5).
3. Sample and Variables
3.1. Sample Description
Our initial sample consists of all the U.S. firms listed in Compustat for the period 1986–2012.
We obtain data on executive compensation from Execucomp and on institutional ownership
from CDA/Spectrum. We exclude financial firms and utilities (SIC codes 4900–4999 and
6000–6999, respectively) from the sample. Our main sample consists of 66,198 firm-years
(9,648 unique firms) over the period 1986–2012. The subsample that includes the executive
compensation variables consists of 16,621 firm-year observations and is available for the
period 1993–2012. Detailed definitions of all the variables are provided in Appendix B.
3.2. Measures of Tax Sheltering
We measure a firm‘s tax sheltering as follows. First, we use the measure suggested by
Manzon and Plesko (2002) that attempts to capture the difference between the income a firm
reports to its shareholders based on the generally accepted accounting principles (GAAP) and
the one it reports to the income tax authorities based on tax laws. Since the income reported
to the tax authorities is not directly observable, it is imputed by dividing the tax expenses
reported by the firm in its financial statements by the top statutory corporate tax rate. Using
35% as the top statutory tax rate, we compute the difference between the domestic pre-tax
financial income and the imputed taxable income as
TXFED/0.35 - PIFO-PI SpreadUnadjusted
where the first two terms are the pre-tax income and the foreign pre-tax income, respectively,
and TXFED is the amount paid in federal taxes for the year. Next, we account for the inherent
differences between book income and tax accounting that do not represent tax aggressive
activities. We compute the variable
ESUB- TXO - TXS - SpreadUnadjusted SpreadAdjusted

16
where TXS represents state income taxes, TXO represents other income taxes, and ESUB
measures the unremitted earnings from non-consolidated subsidiaries. The three items
subtracted from Unadjusted Spread are either included in the book income and not in the tax
income or vice-versa; therefore, they can affect the gap for reasons unrelated to tax
sheltering. Finally, we define our main tax sheltering variable as
Spread/ATAdjusted Gap Tax Book
where AT represent the firm‘s total assets.12
In order to avoid including firms with tax losses
(which may have very different incentives for tax sheltering compared to firms with a
positive tax liability during the year), in the sample, we keep only those firms that report a
positive current tax expense in a given year (Desai and Dharmapala, 2006).
3.3. Variables to Measure Firm Value, Leverage, and Bankruptcy Risk
In most of the analyses that follow, the dependent variable is firm value, which we measure
with Tobin’s q, computed as the book value of debt plus the market value of common equity
divided by the book value of assets. The main independent variables of interest are leverage
and bankruptcy risk. We define Leverage as the book value of debt divided by the book value
of assets minus the book value of common equity plus the market value of equity.
We measure bankruptcy risk with the variable Default Probability, which is based on the
―naive‖ measure of the distance to default proposed in Bharath and Shumway (2008).13
The
volatility of stock returns (σE) is computed using the previous 260 daily returns with a
minimum of 180 returns, while the volatility of debt (σD) is computed as σD = 0.05 + 0.25σE.
We measure the market value of equity E by multiplying the number of shares by the stock
price, and we approximate the market value of debt D by adding the current portion of long-
term debt and long-term debt multiplied by a factor of 1.5 (Bharath and Shumway, 2008).
Using these values, we approximate the total volatility of the firm as σV = E/(E + D)σE + D/(E
+ D)σD. We compute the naive distance to default as:
TTReturnTF
DE (DD) Default to Distance 1-t /*5.0
*ln
2
12
Book Tax Gap has been widely used and interpreted as evidence of tax avoidance/sheltering behaviour (Mills,
1998; Mills et al., 2002; Desai, 2003, 2005; Manzon and Plesko, 2001). Similarly, the U.S. Department of
Treasury White Paper entitled ‗The Problem of Corporate Tax Shelters‘ (1999) identified large and increasing
book-tax gaps and interpreted them as evidence for the increased use of tax shelters by corporations. 13
Additionally, we use the Z score proposed in Altman (1984) as an alternate measure of bankruptcy risk. All
the (unreported) findings are qualitatively similar.
17
Finally, the variable Default Probability that we use in our tests is computed as -N(DD).
3.4. Control Variables
In our multivariate analysis, we control for a variety of firm characteristics. Size represents
the firm‘s total book assets, while Profitability is a dummy that takes the value 1 if the firm
reports a positive domestic pre-tax book income for the year. We include the variable ROA
Volatility to capture the risk associated with a firm‘s profitability; it is computed as the
standard deviation of the firm‘s return on assets for the previous six years, with a minimum
of three observations.
Our measure of tax aggressiveness (Book Tax Gap) could be affected by earnings
management on the part of the manager. Any upward smoothing of income could result in the
overstatement of our measure. In order to control for this effect, we include the variable Total
Accruals in our analysis, which is computed as in Bergstresser and Phillipon (2006) (see
Appendix B).14
Additionally, following Manzon and Plesko (2002), we include as control variables the
lagged Book Tax Gap, the pre- and post-1993 values for goodwill, the annual Sales Growth,
the absolute value of the firm‘s foreign income, a dummy for net operating losses (NOLs),
the change in NOL carry-forwards, the change in post-retirement obligations, and the ratio of
net to gross property, plant, and equipment and total assets. In order to test whether tax
aggressiveness is associated with asset opacity, we include the variable Intangibles, which is
the dollar value of the firm‘s intangibles scaled by the total assets. Since the extant literature
shows that firms that report high R&D expenses shelter more income from taxes and set up
more tax haven operations (Desai et al., 2006), we include the variable R&D, measured as the
ratio of R&D expense to total assets.
Hanlon and Slemrod (2009) argued that tax avoidance activities have a reputational cost. In
order to capture the potential reputational costs of tax aggressiveness arising out of being in
the public eye, we include the variable Advertising, computed as the ratio of advertising
expenses to total assets. Additionally, we capture a firm‘s prestige with the variable Fort500
Dummy, which takes the value 1 for firms in the Fortune 500 list, and zero otherwise
(Meneghetti and Williams, 2013).
14
If we use discretionary accruals (Jones, 1991), the (unreported) results do not change significantly.

18
Our main variable for firm governance is %Institution, measured as the percentage of the
firm‘s outstanding shares held by institutional investors using the 13F filings data from the
CDA/Spectrum database. Finally, in order to capture the alignment of the manager‘s
incentives with the interests of the firm‘s shareholders, we compute the variable Stock Option
Ratio, defined as the ratio of the Black-Scholes value of the stock options granted to the CEO
and the sum of her/his salary, bonus, and stock options.
4. Descriptive Statistics
Table 1 reports the descriptive statistics for the whole sample. The main independent
variable, Book Tax Gap, has a mean of -0.265 and a median of -0.006.15
The average
(median) firm in our sample has a Leverage of 0.158 (0.100), a Default Probability of 0.146
(0.010), and total assets of USD 1.215 billion. Since the size variable is skewed, we use the
natural logarithm of firm size in the multivariate analysis. Table 2 presents the correlation
matrix for the main regression variables. While the correlation between Book Tax Gap and
Leverage (0.002) is not significantly different from zero, that between Book Tax Gap and
Default Probability is significantly less than zero (-0.041). As expected, Leverage and
Default Probability are highly positively correlated with a correlation coefficient of 0.687.
Column 1 in Table 2 suggests that firms with high institutional holdings, large size, lower
ROA volatility, higher total accruals, high intangibles, low R&D and advertising expenditure,
and high stock option ratios have larger book-tax gaps.
5. Effects of Leverage and Bankruptcy Risk on Sheltering
In this section, we examine the relation between sheltering (measured by the variable Book
Tax Gap) and the two variables of interest, namely, Leverage and Default Probability, in a
multivariate setting. We start by presenting the findings from the ordinary least squares
(OLS) regressions, first on Leverage and subsequently on Default Probability. In both cases,
we include all the control variables described in Section 3.4. We then control for the effect of
CEO alignment and include the variable Stock Option Ratio in the base regression. Given the
limited data available on managerial compensation in the Execucomp database, the sample
15
These numbers are consistent with those reported in Desai and Dharmapala (2009). Their measure of tax gap
is what we denote as Unadjusted Spread, which is computed as the simple difference between the domestic pre-
tax book income and the inferred taxable income, without making any adjustments for earnings from
subsidiaries and state income taxes. Their sample size is 4,492, while ours is 66,198.

19
size decreases to 16,621 when we include the variable Stock Option Ratio. We investigate
how the effects of Leverage and Default Probability on sheltering vary for firms with higher
values for cash flow volatility, profitability, institutional holdings, size, advertising, accruals,
managerial stock option ratios, and inclusion in the Fortune 500 list.
Table 1: Summary Statistics
The sample consists of firm-years with available data in the period 1986—2012. All variables are defined in
Appendix B. All continuous variables are winsorized at the 1st and 99
th percentile. The table reports univariate
statistics for the whole sample.
Mean Median Min Max N
Dependent Variables
Book Tax Gap -0.265 -0.006 -10.868 0.224 66,198
Tobin's Q 2.569 1.308 0.247 63.428 66,198
Control Variables – Firm Characteristics Leverage 0.158 0.100 0.000 0.742 66,198
Default Probability 0.146 0.010 0.000 1.000 31,979
%Institution 0.269 0.077 0.000 1.028 66,198
Size 1,214.78 109.475 0.099 24,581 66,198
Fort500 Dummy 0.066 0.000 0.000 1.000 66,198
Profitability 0.635 1.000 0.000 1.000 66,198
ROA Volatility 0.216 0.051 0.006 7.435 66,198
Total Accruals -0.050 -0.042 -1.382 0.887 66,198
Intangibles 0.112 0.025 0.000 0.735 66,198
R&D 0.075 0.001 0.000 1.149 66,198
Advertising 0.014 0.000 0.000 0.261 66,198
Manzon and Plesko (2002) controls NOL 0.373 0.000 0.000 1.000 66,198
ΔNOL 3.991 0.000 -111.300 215.500 66,198
Sales Growth 0.217 0.083 -0.995 6.897 66,198
PP Ratio 0.499 0.503 0.043 0.975 66,198
ΔPost-retirement Benefits 0.605 0.000 -11.954 40.000 66,198
Foreign Pre-tax Income 22.653 0.000 0.000 655.800 66,198
Pre-1993 Goodwill 14.142 0.000 0.000 471.783 66,198
Post-1993 Goodwill 95.980 0.000 -20.460 2,490.295 66,198
Other Intangibles 53.599 0.000 -12.791 1,555.260 66,198
Stock Option Ratio 0.730 0.838 0.000 0.996 16,621
Subsequently, we show how the level of sheltering changed following the passage of a law
that strengthened creditor rights during bankruptcy as a quasi-natural experiment. Further, we
examine how the effects of Leverage and Default Probability on sheltering changed
following this change in the law. Finally, we present evidence on the relation between tax
sheltering and firm value. Depending on the specification, we use industry and firm fixed

20
effects to control for time-invariant industry and firm unobserved variables, respectively. For
industry fixed effects, we define the industry dummies at the 2-digit SIC code level. In all the
regressions, the standard errors are robust to heteroscedasticity and are clustered by firm.
Table 2: Correlations among Variables of Interest
The sample consists of firm-years with available data in the period 1986—2012. All variables are defined in
Appendix B. All continuous variables are winsorized at the 1st and 99
th percentile. The table reports pairwise
correlations among the variables of interest and the p-value.
1 2 3 4 5 6 7 8 9 10 11
1. Book Tax Gap 1
2. Leverage 0.002 1
0.598
3. Default Probability -0.041 0.687 1
0.000 0.000
4. %Institution 0.174 -0.108 -0.093 1
0.000 0.000 0.000
5. Size 0.079 0.027 -0.034 0.223 1
0.000 0.000 0.000 0.000
6. ROA Volatility -0.683 -0.042 -0.033 -0.164 -0.079 1
0.000 0.000 0.000 0.000 0.000
7. Total Accruals 0.316 -0.034 -0.073 0.063 0.006 -0.181 1
0.000 0.000 0.000 0.000 0.103 0.000
8. Intangibles 0.036 0.100 0.042 0.187 0.139 -0.016 -0.026 1
0.000 0.000 0.000 0.000 0.000 0.000 0.000
9. R&D -0.447 -0.183 -0.110 -0.120 -0.097 0.321 -0.121 -0.097 1
0.000 0.000 0.000 0.000 0.000 0.000 0.000 0.000
10. Advertising -0.047 -0.033 -0.013 -0.028 0.007 0.032 -0.024 -0.019 -0.038 1
0.000 0.000 0.016 0.000 0.068 0.000 0.000 0.000 0.000
11. Stock Option Ratio 0.035 -0.075 -0.113 0.124 0.132 -0.003 -0.004 0.103 0.126 -0.025 1
0.000 0.000 0.000 0.000 0.000 0.701 0.569 0.000 0.000 0.002
5.1. Leverage, Probability of Default, and Sheltering
We first estimate the regression of Book Tax Gap on Leverage and other control variables,
which will shed light on the effect of leverage on the firm‘s tax aggressiveness (Propositions
1 and 2). We present the results from this analysis in the first two columns of Table 3. The
first column presents the findings related to industry fixed effects (IFE) and the second
column presents those related to firm fixed effects (FFE). The coefficient of Leverage is
negative and significant at the 1% level in both the columns, indicating that higher leverage is
associated with lower sheltering. To highlight the significance of the effect of Leverage on

21
tax sheltering, we note that if the debt level increases from the 25th
percentile to the 75th
percentile value, the Book Tax Gap decreases by 31.56%.
Columns 3 and 4 of Table 3 present the results when we substitute Leverage and Default
Probability with IFE and FFE, respectively. The sample size for this specification is 31,979
firm-years, which is significantly smaller than the 66,198 firm-years for Leverage. The
coefficient of Default Probability is negative and significant at the 1% level in both columns.
This finding is consistent with our theoretical prediction that firms with a greater likelihood
of bankruptcy will indulge less in sheltering.
The coefficient of %Institution is always negative and significant in three of the four
columns, suggesting that higher institutional ownership—an indicator of better governance—
deters firms from sheltering income. This reinforces the finding that tax aggressiveness may
not necessarily be a value-enhancing activity for shareholders (Desai and Dharmapala, 2009).
The coefficient of Log(Size) is positive and significant, which is consistent with the intuition
that large firms face a lower risk of bankruptcy as compared to smaller firms with similar
debt ratios. The intuition underlying the positive coefficient of the Profitability Dummy is
similar to that for firm size. Further, only firms that are profitable need to shelter income. In
the framework of our model, the negative coefficient of ROA Volatility suggests that since
firms with riskier cash flows are more likely to default, the managers of such firms may
choose to keep the levels of sheltering low so as to avoid the risk of going bankrupt, which
would be costly to them, personally.
The coefficients of Advertising and Fort500 are negative and significant in all the
specifications. These findings are consistent with Prediction 4 that managers with greater
personal costs of bankruptcy will shelter less. The intuition is that the managers of firms that
advertise more and/or are in the Fortune 500 list are in the public eye; thus, they have more to
lose in terms of prestige and reputation. Therefore, they care more about the potential
personal cost of sheltering (Hanlon and Slemrod, 2009).

22
Table 3: Effects of Leverage and Default Probability on Sheltering
The sample consists of firm-years with available data in the period 1986—2012. The dependent variable is
sheltering measured by the Book Tax Gap and Default Probability is computed using the technique in Bharath
and Shumway (2008). All other variables are defined in Appendix B. Year fixed effects are included in all
regressions. All continuous variables are winsorized at the 1st and 99
th percentile. Standard errors used to
compute t-statistics (in parentheses) are robust and clustered by firm. The symbols ***, **, and * denote
significance at the 1%, 5%, and 10% level respectively.
Dependent variable: Book Tax Gap
X = Leverage X = Default Probability
X -0.296*** -0.461*** -0.069*** -0.059***
(-10.55) (-10.10) (-7.73) (-7.52)
%Institution -0.154*** -0.256*** -0.009* -0.014
(-13.96) (-11.86) (-1.72) (-1.34)
Log(Size) 0.071*** 0.256*** 0.016*** 0.046***
(17.31) (16.32) (7.62) (6.44)
Fort500 Dummy -0.114*** -0.077*** -0.032*** -0.017***
(-12.82) (-8.80) (-7.32) (-4.25)
Profitability 0.085*** 0.125*** 0.120*** 0.128***
(9.38) (12.89) (15.72) (22.32)
ROA Volatility -0.533*** -0.542*** -0.721*** -0.633***
(-16.55) (-11.20) (-7.69) (-3.99)
Total Accruals 0.789*** 0.654*** 0.271*** 0.222***
(14.86) (11.65) (7.63) (5.98)
Intangibles 0.031 0.107* -0.061*** -0.037
(0.91) (1.81) (-3.55) (-1.08)
R&D -1.259*** -1.916*** -1.000*** -1.646***
(-18.50) (-19.84) (-15.05) (-12.16)
Advertising -0.922*** -1.647*** -0.367*** -0.828***
(-5.97) (-4.84) (-3.35) (-3.85)
Lagged Book Tax Gap 0.318*** 0.055** 0.184*** -0.051
(13.59) (2.55) (4.89) (-1.51)
Additional Manzon-Plesko controls
NOL 0.038*** 0.040*** 0.014*** 0.005
(4.89) (3.98) (3.18) (0.88)
ΔNOL -0.000*** -0.000*** -0.000*** -0.000***
(-6.24) (-5.88) (-4.48) (-3.68)
Sales Growth 0.077*** 0.045*** 0.034*** 0.018***
(9.40) (6.02) (5.84) (2.71)
PP Ratio -0.109*** -0.095** -0.066*** 0.005
(-3.94) (-1.99) (-4.02) (0.19)
ΔPost-Retirement Benefits -0.001*** -0.001*** -0.000*** -0.000***
(-6.63) (-4.30) (-4.39) (-3.11)
(Continued)

23
Table 3 (continued)
Dependent variable: Book Tax Gap
X = Leverage X = Default Probability
Foreign Pre-Tax Income -0.000*** -0.000*** -0.000*** -0.000***
(-9.89) (-6.66) (-6.40) (-5.11)
Pre-1993 Goodwill -0.000*** -0.000** -0.000*** 0.000
(-8.44) (-2.06) (-4.76) (0.34)
Post-1993 Goodwill -0.000*** -0.000*** -0.000*** -0.000
(-8.64) (-5.79) (-3.99) (-0.47)
Other Intangibles -0.000*** -0.000*** -0.000 -0.000***
(-5.73) (-6.00) (-1.11) (-2.91)
Intercept -0.369*** -0.887*** -0.112*** -0.288***
(-4.45) (-12.88) (-3.25) (-5.65)
Industry Fixed Effects Yes No Yes No
Firm Fixed Effects No Yes No Yes
N 66,198 66,194 31,979 31,976
R2 0.621 0.355 0.569 0.329
# of firms 9,648 7,177
5.2. Impact of CEO’s Incentive Alignment on the Relation Involving
Leverage, Bankruptcy Risk, and Sheltering
We examine how the negative relation between Leverage and sheltering and that between
Default Probability and sheltering vary according to how well the CEO‘s incentives are
aligned with those of the shareholders. We expect that when the CEO‘s incentives are better
aligned, they are more likely to shelter income from taxes since their share in the benefits of
sheltering would increase according to their alignment incentives (Proposition 3). Further,
our model suggests that the negative relation between sheltering and Leverage should become
less negative as managerial alignment with the interests of the firm‘s shareholders increases.
We present the findings from this analysis in Table 4. In the estimations in Table 4, we add
the variable Stock Option Ratio and the interaction Stock Option Ratio × Leverage to the
specifications in Table 3. The coefficient of Stock Option Ratio will indicate the relation of
managerial incentives with sheltering and that of the interaction term will indicate whether
the effect of Leverage on sheltering becomes more positive with an increase in the CEO‘s
incentive alignment. While all the specifications include the Manzon-Plesko controls, we do
not report their coefficients for reasons of brevity.

24
Table 4: Effects of Leverage and Default Probability on Sheltering in the Context of CEO
Alignment
The sample consists of firm-years with available data in the period 1986–2012. The dependent variable is
sheltering measured by the Book Tax Gap and Default Probability is computed using the technique in Bharath
and Shumway (2008). All regressions include all the variables in Table 3 but only selected coefficients are
reported. All variables are defined in Appendix B. Year fixed effects are included in all regressions. All
continuous variables are winsorized at the 1st and 99
th percentile. Standard errors used to compute t-statistics (in
parentheses) are robust and clustered by firm. The symbols ***, **, and * denote significance at the 1%, 5%,
and 10% level respectively.
Dependent variable: Book Tax Gap
X = Leverage X = Default Probability
X -0.206*** -0.530** -0.035*** -0.056
(-2.88) (-2.39) (-4.81) (-1.60)
Stock Option Ratio 0.037** -0.024 0.028 0.025
(2.38) (-0.80) (1.29) (1.40)
X * Stock Option Ratio 0.498** 0.029
(2.05) (0.64)
%Institution 0.007 0.006 0.011 0.011
(0.74) (0.59) (1.15) (1.15)
Log(Size) 0.018 0.017 -0.007 -0.007
(1.45) (1.44) (-1.41) (-1.44)
Fort500 Dummy -0.005 -0.004 0.002 0.002
(-1.12) (-1.01) (0.68) (0.70)
Profitability 0.086*** 0.086*** 0.103*** 0.103***
(5.44) (5.46) (14.01) (14.09)
ROA Volatility -0.818*** -0.804*** -0.427*** -0.428***
(-3.26) (-3.30) (-2.84) (-2.84)
Total Accruals 0.234** 0.232** 0.119*** 0.119***
(2.06) (2.08) (4.17) (4.17)
Intangibles -0.043 -0.050 -0.022 -0.022
(-1.47) (-1.64) (-0.96) (-0.96)
R&D -1.833*** -1.824*** -1.219*** -1.219***
(-4.05) (-4.10) (-6.07) (-6.06)
Advertising -0.109 -0.108 -0.205* -0.204*
(-1.38) (-1.37) (-1.84) (-1.84)
Lagged Book Tax Gap 0.179*** 0.180*** -0.001 -0.001
(2.68) (2.70) (-0.02) (-0.01)
Intercept -0.019 0.031 0.049 0.053
(-0.38) (0.61) (1.08) (1.19)
Industry Fixed Effects No No No No
Firm Fixed Effects Yes Yes Yes Yes
N 16,621 16,621 9,846 9,846
R2 0.360 0.366 0.214 0.214
# of firms 2,322 2,322 2,043 2,043
- 25 -
The results in Column 1 of Table 4 show that the negative relation between Leverage and
Book Tax Gap continues to hold after controlling for the CEO‘s alignment with the
shareholders‘ interests. The coefficient of Stock Option Ratio is positive and significant,
indicating that managers with a higher equity stake in the company indulge in more sheltering
activities. When the specification additionally includes the interaction term Stock Option
Ratio × Leverage, the coefficient of Stock Option Ratio is insignificant and that of the
interaction term is significantly positive. This finding is consistent with our theory and
highlights an interesting aspect of the relation between sheltering and the CEO‘s alignment
incentives. The insignificant coefficient of Stock Option Ratio in Column 2 of Table 4
suggests that when there is no debt in the firm, the incentive alignment may not lead
managers to shelter income. The positive coefficient of the interaction term indicates that the
alignment incentives lead to greater sheltering only in the presence of debt. Another
interpretation that is not mutually exclusive is that the negative effect of Leverage on
sheltering becomes significantly less negative when the CEO‘s alignment with the
shareholders‘ interests is high. Viewed together, our findings indicate that debt and alignment
incentives have opposing/offsetting effects on sheltering. Therefore, it is important to control
for the joint effect (e.g., with the interaction term) of these two variables in empirical tests.
Columns 3 and 4 of Table 4 present the findings when we substitute Leverage with Default
Probability. The coefficient of Default Probability is significantly negative in Column 3 and
is not significant in Column 4. The coefficients of Stock Option Ratio and the interaction term
are not statistically significant. A possible reason for these weaker results involving Default
Probability could be the significant reduction in sample size to 9,846 firm-years.
5.3. Cross-Sectional Analysis of the Effects of Leverage and Bankruptcy
Risk on Sheltering
We investigate whether the negative relations that a firm‘s leverage and probability of default
have with sheltering hold across high and low values of ROA Volatility, Profitability,
institutional ownership, firm size, inclusion in the Fortune 500 list, Advertising, Total
Accruals, and the CEO‘s incentive compensation. In each test, we create a dummy variable
that takes the value 1 when the value of the variable of interest is above the median, and zero
otherwise (for Profitability and Advertising, the dummy takes a value of 1 for positive
values). We then compute the interaction term Leverage × Dummy and estimate the
specifications with FFE from Table 3 after including the dummy variable and the interaction

- 26 -
term in the regression. We present our findings in Table 5. Panel A of Table 5 reports the
findings for the relation between sheltering and Leverage and Panel B reports those for the
relation with Default Probability. Table 5 reports the coefficients and t-statistics for
Leverage, Dummy, and Leverage × Dummy only; we omit reporting the coefficients of the
other variables in the regression results for reasons of brevity.
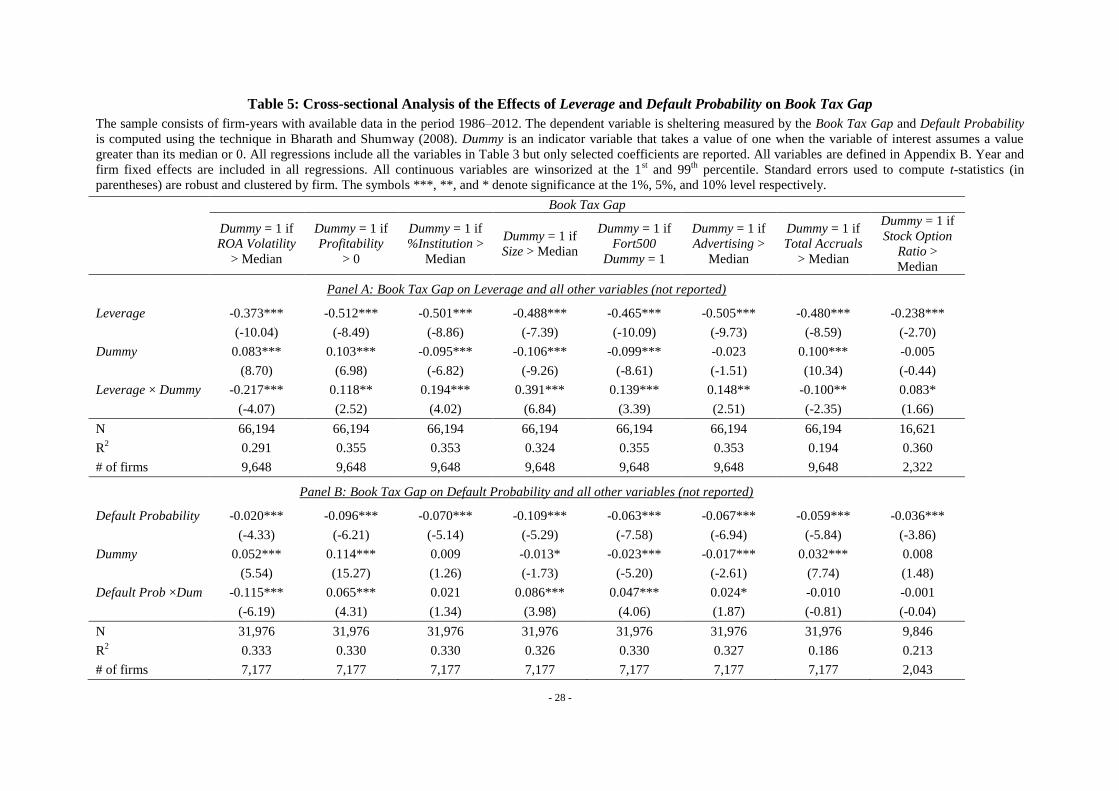
In Column 1 of Panel A of Table 5, the variable Dummy equals 1 for firms with greater
business risk as measured by ROA Volatility; the results offer support for the appropriateness
of our theoretical framework. When there is debt in the capital structure, greater business risk
implies a greater likelihood of bankruptcy, which would mean greater costs of sheltering
income for the CEO, according to our theoretical framework. Thus, the negative effect of
Leverage on sheltering will be amplified when the risk is high. The significantly negative
coefficient of the interaction term supports this intuition. However, in the absence of debt (as
the positive coefficient of Dummy implies), riskier firms will indulge in more sheltering,
which implies that there will be more sheltering with higher variance since higher variance
means a higher upper bound for cash flows.
The positive coefficients of Dummy and the interaction term with Profitability in Column 2 of
Table 5 are consistent with our expectations. Highly profitable firms have a greater incentive
to shelter income taxes; further, the efficacy of debt in reducing sheltering will be lower as
higher profit means that the distance from a state of bankruptcy is greater.
In Column 3 of Table 5, the sorting variable for Dummy is institutional ownership, the
measure of the quality of firm governance. The coefficient of the interaction term between
the High %Institution Dummy and Leverage is positive, indicating that in better governed
firms, the effect of firm leverage on sheltering is reduced. However, the coefficient of the
Dummy is significantly negative, which implies that the presence of high institutional
ownership by itself (that is, without the presence of debt) reduces sheltering. When the
Dummy is constructed using firm size (Column 4, Table 5), the interpretation of the findings
is identical to that for %Institution, which is not surprising, since firm size is highly
positively correlated with institutional ownership.
When the Dummy equals 1 if the firm is in the Fortune 500 list (Column 5, Table 5), the
coefficient of the interaction term is positive, which implies that the negative relation
between debt and sheltering is less pronounced for Fortune 500 firms. These firms are more
likely to be better governed because they would have high institutional ownership, and they

- 27 -
are in the public eye more than other firms are. Therefore, the effect of being a Fortune 500
firm should be similar to those for %Institution, which we find is the case. In Column 6 of
Table 5, where the Dummy represents high advertising expense, the coefficients of Leverage,
Dummy, and the interaction term are negative, zero, and positive, respectively. This is
consistent with our expectations, since firms that advertise more are more likely to be in the
public eye, thus reducing the negative effect of leverage on tax aggressiveness. These
findings are consistent with our theory, which states that when the costs of bankruptcy to the
manager increase, she/he would shelter less. Being in the public eye because of advertising
and by virtue of being the CEO of a Fortune 500 firm affords the manager of such firms
considerable prestige and reputation, which she/he stands to lose if the firm goes bankrupt.
In Column 7 of Table 5, we present the results when Dummy represents firms with high Total
Accruals, which is our measure of earnings management. The positive coefficient of Dummy
in this specification implies that in the absence of debt, firms that manage earnings are more
tax aggressive.16
The coefficient of the interaction term is significantly negative, implying
that the negative relation of Leverage with tax aggressiveness is significantly more
pronounced in firms with higher Total Accruals. This finding offers an insight into the
monitoring role of debt. The presence of debt implies the likelihood of bankruptcy. In our
theoretical framework, if the shareholders/CEOs shelter income, the likelihood of bankruptcy
further increases. It is reasonable to assume that the scrutiny of a firm‘s income and other
financial statements is greater once the firm is bankrupt. Greater scrutiny implies a greater
likelihood that activities related to earnings management will be revealed. Therefore, as
Leverage increases, a firm that manages earnings more will be less tax aggressive.
The last column of Table 5 presents the findings when the CEO‘s alignment incentives are
high. The coefficient of Leverage is significantly negative and that of Leverage × Dummy is
significantly positive. These coefficients confirm the earlier interpretation (Table 4) that the
negative effect of debt on sheltering is less when the CEO is more aligned with the
shareholders‘ interests. The insignificant coefficient of Dummy indicates that the positive
relation of Stock Option Ratio with sheltering appears to exist only for firms that have debt in
the capital structure.
16
This could also be a mechanical artefact. High accruals imply a higher reported book income; higher book
income also results in a higher book-tax gap.
- 28 -
Table 5: Cross-sectional Analysis of the Effects of Leverage and Default Probability on Book Tax Gap
The sample consists of firm-years with available data in the period 1986–2012. The dependent variable is sheltering measured by the Book Tax Gap and Default Probability
is computed using the technique in Bharath and Shumway (2008). Dummy is an indicator variable that takes a value of one when the variable of interest assumes a value
greater than its median or 0. All regressions include all the variables in Table 3 but only selected coefficients are reported. All variables are defined in Appendix B. Year and
firm fixed effects are included in all regressions. All continuous variables are winsorized at the 1st and 99
th percentile. Standard errors used to compute t-statistics (in
parentheses) are robust and clustered by firm. The symbols ***, **, and * denote significance at the 1%, 5%, and 10% level respectively.
Book Tax Gap
Dummy = 1 if
ROA Volatility
> Median
Dummy = 1 if
Profitability
> 0
Dummy = 1 if
%Institution >
Median
Dummy = 1 if
Size > Median
Dummy = 1 if
Fort500
Dummy = 1
Dummy = 1 if
Advertising >
Median
Dummy = 1 if
Total Accruals
> Median
Dummy = 1 if
Stock Option
Ratio >
Median
Panel A: Book Tax Gap on Leverage and all other variables (not reported)
Leverage -0.373*** -0.512*** -0.501*** -0.488*** -0.465*** -0.505*** -0.480*** -0.238***
(-10.04) (-8.49) (-8.86) (-7.39) (-10.09) (-9.73) (-8.59) (-2.70)
Dummy 0.083*** 0.103*** -0.095*** -0.106*** -0.099*** -0.023 0.100*** -0.005
(8.70) (6.98) (-6.82) (-9.26) (-8.61) (-1.51) (10.34) (-0.44)
Leverage × Dummy -0.217*** 0.118** 0.194*** 0.391*** 0.139*** 0.148** -0.100** 0.083*
(-4.07) (2.52) (4.02) (6.84) (3.39) (2.51) (-2.35) (1.66)
N 66,194 66,194 66,194 66,194 66,194 66,194 66,194 16,621
R2 0.291 0.355 0.353 0.324 0.355 0.353 0.194 0.360
# of firms 9,648 9,648 9,648 9,648 9,648 9,648 9,648 2,322
Panel B: Book Tax Gap on Default Probability and all other variables (not reported)
Default Probability -0.020*** -0.096*** -0.070*** -0.109*** -0.063*** -0.067*** -0.059*** -0.036***
(-4.33) (-6.21) (-5.14) (-5.29) (-7.58) (-6.94) (-5.84) (-3.86)
Dummy 0.052*** 0.114*** 0.009 -0.013* -0.023*** -0.017*** 0.032*** 0.008
(5.54) (15.27) (1.26) (-1.73) (-5.20) (-2.61) (7.74) (1.48)
Default Prob ×Dum -0.115*** 0.065*** 0.021 0.086*** 0.047*** 0.024* -0.010 -0.001
(-6.19) (4.31) (1.34) (3.98) (4.06) (1.87) (-0.81) (-0.04)
N 31,976 31,976 31,976 31,976 31,976 31,976 31,976 9,846
R2 0.333 0.330 0.330 0.326 0.330 0.327 0.186 0.213
# of firms 7,177 7,177 7,177 7,177 7,177 7,177 7,177 2,043
29
In Panel B of Table 5, we present the findings on the cross-sectional variation in the relation
between sheltering and Default Probability, which is the measure of bankruptcy risk. The
change in the relation for higher/lower values of ROA Volatility (Column 1), Profitability
(Column 2), Size (Column 4), Fort500 (Column 5), and Advertising (Column 6) are similar to
those for Leverage. In the case of institutional investment, the coefficients of Dummy and the
interaction term are positive and not significant at conventional levels; in the case of
Leverage, the coefficients were significantly negative and positive, respectively. We are
unable to interpret this finding.
The findings about the relation between sheltering and Default Probability when we vary
Total Accruals and Stock Option Ratio are different than those for Leverage, which highlights
the fact that the presence of debt brings about monitoring by the debtholders, in addition to
introducing bankruptcy. In Panel A, the significantly negative coefficient of the interaction
term with Total Accruals suggests a monitoring role for debt. The lack of a significant
coefficient of the interaction term in Panel B indicates that there is no such monitoring role
for Default Probability. In a similar fashion, when the Dummy represents greater CEO
alignment with the shareholders‘ interests, a significantly positive coefficient of the
interaction term in the case of Leverage and an insignificant one in the case of Default
Probability offer further support for the monitoring role of debt.
5.4. Endogeneity in Leverage, Bankruptcy Risk, and Sheltering:
Bankruptcy Abuse Prevention and Consumer Protection Act
The prior analyses involve a potential difficulty in inferring the causality in the effects of
leverage and bankruptcy risk on sheltering because the variables may be endogenously
determined. The inclusion of firm fixed effects alleviates concerns regarding endogeneity
owing to time-invariant unobserved variables. However, since the decisions regarding capital
structure, asset choices that determine bankruptcy risk, and sheltering are made by the firm‘s
manager, a time-varying unobserved variable such as managerial type may affect all three
variables. Thus, the observed effects of debt and bankruptcy risk on sheltering could be the
manifestation of the separate relations of these variables with managerial type. Further, in the
case of debt, since one reason why firms take on debt is to reduce taxes, it is also possible
that firms that avoid more taxes need to take on less debt. This possibility is similar in spirit
to the concept of tax exhaustion or the substitutability of debt and non-debt tax shields

30
(Graham and Tucker, 2006). In this section, we use the changes in the U.S. Bankruptcy Law
in 2005 as a quasi-natural experiment to address these causality concerns.
On April 20, 2005, the Bankruptcy Abuse Prevention and Consumer Protection Act
(BAPCPA) was signed into law. The objective of this Act was to prevent the use of
bankruptcy as a means of protection by reckless borrowers. While most of its provisions were
meant to address consumer bankruptcy, some of its provisions applied to corporations. This
Act had the effect of increasing the creditors‘ power in the event of bankruptcy (Hotchkiss et
al., 2008; Alanis et al., 2014) through higher scrutiny of corporations filing for bankruptcy
under Chapter 11 (reorganisation). In the context of our theory, greater scrutiny by regulators
implies that the level of sheltering by corporations should decrease following the passage of
the BAPCPA.
In addition to greater scrutiny, the BAPCPA also specified greater restrictions on fraudulent
transfers to insiders. These restrictions increased the expected payoff that
creditors/debtholders receive by default. Creditors such as debtholders care more about the
value of a firm‘s assets during bankruptcy than that during non-bankruptcy. Since the
BAPCPA improved the value of the creditors‘ claims during bankruptcy, its passage reduced
the creditors‘ incentive to monitor the firms‘ activities. Thus, the passage of the BAPCPA
should have a second effect in addition to reducing the level of sheltering due to increased
scrutiny. By reducing the creditors‘ incentives to monitor, the BAPCPA will decrease the
efficacy of debt as a monitoring mechanism for reducing the sheltering activities of firms.
Therefore, we hypothesise that the negative relation between Leverage and sheltering will
become less negative after the passage of the Act. Further, since Default Probability has no
connotations for monitoring, the passage of the BAPCPA should have no effect on the
negative relation between sheltering and Default Probability.
We construct the indicator variable Post-BAPCPA Dummy that takes the value 1 for the years
after 2006, and zero for prior years. We choose the year 2006 because most of the provisions
of the BAPCPA were applicable from October 17, 2005; therefore, we expect to observe its
full impact from 2006 onwards. We consider 1-year, 2-year, and 3-year pre-BAPCPA and
post-BAPCPA sample periods, namely, (i) 2005 and 2007, (ii) 2004–2005 and 2007–2008,
and (iii) 2003–2005 and 2007–2009.
We first examine the effect of the BAPCPA on the level of sheltering and present the findings
in Table 6. The first three columns of Table 6 deal with Leverage, and the last three deal with

31
Default Probability. The coefficients of Leverage are significantly negative in two of the
three columns, and those of Default Probability are significantly negative in all three
columns, indicating that the negative effect of both these variables on sheltering holds good
in all these periods. The coefficients of Post-BAPCPA Dummy are significantly negative in
all the six columns. Therefore, there is significant support for our hypothesis that the passage
of the BACPA significantly reduced sheltering.
In order to test the second prediction about the effect of the BAPCA on the effects of
Leverage and Default Probability on sheltering, we include the interaction terms Leverage ×
Post-BAPCPA Dummy and Default Probability × Post-BAPCPA Dummy in the specifications
involving Leverage and Default Probability, respectively. The results from estimating these
specifications for the three pre-BAPCPA and post-BAPCPA periods are presented in Table 7.
Consistent with the results in Table 6, the coefficients of Leverage, Default Probability, and
Post-BAPCPA Dummy are always significantly negative. The coefficient of the interaction
term Leverage × Post-BAPCPA Dummy is significantly positive in the first three columns of
Table 6, where Leverage is the variable of interest. This positive coefficient indicates that the
negative effect of Leverage on sheltering became less negative in the post-BAPCPA years,
which is consistent with our hypothesis that the BAPCPA is likely to have weakened the
monitoring incentives for creditors. The coefficient of the interaction term Default
Probability × Post-BAPCPA Dummy is not significantly different from zero in Columns 4
and 5 of Table 7, which is not inconsistent with the hypothesis about the weakening of
monitoring incentives since Default Probability does not reflect the monitoring activities of
creditors. The coefficient of the interaction term in the last column is negative and significant,
which would imply that the negative effect of bankruptcy risk on sheltering became stronger
after the BAPCPA. However, given that this coefficient is not significant in Columns 4 and 5
of Table 7, we hesitate to draw this inference.

32
Table 6: Effect of the Bankruptcy Abuse Prevention and Consumer Protection Act (2005) on
Tax Sheltering
The sample consists of firm-years with available data in the period 1986—2012. The dependent variable is
sheltering measured by the Book Tax Gap and Default Probability is computed using the technique in Bharath
and Shumway (2008). Post-BAPCPA Dummy takes a value of 1 for years after 2006, zero otherwise. All
regressions include all the variables in Table 3 but only selected coefficients are reported. All variables are
defined in Appendix B. Year and firm fixed effects are included in all regressions. All continuous variables are
winsorized at the 1st and 99
th percentile. Standard errors used to compute t-statistics (in parentheses) are robust
and clustered by firm. The symbols ***, **, and * denote significance at the 1%, 5%, and 10% level
respectively.
Dependent variable: Book Tax Gap
X = Leverage X = Default Probability
Pre: Yr.
2005
Post: Yrs.
2007
Pre: Yrs.
2004-5
Post: Yrs.
2007-8
Pre: Yrs.
2003-5
Post: Yrs.
2007-9
Pre: Yr.
2005
Post: Yrs.
2007
Pre: Yrs.
2004-5
Post: Yrs.
2007-8
Pre: Yrs.
2003-5
Post: Yrs.
2007-9
X -0.380 -0.550*** -0.667*** -0.119** -0.116*** -0.087***
(-1.43) (-3.69) (-4.94) (-2.16) (-5.43) (-5.27)
Post-BAPCPA
Dummy -0.185*** -0.182*** -0.201*** -0.016* -0.067*** -0.049***
(-5.76) (-7.35) (-8.57) (-1.67) (-4.28) (-3.69)
%Institution -0.306*** -0.341*** -0.404*** 0.041 -0.012 -0.029
(-2.73) (-5.02) (-6.81) (0.73) (-0.41) (-1.42)
Log(Size) 0.932*** 0.791*** 0.704*** 0.039 0.167*** 0.104***
(6.91) (10.88) (12.53) (1.24) (4.12) (4.33)
Fort500 Dummy -0.166*** -0.110*** -0.137*** -0.029 -0.041*** -0.032***
(-3.11) (-6.18) (-7.79) (-0.82) (-4.73) (-4.51)
Profitability 0.283*** 0.210*** 0.195*** 0.098*** 0.128*** 0.133***
(4.43) (5.93) (7.19) (4.63) (8.15) (12.81)
ROA Volatility -0.270 -0.329*** -0.476*** -0.264 -0.327 -0.471
(-1.54) (-3.82) (-6.26) (-1.18) (-1.40) (-1.57)
Total Accruals 0.858*** 0.792*** 0.765*** 0.325*** 0.215* 0.254*
(3.84) (5.98) (7.44) (2.68) (1.79) (1.89)
Intangibles -0.318 -0.298 -0.219 -0.091 0.149* 0.002
(-0.82) (-1.53) (-1.40) (-0.87) (1.88) (0.03)
R&D -0.761 -1.459*** -1.482*** -2.014*** -1.873*** -1.875***
(-1.55) (-5.35) (-7.44) (-3.28) (-4.92) (-7.02)
Advertising -0.304 -5.279*** -3.771*** -0.551 -0.740* -0.260
(-0.13) (-4.04) (-3.31) (-1.09) (-1.91) (-0.34)
Lagged Book Tax Gap 0.129 -0.009 -0.012 0.105 -0.234 -0.141*
(1.61) (-0.20) (-0.35) (0.78) (-1.56) (-1.88)
Intercept -4.193*** -3.505*** -3.088*** -0.140 -1.023*** -0.610***
(-6.42) (-10.52) (-12.28) (-0.79) (-4.89) (-5.11)
N 5,766 11,282 16,226 2,030 5,197 7,996
R2 0.391 0.386 0.386 0.576 0.464 0.373
# of firms 3,699 4,329 4,868 1,879 2,768 3,176

33
Table 7: Impact of BAPCPA on the Effects of Leverage and Default Probability on Tax
Sheltering
The sample consists of firm-years with available data in the period 1986—2012. The dependent variable is
sheltering measured by the Book Tax Gap and Default Probability is computed using the technique in Bharath
and Shumway (2008). Post-BAPCPA Dummy takes a value of 1 for years after 2006, zero otherwise. All
regressions include all the variables in Table 3 but only selected coefficients are reported. All variables are
defined in Appendix B. Year and firm fixed effects are included in all regressions. All continuous variables are
winsorized at the 1st and 99
th percentile. Standard errors used to compute t-statistics (in parentheses) are robust
and clustered by firm. The symbols ***, **, and * denote significance at the 1%, 5%, and 10% level
respectively.
Dependent variable: Book Tax Gap
X = Leverage X = Default Probability
Pre: Yr.
2005
Post: Yrs.
2007
Pre: Yrs.
2004-5
Post: Yrs.
2007-8
Pre: Yrs.
2003-5
Post: Yrs.
2007-9
Pre: Yr.
2005
Post: Yrs.
2007
Pre: Yrs.
2004-5
Post: Yrs.
2007-8
Pre: Yrs.
2003-5
Post: Yrs.
2007-9
X -0.731** -0.792*** -0.877*** -0.123** -0.107** -0.040*
(-2.53) (-4.52) (-5.50) (-2.17) (-2.23) (-1.74)
Post-BAPCPA Dummy -0.249*** -0.223*** -0.243*** -0.017* -0.066*** -0.043***
(-6.22) (-7.58) (-8.73) (-1.69) (-4.14) (-3.22)
X × Post-BAPCPA
Dummy 0.544*** 0.339*** 0.337*** 0.010 -0.011 -0.058**
(3.22) (2.65) (2.88) (0.23) (-0.25) (-2.27)
%Institution -0.309*** -0.347*** -0.410*** 0.041 -0.012 -0.026
(-2.78) (-5.11) (-6.91) (0.74) (-0.39) (-1.30)
Log(Size) 0.945*** 0.795*** 0.707*** 0.040 0.167*** 0.103***
(6.97) (10.92) (12.55) (1.22) (4.09) (4.27)
Fort500 Dummy -0.143*** -0.103*** -0.129*** -0.029 -0.041*** -0.033***
(-2.65) (-5.80) (-7.40) (-0.82) (-4.78) (-4.57)
Profitability 0.280*** 0.210*** 0.196*** 0.098*** 0.128*** 0.133***
(4.42) (5.94) (7.22) (4.62) (8.15) (12.73)
ROA Volatility -0.266 -0.330*** -0.477*** -0.266 -0.327 -0.471
(-1.52) (-3.84) (-6.28) (-1.19) (-1.40) (-1.57)
Total Accruals 0.866*** 0.795*** 0.767*** 0.325*** 0.215* 0.255*
(3.89) (6.01) (7.48) (2.68) (1.79) (1.90)
Intangibles -0.313 -0.288 -0.213 -0.093 0.150* 0.002
(-0.82) (-1.48) (-1.37) (-0.88) (1.88) (0.03)
R&D -0.747 -1.449*** -1.476*** -2.011*** -1.874*** -1.878***
(-1.52) (-5.31) (-7.41) (-3.30) (-4.92) (-7.03)
Advertising -0.162 -5.236*** -3.760*** -0.555 -0.742* -0.268
(-0.07) (-4.01) (-3.31) (-1.11) (-1.92) (-0.35)
Lagged Book Tax Gap 0.124 -0.010 -0.012 0.104 -0.234 -0.140*
(1.57) (-0.22) (-0.37) (0.78) (-1.56) (-1.88)
Intercept -4.227*** -3.505*** -3.081*** -0.145 -1.020*** -0.603***
(-6.47) (-10.52) (-12.28) (-0.78) (-4.85) (-5.07)
N 5,766 11,282 16,226 2,030 5,197 7,996
R2 0.394 0.387 0.387 0.577 0.464 0.373
# of firms 3,699 4,329 4,868 1,879 2,768 3,176
- 34 -
5.5. Tax Sheltering and Firm Value
We investigate whether tax aggressiveness affects firm value. The independent variable is
now Tobin’s q, measured as the sum of the book value of current debt, long-term debt, and
market value of equity divided by the book value of total assets. The main independent
variable is tax aggressiveness, measured by Book Tax Gap. In our earlier analyses, we
regressed Book Tax Gap on Leverage and on Default Probability. Since Book Tax Gap is
now included as a determinant of firm value, we construct a new variable Res. Book Tax Gap
as a measure of the firm‘s level of sheltering. The variable Res. Book Tax Gap is the residual
from the regression of Book Tax Gap on Leverage in Panel A of Table 3 and the residual
from the regression of Book Tax Gap on Default Probability in Panel B of Table 3. In the
regressions, we include all the other variables as controls and firm and year fixed effects;
however, for reasons of brevity, we do not report their coefficients.
Our findings from the analysis of the relation between firm value and sheltering are presented
in Table 8. The first two columns of Panels A and B of Table 8 present the results for the
bigger sample of 66,198 and 31,979 firm-years, respectively; the last column reports the
findings when the sample size is reduced because of the inclusion of Stock Option Ratio. In
all three specifications reported in the two panels of the table, the coefficients of Leverage
and Default Probability are negative. We hesitate to infer anything from this finding because
the negative relation could be a mechanical artefact since, the value of equity is depressed in
distressed firms, which decreases Tobin‘s q and increases the debt ratio.
In both the panels of Table 8, the coefficient of Res. Book Tax Gap is significantly negative
in the first specification, which suggests that sheltering is detrimental to firm value. In
Column 2 of Table 8, which includes the interaction terms Leverage × Res. Book Tax Gap
and Default Probability × Res. Book Tax Gap in Panels A and B, respectively, while the
coefficient of Res. Book Tax Gap continues to be negative, the coefficients of the interaction
terms are not significantly different from zero. The specification in Column 3 of Table 8
includes Stock Option Ratio; as in the earlier specifications, the coefficients of Leverage and
Res. Book Tax Gap are negative and significant in Panel A of Table 8. In Panel B of Table 8,
the coefficient of Res. Book Gap is not significantly different from zero. Consistent with our
results in Table 4, the coefficients of Stock Option Ratio are positive and significant at the 1%
level in both the panels of Table 8. This result is also consistent with the findings reported in
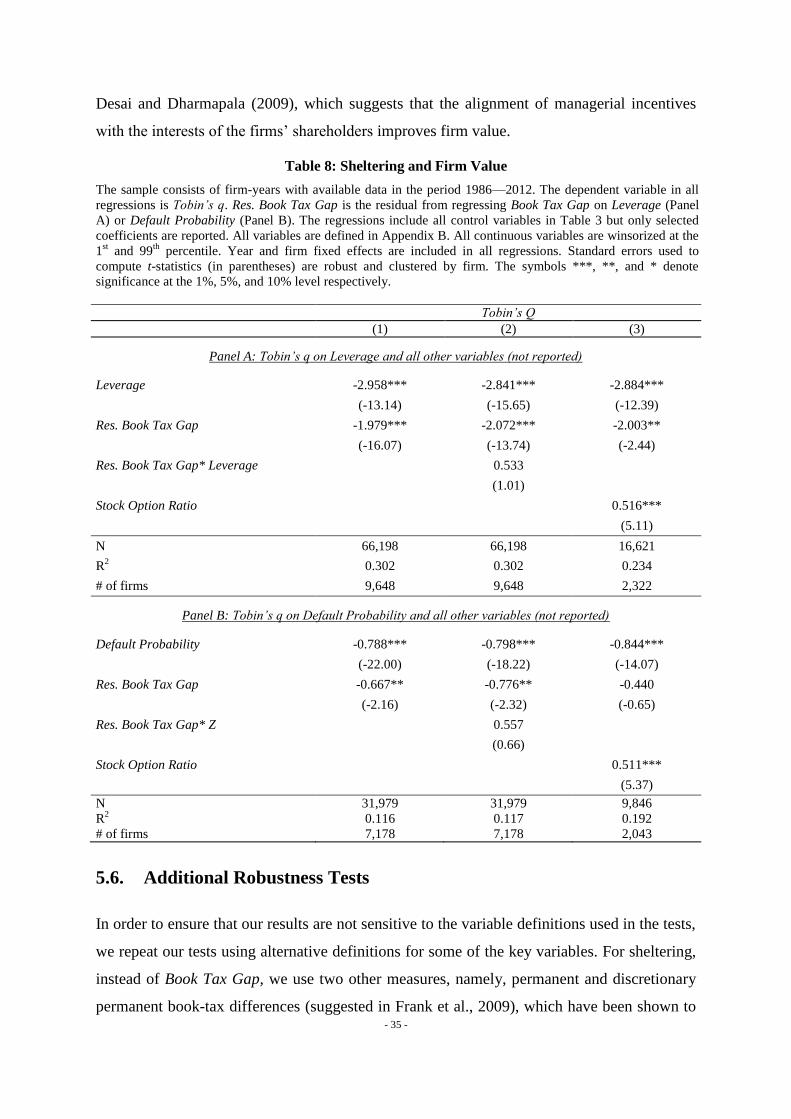
- 35 -
Desai and Dharmapala (2009), which suggests that the alignment of managerial incentives
with the interests of the firms‘ shareholders improves firm value.
Table 8: Sheltering and Firm Value
The sample consists of firm-years with available data in the period 1986—2012. The dependent variable in all
regressions is Tobin’s q. Res. Book Tax Gap is the residual from regressing Book Tax Gap on Leverage (Panel
A) or Default Probability (Panel B). The regressions include all control variables in Table 3 but only selected
coefficients are reported. All variables are defined in Appendix B. All continuous variables are winsorized at the
1st and 99
th percentile. Year and firm fixed effects are included in all regressions. Standard errors used to
compute t-statistics (in parentheses) are robust and clustered by firm. The symbols ***, **, and * denote
significance at the 1%, 5%, and 10% level respectively.
Tobin’s Q
(1) (2) (3)
Panel A: Tobin’s q on Leverage and all other variables (not reported)
Leverage -2.958*** -2.841*** -2.884***
(-13.14) (-15.65) (-12.39)
Res. Book Tax Gap -1.979*** -2.072*** -2.003**
(-16.07) (-13.74) (-2.44)
Res. Book Tax Gap* Leverage 0.533
(1.01)
Stock Option Ratio 0.516***
(5.11)
N 66,198 66,198 16,621
R2 0.302 0.302 0.234
# of firms 9,648 9,648 2,322
Panel B: Tobin’s q on Default Probability and all other variables (not reported)
Default Probability -0.788*** -0.798*** -0.844***
(-22.00) (-18.22) (-14.07)
Res. Book Tax Gap -0.667** -0.776** -0.440
(-2.16) (-2.32) (-0.65)
Res. Book Tax Gap* Z 0.557
(0.66)
Stock Option Ratio 0.511***
(5.37)
N 31,979 31,979 9,846
R2 0.116 0.117 0.192
# of firms 7,178 7,178 2,043
5.6. Additional Robustness Tests
In order to ensure that our results are not sensitive to the variable definitions used in the tests,
we repeat our tests using alternative definitions for some of the key variables. For sheltering,
instead of Book Tax Gap, we use two other measures, namely, permanent and discretionary
permanent book-tax differences (suggested in Frank et al., 2009), which have been shown to

- 36 -
be positively associated with tax aggressiveness. Our (unreported) results reveal that using
these alternative measures of sheltering does not alter the negative relation between leverage
and sheltering.
We employ three alternative definitions of leverage based on market and book values. We
define the market value leverage as the ratio of the book value of long-term debt to the sum
of the total debt and the market value of equity. We define the first alternative book leverage
measure as the ratio of long-term debt to the book value of total assets. The second
alternative book leverage variable is the ratio of the total liabilities net of deferred taxes and
equity and the book value of total assets. Our (unreported) results show that leverage relates
significantly negatively to tax aggressiveness in all the cases.
To ensure that the results of our tests are due to the passage of the BAPCPA and not due to
noise or accident, we choose a random year 1990 and replicate the test around this year, using
three different event windows one, two, and three years before and after 1990. Our
(unreported) results show that the coefficient of the interaction term is not significant.
Finally, as an additional correction for endogeneity, we estimate a 2-stage least-squares
(2SLS) specification in which we use the predicted value of Leverage from the first stage as a
predictor in the second stage where Book Tax Gap is the dependent variable. In the first stage,
we use the lagged value of Leverage and either the mean industry (2-digit SIC) average value
of Leverage (excluding the firm in question) or the industry median value as the second
instrument. In all the cases, we obtain a significantly negative relation between Leverage and
the level of sheltering.
6. Conclusion
In light of the debate on the value implications of sheltering income from taxes and agency
problems, we develop a simple two-date, single-period model to capture the manager‘s
choice of the optimal level of sheltering in the presence of debt. The model predicts that as
long as the probability of bankruptcy is sufficiently high, higher levels of debt reduce the
level of sheltering. Further, the model derives the parameter restrictions under which higher
ownership in the firm attenuates the manager‘s incentives to shelter more income from taxes.
Additionally, the model predicts that the level of sheltering is lower when either the
bankruptcy risk or the manager‘s personal costs associated with bankruptcy are greater.

- 37 -
Finally, the model predicts that the negative relation between sheltering and debt becomes
less negative as the managers‘ alignment incentives increase.
Our empirical tests on a large sample of U.S. firms over the period 1986–2012 offer
considerable support for our theoretical predictions. We find that both higher leverage as well
as bankruptcy risk deters sheltering. We show that these negative relations are robust to
adjustments for endogeneity by using the Bankruptcy Abuse Prevention and Consumer
Protection Act (BAPCPA) of 2005 as a quasi-natural experiment. This Act improved creditor
power and their payoffs in the event of bankruptcy. Therefore, we hypothesise that while the
passage of this Act decreased the levels of sheltering, it reduced the efficacy of debt as a
monitoring mechanism. Our empirical results support both these hypotheses. We find that the
negative relation between sheltering and debt (and bankruptcy risk) is stronger for riskier
firms, which supports our hypothesis that bankruptcy risk is an important determinant of the
level of sheltering. Other cross-sectional tests reveal that the negative effects of debt and
bankruptcy risk are weaker in firms with higher values for institutional ownership,
profitability, size, and the CEO‘s alignment incentives, as well as for firms in the public eye.
The primary contribution of our theoretical and empirical results is to show that bankruptcy
risk—either brought about by the presence of debt or by itself—is an important determinant
of the level of sheltering of income by corporations; both these factors reduce the level of
sheltering. Moreover, our results highlight that debt reduces sheltering not only by
introducing the likelihood of bankruptcy but also by serving as a monitoring mechanism.

- 38 -
References
Alanis, Emmanuel, Sudheer Chava, and Praveen Kumar. ―Shareholder Bargaining Power and Debt
Overhang.‖ Working paper, 2014.
Altman, Edward I. "A Further Empirical Investigation of the Bankruptcy Cost Question." Journal of
Finance 39, 1984: 1067-1089.
Altman, Edward I., and Edith S. Hotchkiss. Corporate Financial Distress and Bankruptcy, 3rd
edition. Hoboken, NJ: John Wiley & Sons, 2006.
Ang, James S., Jess H. Chua, and John J. McConnell. "The Administrative Costs of Corporate
Bankruptcy: A Note." Journal of Finance 37, 1982: 219-226.
Armstrong, Christopher S., Jennifer L. Blouin, Alan D. Jagolinzer, and David F. Larcker. "Corporate
Governance, Incentives, and Tax Avoidance." Stanford University working paper # 136, 2012.
Ayotte, Kenneth M., and Edward R. Morrison. "Creditor Control and Conflict in Chapter 11." Journal
of Legal Analysis Volume 1, 511-551, 2007.
Bergstresser, Daniel, and Thomas Philippon. ―CEO Incentives and Earnings Management.‖ Journal of
Financial Economics 80, 2006: 511-529.
Bharath, Sreedhar, and Tyler Shumway. ―Forecasting Default with the Merton Distance to Default
Model.‖ Review of Financial Studies 21, 2008, 1339 - 1369
Chen, K.P., and C.Y.C Chu. "Internal Control vs. External Manipulation: A Model of Corporate
Income Tax Evasion." Rand Journal of Economics 36, 2005: 151-164.
Clark, Martire, and Bartolomeo. A Study of Fortune 1000 Tax Directors. KPMG, 2000.
Crocker, K.J., and Joel Slemrod. "Corporate Tax Evasion with Agency Costs." Journal of Public
Economics 89, 2005: 1593-1610.
Desai, Mihir A. "The Degradation of Reported Corporate Profits." Journal of Economic Perspectives
19(4), 2005: 171-192.
Desai, Mihir A., Alexander Dyck, and Luigi Zingales. "Theft and Taxes." Journal of Financial
Economics 84, 2007: 591-623.
Desai, Mihir A., and Dhammika Dharmapala. "Corporate Tax Avoidance and Firm Value." The
Review of Economics and Statistics 91, 2009: 537-559.
Desai, Mihir A., and Dhammika Dharmapala. "Corporate Tax Avoidance and High Powered
Incentives." Journal of Financial Economics 79, 2006: 145-179.
Desai, Mihir A., C. Fritz Foley, and James R. Hines "The Demand for Tax Haven Operations."
Journal of Public Economics 90(3), 2006: 513-531.
Frank, Mary M., Luann J. Lynch, and Sonja O. Rego. "Tax Reporting Aggressiveness and its Relation
to Aggressive Financial Reporting." Accounting Review 84(2), 2009.
Gilson, Stuart C. "Management Turnover and Financial Distress." Journal of Financial Economics 25,
1989: 241-262.
Gilson, Stuart C., and Michael R. Vetsuypens. "CEO Compensation in Financially Distressed Firms:
An Empirical Analysis." Journal of Finance 43, 1993: 425-458.

- 39 -
Graham, John R., and Alan L. Tucker. "Tax Shelters and Corporate Debt Policy." Journal of
Financial Economics 81(3), 2006: 563-594.
Grossman, Sanford J., and Oliver Hart. "Corporate Financial Structure and Managerial Incentives." In
The Economics of Information and Uncertainty, by Jonh McCall, 107-140. University of Chicago
Press, 1982.
Hanlon, Michelle, and Joel Slemrod. "What does Tax Aggressiveness Signal? Evidence from Stock
Price Reactions to News About Tax Shelter Involvement." Journal of Public Economics 93, 2009:
126-141.
Hanlon, Michelle, and Shane Heitzman. "A Review of Tax Research." Journal of Accounting and
Economics 50, 2010: 127-178.
Hanlon, Michelle, Lillian F. Mills, and Joel Slemrod. "An Empirical Examination of Corporate Tax
Noncompliance." Ross School of Business Paper No. 1025, 2005.
Harris, Milton, and Artur Raviv. "Capital Structure and the Informational Role of Debt." Journal of
Finance 45(2), 1990: 321-349.
Hasan, Iftekhar, Chun Keung (Stan) Hoi, Qiang Wu, and Hao Zhang. ―Beauty is in the Eye of the
Beholder: The Effect of Corporate Tax Avoidance on the Cost of Bank Loans. Forthcoming Journal
of Financial Economics.
Hollingsworth, Tracy. Manufacturers Alliance/MAPI Survey of Corporate Tax Departments-4th
edition. Arlington, VA: Manufacturers Alliance/MAPI, 2002.
Hotchkiss, Edith S. "Postbankruptcy Performance and Management Turnover." Journal of Finance
50, 1995: 3-21.
Hotchkiss, Edith S., John, Kose, Thorburn Karin S., and Mooradian Robert M. ―Bankruptcy and the
Resolution of Financial Distress.‖ 2008
Jones, Jennifer J. "Earnings Management During Import Relief Investigations." Journal of Accounting
Research 29(2), 1991: 193-228.
Joulfaian, David. "Corporate Debt Policy and Tax Evasion." Working Paper, 2011.
Kroszner, Randall S., and Philip E. Strahan. "Bankers on board: Monitoring, Conflict of Interest, and
Lender Liability." Journal of Financial Economics 62(3), 2001: 415-452.
Lawless, Robert M., and Stephen P. Ferris. "Professional Fees and Other Direct Costs in Chapter 7
Business Liquidations." Washington University Law Quarterly 75, 1997: 1207-1236.
Lisowsky, Petro. "Seeking Shelter: Empirically Modeling Tax Shelters Using Financial Statement
Information." Accounting Review volume 85, 1693-1720, 2010.
Manzon Jr., Gil B., and George A. Plesko. "The Relation Between Financial and Tax Reporting
Measures of Income." Tax Law Review 55, 2002: 175-214.
Meneghetti, Costanza, and Ryan Williams. ―Fortune Favors the Bold‖. Working paper, 2013.
Mills, Lillian F. "Book-Tax Differences and Internal Revenue Service Adjustments." Journal of
Accounting Research 36(2), 1998: 343-356.
Mills, Lillian F., Kaye J. Newberry, and William B. Trautman. "Trends in Book-Tax Income and
Balance Sheet Differences." Tax Notes, Volume 96(8), 2002.

- 40 -
Nini, Greg, David C. Smith, and Amir Sufi. "Creditor Control Rights, Corporate Governance, and
Firm Value." Review of Financial Studies 25(6), 2012: 1713-1761.
Rego, Sonja O., and Ryan J. Wilson. " Equity Risk Incentives and Corporate Tax Aggressiveness."
Journal of Accounting Research, forthcoming, 2012.
Slemrod, Joel. "The Economics of Corporate Tax Selfishness." National Tax Journal 57, 2004: 877-
899.
U.S. Congress. Joint Committee on Taxation. Study of Present-Law Penalty and Interest Provisions
as Required by Section 3801 of the Internal Revenue Service Restructuring and Reform Act of 1998
(Including Provisions Relating to Corporate Tax Shelters): JCS 3-99. Washington: U.S. Government
Printing Office, 1999.
U.S. Congress, Joint Committee on Taxation. Report of Investigation of Enron Corporation and
Related Entities Regarding Federal Tax and Compensation Issues, and Policy Recommendations.
Washington D.C.: JCS-3-03, 2003.
U.S. Department of the Treasury. The Problem of Corporate Tax Shelters: Discussion, Analysis and
Legislative Proposals. Washington D.C.: Government Printing Office, 1999.
Wilson, Ryan J. "An Examination of Corporate Tax Shelter Participants." The Accounting Review
84(3), 2009: 969-999.

- 41 -
Appendix A
Solving for the first-order condition with respect to S in Equation (1), we get Equation (2):
tppktk
aDpBppktkDa
FM
MMF
112
1S*
.
It is easy to show that:
0S
1122
1S2
*2
2
*2
Stppktk
SFM
Thus, S* is a maximum.
Proof of Proposition 1:
We differentiate Equation (2) with respect to D:
0S
112
1S **
Dtppktk
pppktk
D FM
MMF
(A1)
Proposition 1 follows. QED.
Proof of Proposition 2:
We differentiate Equation (2) with respect to λ:
0S
if Thus,
112/
/11
2121S
*
2
*
ktp
kt
tppktk
aDpBppktkDat-
aDpBtpDapkt
F
FM
MMF
MMF
(A2)
Proposition 2 follows. QED.
Proof of Proposition 3:
We differentiate Equation (2) with respect to γ:
0s
112
212S
*
2
*
tppktk
aDpBtpDappktk
FM
MMMF
(A3)
Proposition 3 follows. QED.
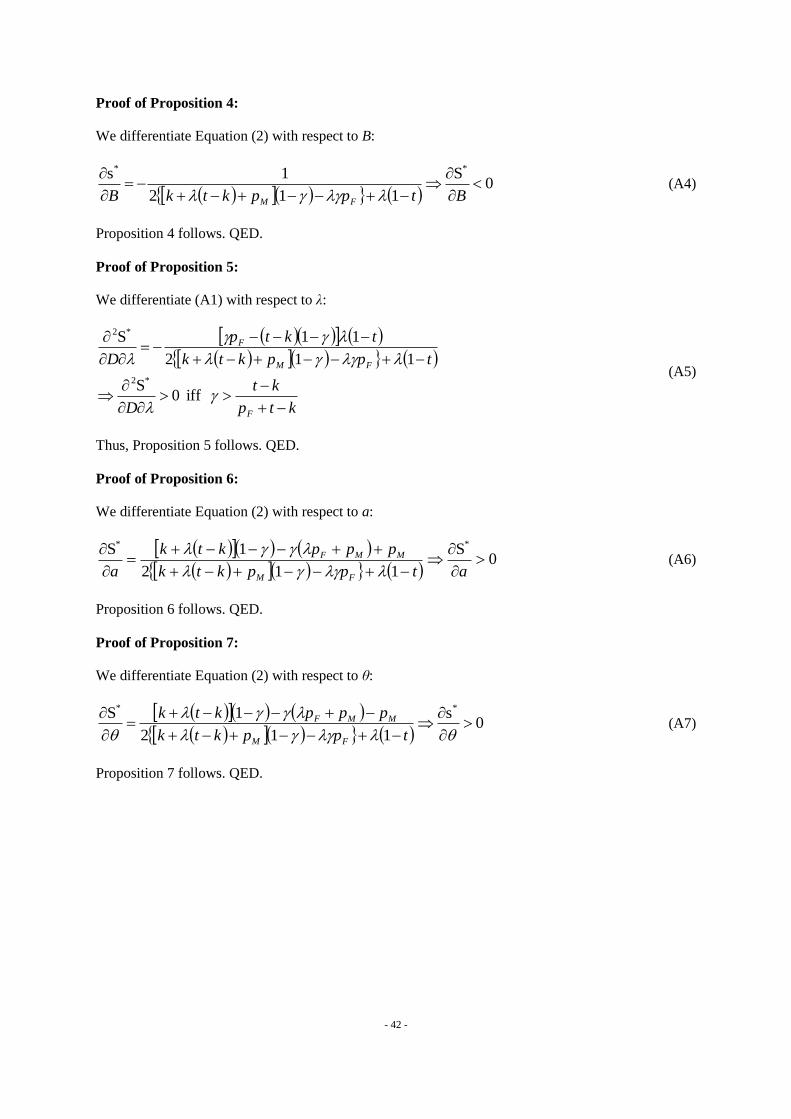
- 42 -
Proof of Proposition 4:
We differentiate Equation (2) with respect to B:
0
S
112
1s **
BtppktkB FM (A4)
Proposition 4 follows. QED.
Proof of Proposition 5:
We differentiate (A1) with respect to λ:
ktp
kt
D
tppktk
tktp
D
F
FM
F
iff 0S
112
11S
*2
*2
(A5)
Thus, Proposition 5 follows. QED.
Proof of Proposition 6:
We differentiate Equation (2) with respect to a:
0S
112
1S **
atppktk
pppktk
a FM
MMF
(A6)
Proposition 6 follows. QED.
Proof of Proposition 7:
We differentiate Equation (2) with respect to θ:
0s
112
1S **
tppktk
pppktk
FM
MMF (A7)
Proposition 7 follows. QED.

- 43 -
Appendix B
Variable Construction
(Continued)
Variable Description Calculation based on Compustat/CDA Spectrum/Execucomp data
items
Dependent Variables
Book Tax Gap Tax sheltering (PI - PIFO - TXFED/0.35 - TXS - TXO - ESUB)/AT
Tobin's q
Ratio of firm's market value
of assets to book value of
assets
(DLTT + DLC + CSHO × PRCC_F)/AT
Control Variable: Firm Characteristics
Leverage Firm market leverage (DLTT + DLC)/(AT - CEQ + CSHO × PRCC_F)
Default
Probability
Computed as in Bharath
and Shumway (2008)
N(-{[(PRC × SHROUT/1,000) + (DLC + 1.5 × DLTT)]/[(DLC +
1.5 × DLTT) × T] + (RETt - 1 - 0.5 × σV2) × T}/σV × sqrt(T))
Size Total assets (in millions) AT
Fort500
Dummy
Dummy equal to 1 if the
firm is in the Fortune 500
list
Profitability
Dummy
Dummy equal to 1 if the
pre-tax income (PI) is
positive
ROA Firm's operating income
to assets OIBDP/AT
ROA
Volatility
Standard deviation of
ROA over previous six
years
Total accruals
Computed as in
Berstresser and Phillipon
(2006)
[(ACTt - ACTt-1) - (LCTt - LCTt-1) - (CHE - CHEt-1) + (DLCt -
DLC-1) - DPt]/ATt-1
Intangibles Ratio of intangible assets
to total assets INTAN/AT
R&D Ratio of R&D expenses to
total assets (0 if missing) XRD/AT
Advertising
Ratio of advertising
expenses to total assets (0
if missing)
XAD/AT
%Institution % of shares held by
institutional investors
R&D Ratio of R&D expenses to
total assets (0 if missing) XRD/AT
Advertising Ratio of R&D expenses to
total assets (0 if missing) XAD/AT
%Institution % of shares held by
institutional investors
Control variable: CEO compensation
Stock Option
Ratio
Ratio of the value of
CEO‘s option grants to
the sum of salary, bonus,
and option grants
Black-Scholes Value of Option Grants/(SALARY + BONUS +
Black-Scholes Value of Option Grants)

- 44 -
Appendix B (continued)
Variable Description Calculation based on Compustat/CDA Spectrum/Execucomp
data items
Manzon and Plesko (2002) controls
NOL
Dummy equal to 1 if the
firm reports a NOL carry-
forward (TLCF) on its
balance sheet
ΔNOL Change in NOL carry-
forwards TLCFt - TLCFt-1
Sales Growth Sales growth rate (SALEt - SALEt-1)/SALEt-1
PP Ratio Ratio of net to gross fixed
assets PPENT/PPEGT
ΔPost-
retirement
Obligations
Change in post-retirement
obligations PRBAt - PRBAt-1
Pre-1993
goodwill Goodwill before or in 1993 GDWL
Post-1993
goodwill Goodwill after 1993 GDWL
Other
Intangibles Other intangible assets INTAN - GDWL
Foreign
Operations
Absolute value of firm‘s
foreign pre-tax income |PIFO|