debt, deflation, and debacle
DESCRIPTION
by Richard Vague, managing partner of Gabriel Investments, and Robert Hockett, professor of law at Cornell University Law SchoolTRANSCRIPT

Debt, Deflation, and Debacle
Presentation to the GIC Richmond, Virginia
April 9, 2013

0
50
100
150
200
250
300
1945 2011
Debt to GDP
The Raging Debate Between Stimulus and Austerity
on Public Debt
Blue — Federal Debt
Red — Private Debt
Debate tends to omit discussion of private debt

0
10
20
30
40
50
60
70
80
19
60
19
62
19
64
19
66
19
68
19
70
19
72
19
74
19
76
19
78
19
80
19
82
19
84
19
86
19
88
19
90
19
92
19
94
19
96
19
98
20
00
20
02
20
04
20
06
20
08
20
10
U.S. Home Mortgages as a percent of GDP
(in percent)
Mortgage Loans/GDP
Mortgage Loans if Continued 16% Trend
3
Average 16% growth in previous four decades
RUNAWAY LENDING! 68% growth in ten years and 46% growth in six years
$2.5 trillion in excess mortgages vs trend line
Inevitable spate of non-payment after a period of binge lending brought the Great Recession
Higher asset values not a mitigant, true constraint is income
Rapid Increase in Private Debt Caused the Great Recession

Why Does High Debt to GDP Matter?
• If a home or business owner has high levels of debt, reduced capacity for additional spending and investment
• In aggregate, a country’s capacity for growth is constrained if its citizens and businesses collectively are operating at high leverage

$0
$5,000
$10,000
$15,000
$20,000
$25,000
$30,000
GDP Non-FinancialPrivate Debt
Total Public Debt Money Supply Trade Tax Receipts
2011 Comparison of Economic Categories (in billions)
5
$9 trillion growth in the last ten years

GDP growth correlates more to private debt growth than government debt growth
-10%
-5%
0%
5%
10%
15%
20%
25%
19
70
19
73
19
76
19
79
19
82
19
85
19
88
19
91
19
94
19
97
20
00
20
03
20
06
20
09
U.S. Growth in GDP, Private Debt, and Public Debt
1970-2011
Growth in GDP
Growth in Private
Growth in Public
-8%
-6%
-4%
-2%
0%
2%
4%
6%
8%
10%
12%
19
90
19
92
19
94
19
96
19
98
20
00
20
02
20
04
20
06
20
08
20
10
Japan Growth in GDP, Public Debt, and Private Debt
1990-2010
Growth GDP
Growth Public Debt
Growth PrivateDebt
Also correlates more than consumer or business separately, M2, trade imbalance levels

If runaway private lending caused the Great Recession, did it also lead to the Great
Depression?

$0
$20
$40
$60
$80
$100
$120
$140
$160
$180
19
19
19
20
19
21
19
22
19
23
19
24
19
25
19
26
19
27
19
28
19
29
19
30
19
31
19
32
19
33
19
34
19
35
Nominal Private Debt Totals 1919-1935 (in billions)
66% growth 1919-1929
8
80
100
120
140
160
180
200
1 2 3 4 5 6 7 8 9 10 11
Private Debt to GDP Trends prior to the Great Depression and Great Recession
(in percent)
Private Debt/GDP 1920-1930
Private Debt/GDP 1997-2007
Runaway Lending: 40% Private Debt to GDP Growth

If the 1920s and 2000s had 40% private debt growth, how many
OTHER times in the last century has private debt growth been 40% in a
single decade?

0
50
100
150
200
250
19
16
19
19
19
22
19
25
19
28
19
31
19
34
19
37
19
40
19
43
19
46
19
49
19
52
19
55
19
58
19
61
19
64
19
67
19
70
19
73
19
76
19
79
19
82
19
85
19
88
19
91
19
94
19
97
20
00
20
03
20
06
20
09
KEY GRAPH: Private Debt and Public Debt to GDP 1916-2011
(in percent)
Private/GDP
Public Debt/GDP
1916 2011
0
50
100
150
200
2501
91
6
19
19
19
22
19
25
19
28
19
31
19
34
19
37
19
40
19
43
19
46
19
49
19
52
19
55
19
58
19
61
19
64
19
67
19
70
19
73
19
76
19
79
19
82
19
85
19
88
19
91
19
94
19
97
20
00
20
03
20
06
20
09
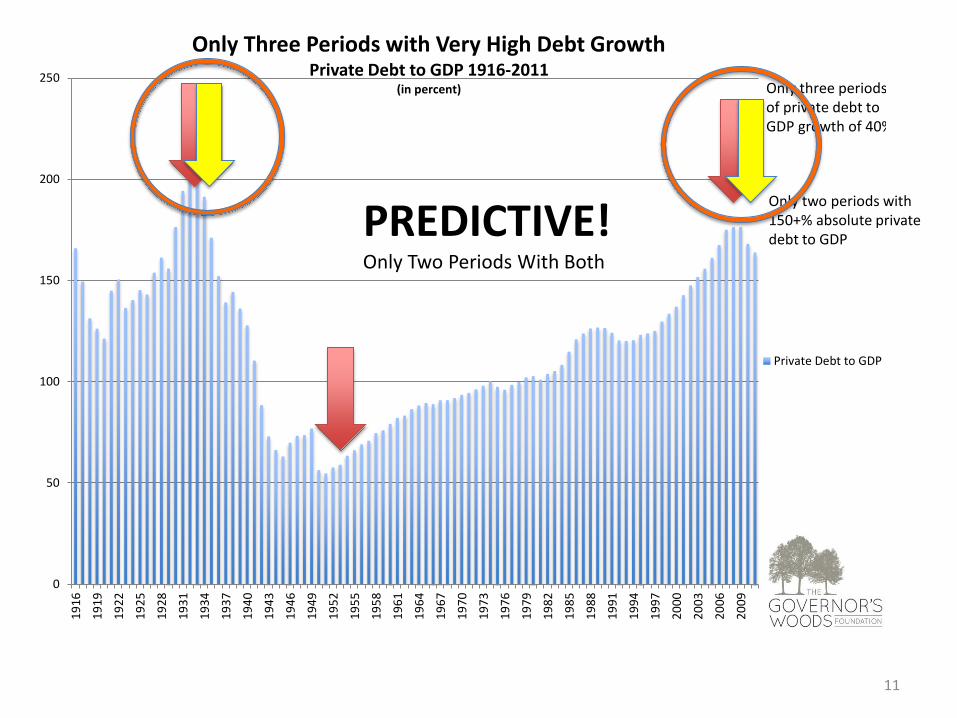
Only Three Periods with Very High Debt Growth Private Debt to GDP 1916-2011
(in percent)
Private Debt to GDP
Only three periods of private debt to GDP growth of 40%
11
Only two periods with 150+% absolute private debt to GDP
PREDICTIVE! Only Two Periods With Both

• GOOD NEWS: we now have a tool for predicting — and preventing — the next major crisis of this magnitude
• But how did we miss something so obvious?
• Because many prevailing economic theories and forecasting models ignore debt as “net zero”
• False comfort from low interest rates
• In addition, we missed it because it is widely held that loan growth is always bullish

• WE ARE STILL WELL ABOVE 150% PRIVATE DEBT TO GDP — and growth is harder when you have high debt
• SO HOW WOULD YOU ADVISE DECREASING OUR HIGH RATIO OF DEBT?
– Paying down debt?

$0
$20
$40
$60
$80
$100
$120
$140
$160
$180
1920 1921 1922 1923 1924 1925 1926 1927 1928 1929 1930 1931 1932 1933 1934 1935 1936 1937 1938 1939
Nominal U.S. GDP, Private Debt, and Public Debt 1920-1939 (in billions)
Private Debt
GDP
Public Debt
• Bank runs precipitated loan liquidation
• Attitude of times: Treasury Secretary Mellon said “liquidate labor, liquidate stocks, liquidate farmers, liquidate real estate … it will purge the rottenness out of the system. … Enterprising people will pick up from less competent people.”
• Mellon advocated weeding out “weak” banks

• The single biggest lesson of the Great Depression for economists was to AVOID major debt pay down — a “liquidity crunch”
• Thus, in the 2000s, we again had runaway lending, but no massive debt pay down after the crisis point, so instead of private debt contraction of 25% and unemployment of 25%, it was 3% and 9%

0
5000
10000
15000
20000
25000
30000
1998 1999 2000 2001 2002 2003 2004 2005 2006 2007 2008 2009 2010 2011
Nominal U.S. GDP, Private Debt, and Public Debt Trends 1998 to 2011
(in billions)
Private Debt
GDP
Public Debt
Private Debt/GDP has declined 10% from crisis peak, but is 15% above 2000 and 53% above 1980

• We avoided Depression, but we have a NEW DILEMMA,
– deleveraging contracts GDP, while
– re-leveraging promotes growth, but increases the structural precariousness of the economy and dampens future growth
• EUROZONE CRISIS is also about runaway private debt
• Runaway lending happened in Japan in 1991 — almost 40% private debt growth in ten years then a stock and real estate crash. But no private debt or GDP contraction for 5 years and private debt still at 150% of GDP over 20 years later.
50%
100%
150%
200%
250%
300%
350%
400%
19
80
19
83
19
86
19
89
19
92
19
95
19
98
20
01
20
04
20
07
20
10
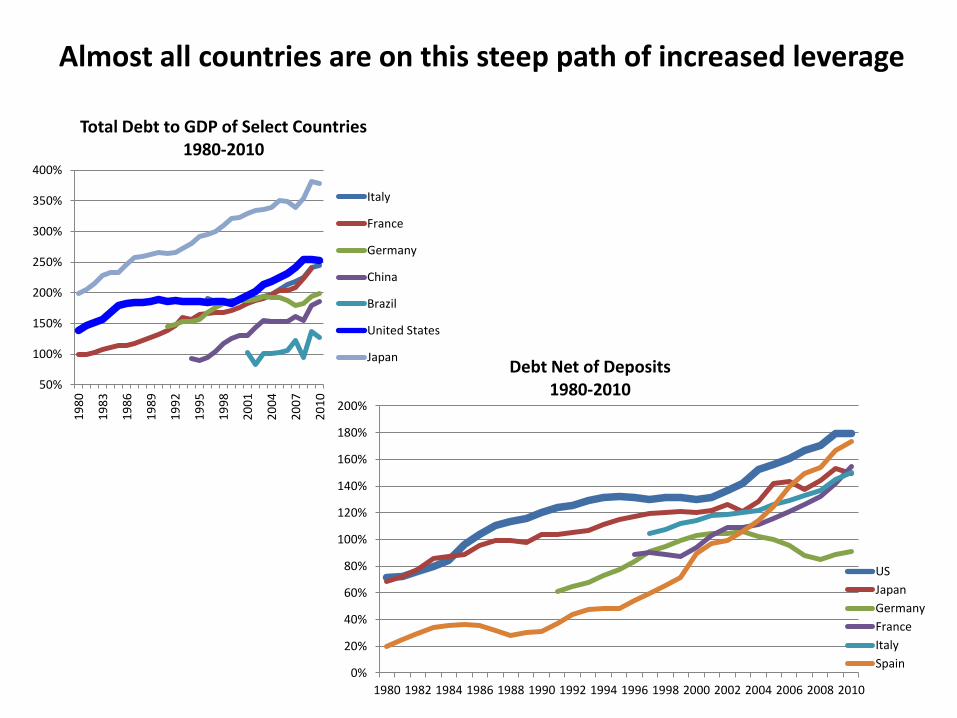
Total Debt to GDP of Select Countries 1980-2010
Italy
France
Germany
China
Brazil
United States
Japan
0%
20%
40%
60%
80%
100%
120%
140%
160%
180%
200%
1980 1982 1984 1986 1988 1990 1992 1994 1996 1998 2000 2002 2004 2006 2008 2010
Debt Net of Deposits 1980-2010
US
Japan
Germany
France
Italy
Spain
Almost all countries are on this steep path of increased leverage

• SO HOW WOULD YOU ADVISE DECREASING OUR HIGH LEVELS OF DEBT? – Paydown — causes economic contraction
– Getting government debt under control — a must at some point, but does create short-term GDP pressure and does not address private debt levels
– Growth or Inflation – takes 15 to 20 years or more — and bumps up against the dampening effect of debt on growth
– Debt restructuring — obstacle of moral hazard and objections regarding wealth transfer — but a trillion in restructuring is better than a trillion in new stimulus
– Live with it — don’t we always?

Dr. Robert C. Hockett

125.00
135.00
145.00
155.00
165.00
175.00
185.00
195.00
205.00
215.00
225.00
-3.00%
-2.50%
-2.00%
-1.50%
-1.00%
-0.50%
0.00%
0.50%
1.00%
1.50%
2.00%
Jul-06 Dec-06 May-07 Oct-07 Mar-08 Aug-08 Jan-09 Jun-09 Nov-09 Apr-10 Sep-10 Feb-11 Jul-11 Dec-11 May-12
20
-Cit
y C
om
po
site
Ca
se S
hill
er
Ho
me
Pri
ce I
nd
ex
3-M
on
th M
ov
ing
Av
era
ge
Ch
an
ge
In 2
0-C
ity
Co
mp
osi
te C
ase
Sh
ille
r H
om
e P
rice
In
de
x
20-City Composite Case Shiller Home Price IndexJuly 2006 to May 2012
3 Month Moving Average Change in HPI 20-City Composite HPI
August 2009
June2010
July2011
Post-Bust Home Price Cyclicality

Regional Concentration of High LTV Underwater Mortgages CoreLogic Negative Equity

Sampling of High LTV Zip Code Areas
ZIP Code City State % Underwater % Price Decline
92301 Adelanto CA 64% -70%
93501 Mojave CA 65% -71%
93505 California City CA 72% -71%
33035 Homestead FL 68% -69%
33127 Miami FL 57% -70%
33142 Miami FL 62% -66%
30274 Riverdale GA 85% -71%
30296 Riverdale GA 84% -66%
30297 Forest Park GA 81% -72%
89030 North Las Vegas NV 77% -76%
89101 Las Vegas NV 75% -76%
89106 Las Vegas NV 72% -71%
89115 Las Vegas NV 77% -72%

Employment-to-Population Ratio Trendline
50%
52%
54%
56%
58%
60%
62%
64%
66%
35%
40%
45%
50%
55%
60%
65%
1960 1965 1970 1975 1980 1985 1990 1995 2000 2005 2010
Employment-to-Population Ratio, 1960-2012
Women's Labor Force Participation (left)
Full-time Employment to Population Ratio (right)
Full-time and Part-time Employment-to-Population Ratio (right)
Source: Bureau of Labor Statistics
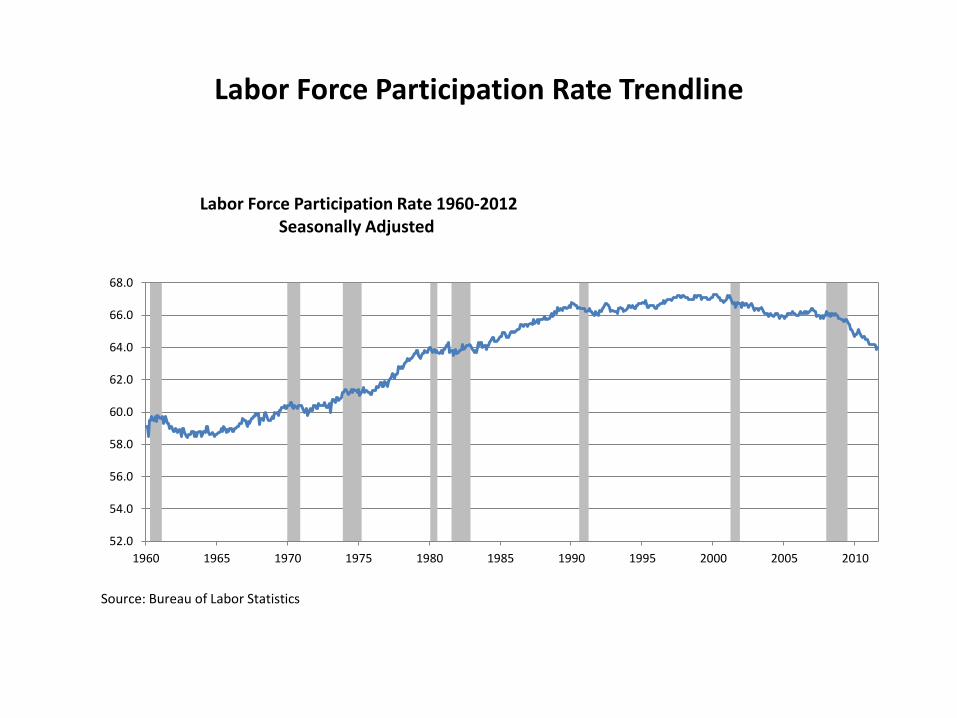
Labor Force Participation Rate Trendline
52.0
54.0
56.0
58.0
60.0
62.0
64.0
66.0
68.0
1960 1965 1970 1975 1980 1985 1990 1995 2000 2005 2010
Labor Force Participation Rate 1960-2012 Seasonally Adjusted
Source: Bureau of Labor Statistics

Lease Swap
A Resides
B Resides
A Resides
A Resides
B Resides
B Resides
Date 1
Date 2
Date 3
A Owns B Owns
A/B Negative Equity
A/B Bankruptcy
A/B Positive Equity

Structure of Modification Transaction via Eminent Domain
• Investors:
Private &/or Federal
Current MBS
Holders
Eminent
Domain
Trusts
States/
Subunits
PLS Trusts
Overlapping Membership
Good Loans Bad Loans
$
$
$ $
$
New Obligation New Lending
Home-
Owners
Note: The double-headed arrow represents class overlap rather than a flow. The two vertical arrows crossing the dotted line represent a
detour between the “bad loan” and “good loan” arrows.