debt to degree: debt to degree: a new way of measuring college success
DESCRIPTION
Higher education is plagued by two chronic problems: dropouts and debt. The federal government has tracked these issues separately for years. And, while each of these statistics provides valuable information, none shows a complete picture. Until now. A new, comprehensive "borrowing-to-credential ratio" offers a more complete way for the public to measure the value of college.TRANSCRIPT
charts you can trust
www.educationsector.org
The American higher education system is plagued by two chronic
problems: dropouts and debt. Barely half of the students who start college get
a degree within six years, and graduation rates at less-selective colleges often
hover at 25 percent or less. At the same time, student loan debt is at an all-time
high, recently passing credit card debt in total volume.1 Loan default rates have
risen sharply in recent years, consigning a growing number of students to years
of financial misery. In combination, drop-outs and debt are a major threat to the
nation’s ability to help students become productive, well-educated citizens.
The federal government has traditionally tracked these issues by calculating, for
each college, the total number of degrees awarded, the percentage of students
who graduate on time, and the percentage of students who default on their loans.
Each of these statistics provides valuable information, but none shows a complete
picture. A college could achieve a stellar graduation rate by passing students
along and handing out degrees that have little value in the job market, making it
difficult for graduates to earn enough money to pay off their debt. Alternatively, a
college could keep tuition and loan default rates low while also providing a terrible
education and helping few students earn degrees. Students choosing colleges and
policymakers governing higher education need an overall measure of value, one
that combines debt and graduation.
Education Sector has created such a measure, the “borrowing to credential ratio.”
For each college, we have taken newly available U.S. Department of Education data
showing the total amount of money borrowed by undergraduates and divided that
sum by the total number of degrees awarded. The results are revealing:
• Nationwide, the overall borrowing to credential ratio has risen sharply in recent
years.
• Certain segments of the higher education industry—in particular, for-profit
colleges—are racking up far more student debt per degree than others.
• State policies matter a great deal, with seemingly similar public university
systems achieving widely varying results for students.
• Among elite colleges and universities, some are making good on their pledge
to help low- and middle-income students graduate without major financial
burdens while others are riding a wave of student debt to fame and fortune.
Debt to Degree: A New Way of Measuring College Success
By Kevin Carey and Erin Dillon

charts you can trust2
www.educationsector.org • August 2011
The National Picture
We calculated the borrowing to credential ratio for the three most recent academic
years with available data: 2006–07, 2007–08, and 2008–09. As Chart 1 shows,
the average amount of student debt needed to produce a degree in America is
increasing rapidly. In 2006–07, students borrowed $13,334 for every credential
earned.2 In 2007–08, that amount rose to $14,560, a 9 percent increase. In
2008–09 it rose by another 24 percent to $18,102.
A number of factors are fueling this trend. The overall cost of higher education
has been rising for years, increasing by 3.1 percent above inflation throughout the
1990s and 3.8 percent during the 2000s.3 The recent economic downturn made
things worse, as cash-starved states cut public university budgets, and universities
responded by jacking up tuition. At the same time, unemployment rose and family
income fell, forcing more students and parents to borrow in order to pay fast-
rising tuition bills. The national borrowing to credential ratio is moving in a troubling
direction. It is taking more and more debt to produce a degree.
Different Sectors, Different Trends
While the borrowing to credential ratio increased in every sector of higher education
from 2006 to 2009, ratios in some sectors were much larger and grew much faster
than others. The average ratio at four-year institutions was $18,559 over the three-
year period, more than double the $7,218 at two-year institutions. This is to be
expected: four-year institutions provide a longer education and generally charge
more per credit than two-year institutions, particularly low-cost community colleges
where borrowing is still relatively uncommon.
$20,000
$15,000
$10,000
$5,000
$0
Average borrowing to credential ratio, undergraduate federal student loans, 2006–2009
3-year average = $15,392
2006–07 2007–08 2008–09
+24%
+9%
Source: Author analysis of undergraduate borrowing data obtained from the U.S. Department of Education for 2006–07, 2007–08, and 2008–09, and the number of credentials awarded based on data from the Integrated Postsecondary Education Survey for 2006–07, 2007–08, and 2008–09. See appendix for details on the methodology.
ChArT 1
The national borrowing to credential ratio is growing rapidly.
charts you can trust3
www.educationsector.org • August 2011
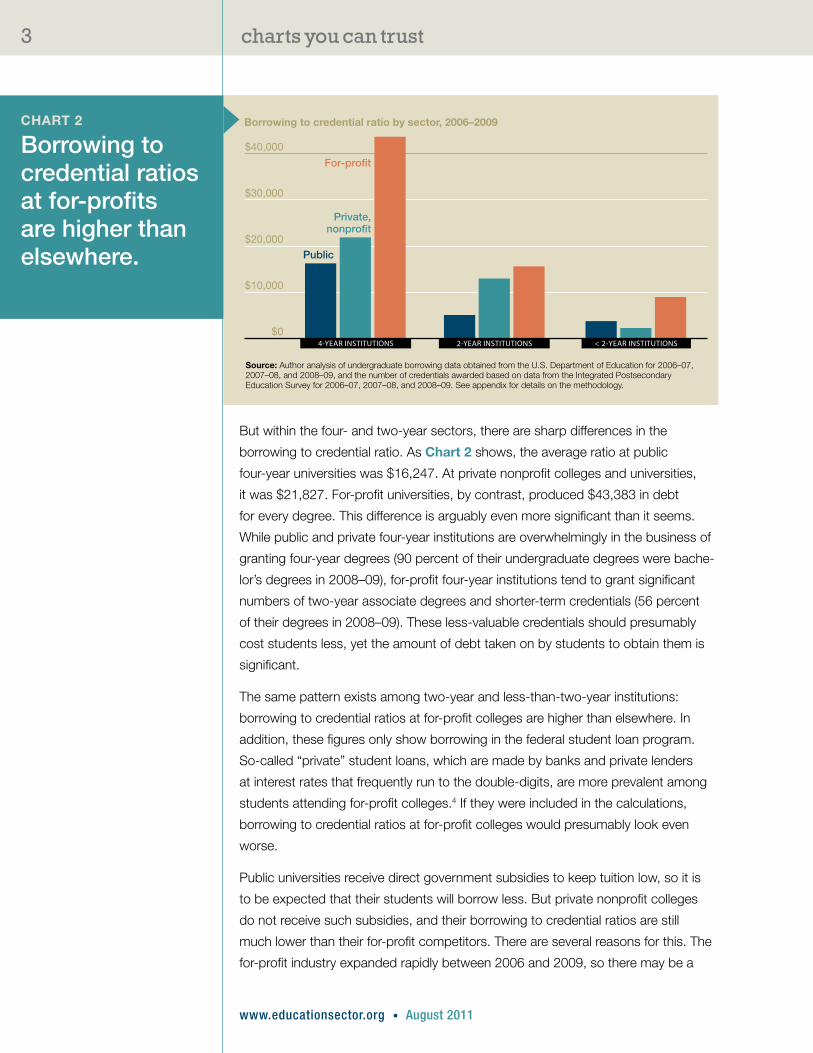
But within the four- and two-year sectors, there are sharp differences in the
borrowing to credential ratio. As Chart 2 shows, the average ratio at public
four-year universities was $16,247. At private nonprofit colleges and universities,
it was $21,827. For-profit universities, by contrast, produced $43,383 in debt
for every degree. This difference is arguably even more significant than it seems.
While public and private four-year institutions are overwhelmingly in the business of
granting four-year degrees (90 percent of their undergraduate degrees were bache-
lor’s degrees in 2008–09), for-profit four-year institutions tend to grant significant
numbers of two-year associate degrees and shorter-term credentials (56 percent
of their degrees in 2008–09). These less-valuable credentials should presumably
cost students less, yet the amount of debt taken on by students to obtain them is
significant.
The same pattern exists among two-year and less-than-two-year institutions:
borrowing to credential ratios at for-profit colleges are higher than elsewhere. In
addition, these figures only show borrowing in the federal student loan program.
So-called “private” student loans, which are made by banks and private lenders
at interest rates that frequently run to the double-digits, are more prevalent among
students attending for-profit colleges.4 If they were included in the calculations,
borrowing to credential ratios at for-profit colleges would presumably look even
worse.
Public universities receive direct government subsidies to keep tuition low, so it is
to be expected that their students will borrow less. But private nonprofit colleges
do not receive such subsidies, and their borrowing to credential ratios are still
much lower than their for-profit competitors. There are several reasons for this. The
for-profit industry expanded rapidly between 2006 and 2009, so there may be a
$40,000
$30,000
$20,000
$10,000
$0
Borrowing to credential ratio by sector, 2006–2009
4-YEAR INSTITUTIONS 2-YEAR INSTITUTIONS < 2-YEAR INSTITUTIONS
Public
For-profit
Private,nonprofit
Source: Author analysis of undergraduate borrowing data obtained from the U.S. Department of Education for 2006–07, 2007–08, and 2008–09, and the number of credentials awarded based on data from the Integrated Postsecondary Education Survey for 2006–07, 2007–08, and 2008–09. See appendix for details on the methodology.
ChArT 2
Borrowing to credential ratios at for-profits are higher than elsewhere.
charts you can trust4
www.educationsector.org • August 2011
disproportionate number of students in the system who have borrowed but not yet
graduated.5 Overall graduation rates at many for-profits are very low—37 percent at
for-profit four-year institutions, for example.6 Borrowing rates at for-profits are often
very high. Large for-profits like The University of Phoenix and Kaplan University
get over 80 percent of their revenues from federal grant and loan programs, and
recruiters actively encourage students to take out loans.8 And while the “sticker
price” at private nonprofit colleges is frequently substantial, those institutions also
provide many students with tuition discounts that for-profits do not.
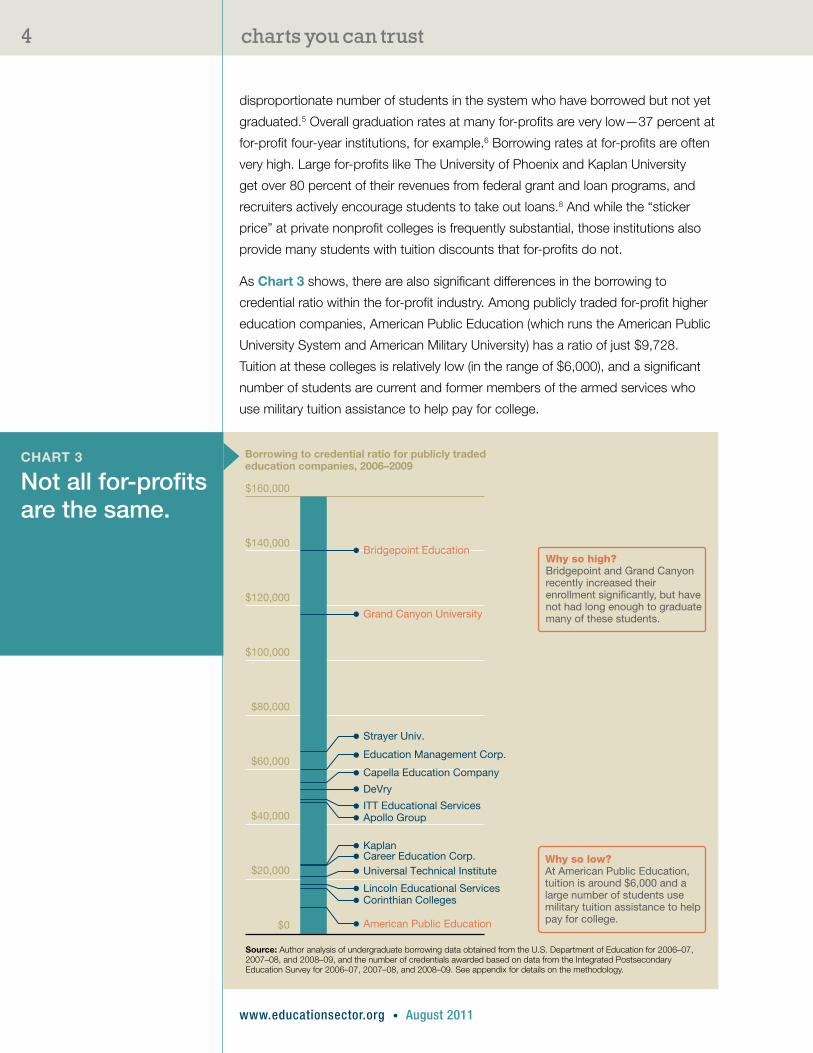
As Chart 3 shows, there are also significant differences in the borrowing to
credential ratio within the for-profit industry. Among publicly traded for-profit higher
education companies, American Public Education (which runs the American Public
University System and American Military University) has a ratio of just $9,728.
Tuition at these colleges is relatively low (in the range of $6,000), and a significant
number of students are current and former members of the armed services who
use military tuition assistance to help pay for college.
$0
$20,000
$40,000
$60,000
$80,000
$100,000
$120,000
$140,000
$160,000
Borrowing to credential ratio for publicly tradededucation companies, 2006–2009
Bridgepoint Education
Grand Canyon University
Strayer Univ.
Education Management Corp.
Kaplan
American Public Education
Corinthian Colleges
Career Education Corp.Universal Technical Institute
Lincoln Educational Services
Capella Education Company
DeVry
ITT Educational ServicesApollo Group
Why so high?Bridgepoint and Grand Canyon recently increased their enrollment signi�cantly, but have not had long enough to graduate many of these students.
Why so low?At American Public Education, tuition is around $6,000 and a large number of students use military tuition assistance to help pay for college.
Source: Author analysis of undergraduate borrowing data obtained from the U.S. Department of Education for 2006–07, 2007–08, and 2008–09, and the number of credentials awarded based on data from the Integrated Postsecondary Education Survey for 2006–07, 2007–08, and 2008–09. See appendix for details on the methodology.
ChArT 3
Not all for-profits are the same.
charts you can trust5
www.educationsector.org • August 2011
Corinthian Colleges and Lincoln Educational Services have ratios that are compa-
rable to public and private nonprofit universities, $16,560 and $18,209, respectively.
This is because most of the degrees they grant (81 percent) are one- or two-year
certificates for jobs like medical assistant or electrician. For-profits that focus
on bachelor’s degrees, by contrast, don’t fare as well. The Apollo Group, the
parent company of the industry-leading University of Phoenix, has a borrowing to
credential ratio of $48,107. Apollo Group students borrowed over $6.5 billion from
2006 to 2009. Strayer Education’s numbers are even worse, producing a $66,651
ratio. The two largest ratios among publicly traded for-profits were found at Grand
Canyon University and Bridgepoint Education, each exceeding $100,000. In part,
this is because Grand Canyon and Bridgepoint are the newest big players in the
for-profit industry, each enrolling tens of thousands of new students online in the
mid-to-late 2000s. In their case, there may be a lag between initial borrowing and
subsequent graduation that artificially inflates their borrowing to credential ratio.
There may also be problems with graduation. Recent hearings conducted by
the United States Senate Committee on Health, Education, Labor and Pensions,
found that after Bridgeport acquired a small, Franciscan college renamed Ashford
University in 2005, enrollment grew from 400 students to almost 43,000, nearly all
studying online. The current graduation rate at Ashford is roughly 30 percent.9
State Policy Matters
Traditional public universities produce lower borrowing to credential ratios than
for-profit colleges, on average. But there is still much variation within the public
sector. Consider Iowa State University and Florida State University. On the surface,
they look very similar. Founded in the 1850s, both are large, public universities that
conduct a significant amount of research but play second fiddle to their state’s
flagship university. Both graduate just over two-thirds of their students within six
years, most of whom attend college full-time and are of traditional college-going
age. The average ACT scores of entering freshman are similar (mid-20s) as are the
percentages of students who receive Pell grants. The total cost of attending each
institution is very similar—Iowa costs $165 more.
But the borrowing to credential ratio shows that appearances can be deceiving.
Iowa State students borrow $20,237 per degree earned. This is almost double the
ratio at Florida State, which is $10,888.
The difference is state policy. All states subsidize higher education, but some are
more generous than others. Students who pay less borrow less, and that affects
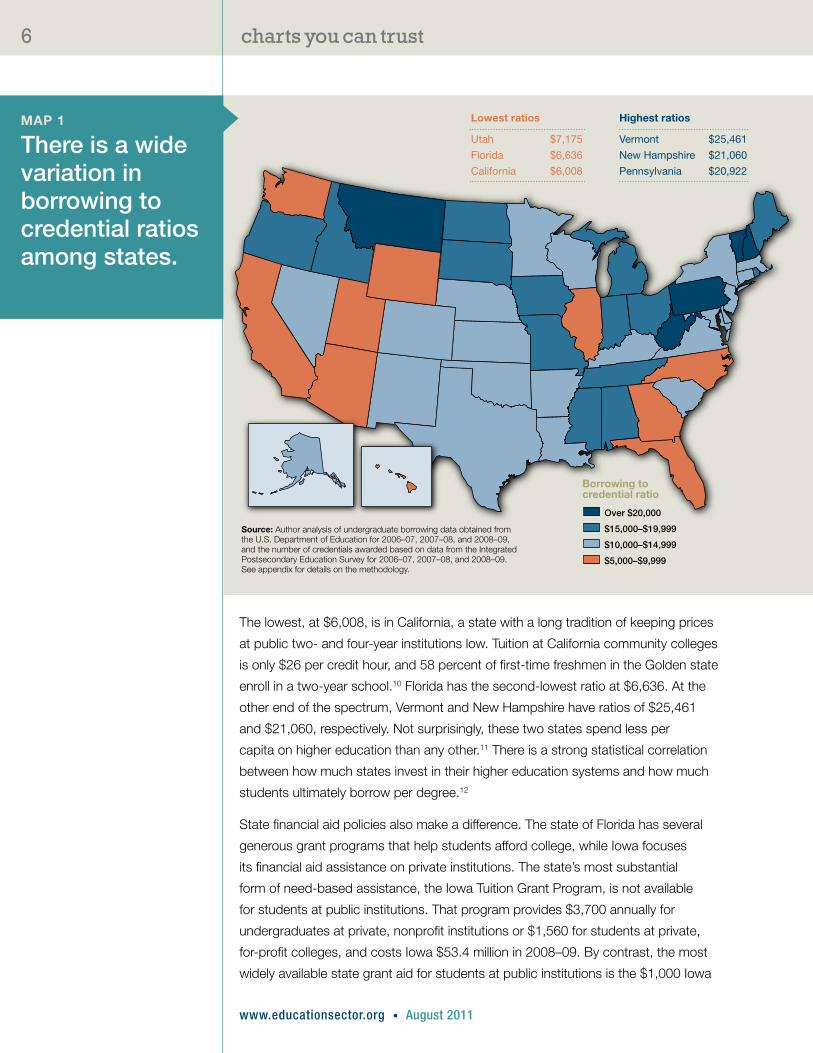
the borrowing to credential ratio. Map 1 shows the overall borrowing to credential
ratio at public institutions in all 50 states.
charts you can trust6
www.educationsector.org • August 2011
The lowest, at $6,008, is in California, a state with a long tradition of keeping prices
at public two- and four-year institutions low. Tuition at California community colleges
is only $26 per credit hour, and 58 percent of first-time freshmen in the Golden state
enroll in a two-year school.10 Florida has the second-lowest ratio at $6,636. At the
other end of the spectrum, Vermont and New Hampshire have ratios of $25,461
and $21,060, respectively. Not surprisingly, these two states spend less per
capita on higher education than any other.11 There is a strong statistical correlation
between how much states invest in their higher education systems and how much
students ultimately borrow per degree.12
State financial aid policies also make a difference. The state of Florida has several
generous grant programs that help students afford college, while Iowa focuses
its financial aid assistance on private institutions. The state’s most substantial
form of need-based assistance, the Iowa Tuition Grant Program, is not available
for students at public institutions. That program provides $3,700 annually for
undergraduates at private, nonprofit institutions or $1,560 for students at private,
for-profit colleges, and costs Iowa $53.4 million in 2008–09. By contrast, the most
widely available state grant aid for students at public institutions is the $1,000 Iowa
Borrowing tocredential ratio
Over $20,000
$15,000–$19,999
$10,000–$14,999
$5,000–$9,999
Source: Author analysis of undergraduate borrowing data obtained from the U.S. Department of Education for 2006–07, 2007–08, and 2008–09, and the number of credentials awarded based on data from the Integrated Postsecondary Education Survey for 2006–07, 2007–08, and 2008–09. See appendix for details on the methodology.
Highest ratios
Vermont $25,461
New Hampshire $21,060
Pennsylvania $20,922
Lowest ratios
Utah $7,175
Florida $6,636
California $6,008
MAp 1
There is a wide variation in borrowing to credential ratios among states.
charts you can trust7
www.educationsector.org • August 2011
Grant, which costs the state just $1.8 million in 2008–09.13 The end result is that
Florida spends $585 more per student in grant aid than Iowa, and this additional
grant aid translates into lower debt for each credential produced at Florida public
institutions.14
Favoring Flagships
State policies also produce another notable borrowing to credential ratio trend:
ratios are consistently lower at state flagship universities.15 In 2006–07, the average
ratio at state flagship universities was $1,783 lower than at other public universities.
By 2008–09, that difference had grown to $2,549, a 43 percent increase. This is
despite the fact that average tuition and fees at state flagship universities were
$2,072 higher than at other public universities in 2008–09.
In part, this is because flagship universities tend to be the most selective and enroll
students who are wealthier and more academically prepared. Well-off students have
less need to borrow, and well-prepared students are more likely to earn degrees.
Flagship universities tend to receive more funding per-student from the state and
have a greater capacity to raise money from wealthy alumni that can be used to
defray tuition for low-income students.
State financial aid policies also contribute to the difference. Georgia’s well-known
HOPE scholarship program has successfully used the lure of generous scholarships
to keep promising students in-state at the flagship University of Georgia. Many of
these students come from well-off households to begin with, and the HOPE schol-
arship makes their cost of attending college quite low.
Florida provides another example. The state’s “Bright Futures” scholarship program
offers differing levels of financial aid to students based on their academic perfor-
mance in high school and score on college entrance tests such as the SAT and
ACT. Students with the best marks can earn up to $101 a credit, while students
who did well but missed the top threshold can receive up to $76 a credit.16
Although the percentage of students who received a Bright Futures award at the
flagship University of Florida is roughly the same as at Florida State, University
of Florida students were more likely to be in the top award category.17 Florida’s
endowment is more than three times that of Florida State, giving it relatively more
resources to provide students with grants and reduce their need to borrow.18 In
2008–09, only 53 percent of the University of Florida’s degree-seeking undergrad-
uates applied for financial aid, compared to 65 percent at Florida State.19 Florida’s
graduation rate is 10 percentage points higher. In sum, these differences produced
a $6,087 borrowing to credential ratio at Florida from 2006 to 2009, while Florida
State’s ratio was nearly $11,000.
charts you can trust8
www.educationsector.org • August 2011
Money Matters at Elite Schools
At the top of the higher education heap lie elite private research universities. These
world-famous institutions have their pick of students and operate free from most
state policies. But the borrowing to credential ratio reveals large differences among
them. Chart 4 shows the ratio for the 33 private institutions classified as top
research universities by the Carnegie Foundation.
Like most such universities, Princeton charges a top-dollar sticker price: $36,640
per year. But its borrowing to credential ratio is miniscule at $2,385. Many
Princeton students are very wealthy. So is the university, which has a $14.4 billion
endowment. Since 2002, Princeton has had a policy of not including loans in
the financial aid package it awards students who can’t afford to pay full tuition.20
Nineteen of the universities listed on Chart 4 have some form of this “debt
pledge.”21 Their average ratio was $9,688. The 14 universities without the pledge,
by contrast, have an average borrowing to credential ratio of $17,504.
The single largest ratio among elite private research universities can be found
at New York University, whose $25,886 ratio of borrowing to debt exceeds that
of some for-profit colleges. Graduation isn’t a problem at NYU—86 percent of
students who start earn degrees there. But NYU is a relatively new arrival on the
elite research university scene and does not have the kind of endowment that
comes from educating the rich and powerful for decades or more. While there are
no national comparable statistics on student wealth, it’s likely that NYU students are
not as well-off as those who attend competitor schools. As a result, many borrow
large amounts of money to attend NYU.
Stopping the Trends
Borrowing is increasingly the norm in American higher education. The long-term
consequences of floating colleges on a sea of debt have yet to be fully realized, as a
growing number of students leave school with tens of thousands of dollars in loans
that can take as long as 30 years to repay and cannot be discharged in bankruptcy.
National graduation rates have been stagnant for decades, and many competitor
nations are helping more adults earn valuable college degrees. The sharp increase
in the national borrowing to credential ratio suggests that urgent action is needed to
arrest these trends.
Fortunately, concrete steps can be taken to solve these problems. States and
colleges can re-orient their financial aid policies toward students who need financial
aid the most. They can also focus more attention on counseling and academic
support for students who are at-risk of dropping out. States like Iowa can learn from
more successful states like Florida. New regulations like the “gainful employment”

charts you can trust9
www.educationsector.org • August 2011
$0
$5,000
$2,500
$7,500
$12,500
$10,000
$17,500
$15,000
$22,500
$20,000
$25,000
Borrowing to credential ratio at elite colleges, 2006–2009
* = Debt pledge.Source: Author analysis of undergraduate borrowing data obtained from the U.S. Department of Education for 2006–07, 2007–08, and 2008–09, and the number of credentials awarded based on data from the Integrated Postsecondary Education Survey for 2006–07, 2007–08, and 2008–09. See appendix for details on the methodology.
New York University
Rensselaer Polytechnic Inst.
University of Rochester
Case Western Reserve University
Johns Hopkins University
University of Notre Dame
Tulane University of Louisiana
Emory University*University of Pennsylvania*Vanderbilt University*Tufts University*Duke University*Northwestern University*Cornell University*Brown University*
Dartmouth College*
Yale University*
Stanford University*Yeshiva UniversityWashington University in St. Louis*Rice University*Massachussetts Inst. of Technology*
Harvard University*
California Inst. of Technology*
Princeton University*
Brandeis University
University of MiamiUniversity of Chicago*Georgetown University
University of Southern California
Boston UniversityCarnegie Mellon UniversityColumbia University*
Why so high?NYU lacks a large endowment, and its students may not be as well off.
Why so low?Princeton charges top dollar for tuition, but it has a huge endowment and wealthy students and a policy of not including loans in aid packages for less well-off students.
ChArT 4
Among the elite colleges, the borrowing to credential ratio varies greatly.
charts you can trust10
www.educationsector.org • August 2011
rules recently put in place by the U.S. Department of Education can rein in for-profit
colleges that load up students with unmanageable financial obligations. Without
such reforms, colleges and students will increasingly be drowning in debt.
Appendix
The borrowing to credential ratio is the product of two datasets. The credential
part of the ratio comes from the annual completion survey submitted by institutions
in the U.S. Department of Education’s Integrated Postsecondary Education Data
System, or IPEDS. This information tracks the number of certificates and degrees
awarded at or below the bachelor’s degree level for thousands of colleges across
the country. Borrowing data, meanwhile, were provided by the U.S. Department
of Education and include the total amount of federal student loan debt incurred
by students attending any type of undergraduate program, broken down by insti-
tution and reported for the 2006–07, 2007–08, and 2008–09 academic years. The
exclusion of graduate programs is important because those offerings, like medical
or law schools, tend to have even higher price tags, greater borrowing rates, and
only a few completers.
The ratio is gained simply by dividing the borrowing data by the credential data
for each year. For example, in 2008–09, the University of Florida reported granting
9,484 credentials. In that same year, students at the University of Florida borrowed
$65,067,123. The borrowing to credential ratio for the University of Florida in
2008–09, then, was $65,067,123 ÷ 9,484, or $6,861 borrowed per credential.
The measure uses the amount borrowed by all students enrolled in an institution,
and not just those who are graduating, because this captures the cumulative debt
investment for each credential.
To calculate the total borrowing to credential ratio across all three years, the total
amount borrowed in all three years was divided by all credentials granted in those
three years. Aggregating data across all three years has the effect of smoothing out
large single year fluctuations in borrowing and credentialing.
There are two limitations to the calculation. First, schools with substantial enrollment
increases will fare poorly on the ratio because the additional debt from these
students will be immediately recorded, but the corresponding increase in credentials
will take a few years to occur. Second, the ratio complicates comparisons between
institutions granting different types of credentials. The ratio for an institution that
primarily awards two-year associate degrees, for example, will likely be lower than
an institution that primarily awards four-year bachelor’s degrees, making it difficult to
determine which of these institutions is doing a better job of producing credentials
for the amount of borrowing. One option could be to weight credentials in the ratio
based on program length in order to allow better comparisons between different

charts you can trust11
www.educationsector.org • August 2011
types of institutions, but this is difficult because certificate programs vary in length,
and it would be hard to determine the appropriate weights for these programs. A
spreadsheet with the borrowing to credential ratio for all 4,934 institutions included
in our analysis can be downloaded from our website. The spreadsheet includes
the undergraduate borrowing and undergraduate credential data used to calculate
the ratio.
Notes
1. Mary Pilon, “Student-loan Debt Surpasses Credit Cards,” The Wall Street Journal, August 9, 2010.
2. This does not represent the average amount of money that each graduate borrowed. That amount was $18,624 in 2007–08 according to the National Postsecondary Student Aid Study and has also been rising. The borrowing to credential ratio represents the total amount of borrowing divided by the total number of degrees awarded, which includes students who did not borrow. This provides a more accurate overall measure for individual colleges because a college could, for example, have only 10 percent of students borrowing but have a high amount of debt per borrower. See the Appendix for a detailed description of how the borrowing to credential ratio is calculated. A spread-sheet with the borrowing to credential ratio for all 4,934 institutions included in our analysis can be downloaded from our website. The spreadsheet includes the undergraduate borrowing and undergraduate credential data used to calculate the ratio.
3. Trends in College Pricing 2010 (Washington, D.C.: College Board, 2010).
4. Kevin Carey and Erin Dillon, Drowning in Debt: The Emerging Student Loan Crisis (Washington, D.C.: Education Sector, July 8, 2009).
5. See National Center for Education Statistics, “A Closer Look at Postsecondary Education by Institution Level and Control: Enrollment and Degrees Conferred,” http://nces.ed.gov/programs/coe/analysis/2011-section1.asp (Accessed July 21, 2011).
6. Author analysis of 150 percent graduation rates for all four-year, for-profit insti-tutions using the Integrated Postsecondary Education Data Survey.
7. National Center for Education Statistics, “Table 356: Percentage of part-time or part-year undergraduates receiving aid, by type and source of aid and control and type of institution: Selected years, 1992–93 through 2007–08,” http://nces.ed.gov/programs/digest/d10/tables/dt10_356.asp (Accessed July 21, 2011).
8. U.S. Department of Education, “Data Center: Proprietary School 90/10 Revenue Percentages,” http://federalstudentaid.ed.gov/datacenter/propri-etary.html (Accessed July 21, 2011).
charts you can trust12
www.educationsector.org • August 2011
9. Statement of Kathleen S. Tighe Inspector General, U.S. Department of Education before the Committee on Health, Education, Labor and Pensions, United States Senate (March 10, 2011).
10. California Postsecondary Education Commission, “Freshmen Pathways,” http://www.cpec.ca.gov/OnLineData/FreshmenPathway.asp (Accessed July 21, 2011).
11. Illinois State University’s Center for the Study of Education Policy http://www.grapevine.ilstu.edu/tables/FY09/GPV_FY09_National_Tables.xls
12. Author analysis of average educational expenditures per full-time equivalent student for 2007–09, State Higher Education Finance Report FY2010, (Boulder, CO: State Higher Education Executive Officers, March 2011) and average borrowing to credential ratios for each state (r = -.55, p < .01).
13. Iowa College Student Aid Commission, “Scholarships & Grants,” http://www.iowacollegeaid.gov/ScholarshipsGrants/scholarshipsgrants.html (Accessed July 28, 2011). National Association of State Student Grant and Aid Programs, “State Data Quick Check: Iowa 2008–09,” http://www.nassgap.org/survey/state_data_check.asp (Accessed July 28, 2011).
14. 40th Annual Survey Report on State-Sponsored Student Financial Aid, 2008–09 (Washington, D.C.: National Association of State Student Grant and Aid Programs, 2010).
15. Many states have a clear flagship university, such as the University of Maryland, College Park; Ohio State University; or the University of Michigan—Ann Arbor. In those cases the borrowing to credential ratio for that flagship school was compared to the state’s other public, four-year institutions. In many other states, though, there is less of a clear distinction between a single flagship and other public institutions—for example the University of Mississippi and Missis-sippi State University or the University of Alabama and Auburn University. In those cases, the school identified as the “flagship” is the one identified as the “university of” rather than the main “state university” campus. There are three exceptions to this rule. For California, both the University of California branches at Berkeley and in Los Angeles were included. Both Indiana University—Bloom-ington and Purdue University’s main campus were identified as flagships in Indiana. And for New York, which lacks the clearest flagship, Stony Brook University, the University at Buffalo, and the State University of New York branches at Albany and Binghamton were all included. No schools from four states—Delaware, Rhode Island, Wyoming, and Pennsylvania—plus the District of Columbia were included in this analysis. For the first three states plus the district there were an insufficient number of public four-year institutions to make a comparison. Pennsylvania is not included because the Pennsylvania State University System does not disaggregate data by its campuses, meaning the main flagship campus is lumped in with other branches. All told, 51 flagship institutions were considered versus 515 other public four-year colleges or universities.
charts you can trust13
www.educationsector.org • August 2011
www.educationsector.org
ABOUT THE AUTHORS
Kevin Carey is the policy director at Education Sector. He can be reached at [email protected]. Erin Dillon is a senior policy analyst at Education Sector. She can be reached at [email protected].
ABOUT EDUCATION SECTOR
Education Sector is an independent think tank that challenges conventional thinking in education policy. We are a nonprofit, nonpartisan organization committed to achieving measurable impact in education, both by improving existing reform initiatives and by developing new, innovative solutions to our nation’s most pressing education problems.
16. Florida Student Scholarship and Grant Programs, “2011–12 Award Amounts Per Credit Hour,” http://www.floridastudentfinancialaid.org/ssfad/bf/awardamt.htm (Accessed July 21, 2011).
17. Karen Fooks, director of the Office for Student Financial Affairs at the University of Florida, in discussion with author, February 09, 2011; Darryl Marshall, director of financial aid at Florida State University, in discussion with author, February 10, 2011.
18. Total assets for the University of Florida were $1.51 billion as of June 30, 2010 (University of Florida Foundation, “Endowment and Total Assets,” http://www.uff.ufl.edu/AboutUFF/Endowment.asp (Accessed July 21, 2011). Florida State University reported total assets of $447 million as of June 30, 2010, 2010 Annual Report (Tallahassee, FL: The Florida State University Foundation).
19. University of Florida Office of Institutional Planning and Research, “Common Data Set: Financial Aid 2009,” http://www.ir.ufl.edu/OIRApps/commondataset/h_financialaid.aspx (accessed July 22, 2011); Florida State University Office of Institutional Research, “Surveys and Data Requests: Common Data Set 2008–09,” http://www.ir.fsu.edu/surveys.cfm?ID=common_data (accessed July 22, 2011).
20. http://www.princeton.edu/pr/news/01/q1/0127-aid.htm
21. The list of schools with a debt pledge was obtained from the Project on Student Debt’s website at http://projectonstudentdebt.org/pc_institution.php