debugging an application lab. build/debug process a start load closest sample “debug” into multi...
TRANSCRIPT
Debugging an Application Lab

Build/Debug Process
A
start
Load ClosestSample “debug”into MULTI editor
Cut and PasteChanges into
Sample
Build ModifiedSample
Syntax Errs?
CorrectSyntax
y
Connect toTarget Board
Start Debugger
DownloadApplication
Set NeededBreakpoints
B
n
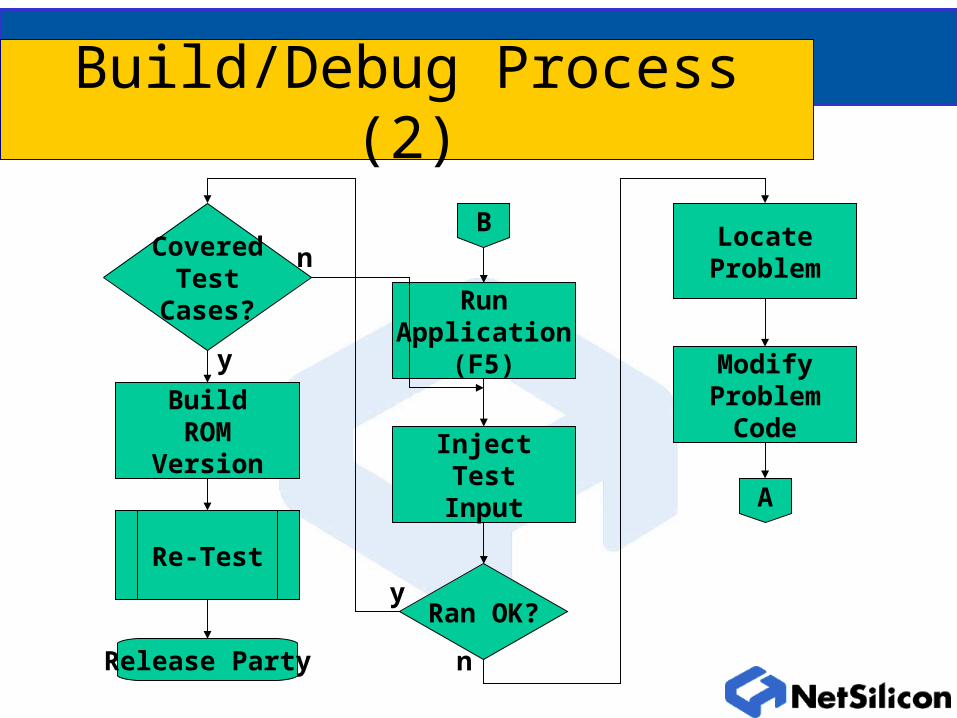
Build/Debug Process (2)
B
RunApplication
(F5)
InjectTestInput
Ran OK?y
LocateProblem
ModifyProblem
Code
A
n
CoveredTest
Cases?
n
BuildROM
Version
y
Re-Test
Release Party
PEEK/POKE Lab
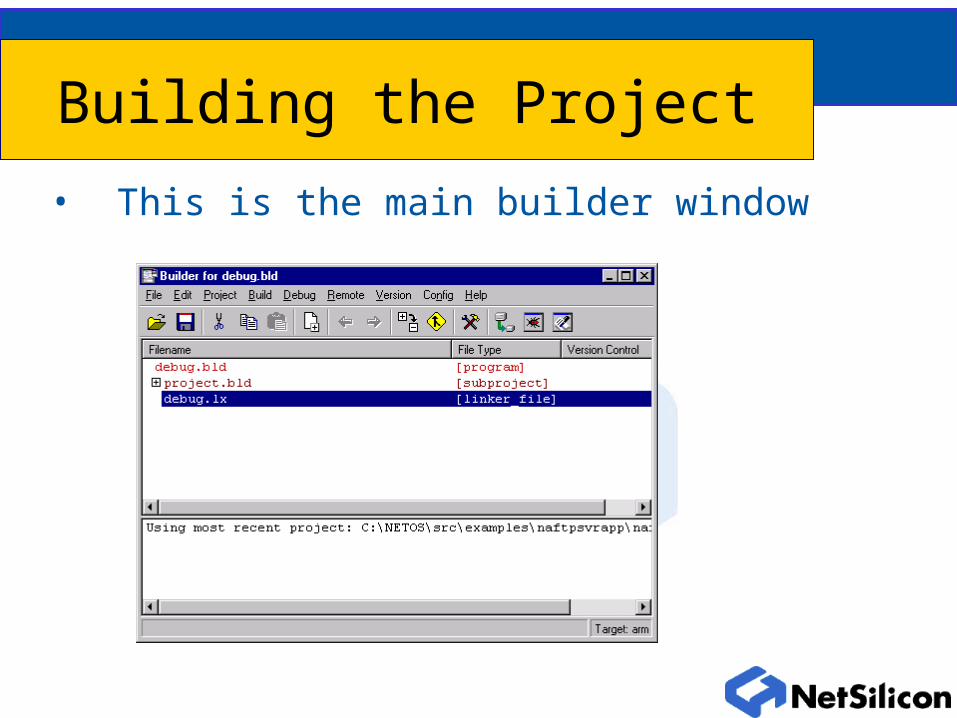
• This is the main builder window
Building the Project
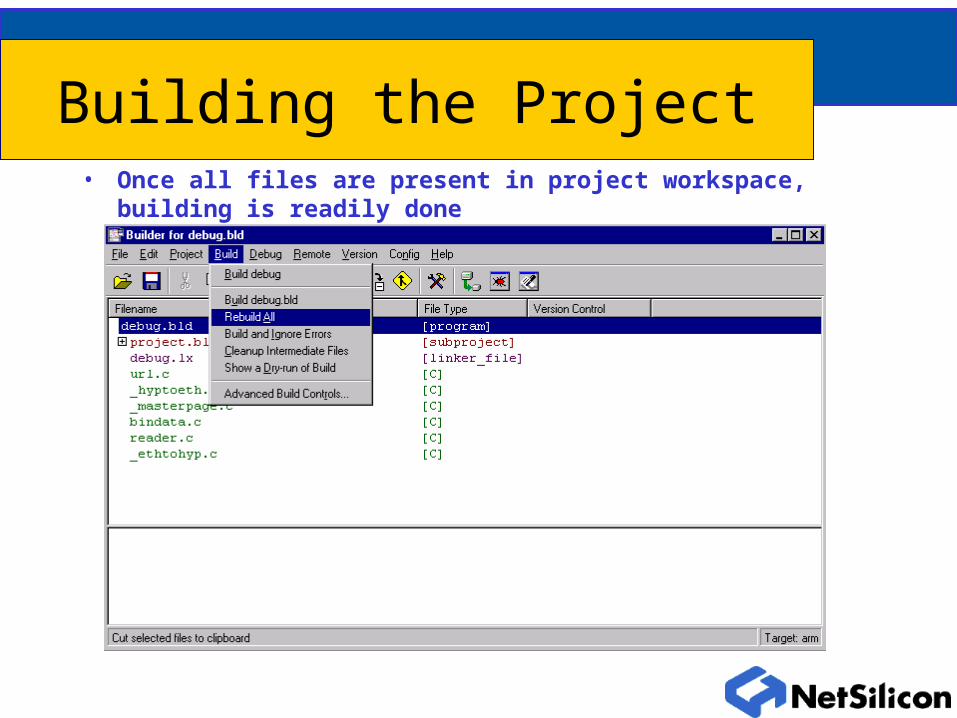
• Once all files are present in project workspace, building is readily done
Building the Project
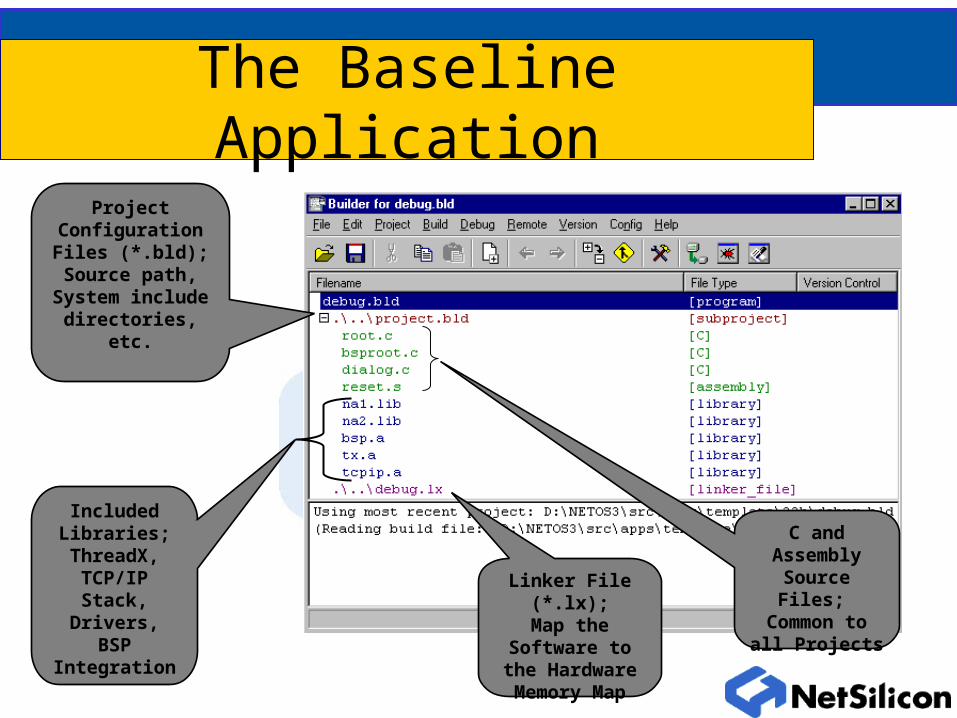
The Baseline Application
Project Configuration Files (*.bld);Source path,
System include directories, etc.
Included Libraries;ThreadX,
TCP/IP Stack,Drivers,
BSP Integration
C and Assembly
Source Files; Common to all
Projects
Linker File (*.lx);Map the
Software to the Hardware
Memory Map
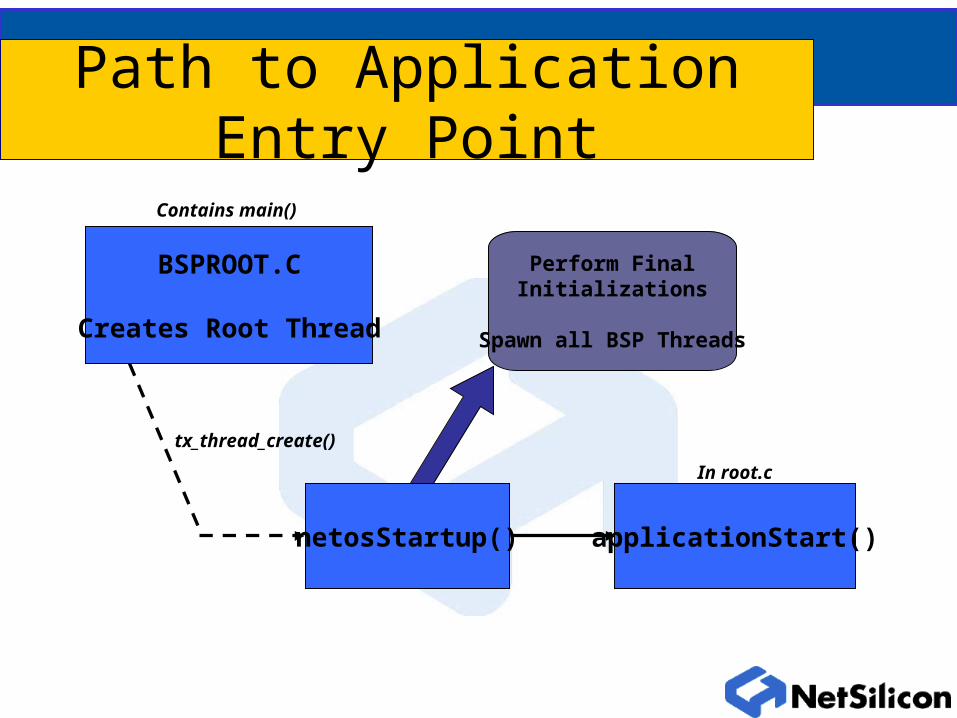
Perform FinalInitializations
Spawn all BSP Threads
Path to Application Entry Point
BSPROOT.C
Creates Root Thread
tx_thread_create()
netosStartup() applicationStart()
In root.c
Contains main()
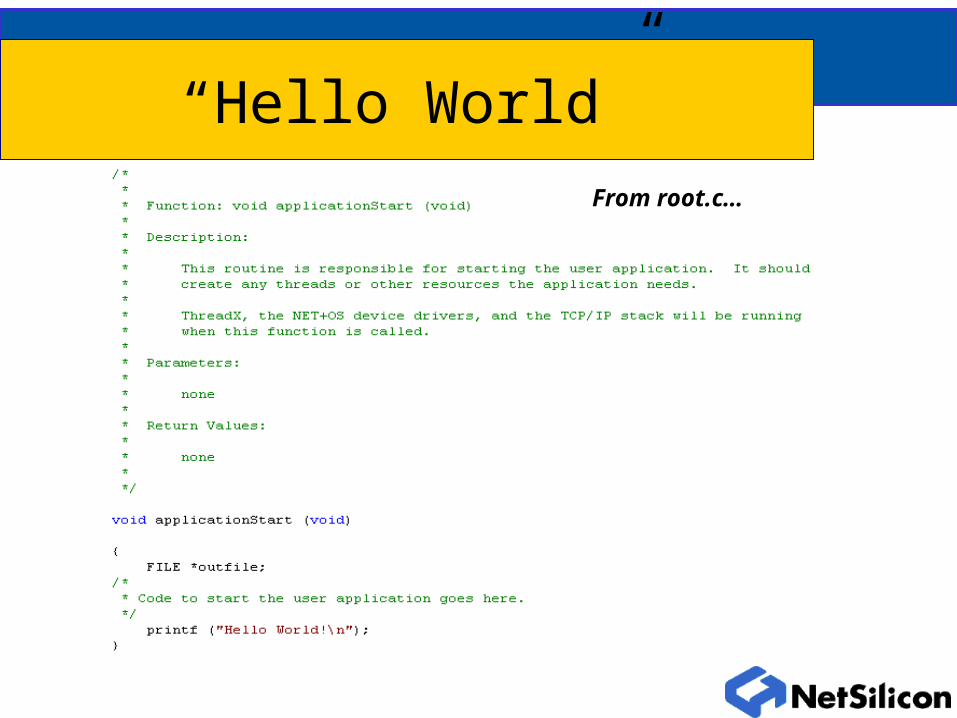
“Hello World”
From root.c…
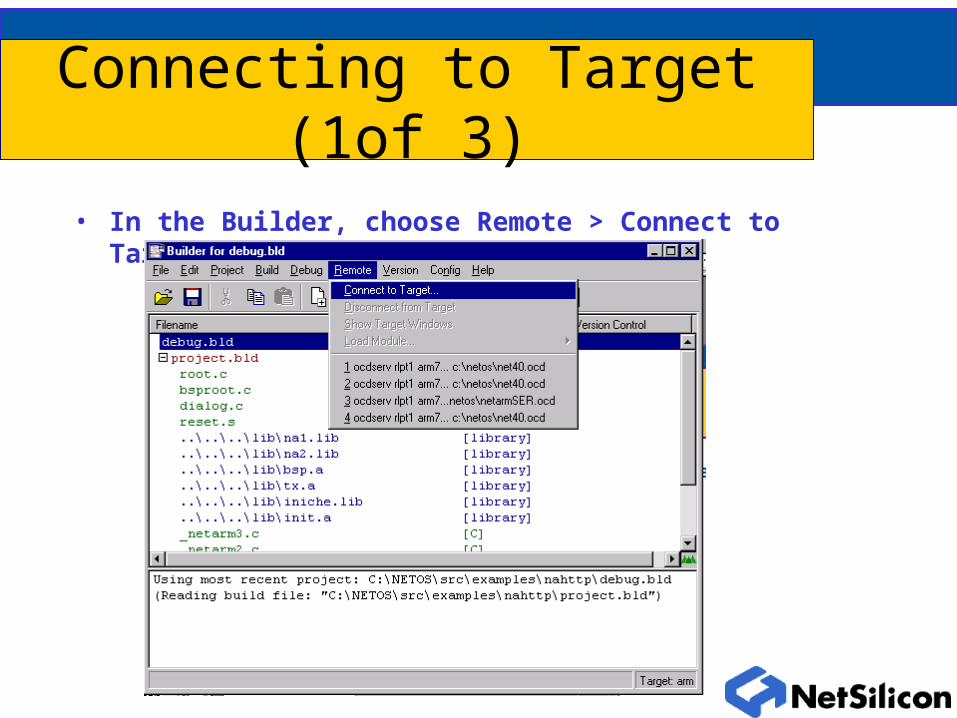
Connecting to Target (1of 3)
• In the Builder, choose Remote > Connect to Target.
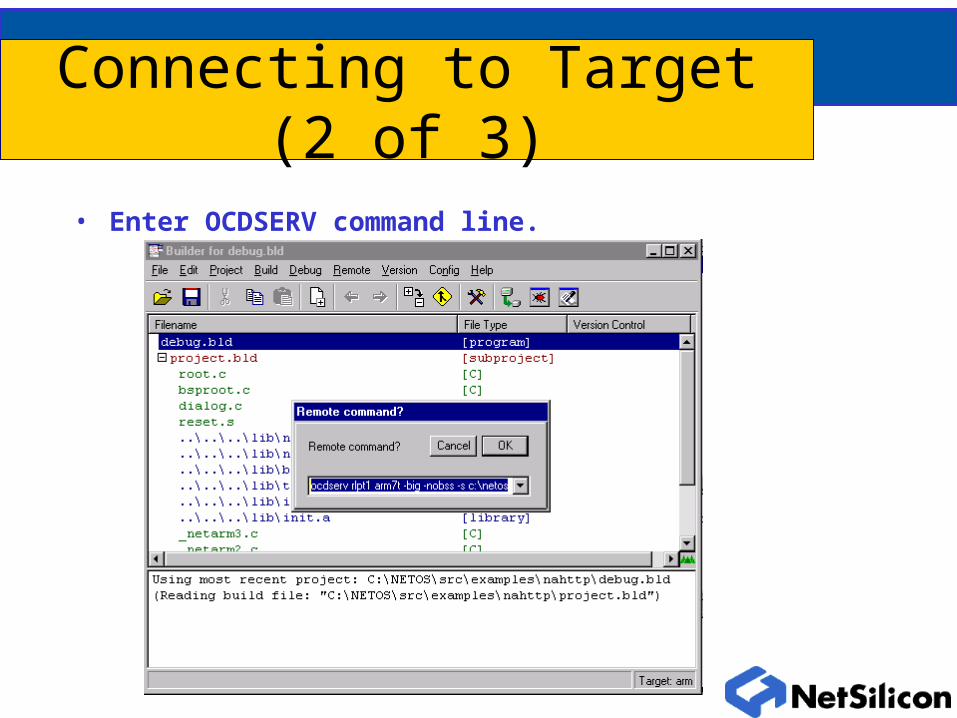
Connecting to Target (2 of 3)
• Enter OCDSERV command line.
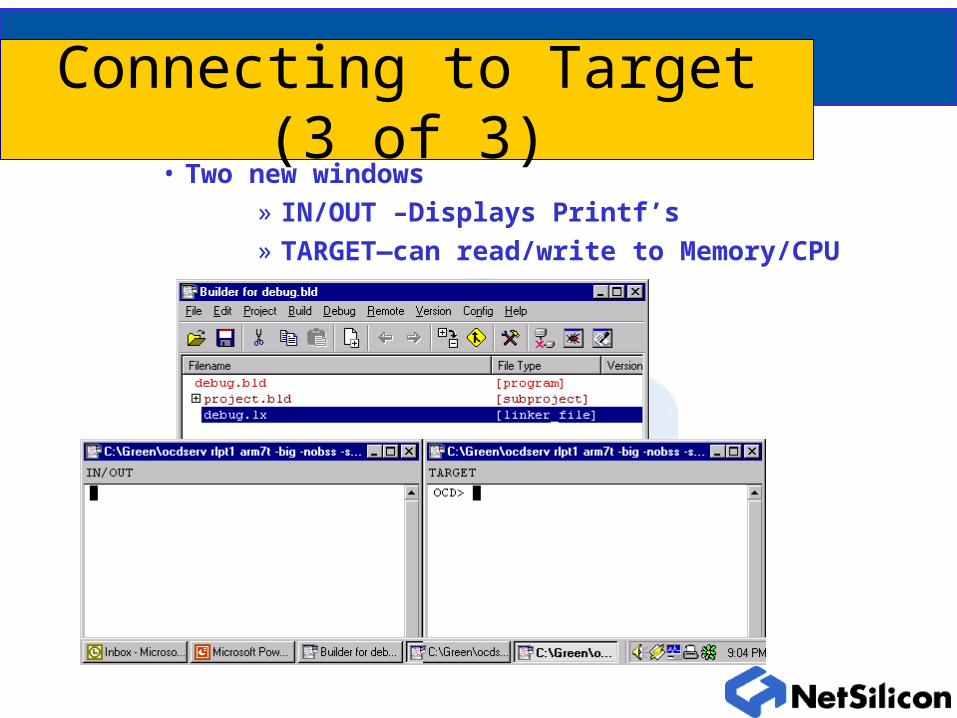
Connecting to Target (3 of 3)• Two new windows
» IN/OUT –Displays Printf’s» TARGET—can read/write to Memory/CPU
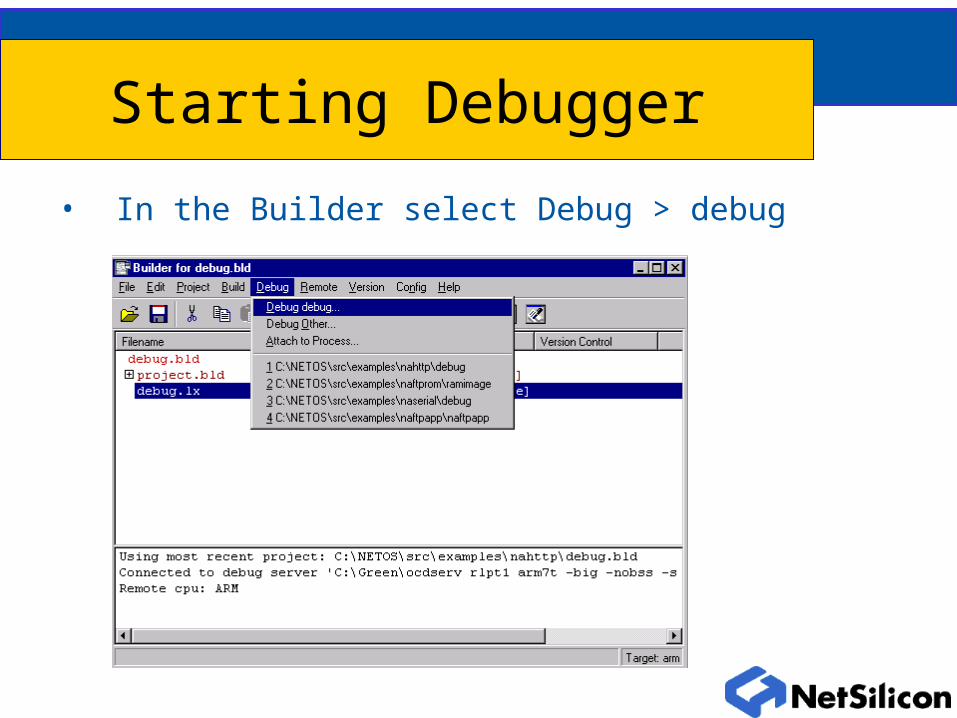
Starting Debugger
• In the Builder select Debug > debug
Debugger Features
• Set Break Points-Software and Hardware
• Step through code
• Examine C-code
• Examine Interlaced Assembly
• Examine values of variables, registers, memory
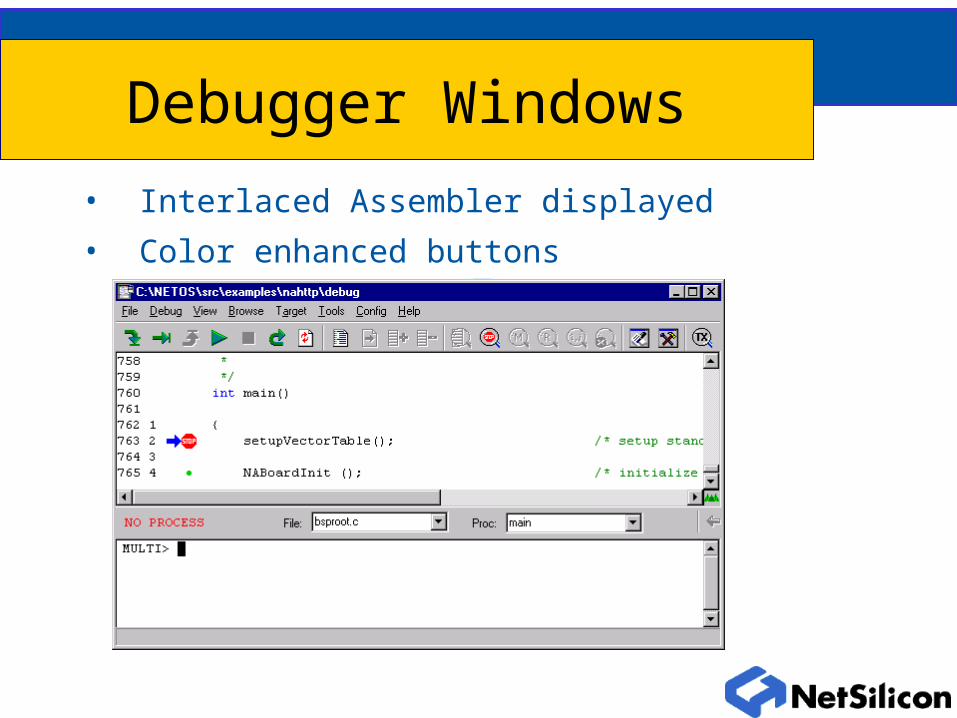
Debugger Windows
• Interlaced Assembler displayed
• Color enhanced buttons
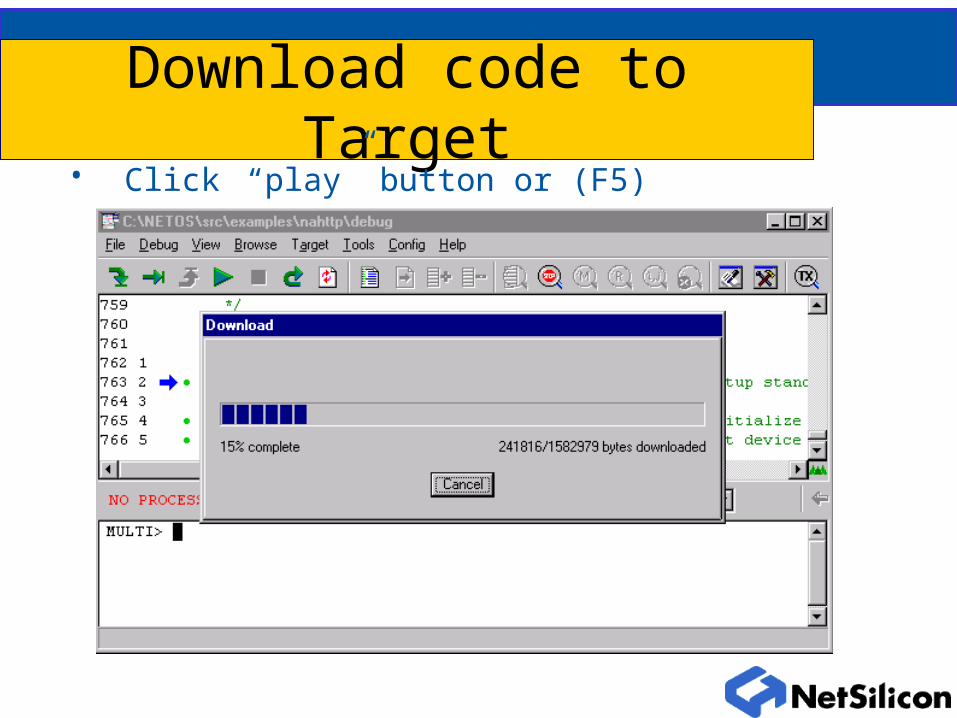
Download code to Target• Click “play” button or (F5)
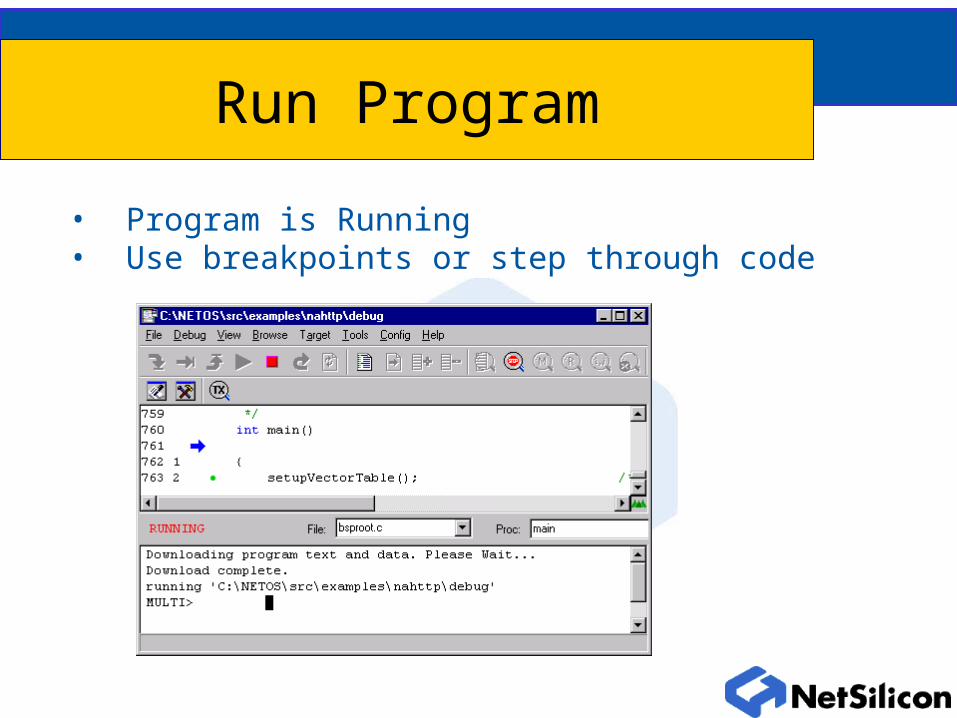
Run Program
• Program is Running• Use breakpoints or step through code
“PEEK/POKEing” variables
• Globals– Use “Browse/Globals”
– Double-click the variable of interest to see contents
– Address will appear in command window
– If structure, click to display members, double click to see contents
– Right-click the popup box to change value
• Local variables– Use View/Local Variables
– Works similar to “Browse/Globals” above
• Double click a variable name from debugger C listing to get a watch popup box
“PEEK/POKEing” Memory
• Click “View/Memory”• Enter address of interest in popup box• Select radix using button• Click on a row to change the contents• Explore other options of the popup box
“PEEK/POKEing” registers
• Remember, most registers of interest on Net+ARM are memory-mapped. Consult your Hardware Reference Guide.
• For ARM processor registers:– Use “View/Registers”
– In the popup box, right-click a register number to change it. CAREFUL!