dec 2021 economic and revenue forecast
TRANSCRIPT
Dec 2021 Economic and Revenue Forecast
November 17th, 2021 Oregon Office of Economic Analysis
Mark McMullen
Josh Lehner
Oregon Office of
Economic Analysis2
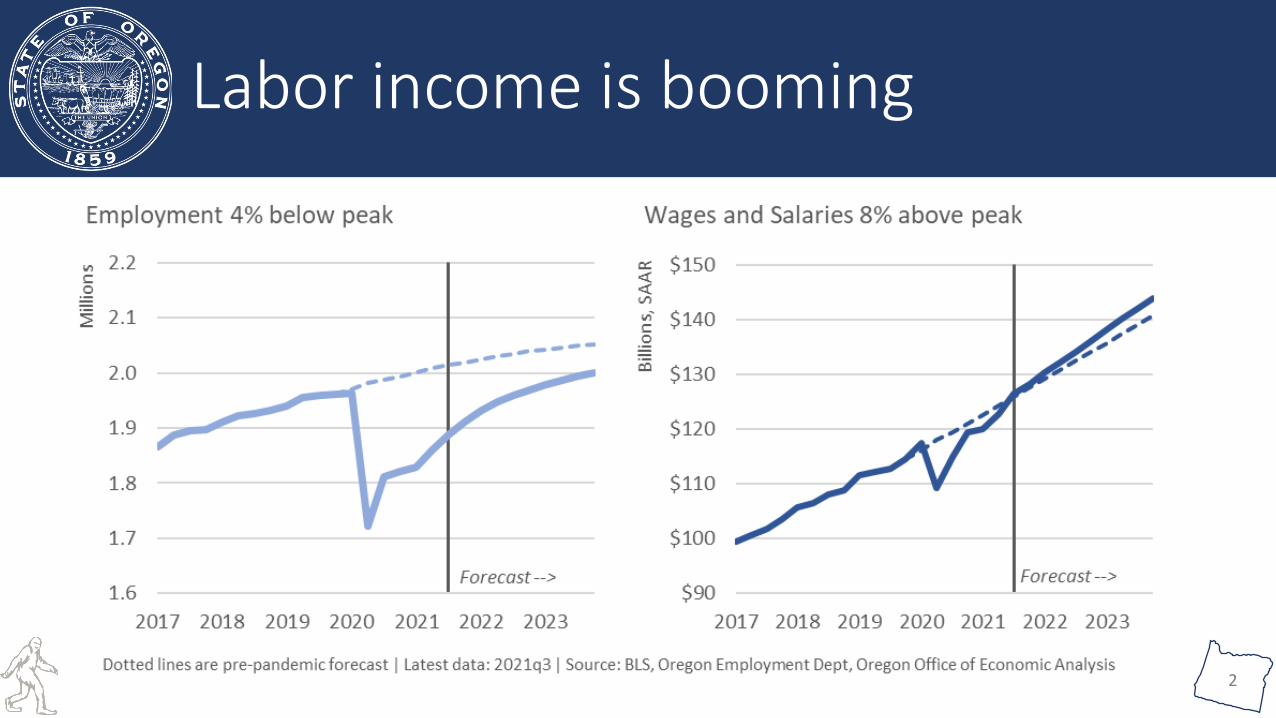
Labor income is booming
Oregon Office of
Economic Analysis3
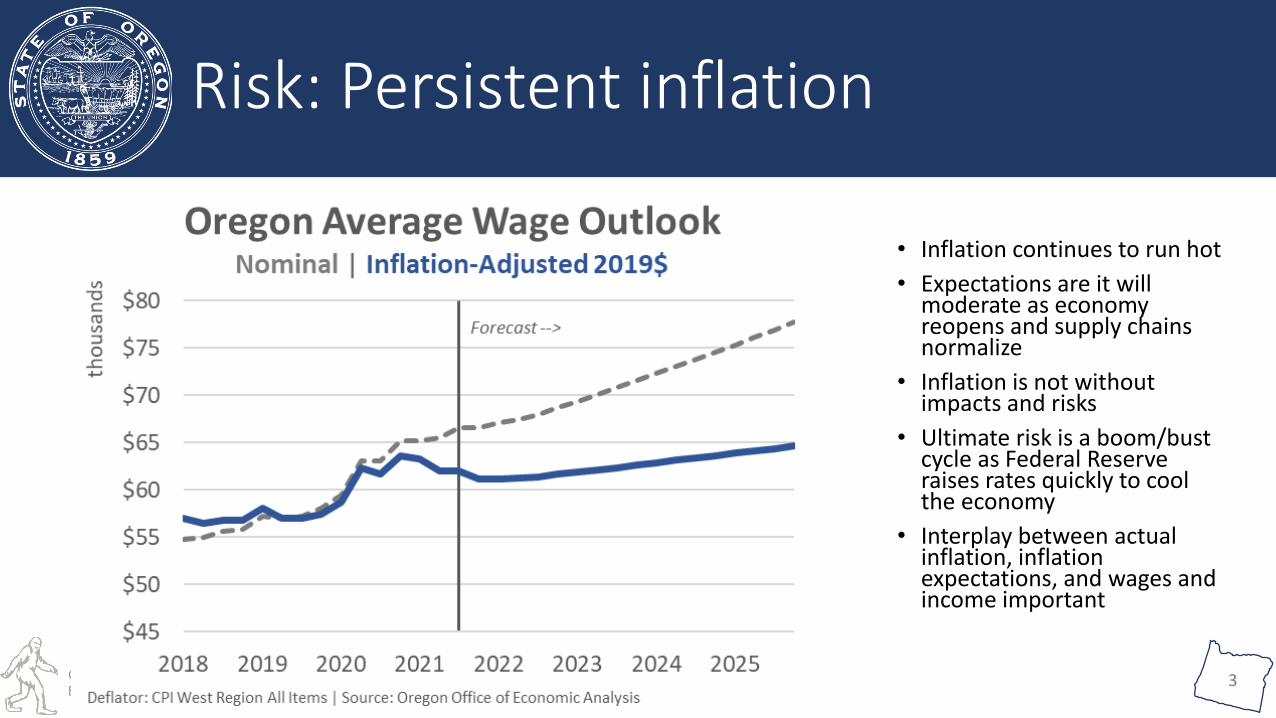
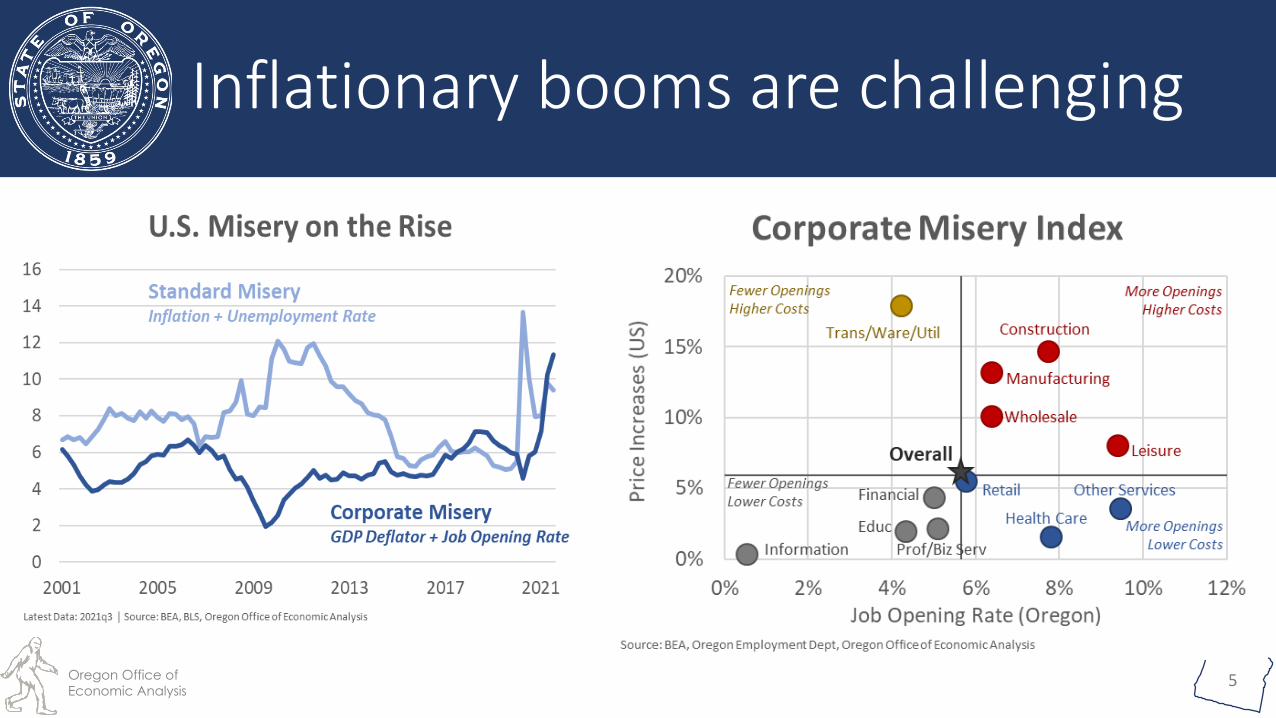
• Inflation continues to run hot
• Expectations are it will moderate as economy reopens and supply chains normalize
• Inflation is not without impacts and risks
• Ultimate risk is a boom/bust cycle as Federal Reserve raises rates quickly to cool the economy
• Interplay between actual inflation, inflation expectations, and wages and income important
Risk: Persistent inflation
Oregon Office of
Economic Analysis4
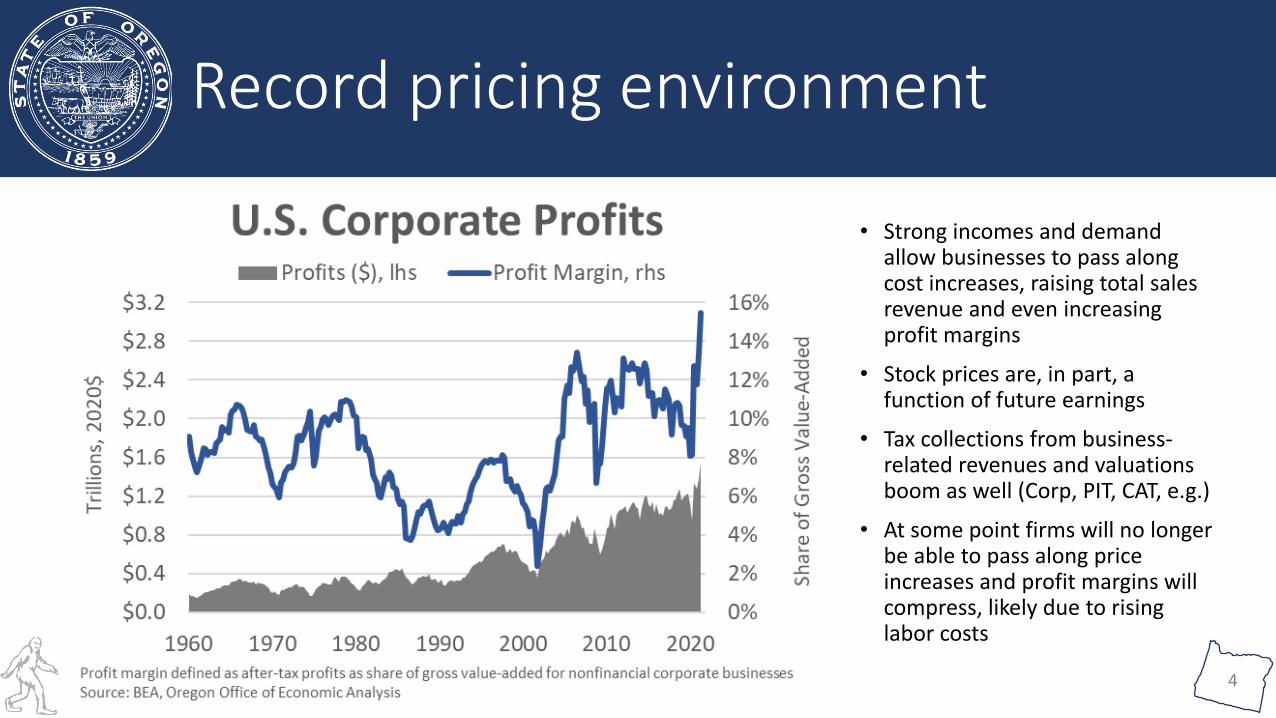
Record pricing environment
• Strong incomes and demand allow businesses to pass along cost increases, raising total sales revenue and even increasing profit margins
• Stock prices are, in part, a function of future earnings
• Tax collections from business-related revenues and valuations boom as well (Corp, PIT, CAT, e.g.)
• At some point firms will no longer be able to pass along price increases and profit margins will compress, likely due to rising labor costs
Oregon Office of
Economic Analysis5
Inflationary booms are challenging
Oregon Office of
Economic Analysis6
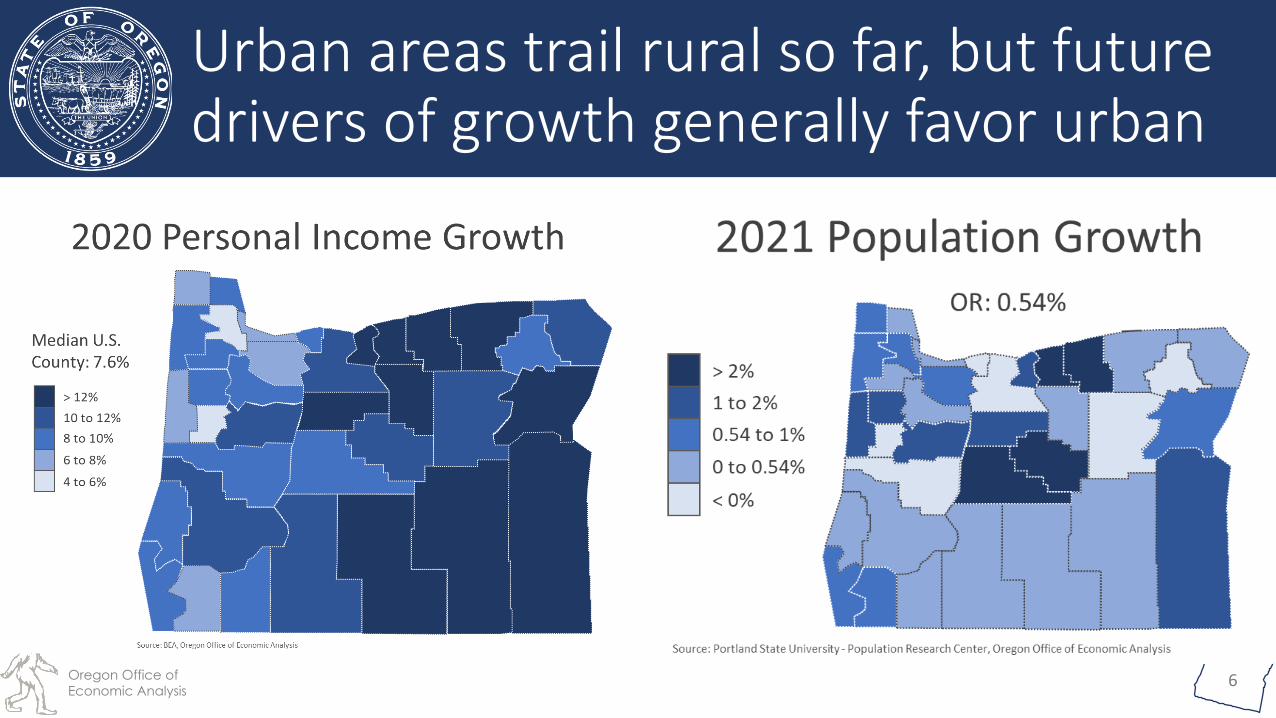
Urban areas trail rural so far, but future drivers of growth generally favor urban

Oregon Office of
Economic Analysis7
• Smaller metros and suburbs outperforming urban cores nationwide• Loss of business travel, and
daily commuters
• Portland Metro and Multnomah County essentially mirroring national patterns
• Good News/Bad News• Portland did not suffer
noticeably worse recession like usually do
• Portland trails all of its peer comparison metros: Austin, Indianapolis, Nashville, Salt Lake, Seattle
What’s wrong with Portland?
Oregon Office of
Economic Analysis8
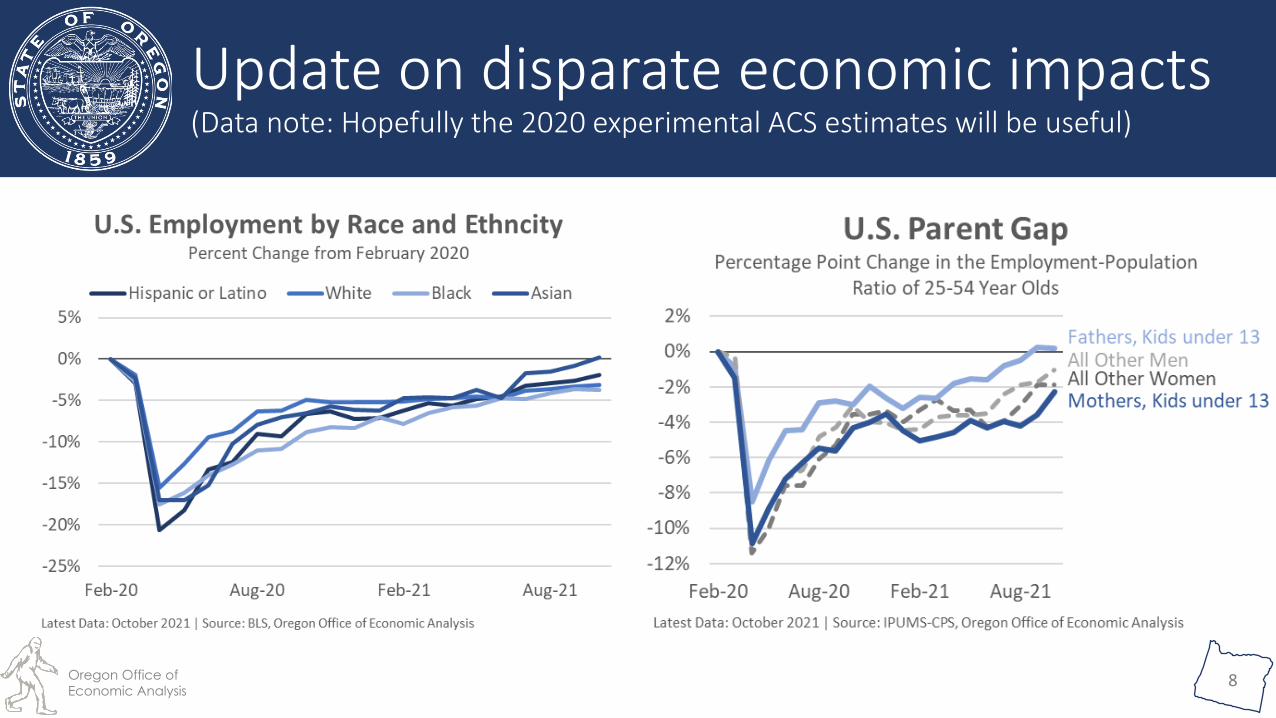
Update on disparate economic impacts(Data note: Hopefully the 2020 experimental ACS estimates will be useful)
Revenue Outlook
Oregon Office of
Economic Analysis10
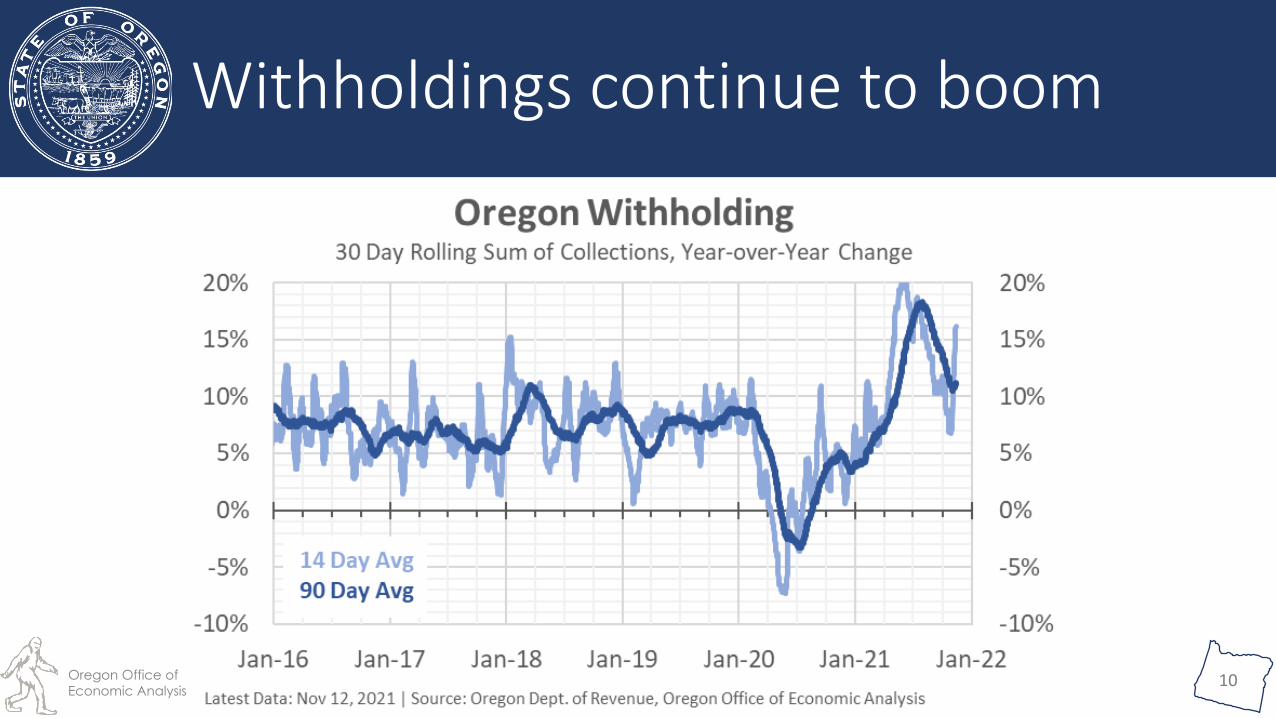
Withholdings continue to boom
Oregon Office of
Economic Analysis11
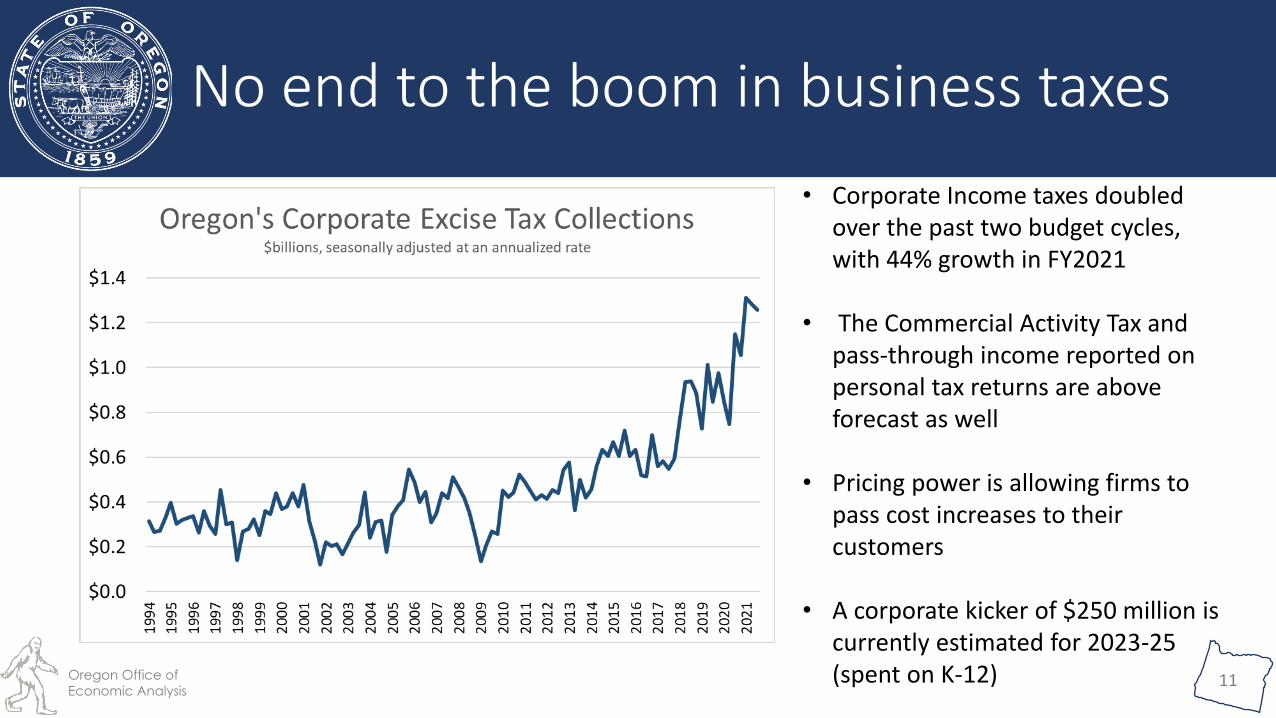
No end to the boom in business taxes
• Corporate Income taxes doubled over the past two budget cycles, with 44% growth in FY2021
• The Commercial Activity Tax and pass-through income reported on personal tax returns are aboveforecast as well
• Pricing power is allowing firms to pass cost increases to their customers
• A corporate kicker of $250 million is currently estimated for 2023-25(spent on K-12)
Oregon Office of
Economic Analysis12
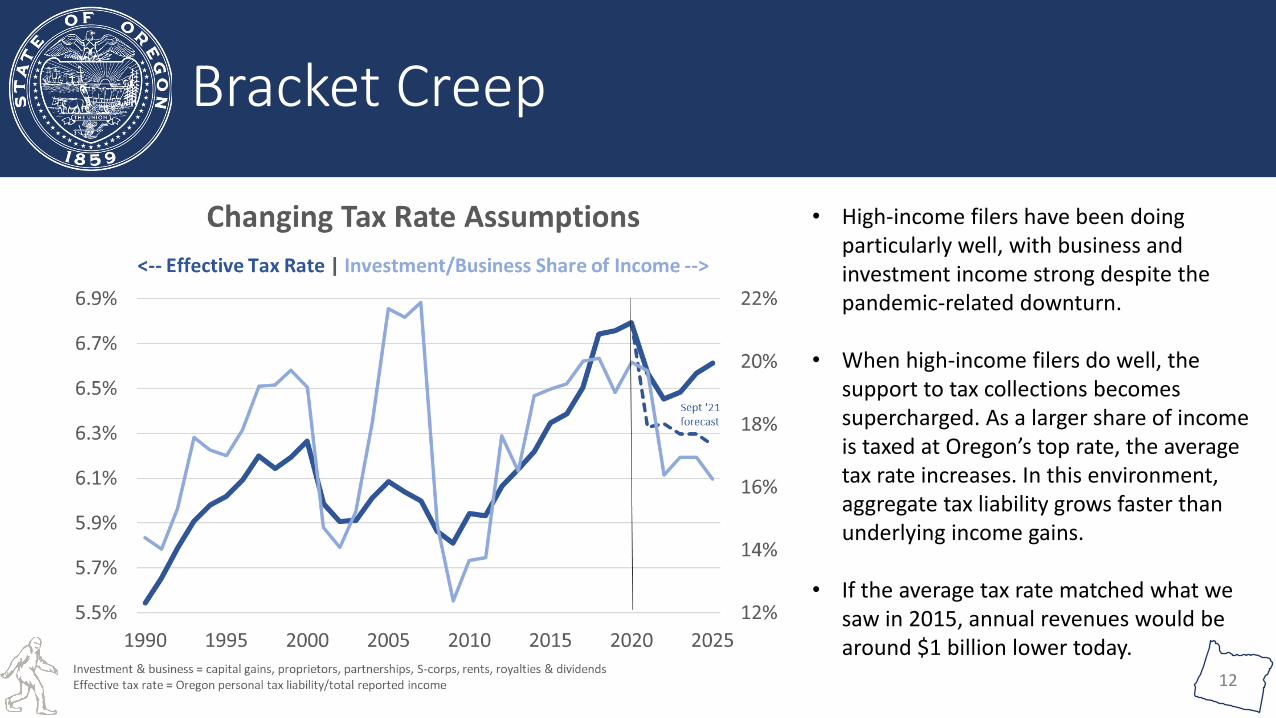
Bracket Creep
• High-income filers have been doing particularly well, with business and investment income strong despite the pandemic-related downturn.
• When high-income filers do well, the support to tax collections becomes supercharged. As a larger share of income is taxed at Oregon’s top rate, the average tax rate increases. In this environment, aggregate tax liability grows faster than underlying income gains.
• If the average tax rate matched what we saw in 2015, annual revenues would be around $1 billion lower today.

Oregon Office of
Economic Analysis13
Not the baseline outlook, but a Boom/Bust scenario is a possibility
• Given the strength of the inflationary boom we are experiencing, there is an increased risk of the economy overheating
• The average rate dynamic is reversed during a downturn, leading to revenue losses in excess of income losses
• A downturn in the second half of the current biennium would likely lead to a large budget hole in 2023-25
Bottom Line

Oregon Office of
Economic Analysis15
Changes relative to the September Forecast
• The baseline revenue outlook has strengthened in recent months, with income growth having accelerated further rather than normalizing
• Personal and corporate tax collections are both setting records, with collections during the extension filing season particularly strong
• In addition to General Fund resources, Lottery and CAT revenues have come in larger than expected
• Although much uncertainty remains, non-corporate GF revenues are now 2.5% above the COS forecast, which would lead to a $558 million kicker payment starting in 2024
21-23 23-25 25-27
Personal Income Taxes 502 481 968
Corporate Income Taxes 184 -21 -70
Other 23 14 25
Total 710 474 923
21-23 23-25 25-27
Lottery 22 9 8
Corporate Activity Tax 16 122 143
Marijuana Tax 3 0 0
Total 41 131 151
21-23 23-25 25-27Total Sum 751 605 1,074
$ Millions from Sept
December 2021 Forecast Changes
General Fund
Revenues
$ Millions from Sept
Other Revenues$ Millions from Sept
Oregon Office of
Economic Analysis16
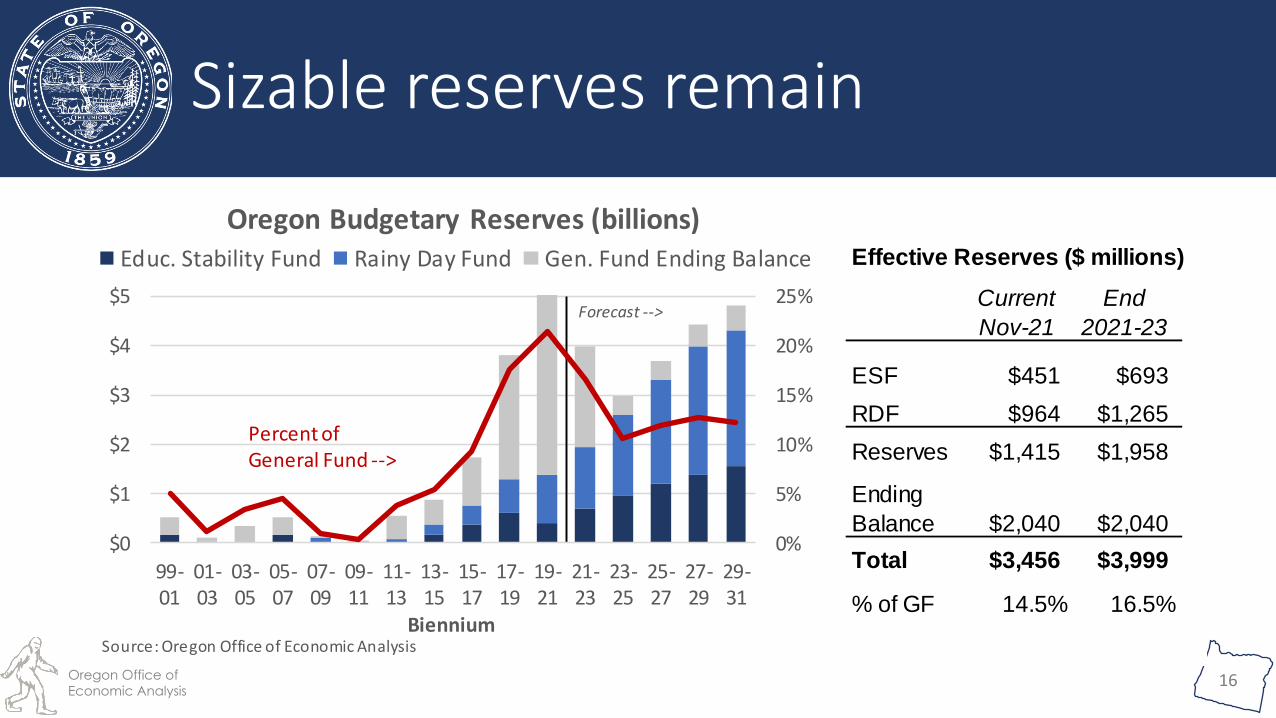
Sizable reserves remain
Effective Reserves ($ millions)
Current
Nov-21
End
2021-23
ESF $451 $693
RDF $964 $1,265
Reserves $1,415 $1,958
Ending
Balance $2,040 $2,040
Total $3,456 $3,999
% of GF 14.5% 16.5%
0%
5%
10%
15%
20%
25%
$0
$1
$2
$3
$4
$5
99-01
01-03
03-05
05-07
07-09
09-11
11-13
13-15
15-17
17-19
19-21
21-23
23-25
25-27
27-29
29-31
Biennium
Oregon Budgetary Reserves (billions)Educ. Stability Fund Rainy Day Fund Gen. Fund Ending Balance
Forecast -->
Percent ofGeneral Fund -->
Source: Oregon Office of Economic Analysis

Oregon Office of
Economic Analysis17
Contact
(503) 378-3455
(971) 209-5929
www.OregonEconomicAnalysis.com
@OR_EconAnalysis