december 31, 2020 t. rowe price prafxreal assets fund
TRANSCRIPT
T. ROWE PRICE
December 31, 2020ANNUAL REPORT
PRAFX Real Assets Fund
PRIKX Real Assets Fund– I Class
TRZRX Real Assets Fund– Z Class
For more insights from T. Rowe Price investment professionals, go to troweprice.com.
arraf_1220_P3Proof #

arraf_1220_P3Proof #
Log in to your account at troweprice.com for more information.
* Certain mutual fund accounts that are assessed an annual account service fee can also save money by switching to e-delivery.
It’s fast—receive your statements and confirmations faster than U.S. mail.
It’s convenient—access your important account documents whenever you need them.
It’s secure—we protect your online accounts using “True Identity” to confirm new accounts and make verification faster and more secure.
It can save you money—where applicable, T. Rowe Price passes on the cost savings to fund holders.*
TO ENROLL:If you invest directly with T. Rowe Price, go to troweprice.com/paperless.
If you invest through an investment advisor, a bank, or a brokerage firm, please contact that organization and ask if it can provide electronic documentation.
Go PaperlessSign up for e-delivery of your statements, confirmations, and prospectuses or shareholder reports.
T. ROWE PRICE REAl AssETs Fund
HIGHLIGHTS
nn The Real Assets Fund returned 6.99% and significantly outperformed its combined index portfolio for the 12-month period ended December 31, 2020. The fund, however, underperformed the broader global equities index.
nn The portfolio’s defensive positions during the coronavirus-induced sell-off, along with strong security selection within natural resources, drove relative outperformance. Security selection among real estate securities also added value.
nn Tactical weights to the underlying components are broadly in line with their neutral allocations. These allocations reflect a top-down view of the real assets sector, with a focus on how inflation affects the various securities in the portfolio.
nn Over the past six months, our inflation outlook has tilted to the upside. In our view, although resurging coronavirus outbreaks and worrying signs of mutations have weighed on economic activity, they may only delay—not prevent—a recovery in inflation.
arraf_1220_P3Proof #
1
T. ROWE PRICE REAl AssETs Fund
CIO Market Commentary
Nearly all major stock and bond indexes produced positive results during 2020 as markets recovered from the steep sell-off that resulted from the spread of the coronavirus. Extraordinary fiscal and monetary support from global governments and central banks helped spur the rebound, although the pandemic continued to pose significant public health and economic challenges as the year came to an end.
In the U.S., the large-cap Dow Jones Industrial Average and S&P 500 Index reached record highs, as did the technology-heavy Nasdaq Composite Index—a result that few would have predicted in late March after the benchmarks tumbled more than 30% as governments instituted lockdowns to try to halt the spread of the virus. Large-cap information technology and internet-related firms helped lead the rebound as they benefited from the work-from-home environment and an acceleration in demand for online services.
Within the S&P 500, the technology and consumer discretionary sectors were the top performers, and communication services and materials stocks also outperformed. Despite a late rally, the energy sector trailed with significant losses due to a plunge in oil prices.
Most equity markets outside the U.S. also performed well. Emerging markets outpaced developed markets, and Asian shares delivered strong results as China and other countries in the region proved relatively successful in containing the coronavirus.
Growth stocks significantly outpaced their value counterparts for the full year; however, value shares rallied late in the period. Positive vaccine news in November raised hopes for a return to normalcy in 2021 and boosted sectors that had been beaten down in the initial phases of the pandemic.
Within the fixed income universe, corporate bonds delivered strong results as the market easily absorbed a torrent of new issuance. After falling to record lows in March, intermediate- and longer-term Treasury yields ticked higher later in the year but remained very low by historical standards, a factor that encouraged investors to seek out riskier securities with higher return potential.

arraf_1220_P3Proof #
2
T. ROWE PRICE REAl AssETs Fund
While investors had reason to cheer the market’s recovery, the global economic outlook remained unclear as the year came to an end. Most notable on the positive side was the start of vaccine distributions, which provided hope that the pandemic was in its final phase. In addition, Congress passed a $900 billion coronavirus relief package, supplementing the $2.4 trillion allocated to address the crisis earlier in the year, and the Fed continued to pledge very accommodative monetary policies for the foreseeable future. Meanwhile, political uncertainty diminished with Joe Biden’s victory in the U.S. presidential election and the completion of a Brexit trade deal between the UK and the European Union.
On the negative side, concerns about a resurgence in virus hospitalizations led to new lockdowns and business restrictions in many countries, which in turn appeared to threaten economic recoveries. In the U.S., after a strong recovery in the summer and fall, the pace of hiring slowed late in the year, and household spending declined in November for the first time since April.
It was a remarkable 12-month period in many ways, but as far as markets are concerned, I can recall no calendar year that so starkly displayed evidence of both fear and greed. Fear emerged during the March sell-off and again in April as oil futures briefly traded in negative territory. Greed surfaced later as some assets seemed to continue to rally without fundamental support. Bitcoin rocketed to a record high of $29,000 by year-end, and the amount of money raised by initial public offerings also climbed to historic levels. While valuations are still attractive in some areas of the market, other sectors appear to have already priced in a strong rebound in earnings and are trading at elevated levels.
There are both risks and potential rewards in this environment, and we believe strong fundamental analysis and skilled active security selection will remain critical components of investment success.
Thank you for your continued confidence in T. Rowe Price.
Sincerely,
Robert SharpsGroup Chief Investment Officer
arraf_1220_P3Proof #
3
T. ROWE PRICE REAl AssETs Fund
Management’s discussion of Fund Performance
INVESTMENT OBJECTIVE
The fund seeks to provide long-term growth of capital.
FUND COMMENTARY
How did the fund perform in the past 12 months?
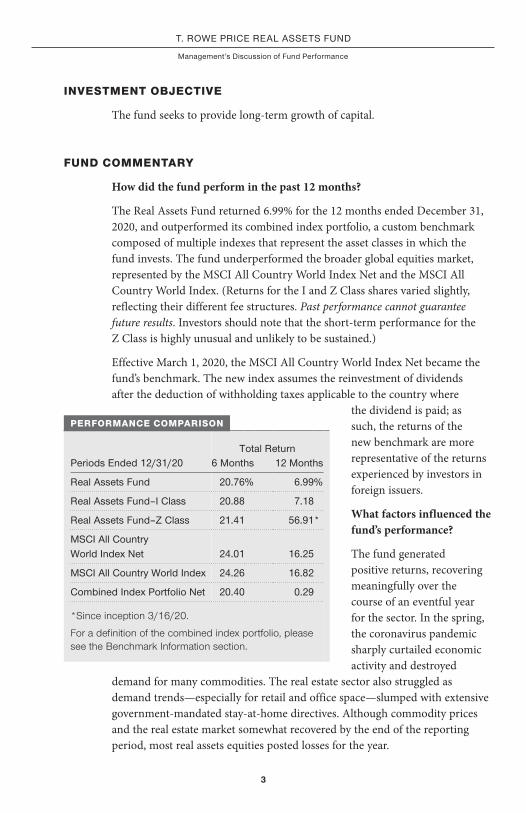
The Real Assets Fund returned 6.99% for the 12 months ended December 31, 2020, and outperformed its combined index portfolio, a custom benchmark composed of multiple indexes that represent the asset classes in which the fund invests. The fund underperformed the broader global equities market, represented by the MSCI All Country World Index Net and the MSCI All Country World Index. (Returns for the I and Z Class shares varied slightly, reflecting their different fee structures. Past performance cannot guarantee future results. Investors should note that the short-term performance for the Z Class is highly unusual and unlikely to be sustained.)
Effective March 1, 2020, the MSCI All Country World Index Net became the fund’s benchmark. The new index assumes the reinvestment of dividends after the deduction of withholding taxes applicable to the country where
the dividend is paid; as such, the returns of the new benchmark are more representative of the returns experienced by investors in foreign issuers.
What factors influenced the fund’s performance?
The fund generated positive returns, recovering meaningfully over the course of an eventful year for the sector. In the spring, the coronavirus pandemic sharply curtailed economic activity and destroyed
demand for many commodities. The real estate sector also struggled as demand trends—especially for retail and office space—slumped with extensive government-mandated stay-at-home directives. Although commodity prices and the real estate market somewhat recovered by the end of the reporting period, most real assets equities posted losses for the year.
Total ReturnPeriods Ended 12/31/20 6 Months 12 Months
Real Assets Fund 20.76% 6.99%
Real Assets Fund‒I Class 20.88 7.18
Real Assets Fund‒Z Class 21.41 56.91*
MsCI All Country World Index net 24.01 16.25
MsCI All Country World Index 24.26 16.82
Combined Index Portfolio net 20.40 0.29
*Since inception 3/16/20.
For a definition of the combined index portfolio, please see the Benchmark Information section.
PERFORMANCE COMPARISON

arraf_1220_P3Proof #
4
T. ROWE PRICE REAl AssETs Fund
The fund employs a derivatives-based overlay strategy, which had a positive impact on relative performance. The purpose of this strategy is to offset market exposure inherited from the underlying components as needed, as well as adjust the fund’s risk profile and potentially enhance returns in response to the portfolio managers’ view on inflationary conditions. Defensive positions during the coronavirus-induced sell-off helped to cushion the fund and significantly contributed to relative performance. It is important to note that over the long term, we expect tactical decisions
from the fund’s portfolio managers to account for approximately 30% of the overall relative value we add over the return of the fund’s benchmarks and the remainder of performance to be driven by security selection within the underlying components.
Stock selection among natural resources also added value. The allocation’s bias toward holdings that tend to benefit from lower energy prices, like specialty chemicals and electric utilities, contributed to returns. Within specialty chemicals, we focus on long-term earnings compounders and names with idiosyncratic growth drivers. Shares of Quaker Chemical, a leading formulator of process chemicals for customers in steel and other cyclical industries, generated impressive gains. Among electric utilities, a meaningful position in Florida-based NextEra Energy, which significantly outpaced industry performance, added value. The company has a high-quality regulated utility business along with solar and wind operations that benefit from dramatically improving economics and favorable environmental tailwinds. (Please refer to the fund’s portfolio of investments for a complete list of holdings and the amount each represents in the portfolio.)
Percent of net Assets6/30/20 12/31/20
diversified Metals and Mining 10.8% 12.1%
Gold 12.4 10.2
Residential REITs 9.0 8.5
specialized REITs 5.3 5.9
steel 4.4 5.7
Industrial REITs 7.0 5.4
Office REITs 6.2 4.6
specialty Chemicals 3.2 3.4
Oil and Gas Exploration and Production 3.9 3.2
Retail REITs 3.0 3.1
Other and Reserves 34.8 37.9
Total 100.0% 100.0%
Historical weightings reflect current industry/sector classifications.
INDUSTRY DIVERSIFICATION

arraf_1220_P3Proof #
5
T. ROWE PRICE REAl AssETs Fund
Names in diversified metals and mining boosted returns. Within the segment, we focus on low-cost producers with quality business models. Swedish mining and smelting company Boliden was one of the top performers for the year. We like Boliden’s conservative yet opportunistic management team, which understands how to create value by investing countercyclically—keeping leverage low—using automation and technology to lower costs. Diversified miner BHP also posted strong double-digit returns, as its record copper milling and iron ore shipments pointed to continued underlying production performance.
Despite negative returns, security selection in U.S. and global real estate stocks added value, as several holdings held up well relative to their respective benchmarks. In the U.S., our positions in the industrial segment—including Prologis—boosted performance, benefiting from the demand associated with increased e-commerce penetration. Stock selection in the health care sector also helped. Shares of Alexandria Real Estate performed well as demand for lab space by life science tenants remained robust. However, stock selection in the apartment/residential subsector was a drag. AvalonBay Communities and Equity Residential weighed on relative returns given their sizable exposure to major cities impacted by the pandemic.
Stock selection in Japan and Australia contributed to the fund’s results. Industrial-focused companies—such as Nippon Prologis REIT and Mitsui Fudosan Logistics Park, as well as Industrial & Infrastructure Fund in Japan and Goodman Group in Australia—held up well during the market sell-off and outpaced benchmark peers. The industrial space benefited from solid occupancy rates despite the economic slowdown. In Continental Europe, our positions in residential landlords including Kojamo, Finland’s largest owner of multifamily properties, and Deutsche Wohnen, which has attractive exposure to Berlin’s residential property market, added to performance. Canada-based Summit Industrial Income REIT, which owns and manages a portfolio of light industrial properties across Canada, also helped returns. Conversely, an overweight allocation to the UK detracted. Derwent London, which redevelops office assets, underperformed amid concerns of potentially higher vacancies and declines in rents in London due to the economic downturn.
How is the fund positioned?
Historically, equities in the Real Assets Fund have faced durable headwinds as muted global demand and structural challenges persist. However, thanks to the strong and coordinated global fiscal response to the pandemic shock, aspects of our portfolio were supported by secular tailwinds for the first time in many
arraf_1220_P3Proof #
6
T. ROWE PRICE REAl AssETs Fund
years. In particular, the mining sector benefited from a weak dollar and rising commodity prices. Late in the period, the energy sector also surged in the hopes of normalized travel patterns in 2021, buoyed by tight supply conditions.
Further, even the real estate sector is beginning to show signs of a bottom forming. Over the coming quarters, we expect that the rollout of coronavirus vaccines will result in increasing consumer confidence and an improving employment picture. This will drive higher demand in many property types across commercial and residential real estate, amid constrained supply given falling construction starts across many regions and property types.
Within the fund, we do not rebalance allocations based on a set schedule but instead prefer to let our winners run. Therefore, our allocations may occasionally drift during periods of strong outperformance in certain sectors or subsectors. However, our goal is to maintain the fund’s positioning broadly in line with designated neutral allocations to the main underlying components outlined below:
nn Global Natural Resources (30%) invests in resource companies involved in energy, forest products, mining, and other commodities.
nn Global Metals and Mining (25%) invests in metals and mining companies that own or develop basic commodities with attractive long-term supply and demand fundamentals.
nn Precious Metals (5%) is an additional sub-portfolio within the global metals and mining sector that provides a strategic overweight to the gold and precious metals subindustries.
nn U.S. Real Estate (20%) and Global Real Estate (20%) invest in companies across the commercial real estate sector that include apartment, residential, lodging, industrial, office, and retail.
In this challenging environment, the fund’s underlying components focus on owning high-quality companies with solid balance sheets and responsible capital allocation that operate efficiently at a lower cost and are capable of generating cash flow growth and profits when prices are under pressure. Our fund positioning includes a top-down view of the real assets sector, with a focus on how inflation affects the various securities in the portfolio.
What is portfolio management’s outlook?
Resurging outbreaks of the pandemic in late 2020 and worrying signs of mutations have weighed on economic activity and could potentially delay, but not prevent, a recovery in inflation. While the increase in virus cases has hit the leisure and restaurant industries, the higher wage manufacturing industry has seen consistent job gains since the nadir of the recession in April 2020. This confirms that the economy can continue to operate, even with rising virus
arraf_1220_P3Proof #
7
T. ROWE PRICE REAl AssETs Fund
cases. Importantly, U.S. policymakers passed a meaningful fiscal package in December—a potential buffer for economic growth—and we are anticipating another round of stimulus from the Biden administration, which would further underpin growth going forward.
Over the past six months, we have been moving gradually toward this more positive assessment for the inflation outlook. Midyear, we were initially concerned that the reflationary burst would be temporary and that the fiscal support would be saved. We correctly anticipated another surge in virus cases, but that has slowed and has not yet derailed growth. At the same time, global conditions have proven more supportive, especially with ongoing Chinese credit stimulus. Finally, the economic snapback has proved much more rapid and resilient than historical experiences would have implied; for example, manufacturing employment has recovered to 95% of its pre-pandemic peak, a feat that normally takes two to four years, not 10 months.
With a more supportive set of initial conditions, we now believe that the outlook for inflation over the next 12 months is tilted further to the upside. Indeed, for the first three to six months of 2021, we expect favorable base effects from last year’s pandemic shock. However, the markets should (rightly) look through those base effects. Instead, we see rising pressure—especially in the oil sector, where demand will rise strongly as the pandemic recedes with the vaccination program—against a backdrop of tight supply constraints and a rebound of travel. These factors should help lift energy prices markedly throughout the initial part of 2021, until prices reach a level that incentivizes a meaningful supply response. Supply constraints are also binding in the real estate sector, particularly in aspects of commercial real estate and apartments, which could benefit our real estate firms later in 2021 and bolster 2022 earnings going forward.
Over the longer term, the wrenching supply side adjustments from the pandemic leave markets exposed to an acute, cost-push inflation shock in the coming years. Companies will be pressured to onshore and duplicate supply chains that have, up to now, been concentrated in China and are heavily reliant on fragile networks. To help cope with the large fiscal deficit, financial repression seems possible, and the reduction in efficiency will likely benefit firms with pricing power. We believe that, should the rate of inflation move higher, the Real Assets Fund’s diversification benefits may help to provide a buffer, especially since a higher inflation rate has historically been a headwind for more traditional stock and bond portfolios.
The views expressed reflect the opinions of T. Rowe Price as of the date of this report and are subject to change based on changes in market, economic, or other conditions. These views are not intended to be a forecast of future events and are no guarantee of future results.
arraf_1220_P3Proof #
8
T. ROWE PRICE REAl AssETs Fund
RISKS OF STOCK INVESTING
The fund’s share price can fall because of weakness in the stock markets, a particular industry, or specific holdings. Stock markets can decline for many reasons, including adverse political or economic developments, changes in investor psychology, or heavy institutional selling. The prospects for an industry or company may deteriorate because of a variety of factors, including disappointing earnings or changes in the competitive environment. In addition, the investment manager’s assessment of companies held in a fund may prove incorrect, resulting in losses or poor performance even in rising markets. Funds that invest only in specific industries will experience greater volatility than funds investing in a broad range of industries. The rate of earnings growth of natural resources companies may be irregular since these companies are strongly affected by natural forces, global economic cycles, and international politics. For example, stock prices of energy companies can fall sharply when oil prices decrease.
BENCHMARK INFORMATION
Combined index portfolio: Since January 1, 2018, the Real Assets Fund’s combined index portfolio is composed of 30% MSCI World Select Natural Resources, 25% MSCI All Country World Index Metals and Mining, 20% Wilshire RESI, 20% EPRA/NAREIT Developed Real Estate Index, 4% MSCI All Country World Index IMI Gold, and 1% MSCI All Country World Index IMI Precious Metals and Minerals. Prior to January 1, 2018, the Real Assets Fund’s combined index portfolio was composed of 25% MSCI All Country World Index Metals and Mining, 20% Wilshire U.S. Real Estate Securities Index, 20% FTSE EPRA/NAREIT Developed Real Estate Index, 19.5% MSCI All Country World Index Energy, 10.5% MSCI All Country World Index Materials, 4% MSCI All Country World Index IMI Gold, and 1% MSCI All Country World Index IMI Precious Metals and Minerals. Prior to December 1, 2013, the Real Assets Fund’s combined index portfolio was composed of 25% MSCI All Country World Index Metals and Mining, 20% Wilshire U.S. Real Estate Securities Index, 20% FTSE EPRA/NAREIT Developed Real Estate Index, 16.25% MSCI All Country World Index Energy, 8.75% MSCI All Country World Index Materials, 5% UBS World Infrastructure and Utilities Index, 4% MSCI All Country World Index IMI Gold, and 1% MSCI All Country World Index IMI Precious Metals and Minerals.

arraf_1220_P3Proof #
9
T. ROWE PRICE REAl AssETs Fund
BENCHMARK INFORMATION (CONTINUED)
Note: MSCI makes no express or implied warranties or representations and shall have no liability whatsoever with respect to any MSCI data contained herein. The MSCI data may not be further redistributed or used as a basis for other indices or any securities or financial products. This report is not approved, reviewed, or produced by MSCI.

arraf_1220_P3Proof #
10
T. ROWE PRICE REAl AssETs Fund
TWENTY-FIVE LARGEST HOLDINGS
Percent ofnet Assets
12/31/20
BHP 4.8 %Prologis 2.3 Rio Tinto 2.3 Equinix 2.2 Camden Property Trust 1.5
newmont 1.5 Equity Residential 1.4 Total 1.3 AvalonBay Communities 1.3 Essex Property Trust 1.3
Welltower 1.3 Alexandria Real Estate 1.3 Barrick Gold 1.3 Vale 1.2 Boliden 1.2
Public storage 1.2 Equity lifestyle Properties 1.1 Franco-nevada 1.0 Cubesmart 1.0 Anglo American 0.9
linde 0.9 Freeport-McMoRan 0.9 digital Realty Trust 0.9 American Campus Communities 0.8 Acadia Realty Trust 0.8
Total 35.7 %
Note: The information shown does not reflect any exchange-traded funds (ETFs), cash reserves, or collateral for securities lending that may be held in the portfolio.
PORTFOLIO HIGHLIGHTS

arraf_1220_P3Proof #
11
T. ROWE PRICE REAl AssETs Fund
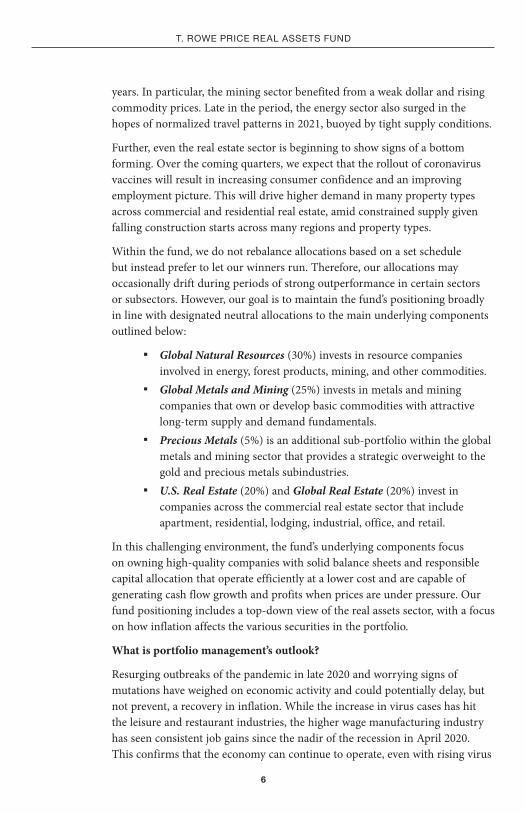
This chart shows the value of a hypothetical $10,000 investment in the fund over the past 10 fiscal year periods or since inception (for funds lacking 10-year records). The result is compared with benchmarks, which include a broad-based market index and may also include a peer group average or index. Market indexes do not include expenses, which are deducted from fund returns as well as mutual fund averages and indexes.
GROWTH OF $10,000
As of 12/31/20
$12,450
23,956
25,271
12,817
Real Assets Fund
MSCI All Country World Index Net
MSCI All Country World Index
Combined Index Portfolio Net
12/2012/1912/1812/1712/1612/1512/1412/1312/1212/1112/10
10,000
13,500
17,000
20,500
24,000
$27,500
REAL ASSETS FUND
Note: Performance for the I and Z Class shares will vary due to their differing fee structures. See the Average Annual Compound Total Return table.

arraf_1220_P3Proof #
12
T. ROWE PRICE REAl AssETs Fund
AVERAGE ANNUAL COMPOUND TOTAL RETURN
Periods Ended 12/31/20 1 Year 5 Years 10 Yearssince
InceptionInception
date
Real Assets Fund 6.99% 8.64% 2.22% ‒ 7/28/10
Real Assets Fund‒I Class 7.18 8.80 ‒ 7.55% 8/28/15
Real Assets Fund‒Z Class ‒ ‒ ‒ 56.91* 3/16/20
The fund’s performance information represents only past performance and is not necessarily an indication of future results. Current performance may be lower or higher than the performance data cited. Share price, principal value, and return will vary, and you may have a gain or loss when you sell your shares. For the most recent month-end performance, please visit our website (troweprice.com) or contact a T. Rowe Price representative at 1-800-225-5132 or, for I and Z Class shares, 1-800-638-8790.
Average annual total return figures include changes in principal value, reinvested dividends, and capital gain distributions. Returns do not reflect taxes that the shareholder may pay on fund distributions or the redemption of fund shares. When assessing performance, investors should consider both short- and long-term returns.
*Returns for periods of less than 1 year are not annualized.

arraf_1220_P3Proof #
13
T. ROWE PRICE REAl AssETs Fund
FUND EXPENSE EXAMPLE
As a mutual fund shareholder, you may incur two types of costs: (1) transaction costs, such as redemption fees or sales loads, and (2) ongoing costs, including management fees, distribution and service (12b-1) fees, and other fund expenses. The following example is intended to help you understand your ongoing costs (in dollars) of investing in the fund and to compare these costs with the ongoing costs of investing in other mutual funds. The example is based on an investment of $1,000 invested at the beginning of the most recent six-month period and held for the entire period.
Please note that the fund has three share classes: The original share class (Investor Class) charges no distribution and service (12b-1) fee, I Class shares are also available to institutionally oriented clients and impose no 12b-1 or administrative fee payment, and Z Class shares are offered only to funds advised by T. Rowe Price and other advisory clients of T. Rowe Price or its affiliates that are subject to a contractual fee for investment management services and impose no 12b-1 fee or administrative fee payment. Each share class is presented separately in the table.
Actual ExpensesThe first line of the following table (Actual) provides information about actual account values and expenses based on the fund’s actual returns. You may use the information on this line, together with your account balance, to estimate the expenses that you paid over the period. Simply divide your account value by $1,000 (for example, an $8,600 account value divided by $1,000 = 8.6), then multiply the result by the number on the first line under the heading “Expenses Paid During Period” to estimate the expenses you paid on your account during this period.
Hypothetical Example for Comparison PurposesThe information on the second line of the table (Hypothetical) is based on hypothetical account values and expenses derived from the fund’s actual expense ratio and an assumed 5% per year rate of return before expenses (not the fund’s actual return). You may compare the ongoing costs of investing in the fund with other funds by contrasting this 5% hypothetical example and the 5% hypothetical examples that appear in the shareholder reports of the other funds. The hypothetical account values and expenses may not be used to estimate the actual ending account balance or expenses you paid for the period.
EXPENSE RATIO
Real Assets Fund 0.81%
Real Assets Fund‒I Class 0.66
Real Assets Fund‒Z Class 0.66
The expense ratio shown is as of the fund’s most recent prospectus. This number may vary from the expense ratio shown elsewhere in this report because it is based on a different time period and, if applicable, includes acquired fund fees and expenses but does not include fee or expense waivers.

arraf_1220_P3Proof #
14
T. ROWE PRICE REAl AssETs Fund
FUND EXPENSE EXAMPLE (CONTINUED)
Note: T. Rowe Price charges an annual account service fee of $20, generally for accounts with less than $10,000. The fee is waived for any investor whose T. Rowe Price mutual fund accounts total $50,000 or more; accounts electing to receive electronic delivery of account statements, transaction confirmations, prospectuses, and shareholder reports; or accounts of an investor who is a T. Rowe Price Personal Services or Enhanced Personal Services client (enrollment in these programs generally requires T. Rowe Price assets of at least $250,000). This fee is not included in the accompanying table. If you are subject to the fee, keep it in mind when you are estimating the ongoing expenses of investing in the fund and when comparing the expenses of this fund with other funds.
You should also be aware that the expenses shown in the table highlight only your ongoing costs and do not reflect any transaction costs, such as redemption fees or sales loads. Therefore, the second line of the table is useful in comparing ongoing costs only and will not help you determine the relative total costs of owning different funds. To the extent a fund charges transaction costs, however, the total cost of owning that fund is higher.
Beginning Account Value
7/1/20
Ending Account Value
12/31/20
Expenses Paid during Period*
7/1/20 to 12/31/20
Investor ClassActual $1,000.00 $1,207.60 $4.55
Hypothetical (assumes 5% return before expenses) 1,000.00 1,021.01 4.17
I ClassActual 1,000.00 1,208.80 3.66
Hypothetical (assumes 5% return before expenses) 1,000.00 1,021.82 3.35
Z ClassActual 1,000.00 1,214.10 0.00
Hypothetical (assumes 5% return before expenses) 1,000.00 1,025.14 0.00
* Expenses are equal to the fund’s annualized expense ratio for the 6-month period, multiplied by the average account value over the period, multiplied by the number of days in the most recent fiscal half year (184), and divided by the days in the year (366) to reflect the half-year period. The annualized expense ratio of the Investor Class was 0.82%, the I Class was 0.66%, and the Z Class was 0.00%.
REAL ASSETS FUND
arraf_1220_P3Proof #
15
T. ROWE PRICE REAl AssETs Fund
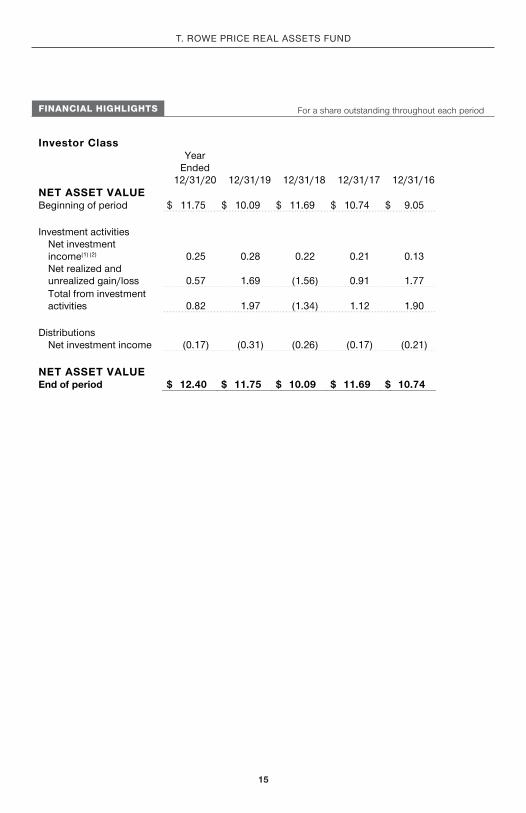
FINANCIAL HIGHLIGHTS For a share outstanding throughout each period
Investor Class
Year Ended
12/31/20 12/31/19 12/31/18 12/31/17 12/31/16
NET ASSET VALUE Beginning of period $ 11.75 $ 10.09 $ 11.69 $ 10.74 $ 9.05
Investment activities
Net investment income(1) (2) 0.25 0.28 0.22 0.21 0.13
Net realized and unrealized gain/loss 0.57 1.69 (1.56) 0.91 1.77
Total from investment activities 0.82 1.97 (1.34) 1.12 1.90
Distributions
Net investment income (0.17) (0.31) (0.26) (0.17) (0.21)
NET ASSET VALUE End of period $ 12.40 $ 11.75 $ 10.09 $ 11.69 $ 10.74
arraf_1220_P3Proof #
16
The accompanying notes are an integral part of these financial statements.
T. ROWE PRICE REAl AssETs Fund
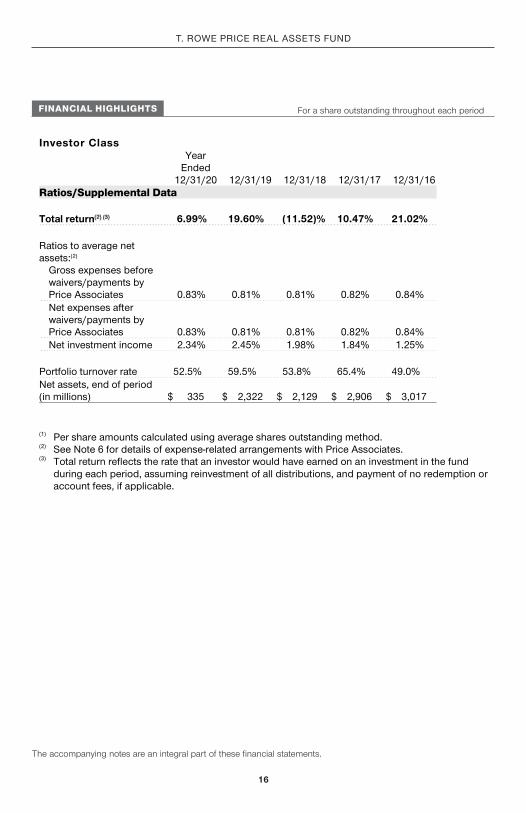
FINANCIAL HIGHLIGHTS For a share outstanding throughout each period
Investor Class
Year Ended
12/31/20 12/31/19 12/31/18 12/31/17 12/31/16
Ratios/Supplemental Data
Total return(2) (3) 6.99% 19.60% (11.52)% 10.47% 21.02%
Ratios to average net assets:(2)
Gross expenses before waivers/payments by Price Associates 0.83% 0.81% 0.81% 0.82% 0.84%
Net expenses after waivers/payments by Price Associates 0.83% 0.81% 0.81% 0.82% 0.84%
Net investment income 2.34% 2.45% 1.98% 1.84% 1.25%
Portfolio turnover rate 52.5% 59.5% 53.8% 65.4% 49.0%
Net assets, end of period (in millions) $ 335 $ 2,322 $ 2,129 $ 2,906 $ 3,017
(1) Per share amounts calculated using average shares outstanding method. (2) See Note 6 for details of expense-related arrangements with Price Associates. (3) Total return reflects the rate that an investor would have earned on an investment in the fund
during each period, assuming reinvestment of all distributions, and payment of no redemption or account fees, if applicable.
arraf_1220_P3Proof #
17
T. ROWE PRICE REAl AssETs Fund
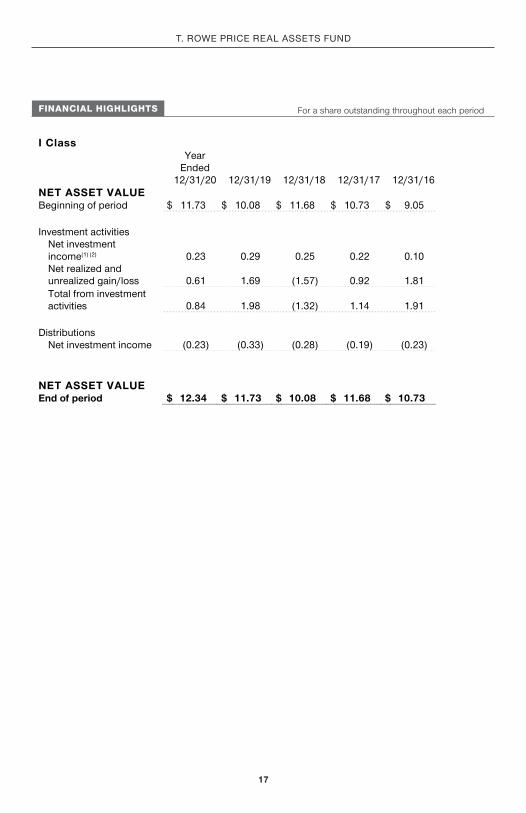
FINANCIAL HIGHLIGHTS For a share outstanding throughout each period
I Class
Year Ended
12/31/20 12/31/19 12/31/18 12/31/17 12/31/16
NET ASSET VALUE Beginning of period $ 11.73 $ 10.08 $ 11.68 $ 10.73 $ 9.05
Investment activities
Net investment income(1) (2) 0.23 0.29 0.25 0.22 0.10
Net realized and unrealized gain/loss 0.61 1.69 (1.57) 0.92 1.81
Total from investment activities 0.84 1.98 (1.32) 1.14 1.91
Distributions
Net investment income (0.23) (0.33) (0.28) (0.19) (0.23)
NET ASSET VALUE End of period $ 12.34 $ 11.73 $ 10.08 $ 11.68 $ 10.73
arraf_1220_P3Proof #
18
The accompanying notes are an integral part of these financial statements.
T. ROWE PRICE REAl AssETs Fund
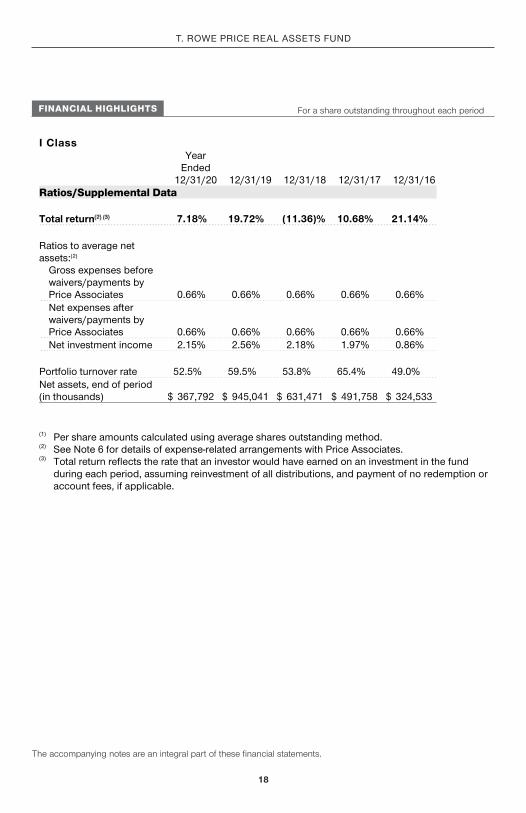
FINANCIAL HIGHLIGHTS For a share outstanding throughout each period
I Class
Year Ended
12/31/20 12/31/19 12/31/18 12/31/17 12/31/16
Ratios/Supplemental Data
Total return(2) (3) 7.18% 19.72% (11.36)% 10.68% 21.14%
Ratios to average net assets:(2)
Gross expenses before waivers/payments by Price Associates 0.66% 0.66% 0.66% 0.66% 0.66%
Net expenses after waivers/payments by Price Associates 0.66% 0.66% 0.66% 0.66% 0.66%
Net investment income 2.15% 2.56% 2.18% 1.97% 0.86%
Portfolio turnover rate 52.5% 59.5% 53.8% 65.4% 49.0%
Net assets, end of period (in thousands) $ 367,792 $ 945,041 $ 631,471 $ 491,758 $ 324,533
(1) Per share amounts calculated using average shares outstanding method. (2) See Note 6 for details of expense-related arrangements with Price Associates. (3) Total return reflects the rate that an investor would have earned on an investment in the fund
during each period, assuming reinvestment of all distributions, and payment of no redemption or account fees, if applicable.
arraf_1220_P3Proof #
19
The accompanying notes are an integral part of these financial statements.
T. ROWE PRICE REAl AssETs Fund
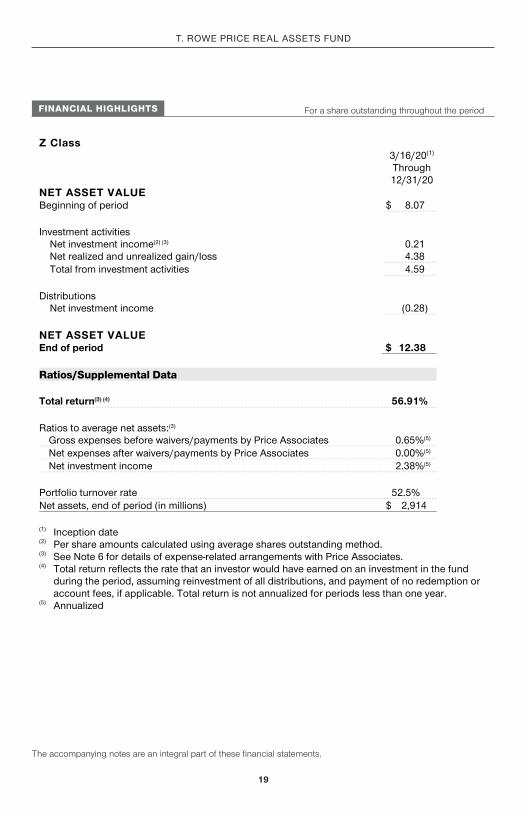
FINANCIAL HIGHLIGHTS For a share outstanding throughout the period
Z Class
3/16/20(1)
Through 12/31/20
NET ASSET VALUE Beginning of period $ 8.07
Investment activities
Net investment income(2) (3) 0.21
Net realized and unrealized gain/loss 4.38
Total from investment activities 4.59
Distributions
Net investment income (0.28)
NET ASSET VALUE End of period $ 12.38
Ratios/Supplemental Data
Total return(3) (4) 56.91%
Ratios to average net assets:(3)
Gross expenses before waivers/payments by Price Associates 0.65%(5)
Net expenses after waivers/payments by Price Associates 0.00%(5)
Net investment income 2.38%(5)
Portfolio turnover rate 52.5%
Net assets, end of period (in millions) $ 2,914
(1) Inception date (2) Per share amounts calculated using average shares outstanding method. (3) See Note 6 for details of expense-related arrangements with Price Associates. (4) Total return reflects the rate that an investor would have earned on an investment in the fund
during the period, assuming reinvestment of all distributions, and payment of no redemption or account fees, if applicable. Total return is not annualized for periods less than one year.
(5) Annualized

arraf_1220_P3Proof #
20
T. ROWE PRICE REAl AssETs Fund
december 31, 2020
PORTFOLIO OF INVESTMENTS‡
(Cost and value in $000s)
Shares/Par $ Value
COMMON STOCKS 95.4%
CONSUMER DISCRETIONARY 0.7%
Hotels, Resorts, & Cruise Lines 0.7%
Hilton Worldwide Holdings 114,468 12,735
Marriott International, Class A 105,176 13,875
Total Consumer Discretionary 26,610
CONSUMER STAPLES 0.3%
Packaged Foods & Meats 0.3%
Sanderson Farms 82,195 10,866
Total Consumer Staples 10,866
ENERGY 8.0%
Integrated Oil & Gas 3.0%
Chevron 236,740 19,993
Equinor (NOK) 1,208,058 20,388
Galp Energia (EUR) 1,901,237 20,146
TOTAL (EUR) 1,111,268 47,965
108,492
Oil & Gas Equipment & Services 1.0%
Cactus, Class A 220,549 5,750
ChampionX (1) 359,358 5,498
Enerflex (CAD) 737,924 3,803
Energy Reservoir Holdings, Class A-1, Acquisition Date: 4/30/19, Cost $2,530 (1)(2)(3)(4) 2,530,088 1,670
Halliburton 256,169 4,841
Liberty Oilfield Services, Class A 347,803 3,586
Tenaris (EUR) 728,402 5,903
TGS NOPEC Geophysical (NOK) 296,841 4,602
35,653
Oil & Gas Exploration & Production 3.2%
Aker BP (NOK) 253,671 6,401
Concho Resources 336,458 19,632
ConocoPhillips 292,843 11,711

arraf_1220_P3Proof #
21
Shares/Par $ Value
T. ROWE PRICE REAl AssETs Fund
(Cost and value in $000s)
Devon Energy 409,775 6,479
EOG Resources 469,795 23,429
Hess 132,315 6,985
Lundin Energy (SEK) 372,602 10,098
Magnolia Oil & Gas, Class A (1) 583,555 4,120
Parex Resources (CAD) (1) 321,646 4,427
Pioneer Natural Resources 145,307 16,549
WPX Energy (1) 650,808 5,304
115,135
Oil & Gas Storage & Transportation 0.8%
Enbridge 373,606 11,951
TC Energy 298,250 12,145
Venture Global LNG, Series B, Acquisition Date: 3/8/18, Cost $112 (1)(2)(3) 37 206
Venture Global LNG, Series C, Acquisition Date: 5/25/17 - 3/8/18, Cost $2,704 (1)(2)(3) 759 4,224
28,526
Total Energy 287,806
FINANCIALS 0.1%
Asset Management & Custody Banks 0.1%
Bluescape Opportunities Acquisition (1) 228,936 2,555
Total Financials 2,555
INDUSTRIALS & BUSINESS SERVICES 3.3%
Agricultural & Farm Machinery 0.7%
AGCO 70,169 7,233
Deere 38,004 10,225
Toro 64,801 6,146
23,604
Construction Machinery & Heavy Trucks 0.9%
Bucher Industries (CHF) 11,796 5,410
Caterpillar 66,480 12,101
Epiroc, B Shares (SEK) 558,383 9,426
Metso Outotec (EUR) 539,178 5,418
32,355

arraf_1220_P3Proof #
22
Shares/Par $ Value
T. ROWE PRICE REAl AssETs Fund
(Cost and value in $000s)
Electrical Components & Equipment 0.5%
Emerson Electric 54,000 4,340
Hubbell 36,500 5,723
Legrand (EUR) 11,904 1,065
Schneider Electric (EUR) 53,529 7,736
18,864
Industrial Machinery 1.0%
Atlas Copco, B Shares (SEK) 131,298 5,894
Kadant 34,102 4,808
Kennametal 129,192 4,682
Sandvik (SEK) (1) 251,895 6,212
Timken 45,200 3,497
Weir Group (GBP) (1) 406,450 11,051
36,144
Research & Consulting Services 0.1%
ALS (AUD) 476,061 3,514
3,514
Trading Companies & Distributors 0.1%
Toromont Industries (CAD) 67,177 4,708
4,708
Total Industrials & Business Services 119,189
INFORMATION TECHNOLOGY 0.4%
IT Services 0.1%
GDS Holdings, Class A (HKD) (1) 158,291 1,845
1,845
Semiconductor Equipment 0.3%
CMC Materials 29,800 4,509
Entegris 101,234 9,728
14,237
Total Information Technology 16,082
MATERIALS 43.7%
Aluminum 0.6%
Hindalco Industries (INR) 1,267,795 4,165
Norsk Hydro (NOK) 3,147,036 14,646
arraf_1220_P3Proof #
23
Shares/Par $ Value
T. ROWE PRICE REAl AssETs Fund
(Cost and value in $000s)
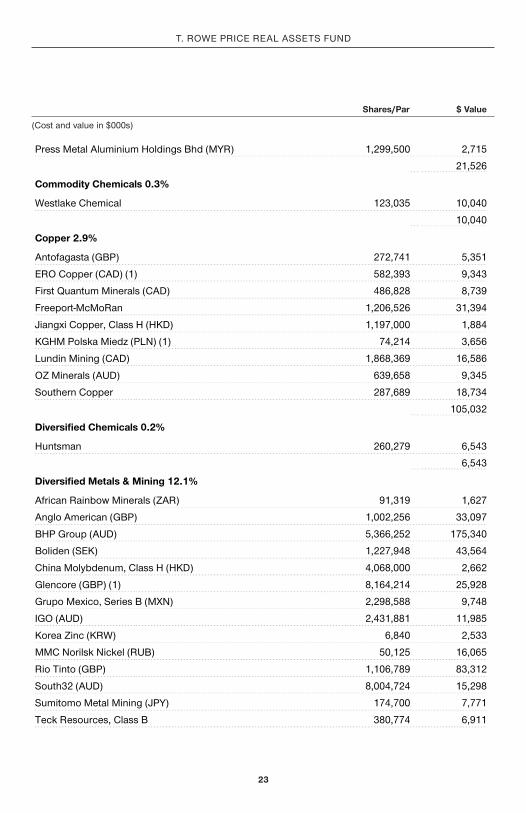
Press Metal Aluminium Holdings Bhd (MYR) 1,299,500 2,715
21,526
Commodity Chemicals 0.3%
Westlake Chemical 123,035 10,040
10,040
Copper 2.9%
Antofagasta (GBP) 272,741 5,351
ERO Copper (CAD) (1) 582,393 9,343
First Quantum Minerals (CAD) 486,828 8,739
Freeport-McMoRan 1,206,526 31,394
Jiangxi Copper, Class H (HKD) 1,197,000 1,884
KGHM Polska Miedz (PLN) (1) 74,214 3,656
Lundin Mining (CAD) 1,868,369 16,586
OZ Minerals (AUD) 639,658 9,345
Southern Copper 287,689 18,734
105,032
Diversified Chemicals 0.2%
Huntsman 260,279 6,543
6,543
Diversified Metals & Mining 12.1%
African Rainbow Minerals (ZAR) 91,319 1,627
Anglo American (GBP) 1,002,256 33,097
BHP Group (AUD) 5,366,252 175,340
Boliden (SEK) 1,227,948 43,564
China Molybdenum, Class H (HKD) 4,068,000 2,662
Glencore (GBP) (1) 8,164,214 25,928
Grupo Mexico, Series B (MXN) 2,298,588 9,748
IGO (AUD) 2,431,881 11,985
Korea Zinc (KRW) 6,840 2,533
MMC Norilsk Nickel (RUB) 50,125 16,065
Rio Tinto (GBP) 1,106,789 83,312
South32 (AUD) 8,004,724 15,298
Sumitomo Metal Mining (JPY) 174,700 7,771
Teck Resources, Class B 380,774 6,911

arraf_1220_P3Proof #
24
Shares/Par $ Value
T. ROWE PRICE REAl AssETs Fund
(Cost and value in $000s)
Vedanta (INR) 1,381,994 3,051
438,892
Fertilizers & Agricultural Chemicals 0.2%
CF Industries Holdings 205,940 7,972
7,972
Forest Products 0.4%
Svenska Cellulosa, Class B (SEK) (1) 465,874 8,146
West Fraser Timber (CAD) 83,633 5,373
13,519
Gold 10.3%
Agnico Eagle Mines (CAD) 271,338 19,097
Alamos Gold, Class A (CAD) 128,451 1,122
Aneka Tambang Tbk (IDR) 2,721,100 375
AngloGold Ashanti (ZAR) 468,227 10,792
B2Gold (CAD) 1,104,354 6,186
Barrick Gold (CAD) 1,997,573 45,510
Bellevue Gold (AUD) (1) 230,971 200
Centamin (GBP) 362,301 613
Centerra Gold (CAD) 72,105 835
Chalice Mining (AUD) (1) 89,876 271
Cia de Minas Buenaventura, ADR (1) 241,461 2,943
Coeur Mining (1) 78,854 816
De Grey Mining (AUD) (1) 288,610 227
Dundee Precious Metals (CAD) 44,778 322
Eldorado Gold (CAD) (1) 55,845 740
Endeavour Mining (CAD) (1) 41,754 972
Equinox Gold (CAD) (1) 70,185 726
Evolution Mining (AUD) 1,768,777 6,807
Franco-Nevada (CAD) 296,030 37,117
Gold Fields (ZAR) 992,419 9,213
Greatland Gold (GBP) (1) 1,176,057 593
Harmony Gold Mining (ZAR) (1) 433,611 2,073
Harmony Gold Mining, ADR (1) 176,586 826
IAMGOLD (CAD) (1) 154,159 566
Kinross Gold (CAD) 1,413,409 10,371

arraf_1220_P3Proof #
25
Shares/Par $ Value
T. ROWE PRICE REAl AssETs Fund
(Cost and value in $000s)
Kirkland Lake Gold (CAD) 597,339 24,684
New Gold (CAD) (1) 209,267 460
Newcrest Mining (AUD) 922,308 18,407
Newmont 902,191 54,032
Northern Star Resources (AUD) 3,022,868 29,545
Novagold Resources (CAD) (1) 80,510 779
OceanaGold (CAD) (1) 227,655 440
Orla Mining (CAD) (1) 44,087 238
Osisko Gold Royalties (CAD) 38,327 486
Perseus Mining (AUD) (1) 5,811,684 5,826
Petropavlovsk (GBP) (1) 828,757 368
Polymetal International (RUB) 265,038 6,209
Polyus (RUB) 37,866 7,771
Pretium Resources (CAD) (1) 60,975 699
Ramelius Resources (AUD) 250,327 326
Regis Resources (AUD) 158,740 458
Royal Gold 21,095 2,244
Sandstorm Gold (CAD) (1) 59,733 428
Saracen Mineral Holdings (AUD) (1) 342,215 1,256
Seabridge Gold (CAD) (1) 16,652 350
Shandong Gold Mining, A Shares (CNH) 184,540 667
Shandong Gold Mining, Class H (HKD) 725,000 1,675
Silver Lake Resources (AUD) (1) 1,876,127 2,589
SSR Mining (CAD) (1) 246,400 4,948
St Barbara (AUD) 231,512 421
Teranga Gold (CAD) (1) 35,532 381
Torex Gold Resources (CAD) (1) 26,204 393
Wesdome Gold Mines (CAD) (1) 1,123,583 9,374
Wheaton Precious Metals (CAD) 503,600 21,032
Yamana Gold (CAD) 1,070,338 6,113
Zhaojin Mining Industry, Class H (HKD) 340,500 406
Zijin Mining Group, Class H (HKD) 8,384,000 9,499
371,817
Industrial Gases 1.8%
Air Liquide (EUR) 81,790 13,409
Air Products & Chemicals 77,843 21,268

arraf_1220_P3Proof #
26
Shares/Par $ Value
T. ROWE PRICE REAl AssETs Fund
(Cost and value in $000s)
Linde 119,414 31,467
66,144
Metal & Glass Containers 0.7%
Ball 140,281 13,071
Crown Holdings (1) 62,100 6,223
Verallia (EUR) 150,320 5,330
Vidrala (EUR) 25,192 2,923
27,547
Metals & Mining 0.3%
Sibanye Stillwater (ZAR) 2,556,643 10,304
10,304
Paper Packaging 2.0%
Avery Dennison 61,437 9,530
DS Smith (GBP) (1) 1,624,587 8,304
Graphic Packaging Holding 321,286 5,443
International Paper 342,547 17,031
Mayr Melnhof Karton (EUR) 12,826 2,581
Packaging Corp. of America 161,621 22,289
Westrock 179,128 7,798
72,976
Paper Products 1.1%
Domtar 215,223 6,812
Mondi (GBP) 684,741 16,045
Stora Enso, R Shares (EUR) 360,363 6,900
UPM-Kymmene (EUR) 261,027 9,734
39,491
Precious Metals & Minerals 1.7%
Alrosa (RUB) 4,722,190 6,309
Anglo American Platinum (ZAR) 101,099 9,949
Asahi Holdings (JPY) 35,600 1,266
Eurasia Mining (GBP) (1) 1,778,059 825
Fresnillo (GBP) 343,988 5,313
Impala Platinum Holdings (ZAR) 1,498,478 20,625
Industrias Penoles (MXN) 258,338 4,392
Northam Platinum (ZAR) (1) 670,938 9,598

arraf_1220_P3Proof #
27
Shares/Par $ Value
T. ROWE PRICE REAl AssETs Fund
(Cost and value in $000s)
Osisko Mining (CAD) (1) 290,085 843
Silvercrest Metals (CAD) (1) 108,828 1,213
60,333
Silver 0.2%
Pan American Silver (CAD) 183,273 6,321
6,321
Specialty Chemicals 3.4%
Akzo Nobel (EUR) 96,923 10,403
Borregaard (NOK) 338,042 5,596
Celanese 35,616 4,628
Covestro (EUR) 113,829 7,013
Croda International (GBP) 102,347 9,204
Koninklijke DSM (EUR) 75,737 13,024
PPG Industries 115,164 16,609
Quaker Chemical 44,073 11,168
RPM International 169,582 15,395
Sherwin-Williams 29,421 21,622
Shin-Etsu Chemical (JPY) 47,300 8,302
122,964
Steel 5.5%
ArcelorMittal (EUR) (1) 626,296 14,323
BlueScope Steel (AUD) 361,840 4,887
China Steel (TWD) 10,267,000 9,051
Cia Siderurgica Nacional (BRL) 613,400 3,778
Eregli Demir ve Celik Fabrikalari (TRY) 1,134,899 2,278
Evraz (GBP) 393,742 2,516
Fortescue Metals Group (AUD) 1,188,386 21,465
Hitachi Metals (JPY) 190,800 2,901
Hyundai Steel (KRW) 76,959 2,813
JFE Holdings (JPY) (1) 441,400 4,238
JSW Steel (INR) 757,022 4,011
Kumba Iron Ore (ZAR) 56,922 2,421
Nippon Steel (JPY) (1) 723,700 9,334
Novolipetsk Steel (RUB) 1,030,290 2,916
Nucor 263,732 14,028

arraf_1220_P3Proof #
28
Shares/Par $ Value
T. ROWE PRICE REAl AssETs Fund
(Cost and value in $000s)
POSCO (KRW) 64,388 16,089
Reliance Steel & Aluminum 166,446 19,932
Severstal (RUB) 187,933 3,356
Steel Dynamics 183,816 6,777
Tata Steel (INR) 589,243 5,197
Vale (BRL) 2,672,684 44,943
voestalpine (EUR) 83,536 2,981
200,235
Total Materials 1,581,656
REAL ESTATE 36.7%
Diversified Real Estate Activities 1.8%
CapitaLand (SGD) 1,429,500 3,547
Hang Lung Properties (HKD) 3,751,000 9,885
Heiwa Real Estate (JPY) 191,000 6,912
Mitsubishi Estate (JPY) 199,500 3,207
Mitsui Fudosan (JPY) 945,600 19,800
Sun Hung Kai Properties (HKD) 1,554,500 19,880
63,231
Diversified Real Estate Investment Trusts 1.5%
Alexander & Baldwin, REIT 127,176 2,185
Gecina (EUR) 39,421 6,130
Mirvac Group (AUD) 6,199,395 12,591
PS Business Parks, REIT 144,349 19,180
STORE Capital, REIT 53,860 1,830
Vereit, REIT 59,978 2,266
WP Carey, REIT 131,469 9,279
53,461
Health Care Real Estate Investment Trusts 2.3%
Healthcare Realty Trust, REIT 697,989 20,661
Healthcare Trust of America, Class A, REIT 529,056 14,570
Welltower, REIT 724,094 46,791
82,022
Hotel & Resort Real Estate Investment Trusts 1.6%
Apple Hospitality, REIT 1,355,894 17,505
Hoshino Resorts REIT (JPY) 1,059 5,169
arraf_1220_P3Proof #
29
Shares/Par $ Value
T. ROWE PRICE REAl AssETs Fund
(Cost and value in $000s)
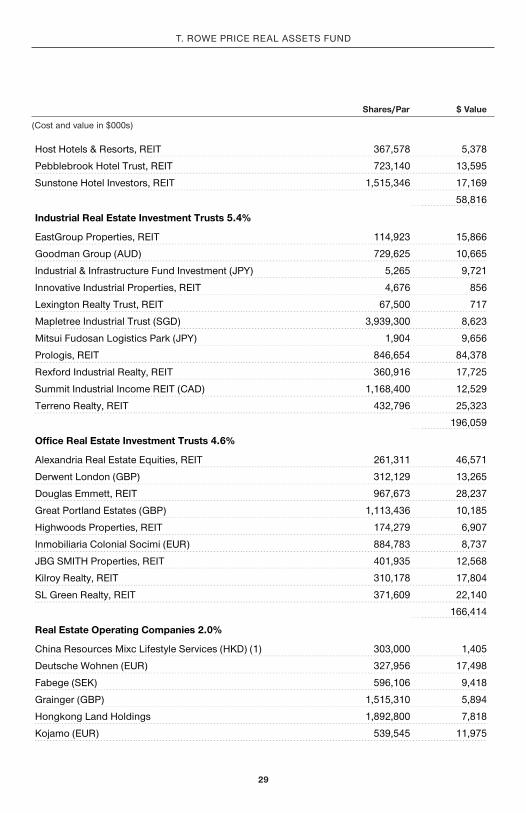
Host Hotels & Resorts, REIT 367,578 5,378
Pebblebrook Hotel Trust, REIT 723,140 13,595
Sunstone Hotel Investors, REIT 1,515,346 17,169
58,816
Industrial Real Estate Investment Trusts 5.4%
EastGroup Properties, REIT 114,923 15,866
Goodman Group (AUD) 729,625 10,665
Industrial & Infrastructure Fund Investment (JPY) 5,265 9,721
Innovative Industrial Properties, REIT 4,676 856
Lexington Realty Trust, REIT 67,500 717
Mapletree Industrial Trust (SGD) 3,939,300 8,623
Mitsui Fudosan Logistics Park (JPY) 1,904 9,656
Prologis, REIT 846,654 84,378
Rexford Industrial Realty, REIT 360,916 17,725
Summit Industrial Income REIT (CAD) 1,168,400 12,529
Terreno Realty, REIT 432,796 25,323
196,059
Office Real Estate Investment Trusts 4.6%
Alexandria Real Estate Equities, REIT 261,311 46,571
Derwent London (GBP) 312,129 13,265
Douglas Emmett, REIT 967,673 28,237
Great Portland Estates (GBP) 1,113,436 10,185
Highwoods Properties, REIT 174,279 6,907
Inmobiliaria Colonial Socimi (EUR) 884,783 8,737
JBG SMITH Properties, REIT 401,935 12,568
Kilroy Realty, REIT 310,178 17,804
SL Green Realty, REIT 371,609 22,140
166,414
Real Estate Operating Companies 2.0%
China Resources Mixc Lifestyle Services (HKD) (1) 303,000 1,405
Deutsche Wohnen (EUR) 327,956 17,498
Fabege (SEK) 596,106 9,418
Grainger (GBP) 1,515,310 5,894
Hongkong Land Holdings 1,892,800 7,818
Kojamo (EUR) 539,545 11,975
arraf_1220_P3Proof #
30
Shares/Par $ Value
T. ROWE PRICE REAl AssETs Fund
(Cost and value in $000s)
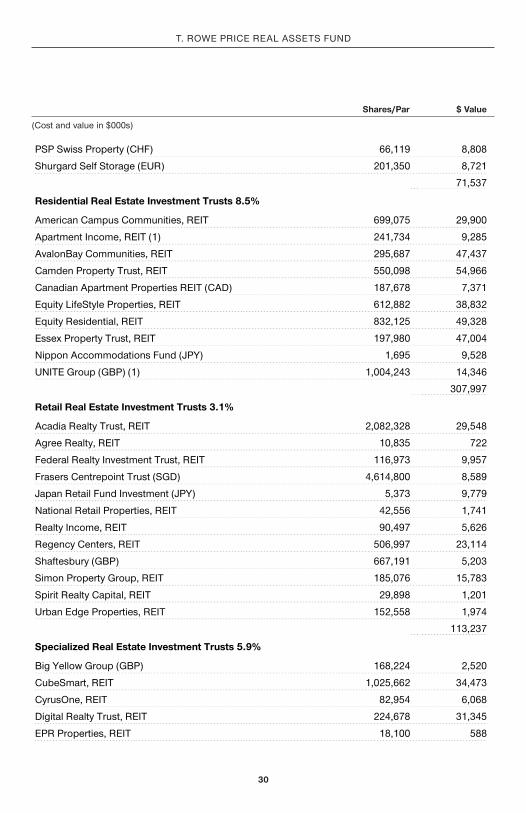
PSP Swiss Property (CHF) 66,119 8,808
Shurgard Self Storage (EUR) 201,350 8,721
71,537
Residential Real Estate Investment Trusts 8.5%
American Campus Communities, REIT 699,075 29,900
Apartment Income, REIT (1) 241,734 9,285
AvalonBay Communities, REIT 295,687 47,437
Camden Property Trust, REIT 550,098 54,966
Canadian Apartment Properties REIT (CAD) 187,678 7,371
Equity LifeStyle Properties, REIT 612,882 38,832
Equity Residential, REIT 832,125 49,328
Essex Property Trust, REIT 197,980 47,004
Nippon Accommodations Fund (JPY) 1,695 9,528
UNITE Group (GBP) (1) 1,004,243 14,346
307,997
Retail Real Estate Investment Trusts 3.1%
Acadia Realty Trust, REIT 2,082,328 29,548
Agree Realty, REIT 10,835 722
Federal Realty Investment Trust, REIT 116,973 9,957
Frasers Centrepoint Trust (SGD) 4,614,800 8,589
Japan Retail Fund Investment (JPY) 5,373 9,779
National Retail Properties, REIT 42,556 1,741
Realty Income, REIT 90,497 5,626
Regency Centers, REIT 506,997 23,114
Shaftesbury (GBP) 667,191 5,203
Simon Property Group, REIT 185,076 15,783
Spirit Realty Capital, REIT 29,898 1,201
Urban Edge Properties, REIT 152,558 1,974
113,237
Specialized Real Estate Investment Trusts 5.9%
Big Yellow Group (GBP) 168,224 2,520
CubeSmart, REIT 1,025,662 34,473
CyrusOne, REIT 82,954 6,068
Digital Realty Trust, REIT 224,678 31,345
EPR Properties, REIT 18,100 588

arraf_1220_P3Proof #
31
Shares/Par $ Value
T. ROWE PRICE REAl AssETs Fund
(Cost and value in $000s)
Equinix, REIT 113,754 81,241
PotlatchDeltic, REIT 15,597 780
Public Storage, REIT 185,667 42,876
Rayonier, REIT 262,894 7,724
Weyerhaeuser, REIT 165,470 5,548
213,163
Total Real Estate 1,325,937
UTILITIES 1.7%
Electric Utilities 1.1%
Entergy 70,701 7,059
Iberdrola (EUR) 354,367 5,092
IDACORP 45,300 4,350
NextEra Energy 145,424 11,220
Terna Rete Elettrica Nazionale (EUR) 634,464 4,875
Xcel Energy 81,166 5,411
38,007
Gas Utilities 0.1%
National Fuel Gas 125,226 5,151
5,151
Multi-Utilities 0.5%
Ameren 120,137 9,378
DTE Energy 52,500 6,374
Public Service Enterprise Group 70,100 4,087
19,839
Total Utilities 62,997
Total Miscellaneous Common Stocks 0.5% (5) 18,653
Total Common Stocks (Cost $2,490,417) 3,452,351
PREFERRED STOCKS 0.2%
MATERIALS 0.2%
Steel 0.2%
Bradespar (BRL) (6) 196,000 2,421

arraf_1220_P3Proof #
32
Shares/Par $ Value
T. ROWE PRICE REAl AssETs Fund
(Cost and value in $000s)
Gerdau (BRL) (6) 975,000 4,619
Total Materials 7,040
Total Preferred Stocks (Cost $6,029) 7,040
CONVERTIBLE PREFERRED STOCKS 1.4%
CONSUMER STAPLES 0.1%
Agricultural Products 0.1%
Farmers Business Network, Series D, Acquisition Date: 11/3/17, Cost $2,712 (1)(2)(3) 146,876 4,855
Total Consumer Staples 4,855
UTILITIES 1.3%
Electric Utilities 1.1%
American Electric Power, 6.125%, 3/15/22 219 10,796
NextEra Energy, 5.279%, 3/1/23 305 15,503
Southern, Series A, 6.75%, 8/1/22 260 13,364
39,663
Multi-Utilities 0.2%
Sempra Energy, Series B, 6.75%, 7/15/21 75 7,649
7,649
Total Utilities 47,312
Total Convertible Preferred Stocks (Cost $45,304) 52,167
EQUITY MUTUAL FUNDS 2.6%
iShares Russell 1000 Value ETF 289,600 39,597
SPDR Dow Jones REIT ETF 99,129 8,594
SPDR S&P Homebuilders ETF 204,174 11,769
SPDR S&P Oil & Gas Exploration & Production ETF 557,110 32,591
Total Equity Mutual Funds (Cost $82,861) 92,551
arraf_1220_P3Proof #
33
Shares/Par $ Value
T. ROWE PRICE REAl AssETs Fund
(Cost and value in $000s)
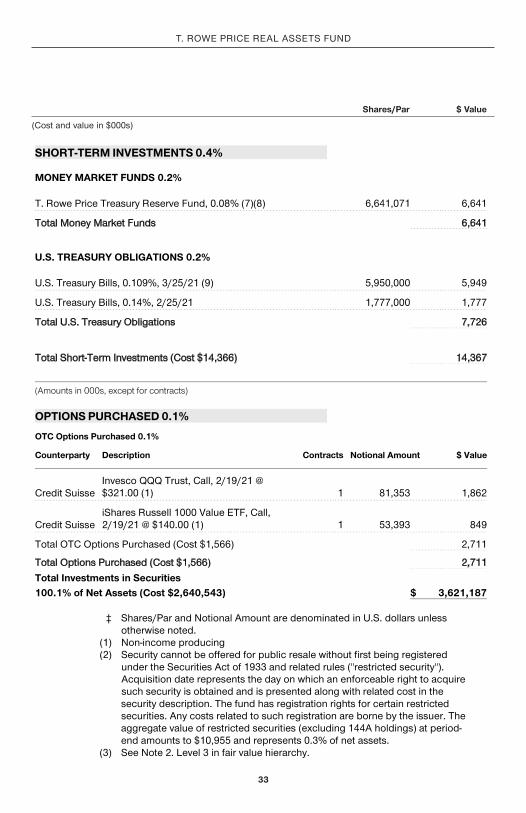
SHORT-TERM INVESTMENTS 0.4%
MONEY MARKET FUNDS 0.2%
T. Rowe Price Treasury Reserve Fund, 0.08% (7)(8) 6,641,071 6,641
Total Money Market Funds 6,641
U.S. TREASURY OBLIGATIONS 0.2%
U.S. Treasury Bills, 0.109%, 3/25/21 (9) 5,950,000 5,949
U.S. Treasury Bills, 0.14%, 2/25/21 1,777,000 1,777
Total U.S. Treasury Obligations 7,726
Total Short-Term Investments (Cost $14,366) 14,367
(Amounts in 000s, except for contracts)
OPTIONS PURCHASED 0.1%
OTC Options Purchased 0.1%
Counterparty Description Contracts Notional Amount $ Value
Credit Suisse Invesco QQQ Trust, Call, 2/19/21 @ $321.00 (1) 1 81,353 1,862
Credit Suisse iShares Russell 1000 Value ETF, Call, 2/19/21 @ $140.00 (1) 1 53,393 849
Total OTC Options Purchased (Cost $1,566) 2,711
Total Options Purchased (Cost $1,566) 2,711Total Investments in Securities 100.1% of Net Assets (Cost $2,640,543) $ 3,621,187
‡
Shares/Par and Notional Amount are denominated in U.S. dollars unless otherwise noted.
(1) Non-income producing (2)
Security cannot be offered for public resale without first being registered under the Securities Act of 1933 and related rules ("restricted security"). Acquisition date represents the day on which an enforceable right to acquire such security is obtained and is presented along with related cost in the security description. The fund has registration rights for certain restricted securities. Any costs related to such registration are borne by the issuer. The aggregate value of restricted securities (excluding 144A holdings) at period-end amounts to $10,955 and represents 0.3% of net assets.
(3) See Note 2. Level 3 in fair value hierarchy.
arraf_1220_P3Proof #
34
T. ROWE PRICE REAl AssETs Fund
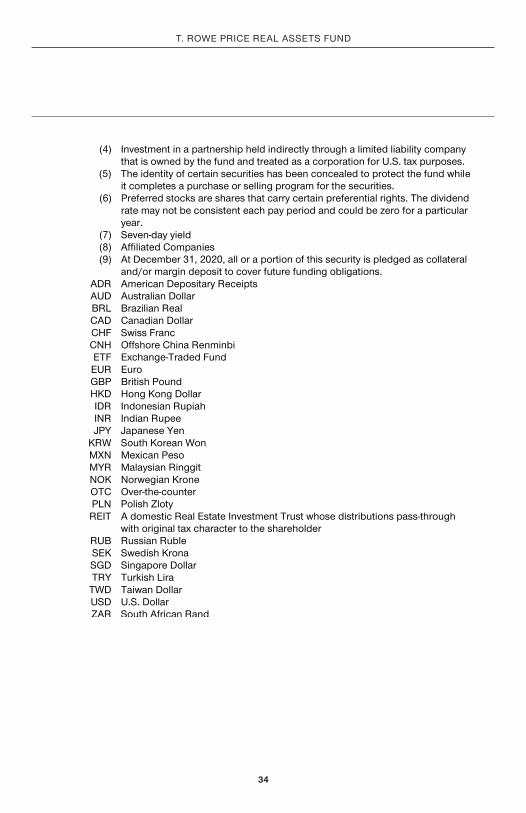
(4)
Investment in a partnership held indirectly through a limited liability company that is owned by the fund and treated as a corporation for U.S. tax purposes.
(5)
The identity of certain securities has been concealed to protect the fund while it completes a purchase or selling program for the securities.
(6)
Preferred stocks are shares that carry certain preferential rights. The dividend rate may not be consistent each pay period and could be zero for a particular year.
(7) Seven-day yield (8) Affiliated Companies (9)
At December 31, 2020, all or a portion of this security is pledged as collateral and/or margin deposit to cover future funding obligations.
ADR American Depositary Receipts AUD Australian Dollar BRL Brazilian Real CAD Canadian Dollar CHF Swiss Franc CNH Offshore China Renminbi ETF Exchange-Traded Fund EUR Euro GBP British Pound HKD Hong Kong Dollar IDR Indonesian Rupiah INR Indian Rupee JPY Japanese Yen
KRW South Korean Won MXN Mexican Peso MYR Malaysian Ringgit NOK Norwegian Krone OTC Over-the-counter PLN Polish Zloty REIT
A domestic Real Estate Investment Trust whose distributions pass-through with original tax character to the shareholder
RUB Russian Ruble SEK Swedish Krona SGD Singapore Dollar TRY Turkish Lira
TWD Taiwan Dollar USD U.S. Dollar ZAR South African Rand

arraf_1220_P3Proof #
35
T. ROWE PRICE REAl AssETs Fund
(Amounts in 000s)
Counterparty Settlement Receive Deliver Unrealized Gain/(Loss)
Barclays Bank 1/15/21 JPY 11,167,000 USD 107,198 $ 972Net unrealized gain (loss) on open forward currency exchange contracts $ 972
FORWARD CURRENCY EXCHANGE CONTRACTS

arraf_1220_P3Proof #
36
T. ROWE PRICE REAl AssETs Fund
Expiration Date
Notional Amount
Value and Unrealized Gain (Loss)
Long, 29 S&P 500 E-Mini Index contracts 3/21 5,436 $ 132
Long, 10 S&P/TSX 60 Index contracts 3/21 1,616 2
Net payments (receipts) of variation margin to date (109)
Variation margin receivable (payable) on open futures contracts $ 25
($000s)
FUTURES CONTRACTS

arraf_1220_P3Proof #
37
T. ROWE PRICE REAl AssETs Fund
The accompanying notes are an integral part of these financial statements.
The fund may invest in certain securities that are considered affiliated companies. As defined by the 1940 Act, an affiliated company is one in which the fund owns 5% or more of the outstanding voting securities, or a company that is under common ownership or control. The following securities were considered affiliated companies for all or some portion of the year ended December 31, 2020. Net realized gain (loss), investment income, change in net unrealized gain/loss, and purchase and sales cost reflect all activity for the period then ended.
Affiliate Net Realized Gain
(Loss)
Change in NetUnrealizedGain/Loss
InvestmentIncome
T. Rowe Price Treasury Reserve Fund $ —# $ — $ 685+
Supplementary Investment Schedule
Affiliate Value
12/31/19Purchase
CostSalesCost
Value12/31/20
T. Rowe Price Treasury Reserve Fund $ 128,332 ¤ ¤$ 6,641^
# Capital gain distributions from mutual funds represented $0 of the net realized gain (loss). + Investment income comprised $685 of dividend income and $0 of interest income. ¤ Purchase and sale information not shown for cash management funds. ^ The cost basis of investments in affiliated companies was $6,641.
($000s)
AFFILIATED COMPANIES
arraf_1220_P3Proof #
38
T. ROWE PRICE REAl AssETs Fund
december 31, 2020
($000s, except shares and per share amounts)
STATEMENT OF ASSETS AND LIABILITIES
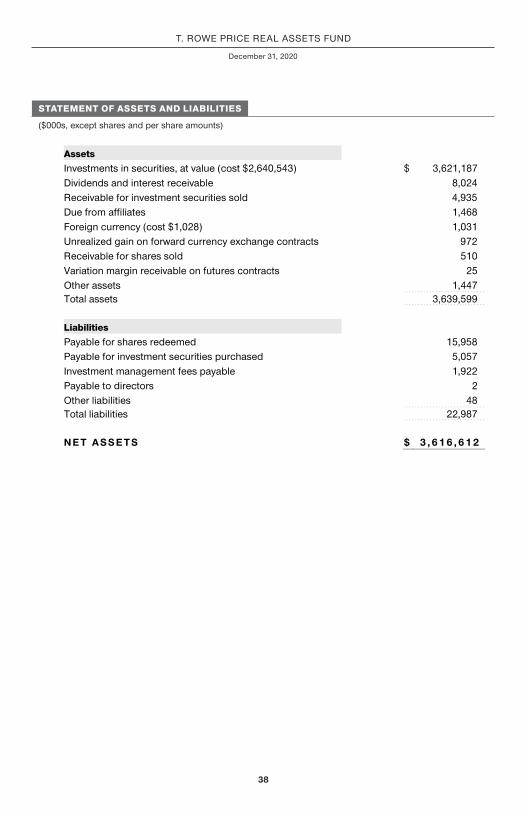
Assets Investments in securities, at value (cost $2,640,543) $ 3,621,187 Dividends and interest receivable 8,024 Receivable for investment securities sold 4,935 Due from affiliates 1,468 Foreign currency (cost $1,028) 1,031 Unrealized gain on forward currency exchange contracts 972 Receivable for shares sold 510 Variation margin receivable on futures contracts 25 Other assets 1,447 Total assets 3,639,599
Liabilities Payable for shares redeemed 15,958 Payable for investment securities purchased 5,057 Investment management fees payable 1,922 Payable to directors 2 Other liabilities 48 Total liabilities 22,987
N E T A S S E T S $ 3 , 6 1 6 , 6 1 2

arraf_1220_P3Proof #
39
T. ROWE PRICE REAl AssETs Fund
december 31, 2020
($000s, except shares and per share amounts)
The accompanying notes are an integral part of these financial statements.
STATEMENT OF ASSETS AND LIABILITIES
Net Assets Consist of: Total distributable earnings (loss) $ 265,839 Paid-in capital applicable to 292,246,395 shares of $0.0001 par value capital stock outstanding; 1,000,000,000 shares authorized 3,350,773
N E T A S S E T S $ 3 , 6 1 6 , 6 1 2
NET ASSET VALUE PER SHARE
Investor Class ($334,745,710 / 26,989,436 shares outstanding) $ 12.40 I Class ($367,792,207 / 29,796,166 shares outstanding) $ 12.34 Z Class ($2,914,073,923 / 235,460,793 shares outstanding) $ 12.38

arraf_1220_P3Proof #
40
T. ROWE PRICE REAl AssETs Fund
($000s)
STATEMENT OF OPERATIONS
Year Ended
12/31/20Investment Income (Loss) Income Dividend $ 83,574 Interest 367 Other 3
Total income 83,944 Expenses Investment management 20,116
Shareholder servicing Investor Class $ 1,439 I Class 10 1,449
Prospectus and shareholder reports Investor Class 20 I Class 1 Z Class 2 23
Custody and accounting 386 Registration 67 Legal and audit 49 Directors 10 Miscellaneous 29 Waived / paid by Price Associates (12,255)
Total expenses 9,874 Net investment income 74,070
Realized and Unrealized Gain / Loss Net realized gain (loss) Securities (90,922) Futures (16,715) Swaps (890) Forward currency exchange contracts 1,377 Foreign currency transactions (4,647)
Net realized loss (111,797)

arraf_1220_P3Proof #
41
T. ROWE PRICE REAl AssETs Fund
($000s)
The accompanying notes are an integral part of these financial statements.
STATEMENT OF OPERATIONS
Year Ended
12/31/20Change in net unrealized gain / loss Securities 337,635 Futures 141 Forward currency exchange contracts 1,129 Other assets and liabilities denominated in foreign currencies 50
Change in net unrealized gain / loss 338,955 Net realized and unrealized gain / loss 227,158
INCREASE IN NET ASSETS FROM OPERATIONS $ 301,228
arraf_1220_P3Proof #
42
T. ROWE PRICE REAl AssETs Fund
($000s)
STATEMENT OF CHANGES IN NET ASSETS
YearEnded
12/31/20 12/31/19Increase (Decrease) in Net Assets Operations
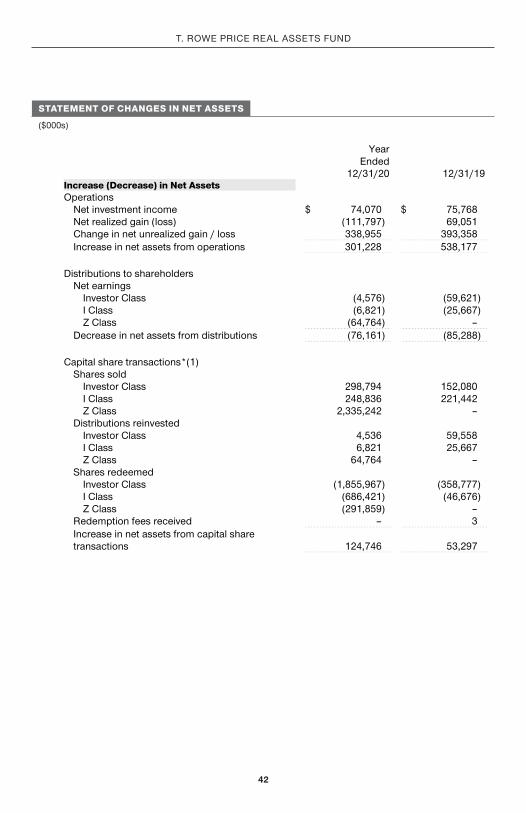
Net investment income $ 74,070 $ 75,768 Net realized gain (loss) (111,797) 69,051 Change in net unrealized gain / loss 338,955 393,358
Increase in net assets from operations 301,228 538,177
Distributions to shareholders Net earnings Investor Class (4,576) (59,621) I Class (6,821) (25,667) Z Class (64,764) –
Decrease in net assets from distributions (76,161) (85,288)
Capital share transactions*(1) Shares sold Investor Class 298,794 152,080 I Class 248,836 221,442 Z Class 2,335,242 – Distributions reinvested Investor Class 4,536 59,558 I Class 6,821 25,667 Z Class 64,764 – Shares redeemed Investor Class (1,855,967) (358,777) I Class (686,421) (46,676) Z Class (291,859) – Redemption fees received – 3
Increase in net assets from capital share transactions 124,746 53,297

arraf_1220_P3Proof #
43
T. ROWE PRICE REAl AssETs Fund
($000s)
The accompanying notes are an integral part of these financial statements.
STATEMENT OF CHANGES IN NET ASSETS
YearEnded
12/31/20 12/31/19Net Assets Increase during period 349,813 506,186 Beginning of period 3,266,799 2,760,613 En d o f p e r i o d $ 3 , 6 1 6 , 6 1 2 $ 3 , 2 6 6 , 7 9 9
*Share information (1) Shares sold Investor Class 30,899 13,531 I Class 23,262 19,869 Z Class 256,302 – Distributions reinvested Investor Class 369 5,188 I Class 557 2,238 Z Class 5,283 – Shares redeemed Investor Class (201,921) (32,025) I Class (74,602) (4,180) Z Class (26,124) –
Increase in shares outstanding 14,025 4,621
(1)Includes the exchange of shares from certain classes to the I Class and/or Z Class related to shares held by affiliated products.

arraf_1220_P3Proof #
44
T. ROWE PRICE REAl AssETs Fund
NOTES TO FINANCIAL STATEMENTS
T. Rowe Price Real Assets Fund, Inc. (the fund) is registered under the Investment Company Act of 1940 (the 1940 Act) as a diversified, open-end management investment company. The fund seeks to provide long-term growth of capital. The fund has three classes of shares: the Real Assets Fund (Investor Class), the Real Assets Fund–I Class (I Class), and the Real Assets Fund–Z Class (Z Class). I Class shares require a $1 million initial investment minimum, although the minimum generally is waived for retirement plans, financial intermediaries, and certain other accounts. The Z Class is only available to funds advised by T. Rowe Price Associates, Inc. and its affiliates and other clients that are subject to a contractual fee for investment management services. Each class has exclusive voting rights on matters related solely to that class; separate voting rights on matters that relate to all classes; and, in all other respects, the same rights and obligations as the other classes.
NOTE 1 - SIGNIFICANT ACCOUNTING POLICIES
Basis of Preparation The fund is an investment company and follows accounting and reporting guidance in the Financial Accounting Standards Board (FASB) Accounting Standards Codification Topic 946 (ASC 946). The accompanying financial statements were prepared in accordance with accounting principles generally accepted in the United States of America (GAAP), including, but not limited to, ASC 946. GAAP requires the use of estimates made by management. Management believes that estimates and valuations are appropriate; however, actual results may differ from those estimates, and the valuations reflected in the accompanying financial statements may differ from the value ultimately realized upon sale or maturity.
Investment Transactions, Investment Income, and Distributions Investment transactions are accounted for on the trade date basis. Income and expenses are recorded on the accrual basis. Realized gains and losses are reported on the identified cost basis. Premiums and discounts on debt securities are amortized for financial reporting purposes. Income tax-related interest and penalties, if incurred, are recorded as income tax expense. Dividends received from mutual fund investments are reflected as dividend income; capital gain distributions are reflected as realized gain/loss. Dividend income and capital gain distributions are recorded on the ex-dividend date. Distributions from REITs are initially recorded as dividend income and, to the extent such represent a return of capital or capital gain for tax purposes, are reclassified when such information becomes available. Non-cash dividends, if any, are recorded at the fair market value of the asset received. Distributions to shareholders are recorded on the ex-dividend date. Income distributions, if any, are declared and paid by each class annually. A capital gain distribution may also be declared and paid by the fund annually.

arraf_1220_P3Proof #
45
T. ROWE PRICE REAl AssETs Fund
Currency Translation Assets, including investments, and liabilities denominated in foreign currencies are translated into U.S. dollar values each day at the prevailing exchange rate, using the mean of the bid and asked prices of such currencies against U.S. dollars as quoted by a major bank. Purchases and sales of securities, income, and expenses are translated into U.S. dollars at the prevailing exchange rate on the respective date of such transaction. The effect of changes in foreign currency exchange rates on realized and unrealized security gains and losses is not bifurcated from the portion attributable to changes in market prices.
Class Accounting Shareholder servicing, prospectus, and shareholder report expenses incurred by each class are charged directly to the class to which they relate. Expenses common to all classes, investment income, and realized and unrealized gains and losses are allocated to the classes based upon the relative daily net assets of each class.
Redemption Fees Prior to April 1, 2019, a 2% fee was assessed on redemptions of fund shares held for 90 days or less to deter short-term trading and to protect the interests of long-term shareholders. Redemption fees were withheld from proceeds that shareholders received from the sale or exchange of fund shares. The fees were paid to the fund and were recorded as an increase to paid-in capital. The fees may have caused the redemption price per share to differ from the net asset value per share.
Capital Transactions Each investor’s interest in the net assets of the fund is represented by fund shares. The fund’s net asset value (NAV) per share is computed at the close of the New York Stock Exchange (NYSE), normally 4 p.m. ET, each day the NYSE is open for business. However, the NAV per share may be calculated at a time other than the normal close of the NYSE if trading on the NYSE is restricted, if the NYSE closes earlier, or as may be permitted by the SEC. Purchases and redemptions of fund shares are transacted at the next-computed NAV per share, after receipt of the transaction order by T. Rowe Price Associates, Inc., or its agents.
New Accounting Guidance In March 2020, the FASB issued Accounting Standards Update (ASU), ASU 2020-04, Reference Rate Reform (Topic 848) – Facilitation of the Effects of Reference Rate Reform on Financial Reporting, which provides optional, temporary relief with respect to the financial reporting of contracts subject to certain types of modifications due to the planned discontinuation of the London Interbank Offered Rate (LIBOR) and other interbank-offered based reference rates as of the end of 2021. The guidance is effective for certain reference rate-related contract modifications that occur during the period March 12, 2020 through December 31, 2022. Management expects that the adoption of the guidance will not have a material impact on the fund’s financial statements.

arraf_1220_P3Proof #
46
T. ROWE PRICE REAl AssETs Fund
Indemnification In the normal course of business, the fund may provide indemnification in connection with its officers and directors, service providers, and/or private company investments. The fund’s maximum exposure under these arrangements is unknown; however, the risk of material loss is currently considered to be remote.
NOTE 2 - VALUATION
Fair Value The fund’s financial instruments are valued at the close of the NYSE and are reported at fair value, which GAAP defines as the price that would be received to sell an asset or paid to transfer a liability in an orderly transaction between market participants at the measurement date. The T. Rowe Price Valuation Committee (the Valuation Committee) is an internal committee that has been delegated certain responsibilities by the fund’s Board of Directors (the Board) to ensure that financial instruments are appropriately priced at fair value in accordance with GAAP and the 1940 Act. Subject to oversight by the Board, the Valuation Committee develops and oversees pricing-related policies and procedures and approves all fair value determinations. Specifically, the Valuation Committee establishes policies and procedures used in valuing financial instruments, including those which cannot be valued in accordance with normal procedures or using pricing vendors; determines pricing techniques, sources, and persons eligible to effect fair value pricing actions; evaluates the services and performance of the pricing vendors; oversees the pricing process to ensure policies and procedures are being followed; and provides guidance on internal controls and valuation-related matters. The Valuation Committee provides periodic reporting to the Board on valuation matters.
Various valuation techniques and inputs are used to determine the fair value of financial instruments. GAAP establishes the following fair value hierarchy that categorizes the inputs used to measure fair value:
Level 1 – quoted prices (unadjusted) in active markets for identical financial instruments that the fund can access at the reporting date
Level 2 – inputs other than Level 1 quoted prices that are observable, either directly or indirectly (including, but not limited to, quoted prices for similar financial instruments in active markets, quoted prices for identical or similar financial instruments in inactive markets, interest rates and yield curves, implied volatilities, and credit spreads)
Level 3 – unobservable inputs (including the fund’s own assumptions in determining fair value)
arraf_1220_P3Proof #
47
T. ROWE PRICE REAl AssETs Fund
Observable inputs are developed using market data, such as publicly available information about actual events or transactions, and reflect the assumptions that market participants would use to price the financial instrument. Unobservable inputs are those for which market data are not available and are developed using the best information available about the assumptions that market participants would use to price the financial instrument. GAAP requires valuation techniques to maximize the use of relevant observable inputs and minimize the use of unobservable inputs. When multiple inputs are used to derive fair value, the financial instrument is assigned to the level within the fair value hierarchy based on the lowest-level input that is significant to the fair value of the financial instrument. Input levels are not necessarily an indication of the risk or liquidity associated with financial instruments at that level but rather the degree of judgment used in determining those values.
Valuation Techniques Equity securities, including exchange-traded funds, listed or regularly traded on a securities exchange or in the over-the-counter (OTC) market are valued at the last quoted sale price or, for certain markets, the official closing price at the time the valuations are made. OTC Bulletin Board securities are valued at the mean of the closing bid and asked prices. A security that is listed or traded on more than one exchange is valued at the quotation on the exchange determined to be the primary market for such security. Listed securities not traded on a particular day are valued at the mean of the closing bid and asked prices for domestic securities and the last quoted sale or closing price for international securities.
The last quoted prices of non-U.S. equity securities may be adjusted to reflect the fair value of such securities at the close of the NYSE, if the fund determines that developments between the close of a foreign market and the close of the NYSE will affect the value of some or all of its portfolio securities. Each business day, the fund uses information from outside pricing services to evaluate and, if appropriate, decide whether it is necessary to adjust quoted prices to reflect fair value by reviewing a variety of factors, including developments in foreign markets, the performance of U.S. securities markets, and the performance of instruments trading in U.S. markets that represent foreign securities and baskets of foreign securities. The fund uses outside pricing services to provide it with quoted prices and information to evaluate or adjust those prices. The fund cannot predict how often it will use quoted prices and how often it will determine it necessary to adjust those prices to reflect fair value.
Debt securities generally are traded in the OTC market and are valued at prices furnished by independent pricing services or by broker dealers who make markets in such securities. When valuing securities, the independent pricing services consider the yield or price of bonds of comparable quality, coupon, maturity, and type, as well as prices quoted by dealers who make markets in such securities.
arraf_1220_P3Proof #
48
T. ROWE PRICE REAl AssETs Fund
Investments in mutual funds are valued at the mutual fund’s closing NAV per share on the day of valuation. Listed options, and OTC options with a listed equivalent, are valued at the mean of the closing bid and asked prices and Exchange-traded options on futures contracts are valued at closing settlement prices. Futures contracts are valued at closing settlement prices. Forward currency exchange contracts are valued using the prevailing forward exchange rate. Assets and liabilities other than financial instruments, including short-term receivables and payables, are carried at cost, or estimated realizable value, if less, which approximates fair value.
Investments for which market quotations or market-based valuations are not readily available or deemed unreliable are valued at fair value as determined in good faith by the Valuation Committee, in accordance with fair valuation policies and procedures. The objective of any fair value pricing determination is to arrive at a price that could reasonably be expected from a current sale. Financial instruments fair valued by the Valuation Committee are primarily private placements, restricted securities, warrants, rights, and other securities that are not publicly traded. Factors used in determining fair value vary by type of investment and may include market or investment specific considerations. The Valuation Committee typically will afford greatest weight to actual prices in arm’s length transactions, to the extent they represent orderly transactions between market participants, transaction information can be reliably obtained, and prices are deemed representative of fair value. However, the Valuation Committee may also consider other valuation methods such as market-based valuation multiples; a discount or premium from market value of a similar, freely traded security of the same issuer; discounted cash flows; yield to maturity; or some combination. Fair value determinations are reviewed on a regular basis and updated as information becomes available, including actual purchase and sale transactions of the investment. Because any fair value determination involves a significant amount of judgment, there is a degree of subjectivity inherent in such pricing decisions, and fair value prices determined by the Valuation Committee could differ from those of other market participants.

arraf_1220_P3Proof #
49
T. ROWE PRICE REAl AssETs Fund
Valuation Inputs The following table summarizes the fund’s financial instruments, based on the inputs used to determine their fair values on December 31, 2020 (for further detail by category, please refer to the accompanying Portfolio of Investments):
($000s) Level 1 Level 2 Level 3 Total Value
Assets
Common stocks $ 1,762,787 $ 1,683,464 $ 6,100 $ 3,452,351
Preferred stocks — 7,040 — 7,040
Convertible Preferred stocks — 47,312 4,855 52,167
Equity Mutual Funds 92,551 — — 92,551
short-Term Investments 6,641 7,726 — 14,367
Options Purchased — 2,711 — 2,711
Total securities 1,861,979 1,748,253 10,955 3,621,187
Forward Currency Exchange Contracts — 972 — 972
Futures Contracts* 134 — — 134
Total $ 1,862,113 $ 1,749,225 $ 10,955 $ 3,622,293
* The fair value presented includes cumulative gain (loss) on open futures contracts; however, the net value reflected on the accompanying Portfolio of Investments is only the unsettled variation margin receivable (payable) at that date.
NOTE 3 - DERIVATIVE INSTRUMENTS
During the year ended December 31, 2020, the fund invested in derivative instruments. As defined by GAAP, a derivative is a financial instrument whose value is derived from an underlying security price, foreign exchange rate, interest rate, index of prices or rates, or other variable; it requires little or no initial investment and permits or requires net settlement. The fund invests in derivatives only if the expected risks and rewards are consistent with its investment objectives, policies, and overall risk profile, as described in its prospectus and Statement of Additional Information. The fund may use derivatives for a variety of purposes, such as seeking to hedge against declines in principal value, increase yield, invest in an asset with greater efficiency and at a lower cost than is possible through direct investment, to enhance return, or to adjust credit exposure. The

arraf_1220_P3Proof #
50
T. ROWE PRICE REAl AssETs Fund
risks associated with the use of derivatives are different from, and potentially much greater than, the risks associated with investing directly in the instruments on which the derivatives are based. The fund at all times maintains sufficient cash reserves, liquid assets, or other SEC-permitted asset types to cover its settlement obligations under open derivative contracts.
The fund values its derivatives at fair value and recognizes changes in fair value currently in its results of operations. Accordingly, the fund does not follow hedge accounting, even for derivatives employed as economic hedges. Generally, the fund accounts for its derivatives on a gross basis. It does not offset the fair value of derivative liabilities against the fair value of derivative assets on its financial statements, nor does it offset the fair value of derivative instruments against the right to reclaim or obligation to return collateral.
The following table summarizes the fair value of the fund’s derivative instruments held as of December 31, 2020, and the related location on the accompanying Statement of Assets and Liabilities, presented by primary underlying risk exposure:
($000s) Location on Statement of Assets and Liabilities Fair Value
Assets
Foreign exchange derivatives Forwards $ 972
Equity derivatives securities^, Futures* 2,845
Total $ 3,817
^ Options purchased are reported as securities and are reflected in the accompanying Portfolio of Investments.
* The fair value presented includes cumulative gain (loss) on open futures contracts; however, the value reflected on the accompanying Statement of Assets and Liabilities is only the unsettled variation margin receivable (payable) at that date.

arraf_1220_P3Proof #
51
T. ROWE PRICE REAl AssETs Fund
Additionally, the amount of gains and losses on derivative instruments recognized in fund earnings during the year ended December 31, 2020, and the related location on the accompanying Statement of Operations is summarized in the following table by primary underlying risk exposure:
($000s) Location of Gain (Loss) on Statement of Operations
Securities^ Futures
Forward Currency
Exchange Contracts Swaps Total
Realized Gain (Loss)
Foreign exchange derivatives $ (538) $ – $ 1,377 $ – $ 839
Equity derivatives 75,857 (16,715) – – 59,142
Commodity derivatives – – – (890) (890)
Total $ 75,319 $ (16,715) $ 1,377 $ (890) $ 59,091
Change in Unrealized Gain (Loss)
Foreign exchange derivatives $ 530 $ – $ 1,129 $ – $ 1,659
Equity derivatives (293) 141 – – (152)
Total $ 237 $ 141 $ 1,129 $ – $ 1,507
^ Options purchased are reported as securities and are reflected in the accompanying Portfolio of Investments.
Counterparty Risk and Collateral The fund invests in derivatives in various markets, which expose it to differing levels of counterparty risk. Counterparty risk on exchange-traded and centrally cleared derivative contracts, such as futures, exchange-traded options, and centrally cleared swaps, is minimal because the clearinghouse provides protection against counterparty defaults. For futures and centrally cleared swaps, the fund is required to deposit collateral in an amount specified by the clearinghouse and the clearing firm (margin requirement), and the margin requirement must be maintained over the life of the contract. Each clearinghouse and clearing firm, in its sole discretion, may adjust the margin requirements applicable to the fund.

arraf_1220_P3Proof #
52
T. ROWE PRICE REAl AssETs Fund
Derivatives, such as bilateral swaps, forward currency exchange contracts, and OTC options, that are transacted and settle directly with a counterparty (bilateral derivatives) may expose the fund to greater counterparty risk. To mitigate this risk, the fund has entered into master netting arrangements (MNAs) with certain counterparties that permit net settlement under specified conditions and, for certain counterparties, also require the exchange of collateral to cover mark-to-market exposure. MNAs may be in the form of International Swaps and Derivatives Association master agreements (ISDAs) or foreign exchange letter agreements (FX letters).
MNAs provide the ability to offset amounts the fund owes a counterparty against amounts the counterparty owes the fund (net settlement). Both ISDAs and FX letters generally allow termination of transactions and net settlement upon the occurrence of contractually specified events, such as failure to pay or bankruptcy. In addition, ISDAs specify other events, the occurrence of which would allow one of the parties to terminate. For example, a downgrade in credit rating of a counterparty below a specified rating would allow the fund to terminate, while a decline in the fund’s net assets of more than a specified percentage would allow the counterparty to terminate. Upon termination, all transactions with that counterparty would be liquidated and a net termination amount settled. ISDAs include collateral agreements whereas FX letters do not. Collateral requirements are determined daily based on the net aggregate unrealized gain or loss on all bilateral derivatives with a counterparty, subject to minimum transfer amounts that typically range from $100,000 to $250,000. Any additional collateral required due to changes in security values is typically transferred the next business day.
Collateral may be in the form of cash or debt securities issued by the U.S. government or related agencies. Cash posted by the fund is reflected as cash deposits in the accompanying financial statements and generally is restricted from withdrawal by the fund; securities posted by the fund are so noted in the accompanying Portfolio of Investments; both remain in the fund’s assets. Collateral pledged by counterparties is not included in the fund’s assets because the fund does not obtain effective control over those assets. For bilateral derivatives, collateral posted or received by the fund is held in a segregated account at the fund’s custodian. While typically not sold in the same manner as equity or fixed income securities, exchange-traded or centrally cleared derivatives may be closed out only on the exchange or clearinghouse where the contracts were traded, and OTC and bilateral derivatives may be unwound with counterparties or transactions assigned to other counterparties to allow the fund to exit the transaction. This ability is subject to the liquidity of underlying positions. As of December 31, 2020, no collateral had been pledged or posted by the fund to counterparties for bilateral derivatives. As of December 31, 2020, collateral pledged by counterparties to the fund for bilateral derivatives consisted of $3,280,000 cash. As of December 31, 2020, securities valued at $437,000 had been posted by the fund for exchange-traded and/or centrally cleared derivatives.

arraf_1220_P3Proof #
53
T. ROWE PRICE REAl AssETs Fund
Forward Currency Exchange Contracts The fund is subject to foreign currency exchange rate risk in the normal course of pursuing its investment objectives. It uses forward currency exchange contracts (forwards) primarily to protect its non-U.S. dollar-denominated securities from adverse currency movements. A forward involves an obligation to purchase or sell a fixed amount of a specific currency on a future date at a price set at the time of the contract. Although certain forwards may be settled by exchanging only the net gain or loss on the contract, most forwards are settled with the exchange of the underlying currencies in accordance with the specified terms. Forwards are valued at the unrealized gain or loss on the contract, which reflects the net amount the fund either is entitled to receive or obligated to deliver, as measured by the difference between the forward exchange rates at the date of entry into the contract and the forward rates at the reporting date. Appreciated forwards are reflected as assets and depreciated forwards are reflected as liabilities on the accompanying Statement of Assets and Liabilities. Risks related to the use of forwards include the possible failure of counterparties to meet the terms of the agreements; that anticipated currency movements will not occur, thereby reducing the fund’s total return; and the potential for losses in excess of the fund’s initial investment. During the year ended December 31, 2020, the volume of the fund’s activity in forwards, based on underlying notional amounts, was generally between 1% and 4% of net assets.
Futures Contracts The fund is subject to equity price risk in the normal course of pursuing its investment objectives and uses futures contracts to help manage such risk. The fund may enter into futures contracts to manage exposure to interest rates, security prices, foreign currencies, and credit quality; as an efficient means of adjusting exposure to all or part of a target market; to enhance income; as a cash management tool; or to adjust credit exposure. A futures contract provides for the future sale by one party and purchase by another of a specified amount of a specific underlying financial instrument at an agreed-upon price, date, time, and place. The fund currently invests only in exchange-traded futures, which generally are standardized as to maturity date, underlying financial instrument, and other contract terms. Payments are made or received by the fund each day to settle daily fluctuations in the value of the contract (variation margin), which reflect changes in the value of the underlying financial instrument. Variation margin is recorded as unrealized gain or loss until the contract is closed. The value of a futures contract included in net assets is the amount of unsettled variation margin; net variation margin receivable is reflected as an asset and net variation margin payable is reflected as a liability on the accompanying Statement of Assets and Liabilities. Risks related to the use of futures contracts include possible illiquidity of the futures markets, contract prices that can be highly volatile and imperfectly correlated to movements in hedged security values and/or interest rates, and potential losses in excess of the fund’s initial investment. During the year ended December 31, 2020, the volume of the fund’s activity in futures, based on underlying notional amounts, was generally between 0% and 4% of net assets.

arraf_1220_P3Proof #
54
T. ROWE PRICE REAl AssETs Fund
Options The fund is subject to foreign currency exchange rate risk and equity price risk in the normal course of pursuing its investment objectives and uses options to help manage such risks. The fund may use options to manage exposure to security prices, interest rates, foreign currencies, and credit quality; as an efficient means of adjusting exposure to all or a part of a target market; to enhance income; as a cash management tool; or to adjust credit exposure. Options are included in net assets at fair value, options purchased are included in Investments in Securities, and Options written are separately reflected as a liability on the accompanying Statement of Assets and Liabilities. Premiums on unexercised, expired options are recorded as realized gains or losses; premiums on exercised options are recorded as an adjustment to the proceeds from the sale or cost of the purchase. The difference between the premium and the amount received or paid in a closing transaction is also treated as realized gain or loss. In return for a premium paid, call and put options give the holder the right, but not the obligation, to purchase or sell, respectively, a security at a specified exercise price. In return for a premium paid, currency options give the holder the right, but not the obligation, to buy and sell currency at a specified exchange rate. In return for a premium paid, call and put index options give the holder the right, but not the obligation, to receive cash equal to the difference between the value of the reference index on the exercise date and the exercise price of the option. Risks related to the use of options include possible illiquidity of the options markets; trading restrictions imposed by an exchange or counterparty; movements in the underlying asset values and currency values and, for options written, potential losses in excess of the fund’s initial investment. During the year ended December 31, 2020, the volume of the fund’s activity in options, based on underlying notional amounts, was generally between 1% and 8% of net assets.
Swaps The fund is subject to commodity price risk in the normal course of pursuing its investment objectives and uses swap contracts to help manage such risk. The fund may use swaps in an effort to manage both long and short exposure to changes in interest rates, inflation rates, and credit quality; to adjust overall exposure to certain markets; to enhance total return or protect the value of portfolio securities; to serve as a cash management tool; or to adjust credit exposure. Swap agreements can be settled either directly with the counterparty (bilateral swap) or through a central clearinghouse (centrally cleared swap). Fluctuations in the fair value of a contract are reflected in unrealized gain or loss and are reclassified to realized gain or loss upon contract termination or cash settlement. Net periodic receipts or payments required by a contract increase or decrease, respectively, the value of the contract until the contractual payment date, at which time such amounts are reclassified from unrealized to realized gain or loss. For bilateral swaps, cash payments are made or received by the fund on a periodic basis in accordance with contract terms; unrealized gain on contracts and premiums paid are

arraf_1220_P3Proof #
55
T. ROWE PRICE REAl AssETs Fund
reflected as assets and unrealized loss on contracts and premiums received are reflected as liabilities on the accompanying Statement of Assets and Liabilities. For bilateral swaps, premiums paid or received are amortized over the life of the swap and are recognized as realized gain or loss in the Statement of Operations. For centrally cleared swaps, payments are made or received by the fund each day to settle the daily fluctuation in the value of the contract (variation margin). Accordingly, the value of a centrally cleared swap included in net assets is the unsettled variation margin; net variation margin receivable is reflected as an asset and net variation margin payable is reflected as a liability on the accompanying Statement of Assets and Liabilities.
Total return swaps are agreements in which one party makes payments based on a set rate, either fixed or variable, while the other party makes payments based on the return of an underlying asset (reference asset), such as an index, equity security, fixed income security or commodity-based exchange-traded fund, which includes both the income it generates and any change in its value. Risks related to the use of total return swaps include the potential for unfavorable changes in the reference asset, the possible failure of a counterparty to perform in accordance with the terms of the swap agreements, potential government regulation that could adversely affect the fund’s swap investments, and potential losses in excess of the fund’s initial investment. During the year ended December 31, 2020, the volume of the fund’s activity in swaps, based on underlying notional amounts, was generally between 0% and 1% of net assets.
NOTE 4 - OTHER INVESTMENT TRANSACTIONS
Consistent with its investment objective, the fund engages in the following practices to manage exposure to certain risks and/or to enhance performance. The investment objective, policies, program, and risk factors of the fund are described more fully in the fund’s prospectus and Statement of Additional Information.
Restricted Securities The fund invests in securities that are subject to legal or contractual restrictions on resale. Prompt sale of such securities at an acceptable price may be difficult and may involve substantial delays and additional costs.
LIBOR The fund may invest in instruments that are tied to reference rates, including LIBOR. On July 27, 2017, the United Kingdom’s Financial Conduct Authority announced a decision to transition away from LIBOR by the end of 2021. There remains uncertainty regarding the future utilization of LIBOR and the nature of any replacement rate. Any potential effects of the transition away from LIBOR on the fund, or on certain instruments in which the fund invests, are not known. The transition process may result in, among other things, an increase in volatility or illiquidity of markets for instruments

arraf_1220_P3Proof #
56
T. ROWE PRICE REAl AssETs Fund
that currently rely on LIBOR, a reduction in the value of certain instruments held by the fund, or a reduction in the effectiveness of related fund transactions such as hedges. Any such effects could have an adverse impact on the fund’s performance.
Other Purchases and sales of portfolio securities other than short-term securities aggregated $1,925,148,000 and $1,592,299,000, respectively, for the year ended December 31, 2020.
NOTE 5 - FEDERAL INCOME TAXES
Generally, no provision for federal income taxes is required since the fund intends to continue to qualify as a regulated investment company under Subchapter M of the Internal Revenue Code and distribute to shareholders all of its taxable income and gains. Distributions determined in accordance with federal income tax regulations may differ in amount or character from net investment income and realized gains for financial reporting purposes.
The fund files U.S. federal, state, and local tax returns as required. The fund’s tax returns are subject to examination by the relevant tax authorities until expiration of the applicable statute of limitations, which is generally three years after the filing of the tax return but which can be extended to six years in certain circumstances. Tax returns for open years have incorporated no uncertain tax positions that require a provision for income taxes.
Financial reporting records are adjusted for permanent book/tax differences to reflect tax character but are not adjusted for temporary differences. The permanent book/tax adjustments have no impact on results of operations or net assets and relate primarily to redemptions in kind and the character of dividends received from real estate investment trusts (REITs). For the year ended December 31, 2020, the following reclassification was recorded:
($000s)
Total distributable earnings (loss) $ (28,964)
Paid-in capital 28,964

arraf_1220_P3Proof #
57
T. ROWE PRICE REAl AssETs Fund
Distributions during the years ended December 31, 2020 and December 31, 2019, totaled $76,161,000 and $85,288,000, respectively, and were characterized as ordinary income for tax purposes. At December 31, 2020, the tax-basis cost of investments, including derivatives, and components of net assets were as follows:
($000s)
Cost of investments $ 2,765,372
unrealized appreciation $ 1,000,587
unrealized depreciation (143,558)
net unrealized appreciation (depreciation) 857,029
undistributed ordinary income 13,283
Capital loss carryforwards (607,750)
REIT income deferrals 3,277
Paid-in capital 3,350,773
net assets $ 3,616,612
The difference between book-basis and tax-basis net unrealized appreciation (depreciation) is attributable to the deferral of losses from wash sales, and the realization of gains/losses on passive foreign investment companies and/or certain open derivative contracts for tax purposes. The fund intends to retain realized gains to the extent of available capital loss carryforwards. Net realized capital losses may be carried forward indefinitely to offset future realized capital gains. Certain dividends declared by real estate investment trusts (REITs) in December and paid the following January are recognized for tax purposes in the subsequent year (REIT income deferrals) but, for financial reporting purposes, are included in the fund’s dividend income on ex-date.
NOTE 6 - RELATED PARTY TRANSACTIONS
The fund is managed by T. Rowe Price Associates, Inc. (Price Associates), a wholly owned subsidiary of T. Rowe Price Group, Inc. (Price Group). Price Associates has entered into a sub-advisory agreement(s) with one or more of its wholly owned subsidiaries, to provide investment advisory services to the fund. The investment management agreement between the fund and Price Associates provides for an annual investment management fee, which is computed daily and paid monthly. The fee consists of an individual fund fee, equal to 0.35% of the fund’s average daily net assets,
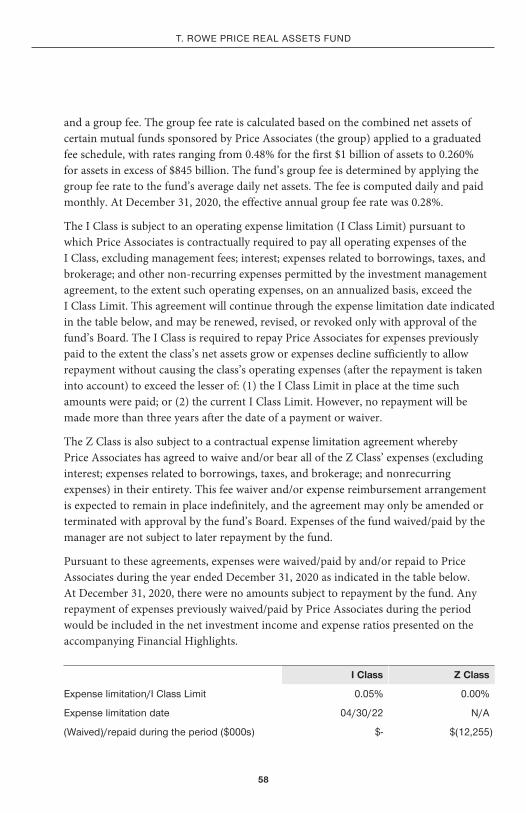
arraf_1220_P3Proof #
58
T. ROWE PRICE REAl AssETs Fund
and a group fee. The group fee rate is calculated based on the combined net assets of certain mutual funds sponsored by Price Associates (the group) applied to a graduated fee schedule, with rates ranging from 0.48% for the first $1 billion of assets to 0.260% for assets in excess of $845 billion. The fund’s group fee is determined by applying the group fee rate to the fund’s average daily net assets. The fee is computed daily and paid monthly. At December 31, 2020, the effective annual group fee rate was 0.28%.
The I Class is subject to an operating expense limitation (I Class Limit) pursuant to which Price Associates is contractually required to pay all operating expenses of the I Class, excluding management fees; interest; expenses related to borrowings, taxes, and brokerage; and other non-recurring expenses permitted by the investment management agreement, to the extent such operating expenses, on an annualized basis, exceed the I Class Limit. This agreement will continue through the expense limitation date indicated in the table below, and may be renewed, revised, or revoked only with approval of the fund’s Board. The I Class is required to repay Price Associates for expenses previously paid to the extent the class’s net assets grow or expenses decline sufficiently to allow repayment without causing the class’s operating expenses (after the repayment is taken into account) to exceed the lesser of: (1) the I Class Limit in place at the time such amounts were paid; or (2) the current I Class Limit. However, no repayment will be made more than three years after the date of a payment or waiver.
The Z Class is also subject to a contractual expense limitation agreement whereby Price Associates has agreed to waive and/or bear all of the Z Class’ expenses (excluding interest; expenses related to borrowings, taxes, and brokerage; and nonrecurring expenses) in their entirety. This fee waiver and/or expense reimbursement arrangement is expected to remain in place indefinitely, and the agreement may only be amended or terminated with approval by the fund’s Board. Expenses of the fund waived/paid by the manager are not subject to later repayment by the fund.
Pursuant to these agreements, expenses were waived/paid by and/or repaid to Price Associates during the year ended December 31, 2020 as indicated in the table below. At December 31, 2020, there were no amounts subject to repayment by the fund. Any repayment of expenses previously waived/paid by Price Associates during the period would be included in the net investment income and expense ratios presented on the accompanying Financial Highlights.
I Class Z Class
Expense limitation/I Class limit 0.05% 0.00%
Expense limitation date 04/30/22 n/A
(Waived)/repaid during the period ($000s) $- $(12,255)

arraf_1220_P3Proof #
59
T. ROWE PRICE REAl AssETs Fund
In addition, the fund has entered into service agreements with Price Associates and two wholly owned subsidiaries of Price Associates, each an affiliate of the fund (collectively, Price). Price Associates provides certain accounting and administrative services to the fund. T. Rowe Price Services, Inc. provides shareholder and administrative services in its capacity as the fund’s transfer and dividend-disbursing agent. T. Rowe Price Retirement Plan Services, Inc. provides subaccounting and recordkeeping services for certain retirement accounts invested in the Investor Class. For the year ended December 31, 2020, expenses incurred pursuant to these service agreements were $68,000 for Price Associates; $263,000 for T. Rowe Price Services, Inc.; and $1,000 for T. Rowe Price Retirement Plan Services, Inc. All amounts due to and due from Price, exclusive of investment management fees payable, are presented net on the accompanying Statement of Assets and Liabilities.
Additionally, the fund is one of several mutual funds in which certain college savings plans managed by Price Associates may invest. As approved by the fund’s Board of Directors, shareholder servicing costs associated with each college savings plan are borne by the fund in proportion to the average daily value of its shares owned by the college savings plan. For the year ended December 31, 2020, the fund was charged $335,000 for shareholder servicing costs related to the college savings plans, of which $246,000 was for services provided by Price. All amounts due to and due from Price, exclusive of investment management fees payable, are presented net on the accompanying Statement of Assets and Liabilities. At December 31, 2020, approximately 29% and 34% of the outstanding shares of the Investor Class and I Class, respectively, were held by college savings plans.
The fund is also one of several mutual funds sponsored by Price Associates (underlying Price Funds) in which the T. Rowe Price Spectrum Funds (Spectrum Funds) and T. Rowe Price Retirement Funds (Retirement Funds) may invest. None of the Spectrum Funds or Retirement Funds invest in the underlying Price Funds for the purpose of exercising management or control. Pursuant to special servicing agreements, expenses associated with the operation of the Spectrum Funds and Retirement Funds are borne by each underlying Price Fund to the extent of estimated savings to it and in proportion to the average daily value of its shares owned by the Spectrum Funds and Retirement Funds. This special servicing agreement between the fund and the Retirement Funds terminated on April 7, 2020. Expenses allocated under these special servicing agreements are reflected as shareholder servicing expense in the accompanying financial statements. For the year ended December 31, 2020, the fund was allocated $64,000 of Spectrum Funds’ expenses and $688,000 of Retirement Funds’ expenses. Of these amounts, $281,000 related to services provided by Price. All amounts due to and due
arraf_1220_P3Proof #
60
T. ROWE PRICE REAl AssETs Fund
from Price, exclusive of investment management fees payable, are presented net on the accompanying Statement of Assets and Liabilities. At December 31, 2020, approximately 26% of the outstanding shares of the Investor Class were held by the Spectrum Funds.
In addition, other mutual funds, trusts, and other accounts managed by Price Associates or its affiliates (collectively, Price Funds and accounts) may invest in the fund and are not subject to the special servicing agreements disclosed above. No Price fund or account may invest for the purpose of exercising management or control over the fund. At December 31, 2020, approximately 55% of the I Class’s and 100% of the Z Class’s outstanding shares were held by Price Funds and accounts.
The fund may invest its cash reserves in certain open-end management investment companies managed by Price Associates and considered affiliates of the fund: the T. Rowe Price Government Reserve Fund or the T. Rowe Price Treasury Reserve Fund, organized as money market funds, or the T. Rowe Price Short-Term Fund, a short-term bond fund (collectively, the Price Reserve Funds). The Price Reserve Funds are offered as short-term investment options to mutual funds, trusts, and other accounts managed by Price Associates or its affiliates and are not available for direct purchase by members of the public. Cash collateral from securities lending is invested in the T. Rowe Price Short-Term Fund. The Price Reserve Funds pay no investment management fees.
The fund may participate in securities purchase and sale transactions with other funds or accounts advised by Price Associates (cross trades), in accordance with procedures adopted by the fund’s Board and Securities and Exchange Commission rules, which require, among other things, that such purchase and sale cross trades be effected at the independent current market price of the security. During the year ended December 31, 2020, the fund had no purchases or sales cross trades with other funds or accounts advised by Price Associates.
Effective January 1, 2020, Price Associates has voluntarily agreed to reimburse the fund from its own resources on a monthly basis for the cost of investment research embedded in the cost of the fund’s securities trades. This agreement may be rescinded at any time. For the year ended December 31, 2020, this reimbursement amounted to $151,000, which is included in Net realized gain (loss) on Securities in the Statement of Operations.

arraf_1220_P3Proof #
61
T. ROWE PRICE REAl AssETs Fund
NOTE 7 - OTHER MATTERS
Unpredictable events such as environmental or natural disasters, war, terrorism, pandemics, outbreaks of infectious diseases, and similar public health threats may significantly affect the economy and the markets and issuers in which a fund invests. Certain events may cause instability across global markets, including reduced liquidity and disruptions in trading markets, while some events may affect certain geographic regions, countries, sectors, and industries more significantly than others, and exacerbate other pre-existing political, social, and economic risks. During 2020, a novel strain of coronavirus (COVID-19) resulted in disruptions to global business activity and caused significant volatility and declines in global financial markets.
These types of events, such as the global pandemic caused by COVID-19, may also cause widespread fear and uncertainty, and result in, among other things: enhanced health screenings, quarantines, cancellations, and travel restrictions, including border closings; disruptions to business operations, supply chains and customer activity; exchange trading suspensions and closures, and overall reduced liquidity of securities, derivatives, and commodities trading markets; reductions in consumer demand and economic output; and significant challenges in healthcare service preparation and delivery. The fund could be negatively impacted if the value of a portfolio holding were harmed by such political or economic conditions or events. In addition, the operations of the fund, its investment advisers, and the fund’s service providers may be significantly impacted, or even temporarily halted, as a result of any impairment to their information technology and other operational systems, extensive employee illnesses or unavailability, government quarantine measures, and restrictions on travel or meetings and other factors related to public emergencies.
Governmental and quasi-governmental authorities and regulators have in the past responded to major economic disruptions with a variety of significant fiscal and monetary policy changes, including but not limited to, direct capital infusions into companies, new monetary programs, and dramatically lower interest rates. An unexpected or quick reversal of these policies, or the ineffectiveness of these policies, could negatively impact overall investor sentiment and further increase volatility in securities markets. The impact of this outbreak has adversely affected the economies of many nations and the entire global economy and may impact individual issuers and capital markets in ways that cannot be foreseen. Other infectious illness outbreaks that may arise in the future could have similar or other unforeseen effects. The duration of this outbreak or others and their effects cannot be determined with certainty.
arraf_1220_P3Proof #
62
T. ROWE PRICE REAl AssETs Fund
To the Board of Directors and Shareholders of T. Rowe Price Real Assets Fund, Inc.
Opinion on the Financial StatementsWe have audited the accompanying statement of assets and liabilities, including the portfolio of investments, of T. Rowe Price Real Assets Fund, Inc. (the “Fund”) as of December 31, 2020, the related statement of operations for the year ended December 31, 2020, the statement of changes in net assets for each of the two years in the period ended December 31, 2020, including the related notes, and the financial highlights for each of the periods indicated therein (collectively referred to as the “financial statements”). In our opinion, the financial statements present fairly, in all material respects, the financial position of the Fund as of December 31, 2020, the results of its operations for the year then ended, the changes in its net assets for each of the two years in the period ended December 31, 2020 and the financial highlights for each of the periods indicated therein, in conformity with accounting principles generally accepted in the United States of America.
Basis for OpinionThese financial statements are the responsibility of the Fund’s management. Our responsibility is to express an opinion on the Fund’s financial statements based on our audits. We are a public accounting firm registered with the Public Company Accounting Oversight Board (United States) (PCAOB) and are required to be independent with respect to the Fund in accordance with the U.S. federal securities laws and the applicable rules and regulations of the Securities and Exchange Commission and the PCAOB.
We conducted our audits of these financial statements in accordance with the standards of the PCAOB. Those standards require that we plan and perform the audit to obtain reasonable assurance about whether the financial statements are free of material misstatement, whether due to error or fraud.
REPORT OF INDEPENDENT REGISTERED PUBLIC ACCOUNTING FIRM
arraf_1220_P3Proof #
63
T. ROWE PRICE REAl AssETs Fund
REPORT OF INDEPENDENT REGISTERED PUBLIC ACCOUNTING FIRM (CONTINUED)
Our audits included performing procedures to assess the risks of material misstatement of the financial statements, whether due to error or fraud, and performing procedures that respond to those risks. Such procedures included examining, on a test basis, evidence regarding the amounts and disclosures in the financial statements. Our audits also included evaluating the accounting principles used and significant estimates made by management, as well as evaluating the overall presentation of the financial statements. Our procedures included confirmation of securities owned as of December 31, 2020 by correspondence with the custodians, transfer agent and brokers; when replies were not received from brokers, we performed other auditing procedures. We believe that our audits provide a reasonable basis for our opinion.
PricewaterhouseCoopers LLP Baltimore, Maryland February 19, 2021
We have served as the auditor of one or more investment companies in the T. Rowe Price group of investment companies since 1973.
arraf_1220_P3Proof #
64
T. ROWE PRICE REAl AssETs Fund
TAX INFORMATION (UNAUDITED) FOR THE TAX YEAR ENDED 12/31/20We are providing this information as required by the Internal Revenue Code. The amounts shown may differ from those elsewhere in this report because of differences between tax and financial reporting requirements.
The fund’s distributions to shareholders included $8,180,000 from short-term capital gains.
For taxable non-corporate shareholders, $56,465,000 of the fund’s income represents qualified dividend income subject to a long-term capital gains tax rate of not greater than 20%.
For corporate shareholders, $15,135,000 of the fund’s income qualifies for the dividends-received deduction.
For individuals and certain trusts and estates which are entitled to claim a deduction of up to 20% of their combined qualified real estate investment trust (REIT) dividends, $20,137,000 of the fund’s income qualifies as qualified real estate investment trust (REIT) dividends.
INFORMATION ON PROXY VOTING POLICIES, PROCEDURES, AND RECORDS
A description of the policies and procedures used by T. Rowe Price funds and portfolios to determine how to vote proxies relating to portfolio securities is available in each fund’s Statement of Additional Information. You may request this document by calling 1-800-225-5132 or by accessing the SEC’s website, sec.gov.
The description of our proxy voting policies and procedures is also available on our corporate website. To access it, please visit the following Web page:
https://www.troweprice.com/corporate/en/utility/policies.html
Scroll down to the section near the bottom of the page that says, “Proxy Voting Policies.” Click on the Proxy Voting Policies link in the shaded box.
Each fund’s most recent annual proxy voting record is available on our website and through the SEC’s website. To access it through T. Rowe Price, visit the website location shown above, and scroll down to the section near the bottom of the page that says, “Proxy Voting Records.” Click on the Proxy Voting Records link in the shaded box.
HOW TO OBTAIN QUARTERLY PORTFOLIO HOLDINGSEffective for reporting periods on or after March 1, 2019, a fund, except a money market fund, files a complete schedule of portfolio holdings with the Securities and Exchange Commission (SEC) for the first and third quarters of each fiscal year as an exhibit to its reports on Form N-PORT. Prior to March 1, 2019, a fund, including a money market fund, filed a complete schedule of portfolio holdings with the SEC for the first and third quarters of each fiscal year on Form N-Q. A money market fund files detailed month-end portfolio holdings information on Form N-MFP with the SEC each month and posts a complete schedule of portfolio holdings on its website (troweprice.com) as of each month-end for the previous six months. A fund’s Forms N-PORT, N-MFP, and N-Q are available electronically on the SEC’s website (sec.gov).

arraf_1220_P3Proof #
65
T. ROWE PRICE REAl AssETs Fund
ABOUT THE FUND’S DIRECTORS AND OFFICERS
Your fund is overseen by a Board of directors (Board) that meets regularly to review a wide variety of matters affecting or potentially affecting the fund, including performance, investment programs, compliance matters, advisory fees and expenses, service providers, and business and regulatory affairs. The Board elects the fund’s officers, who are listed in the final table. At least 75% of the Board’s members are considered to be independent, i.e., not “interested persons” as defined in section 2(a)(19) of the 1940 Act, of the Boards of T. Rowe Price Associates, Inc. (T. Rowe Price), and its affiliates; “interested” directors and officers are employees of T. Rowe Price. The business address of each director and officer is 100 East Pratt street, Baltimore, Maryland 21202. The statement of Additional Information includes additional information about the fund directors and is available without charge by calling a T. Rowe Price representative at 1-800-638-5660.
INDEPENDENT DIRECTORS(a)
Name(Year of Birth)Year Elected[Number of T. Rowe PricePortfolios Overseen]
Principal Occupation(s) and Directorships of Public Companies and Other Investment Companies During the Past Five Years
Teresa Bryce Bazemore(1959)2018[190]
President, Radian Guaranty (2008 to 2017); Chief Executive Officer, Bazemore Consulting llC (2018 to present); director, Chimera Investment Corporation (2017 to present); director, First Industrial Realty Trust (2020 to present); director, Federal Home loan Bank of Pittsburgh (2017 to 2019)
Ronald J. daniels(1959)2018[190]
President, The Johns Hopkins university(b) and Professor, Political science department, The Johns Hopkins university (2009 to present); director, lyndhurst Holdings (2015 to present); director, BridgeBio Pharma, Inc. (2020 to present)
Bruce W. duncan(1951)2013[190]
President, Chief Executive Officer, and director, CyrusOne, Inc. (2020 to present); Chief Executive Officer and director (2009 to 2016), Chairman of the Board (2016 to 2020), and President (2009 to 2016), First Industrial Realty Trust, owner and operator of industrial properties; Chairman of the Board (2005 to 2016) and director (1999 to 2016), starwood Hotels & Resorts, a hotel and leisure company; Member, Investment Company Institute Board of Governors (2017 to 2019); Member, Independent directors Council Governing Board (2017 to 2019); senior Advisor, KKR (2018 to present); director, Boston Properties (2016 to present); director, Marriott International, Inc. (2016 to 2020)
Robert J. Gerrard, Jr.(1952)2012[190]
Advisory Board Member, Pipeline Crisis/Winning strategies, a collaborative working to improve opportunities for young African Americans (1997 to 2016); Chairman of the Board, all funds (since July 2018)
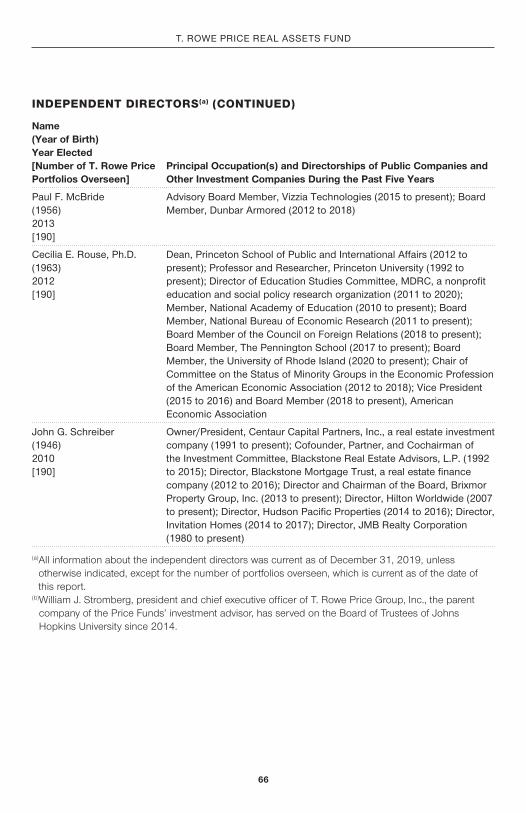
arraf_1220_P3Proof #
66
T. ROWE PRICE REAl AssETs Fund
Name(Year of Birth)Year Elected[Number of T. Rowe PricePortfolios Overseen]
Principal Occupation(s) and Directorships of Public Companies and Other Investment Companies During the Past Five Years
Paul F. McBride(1956)2013[190]
Advisory Board Member, Vizzia Technologies (2015 to present); Board Member, dunbar Armored (2012 to 2018)
Cecilia E. Rouse, Ph.d.(1963)2012[190]
dean, Princeton school of Public and International Affairs (2012 to present); Professor and Researcher, Princeton university (1992 to present); director of Education studies Committee, MdRC, a nonprofit education and social policy research organization (2011 to 2020); Member, national Academy of Education (2010 to present); Board Member, national Bureau of Economic Research (2011 to present); Board Member of the Council on Foreign Relations (2018 to present); Board Member, The Pennington school (2017 to present); Board Member, the university of Rhode Island (2020 to present); Chair of Committee on the status of Minority Groups in the Economic Profession of the American Economic Association (2012 to 2018); Vice President (2015 to 2016) and Board Member (2018 to present), American Economic Association
John G. schreiber(1946)2010[190]
Owner/President, Centaur Capital Partners, Inc., a real estate investment company (1991 to present); Cofounder, Partner, and Cochairman of the Investment Committee, Blackstone Real Estate Advisors, l.P. (1992 to 2015); director, Blackstone Mortgage Trust, a real estate finance company (2012 to 2016); director and Chairman of the Board, Brixmor Property Group, Inc. (2013 to present); director, Hilton Worldwide (2007 to present); director, Hudson Pacific Properties (2014 to 2016); director, Invitation Homes (2014 to 2017); director, JMB Realty Corporation (1980 to present)
(a) All information about the independent directors was current as of December 31, 2019, unless otherwise indicated, except for the number of portfolios overseen, which is current as of the date of this report.
(b) William J. Stromberg, president and chief executive officer of T. Rowe Price Group, Inc., the parent company of the Price Funds’ investment advisor, has served on the Board of Trustees of Johns Hopkins University since 2014.
INDEPENDENT DIRECTORS(a) (CONTINUED)
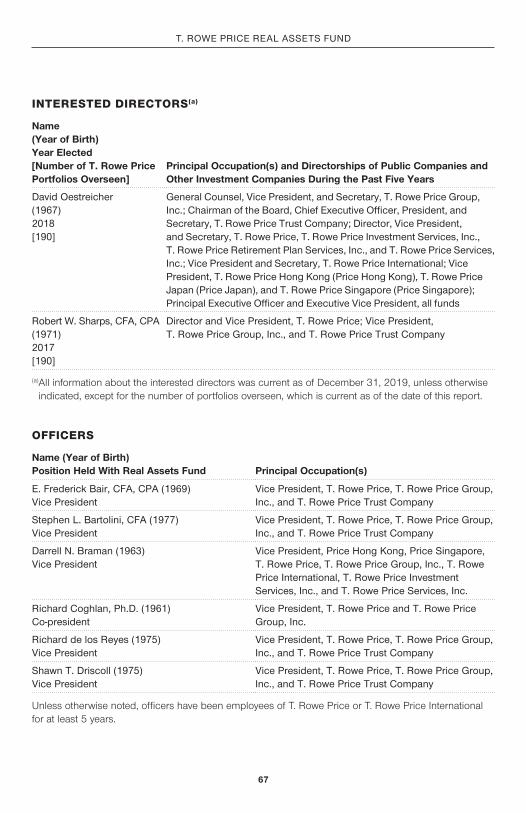
arraf_1220_P3Proof #
67
T. ROWE PRICE REAl AssETs Fund
INTERESTED DIRECTORS(a)
Name(Year of Birth)Year Elected[Number of T. Rowe Price Portfolios Overseen]
Principal Occupation(s) and Directorships of Public Companies and Other Investment Companies During the Past Five Years
david Oestreicher(1967)2018[190]
General Counsel, Vice President, and secretary, T. Rowe Price Group, Inc.; Chairman of the Board, Chief Executive Officer, President, and secretary, T. Rowe Price Trust Company; director, Vice President, and secretary, T. Rowe Price, T. Rowe Price Investment services, Inc., T. Rowe Price Retirement Plan services, Inc., and T. Rowe Price services, Inc.; Vice President and secretary, T. Rowe Price International; Vice President, T. Rowe Price Hong Kong (Price Hong Kong), T. Rowe Price Japan (Price Japan), and T. Rowe Price singapore (Price singapore); Principal Executive Officer and Executive Vice President, all funds
Robert W. sharps, CFA, CPA(1971)2017[190]
director and Vice President, T. Rowe Price; Vice President, T. Rowe Price Group, Inc., and T. Rowe Price Trust Company
(a) All information about the interested directors was current as of December 31, 2019, unless otherwise indicated, except for the number of portfolios overseen, which is current as of the date of this report.
OFFICERS
Name (Year of Birth)Position Held With Real Assets Fund Principal Occupation(s)
E. Frederick Bair, CFA, CPA (1969)Vice President
Vice President, T. Rowe Price, T. Rowe Price Group, Inc., and T. Rowe Price Trust Company
stephen l. Bartolini, CFA (1977)Vice President
Vice President, T. Rowe Price, T. Rowe Price Group, Inc., and T. Rowe Price Trust Company
darrell n. Braman (1963)Vice President
Vice President, Price Hong Kong, Price singapore, T. Rowe Price, T. Rowe Price Group, Inc., T. Rowe Price International, T. Rowe Price Investment services, Inc., and T. Rowe Price services, Inc.
Richard Coghlan, Ph.d. (1961)Co-president
Vice President, T. Rowe Price and T. Rowe Price Group, Inc.
Richard de los Reyes (1975)Vice President
Vice President, T. Rowe Price, T. Rowe Price Group, Inc., and T. Rowe Price Trust Company
shawn T. driscoll (1975)Vice President
Vice President, T. Rowe Price, T. Rowe Price Group, Inc., and T. Rowe Price Trust Company
Unless otherwise noted, officers have been employees of T. Rowe Price or T. Rowe Price International for at least 5 years.

arraf_1220_P3Proof #
68
T. ROWE PRICE REAl AssETs Fund
Name (Year of Birth)Position Held With Real Assets Fund Principal Occupation(s)
Alan s. dupski, CPA (1982)Principal Financial Officer, Vice President, and Treasurer
Vice President, T. Rowe Price, T. Rowe Price Group, Inc., and T. Rowe Price Trust Company
Christopher Faulkner-Macdonagh, Ph.d. (1969)Co-president
Vice President, T. Rowe Price, T. Rowe Price Group, Inc., and T. Rowe Price Trust Company
John R. Gilner (1961)Chief Compliance Officer
Chief Compliance Officer and Vice President, T. Rowe Price; Vice President, T. Rowe Price Group, Inc., and T. Rowe Price Investment services, Inc.
Gary J. Greb (1961)Vice President
Vice President, T. Rowe Price, T. Rowe Price International, and T. Rowe Price Trust Company
Matthew A. Howell, IMC (1974)Vice President
Vice President, T. Rowe Price Group, Inc., and T. Rowe Price International
nina P. Jones, CPA (1980)Vice President
Vice President, T. Rowe Price and T. Rowe Price Group, Inc.
Paul J. Krug, CPA (1964)Vice President
Vice President, T. Rowe Price, T. Rowe Price Group, Inc., and T. Rowe Price Trust Company
sébastien Page (1977)Vice President
Vice President, T. Rowe Price and T. Rowe Price Group, Inc.
Robert A. Panariello (1983) Vice President
Vice President, T. Rowe Price and T. Rowe Price Group, Inc.
Fran M. Pollack-Matz (1961)Vice President and secretary
Vice President, T. Rowe Price and T. Rowe Price Group, Inc.
shannon H. Rauser (1987)Assistant secretary
Assistant Vice President, T. Rowe Price
Charles M. shriver, CFA (1967)Vice President
Vice President, T. Rowe Price, T. Rowe Price Group, Inc., T. Rowe Price International, and T. Rowe Price Trust Company
Megan Warren (1968)Vice President
Vice President, T. Rowe Price, T. Rowe Price Group, Inc., T. Rowe Price Retirement Plan services, Inc., T. Rowe Price services, Inc., and T. Rowe Price Trust Company; formerly, Executive director, JPMorgan Chase (to 2017)
J. Zachary Wood, CFA (1972) Vice President
Vice President, T. Rowe Price and T. Rowe Price Group, Inc.
Unless otherwise noted, officers have been employees of T. Rowe Price or T. Rowe Price International for at least 5 years.
OFFICERS (CONTINUED)

arraf_1220_P3Proof #
This page intentionally left blank.

arraf_1220_P3Proof #
202102-1446313F176-050 2/21
You have manyinvestment goals.
Explore products and services that can help you achieve them.Whether you want to put away more money for retirement, for a child’s education, or for other priorities, we have solutions for you. See how we can help you accomplish the investment goals that are important to you.
RETIREMENTn IRAs: Traditional, Roth,
Rollover/Transfer, or Brokerage
n Small Business Plans help minimize taxes, maximize savings
n T. Rowe Price® ActivePlus Portfolios1 for online investing powered by experts
GENERAL INVESTINGn Individual or Joint
Tenantn Brokerage2 offers
access to stocks, ETFs, bonds, and more
n Gifts and transfers to a child (UGMA/UTMAs)
n Trustn Transfer on Death
COLLEGE SAVINGSn T. Rowe Price-managed
529 plans offer tax-advantaged solutions for families saving money for college tuition and education-related expenses
Visit troweprice.com/broadrange
Call 1-800-225-5132 to request a prospectus or summary prospectus; each includes investment objectives, risks, fees, expenses, and other information that you should read and consider carefully before investing.
All mutual funds are subject to market risk, including possible loss of principal. Investing internationally involves special risks including economic and political uncertainty and currency fluctuation.
1 The T. Rowe Price® ActivePlus Portfolios is a discretionary investment management program provided by T. Rowe Price Advisory Services, Inc., a registered investment adviser under the Investment Advisers Act of 1940. Brokerage services are provided by T. Rowe Price Investment Services, Inc., member FINRA/SIPC. Brokerage accounts are carried by Pershing LLC, a BNY Mellon Company, member NYSE/FINRA/SIPC. T. Rowe Price Advisory Services, Inc., and T. Rowe Price Investment Services, Inc., are affiliated companies.
2 Brokerage services are provided by T. Rowe Price Investment Services, Inc., member FINRA/SIPC. Brokerage accounts are carried by Pershing LLC, a BNY Mellon Company, member NYSE/FINRA/SIPC.
T. Rowe Price Investment Services, Inc. | 100 East Pratt Street | Baltimore, MD 21202-1009